Bilateral FDI Flows A Comparative Analysis of the ...
55
© Author(s) 2013. Licensed under the Creative Commons License - Attribution 3.0 Vol. 7, 2013-1 | January 22, 2013 | http://dx.doi.org/10.5018/economics-ejournal.ja.2013-1 What Drives FDI from Non-traditional Sources? A Comparative Analysis of the Determinants of Bilateral FDI Flows Maximiliano Sosa Andrés, Peter Nunnenkamp, and Matthias Busse Abstract Non-traditional source countries of FDI play an increasingly important role, notably in developing host countries. This raises the question of whether the location choices differ systematically between traditional and non-traditional source countries. We perform Logit and Poisson Pseudo Maximum Likelihood estimations to assess the determinants of bilateral FDI flows. We find that economic geography variables are more relevant for FDI from non- traditional sources. The risk aversion of non-traditional investors is not consistently weaker than that of traditional investors. Resource abundance and superior technology in the host countries represent minor pull factors of FDI from non-traditional sources. JEL F21 Keywords FDI flows; types of FDI; source-host country pairs; location choices; gravity- type models Authors Maximiliano Sosa Andrés, Towers Watson, Montevideo Peter Nunnenkamp, Kiel Institute for the World Economy, peter.nunnenkamp@ifw- kiel.de Matthias Busse, University of Bochum Citation Maximiliano Sosa Andrés, Peter Nunnenkamp, and Matthias Busse (2013). What Drives FDI from Non-traditional Sources? A Comparative Analysis of the Determinants of Bilateral FDI Flows. Economics: The Open-Access, Open-Assessment E-Journal, Vol. 7, 2013-1. http://dx.doi.org/10.5018/economics-ejournal.ja.2013-1
Transcript of Bilateral FDI Flows A Comparative Analysis of the ...
© Author(s) 2013. Licensed under the Creative Commons License - Attribution 3.0
Vol. 7, 2013-1 | January 22, 2013 | http://dx.doi.org/10.5018/economics-ejournal.ja.2013-1
What Drives FDI from Non-traditional Sources?A Comparative Analysis of the Determinants ofBilateral FDI Flows
Maximiliano Sosa Andrés, Peter Nunnenkamp, and MatthiasBusse
AbstractNon-traditional source countries of FDI play an increasingly important role, notably indeveloping host countries. This raises the question of whether the location choices differsystematically between traditional and non-traditional source countries. We perform Logitand Poisson Pseudo Maximum Likelihood estimations to assess the determinants of bilateralFDI flows. We find that economic geography variables are more relevant for FDI from non-traditional sources. The risk aversion of non-traditional investors is not consistently weakerthan that of traditional investors. Resource abundance and superior technology in the hostcountries represent minor pull factors of FDI from non-traditional sources.
JEL F21Keywords FDI flows; types of FDI; source-host country pairs; location choices; gravity-type models
AuthorsMaximiliano Sosa Andrés, Towers Watson, MontevideoPeter Nunnenkamp, Kiel Institute for the World Economy, [email protected] Busse, University of Bochum
Citation Maximiliano Sosa Andrés, Peter Nunnenkamp, and Matthias Busse (2013). What Drives FDI fromNon-traditional Sources? A Comparative Analysis of the Determinants of Bilateral FDI Flows. Economics: TheOpen-Access, Open-Assessment E-Journal, Vol. 7, 2013-1. http://dx.doi.org/10.5018/economics-ejournal.ja.2013-1
www.economics-ejournal.org 1
1 Introduction
Multinational enterprises (MNEs) based outside the OECD have attracted a lot of interest recently. According to Santiso (2007), “the entire global corporate chessboard is changing rapidly” as new MNEs are emerging in various Asian and Latin American countries. The Economist (2008) reckons that “a new breed” of MNEs challenges the more traditional ones based in Europe, Japan and North America. A study by Boston Consulting Group (2006) outlines different strategies used by MNEs from emerging economies to expand sales and production internationally.
The share of emerging economies in outward FDI stocks from all sources was about 17.5 percent in 2010 (UNCTAD 2011: annex table I.2).1 In most recent years (2009–2010), more than 28 percent of overall FDI outflows originated from emerging economies.2 This suggests that non-traditional sources become increasingly important, even though the most developed source countries may regain some ground after overcoming the financial crisis.
Their growing importance invites the question of whether foreign direct investors based in emerging economies behave differently from traditional investors based in developed countries. Surprisingly, this question has received little attention in the previous empirical literature on the determinants of FDI.3 In particular, hardly any evidence exists on whether the location choices of foreign investors based in emerging economies are affected by other pull factors than the location choices of traditional investors based in developed countries.
_________________________ 1 In the following, we use the terms “emerging economies” as source countries of non-traditional FDI, and “developed countries” as sources of traditional FDI. Emerging economies are broadly defined and include all developing and transition countries listed in UNCTAD statistics, unless we refer to the specific group of 11 emerging economies included in our sample of source countries used for the empirical estimations (see Section 3 for details). 2 Aykut and Ratha (2003) find that more than one-third of FDI flows to developing countries originated from emerging economies in the 1990s already. 3 Herzer (2011) focuses on the effects of outward FDI on total factor productivity (TFP) in non-traditional source countries. It is shown that developing countries benefit from outward FDI in terms of higher TFP. At the same time, Herzer finds that firms based in developing countries with higher TFP self-select into outward FDI. However, Herzer does not use dyadic FDI data so that location choices remain unaddressed in his analysis.
www.economics-ejournal.org 2
In striking contrast to the large literature on FDI from traditional sources, few econometric investigations exist on the determinants of FDI from non-traditional sources.4 Recent empirical investigations of Chinese FDI provide notable exceptions (Buckley et al. 2007; Cheung et al. 2012).5 We are aware of just two comparative studies on FDI from non-traditional sources. Pradhan (2011) compares Chinese and Indian outward FDI. In contrast, our focus is on comparing non-traditional sources of FDI with traditional sources. Gao (2005) is closer to our approach, finding that FDI from five emerging economies in East and Southeast Asia exhibits some distinctive features, compared to FDI from developed OECD countries.6 However, Gao’s (2005) analysis is restricted to cross-sectional OLS and Tobit estimations with the sum of FDI flows over four years, 1994–1997, as the dependent variable.
It is the major aim of our contribution to help close this gap by comparing the determinants of location choices between outward FDI from emerging economies and outward FDI from developed countries. In particular, we employ gravity-type models to assess whether neighboring markets represent a more important pull factor of FDI from non-traditional sources; whether economic instability and political risk in the host countries hinder FDI from emerging economies less than FDI from developed countries; whether labor costs and access to natural resources are driving FDI from both traditional and non-traditional sources; and whether a considerable part of FDI from emerging economies is directed to more advanced host countries where superior technology could be accessed.
We estimate Logit and Poisson Pseudo Maximum Likelihood models, drawing on bilateral FDI flow data from UNCTAD’s Data Extract Service.7 Importantly, the dataset covers various emerging economies as sources of FDI outflows. At the _________________________ 4 For recent overviews on FDI from traditional sources, see Chakrabarti (2001) and Blonigen (2005). 5 However, FDI from this source is peculiar in various respects, e.g., because of the prominence of state-owned enterprises as foreign direct investors. Moreover, it is only since 2003 that China has published data on outward FDI in line with international (IMF/OECD) standards (Cheung et al. 2012). Buckley et al. (2007) use approvals rather than realized FDI outflows. 6 FDI from emerging Asia is less encouraged by higher per-capita GDP of host countries, but more discouraged by larger distance to the host country. 7 Specific data requests may be addressed to the FDI Data Extract Service Desk of UNCTAD. The service is fee-based; for details see: http://archive.unctad.org/Templates/Page.asp?intItemID=3206 (accessed: May 2012).
www.economics-ejournal.org 3
same time, the dataset covers essentially all countries as hosts of FDI. This allows us to consider bilateral FDI flows as our dependent variable, with more than 3,000 pairs of 29 source countries and 110 host countries. In this way, we pay heed to Wells’ (2009: 40) warning that “it remains important to go beyond country studies to look for general patterns.” Before describing the dataset in more detail in Section 3, we summarize the analytical background of our empirical analysis and the relevant literature in Section 2. Section 4 presents the estimation results. We find that economic geography variables are more relevant for FDI from emerging economies. The risk aversion of non-traditional investors is not consistently weaker than that of traditional investors. Resource abundance and superior technology in the host countries represent minor pull factors of FDI from non-traditional sources. Section 5 concludes.
2 Previous Literature and Hypotheses
In the light of recent claims according to which new MNEs are reshaping the “entire global corporate chessboard” (Santiso 2007), it may be surprising that a first wave of new MNEs from non-traditional sources was spotted in the late 1970s and early 1980s already (e.g., Lall 1983; Wells 1983).8 Yet no consensus has emerged from the previous literature on whether and how relatively new MNEs based in emerging economies differ from more traditional MNEs (Ramamurti 2009a). Some authors, including Aykut and Ratha (2003: 172), claim that the rise in South-South FDI flows is due to similar factors as the surge in North-South FDI flows. However, the factors considered are often broadly defined (e.g., the search of MNEs for higher risk-adjusted returns through diversification), and the relative importance of different factors is left open to debate (see also UNCTAD 2006). Dunning et al. (1998; 2008) posit that new MNEs from at least some emerging economies such as Korea and Taiwan are becoming increasingly similar to traditional MNEs from developed countries. By contrast, Rugman (2009: 53) doubts that many MNEs from emerging economies are “truly internationalized” and sees “few signs of developing any proprietary FSAs [firm-specific
_________________________ 8 See Hernández (2008) for an annotated bibliography on outward FDI from emerging economies.
www.economics-ejournal.org 4
advantages].” These contrasting views are typically based on descriptive information for a limited and unrepresentative set of MNEs.
Large parts of the existing literature concentrate on the push factors of FDI, i.e., the characteristics of the firms and those of the countries where the MNEs are based. Dunning’s eclectic theory of FDI (e.g., Dunning 2001) and the related concept of the investment development path (Dunning 1981) provide the most widely used analytical background.9 This literature is also relevant in the present context of host-country pull factors of FDI. If only indirectly, the discussion of the so-called ownership (or: proprietary) advantages of MNEs allows for inferences with regard to their location choices, and how these choices may differ between traditional and non-traditional MNEs.
The heterogeneous firm model of Helpman et al. (2004) predicts that only the most productive firms engage in FDI to serve foreign markets. In other words, ownership advantages are required to overcome the “liability of foreignness,” i.e., to compensate the disadvantage vis-à-vis local firms of conducting operations abroad (Hymer 1976). Moreover, in the context of FDI from emerging economies, specific ownership advantages are required to compete with MNEs based in more developed countries. The ownership advantages of the latter are commonly attributed to firm-specific “proprietary technology, powerful brands, marketing prowess, and other managerial capabilities” (Ramamurti 2009b: 405). Herzer’s (2011) empirical finding of bi-directional causality between outward FDI and factor productivity supports the view that more productive firms based in developing source countries self-select into outward FDI.
In the earlier literature, the ownership advantages of new MNEs were mainly derived from technological adaptation to the conditions typically prevailing in countries at relatively low levels of economic development. For instance, Lall (1983: 6) argued that MNEs based in emerging economies have advantages vis-à-vis competitors from more developed countries because of “the ability to function better in the environment of other LDCs (governmental, climatic, cultural)”. Newcomers may compete successfully with traditional MNEs “not merely because their processes and products are better adapted to local factor prices, factor quality, and demand conditions, but also because the direction of their innovation can _________________________ 9 Ownership-specific characteristics represent the first building block of the so-called OLI framework (ownership, location, internalization).
www.economics-ejournal.org 5
provide techniques which are efficient at smaller scales than currently used in developed countries.” Likewise, Wells argued that the location choices of newcomers among MNEs followed almost immediately from their peculiar characteristics compared to more traditional MNEs. Technologies and products were “generated from the conditions of the home countries and thus might be especially well suited to the needs of other developing countries” (Wells 1983: 3). Ramamurti (2009b: 409) argues that non-traditional MNEs enjoy an “adversity advantage” as they are able “to function effectively in the difficult conditions of emerging markets, where both the ‘hard’ and ‘soft’ infrastructures were missing.”
Familiarity with local conditions and similarities between source and host countries are difficult to measure in studies covering, as the present one, a large number of bilateral pairs. Against this backdrop, gravity-type empirical models often employ some admittedly crude proxies for similarities within source-host country pairs. Geographical distance represents the best example. The underlying assumption is that the ‘liability of foreignness’ increases with larger distances. Dummy variables for pairs with a common border, a common language or colonial ties are often used as additional proxies. Distance-related factors are perceived to matter most in the early stages of internationalization (e.g., Dunning et al. 1998; UNCTAD 2006: 104 and 117).10 This invites our first hypothesis:
H1: The geographical distance between the source country and the host countries is expected to discourage FDI from non-traditional sources more strongly than FDI from traditional sources. At the same time, FDI from non-traditional sources should be encouraged more strongly by a common border and a common language.
While distance-related proxies are crude but pair-specific, frequently used measures of political uncertainty and economic instability may be too general to
_________________________ 10 It should be noted that this reasoning also implies that earlier engagements by MNEs based in developed countries should be more affected by distance than more recent engagements. We do not explicitly test for a varying impact of distance over time on FDI from traditional or non-traditional sources in this paper. However, we report a robustness test below which provides at least tentative insights on whether the differences in the impact of distance on FDI from different sources also hold in the more recent past.
www.economics-ejournal.org 6
capture the relevant risk perceptions with respect to particular source-host country pairs.11 With this qualification in mind, we formulate our second hypothesis:
H2: FDI from non-traditional source countries should be less discouraged by political uncertainty and economic instability in the host countries than FDI from traditional sources if the familiarity with local conditions renders MNEs based in emerging economies less risk adverse.
Non-traditional MNEs may also enjoy an “adversity advantage” (Ramamurti 2009b: 409) by being used to operate profitably in markets of limited size and purchasing power (UNCTAD 2006: 104). In other words, economies of scale might play a less important role for FDI from non-traditional source countries with relatively small home markets. Smaller host-country markets would then discourage FDI from non-traditional sources by less than FDI from traditional sources. In enterprise surveys, however, host-country markets are typically rated to be a major pull factor driving horizontal FDI from both traditional and non-traditional source countries (e.g., UNCTAD 2006: 158; Chudnovsky and López (2000).12 Newcomers among MNEs are thus likely to resemble more traditional MNEs in that location choices are predominantly market-driven. Our third hypothesis reflects this ambiguity:
H3: The similarity with market conditions at home suggests that the size of host-country markets might have a weaker impact on FDI from non-traditional sources. All the same, market size should have a similarly strong, positive effect if FDI from all sources is predominantly horizontal in nature.
Theoretical ambiguity and measurement problems also prevail with regard to production costs as a driving force of vertical FDI.13 Wells (1983: 76) observed that export-oriented firms sought “lower wages than their home countries offered” already during the first wave of FDI from non-traditional sources. Likewise, Aykut _________________________ 11 Nevertheless, UNCTAD (2006: 104) argues that MNEs based in emerging economies may be better equipped “to handle risks associated with operating in States characterized by weak governance.” See Section 3 for details on the risk measures applied. 12 Horizontal FDI essentially duplicates the parent company’s production at home in the host countries. In UNCTAD’s jargon, this type of FDI is market seeking. See also Herzer (2011) for a more detailed discussion of the motives underlying outward FDI from non-traditional sources. 13 Vertical FDI involves fragmented value chains and provides a means to allocate specific steps of the production process to where the relevant comparative advantages can be utilized. In UNCTAD’s jargon, this type of FDI is efficiency seeking.
www.economics-ejournal.org 7
and Ratha (2003: 168) suspect that some new MNEs have undertaken vertical FDI “following an erosion in their export competitiveness.” Taiwanese FDI in mainland China provides a case in point; production costs have played an important role since the second half of the 1980s because of the appreciation of the New Taiwan Dollar and rising labor costs in Taiwan (Liu and Nunnenkamp 2011). However, survey results indicate that the importance of cost factors and, thus, the prevalence of vertical FDI “varies considerably among developing-country TNCs, especially in terms of their country or region of origin and industry” (UNCTAD 2006: 158-9).
Cross-country studies, including the present one, face serious data constraints in assessing the empirical relevance of production costs for the location choices of MNEs. In particular, unit labor costs are typically lacking for large samples of source and host countries. As noted by Busse et al. (2010), the difference between the average GDP per capita in the source country and the average GDP per capita in the host country is widely used to proxy for relative labor costs and to assess their relevance, notably with respect to vertical FDI undertaken by relatively rich source countries in poorer host countries.14 On the other hand, source-host country pairs with similarly high per-capita incomes would be characterized by high bilateral FDI flows if FDI is driven by similar demand structures in the source and the host country and MNEs engage in overseas production of differentiated goods.15 Nevertheless, we hypothesize:
H4: A higher GDP per capita in the source country, relative to the GDP per capita in the host country, should stimulate bilateral FDI to the extent that MNEs engage in vertical FDI. This hypothesis should principally hold for the location choices of traditional and non-traditional MNEs alike, even though wage costs are higher, on average, in developed source countries than in emerging economies.
The availability of natural resources as a pull factor of FDI has received considerable attention recently. The public perception appears to be that resource abundance is particularly important for the location choices of MNEs based in _________________________ 14 According to the knowledge-capital model of MNEs, skill differences between the labor force in the source and the host countries would be a preferred indicator (Carr et al. 2001). However, the relevant data are missing for many host countries. 15 This argument resembles the so-called Linder hypothesis on the effect of similar demand structures and product differentiation with respect to bilateral trade (Linder 1961); see also the recent theoretical model of Fajgelbaum et al. (2011).
www.economics-ejournal.org 8
emerging economies. Chinese FDI in Africa is widely believed to be driven by the host countries’ endowment of natural resources (e.g., Reisen and Rieländer 2011). However, the prominence of this type of FDI appears to be limited to selected non-traditional source countries and the more recent past. According to UNCTAD (2006: 161), the availability of natural resources is rated to be of “moderate significance” in surveys of MNEs from non-traditional source countries. Ambiguous findings are reported in recent country studies. The evidence is mixed even for Chinese FDI. Cheung et al. (2012) show that the endowment of host countries with natural resources is not significantly related with Chinese FDI in Africa. Buckley et al. (2007) come to a similar conclusion, except for the more recent past. Pradhan (2011: 140) reports opposing results for Chinese and Indian FDI. This leads to the following hypothesis:
H5: The endowment of host countries with natural resources is unlikely to represent a particularly strong attraction for outward FDI from emerging economies.
Finally, the availability of superior technology in economically advanced host countries represents a potential pull factor of FDI. In the literature, this factor has been suspected to induce FDI flows from relatively poor source countries to richer host countries. UNCTAD (2006: 136) reports “a noticeable increase” in so-called asset-augmenting FDI from non-traditional sources in many developed countries.16 While developed countries may be the most obvious target to acquire superior technology, this type of FDI appears to be in conflict with the conventional view that foreign direct investors need to command over some form of ownership advantage. Luo and Tung (2007) present an international “springboard perspective” according to which newcomers among MNEs undertake FDI to compensate for their competitive disadvantages and latecomer disadvantages. It would fit into this framework if the location choices of these MNEs depended on the availability of superior technology in developed countries. In a similar vein, Moon and Roehl (2001: 197) introduce “the idea of imbalance, as opposed to advantage” as the theoretical basis of unconventional FDI flows. Accordingly, the availability of superior technology in developed countries helps
_________________________ 16 Dunning et al. (2008: 168) see signs of a new wave of asset-augmenting FDI from emerging markets in developed host countries. The difficulties of separating vertical from asset-augmenting FDI are discussed in more detail in Section 4 below.
www.economics-ejournal.org 9
MNEs redress an imbalance between advantages and disadvantages in their competitive position.17
Nevertheless, the effect of patent activity in the host country – our proxy of the host country’s technological position – on the location choices of traditional and non-traditional MNEs is theoretically ambiguous. The technological position of the host country is unlikely to induce only FDI from emerging economies. Rather, MNEs based in developed countries are also likely to use FDI as a means to redress imbalances between advantages and disadvantages in their competitive position. FDI from developed countries might even respond more strongly to the availability of superior technology than FDI from emerging economies as long as newcomers among MNEs are hampered by insufficient absorptive capacity to make efficient use of acquired assets. In a similar vein, Herzer (2011) argues that outward investors based in developing countries may benefit less from potential productivity gains due to limited absorptive capacity. Hence, we hypothesize:
H6: FDI by MNEs based in emerging economies is unlikely to react more positively to the availability of superior technologies than FDI by MNEs based in developed countries as long as many MNEs in emerging economies are constrained in absorbing superior technology.
3 Gravity Approach and Data
3.1 Gravity Model
We estimate gravity-type models on the determinants of FDI. Initially applied in the empirical literature on bilateral trade flows, the gravity approach naturally built up into FDI analysis so as to become “the most widely used empirical application of FDI” (Blonigen et al. 2007: 1309). According to Mátyás (1997), a correct specification of a gravity model includes time fixed effects (to account for the effects of business cycles or globalization processes on the analyzed variables over the sample) as well as time-invariant source and host country effects. Egger (2000) demonstrates that such specification allows unraveling time-specific and country-_________________________ 17 In this context, Moon and Roehl (2001) argue that asset-augmenting FDI (seeking assets to support cheaper labor) is conceptually similar to vertical FDI (seeking cheaper labor to support proprietary assets).
www.economics-ejournal.org 10
specific effects, which are motivated by geographical, historical and political contexts, and outperforms the random effects specification. Anderson and van Wincoop (2003) incorporate the concept of “multilateral resistance”, meaning that trade between any two countries depends not only on their bilateral barriers but also on the average barriers of the two countries to all other trading partners. Anderson and van Wincoop (2003) as well as Feenstra (2004) suggest that country-specific fixed effects offer a computationally simple method to account for multilateral resistance terms and give consistent estimates in cross-section gravity models. For panel data specifications and turning specifically to FDI, Bergstrand and Egger (2007) argue on similar lines but include bilateral pair fixed effects so as to control for unobserved time-invariant pair-specific heterogeneity.18
Against this backdrop, we employ two different specifications regarding fixed effects. In our first model we include country and time fixed effects so as to allow for time-invariant bilateral variables, such as distance and cultural ties, to enter our model. This specification assumes that there is no time-invariant pair-specific heterogeneity. Our second specification follows Bergstrand and Egger (2007) and includes time and pair fixed effects. This second model will require some modifications in the gravity equation so as to account for time-variant bilateral variables only.
The basic specification of our gravity model is as follows:
εϕµλφφγγα ijtjitijtiijtjtijtijt YEmergingYXEmergingXfdi ++++++++= 1010log (1)
logfdiijt represents the natural logarithm of bilateral FDI flows from country i to country j at period t. Xjt are a set of control variables for the host country. Yijt are pair-specific characteristics. Emerging is a dummy variable which equals one when the source of FDI is an emerging economy. λt, μi and φj are time, source country and host country dummy variables.
_________________________ 18 Baier and Bergstrand (2007) incorporate country-time effects, assuming that multilateral resistance terms are time varying. Bergstrand and Egger (2007) consider the effects to be “slow moving” so that pair fixed effects should capture “the (most important) cross sectional influence of these terms”.
www.economics-ejournal.org 11
3.2 FDI Data and Stylized Facts
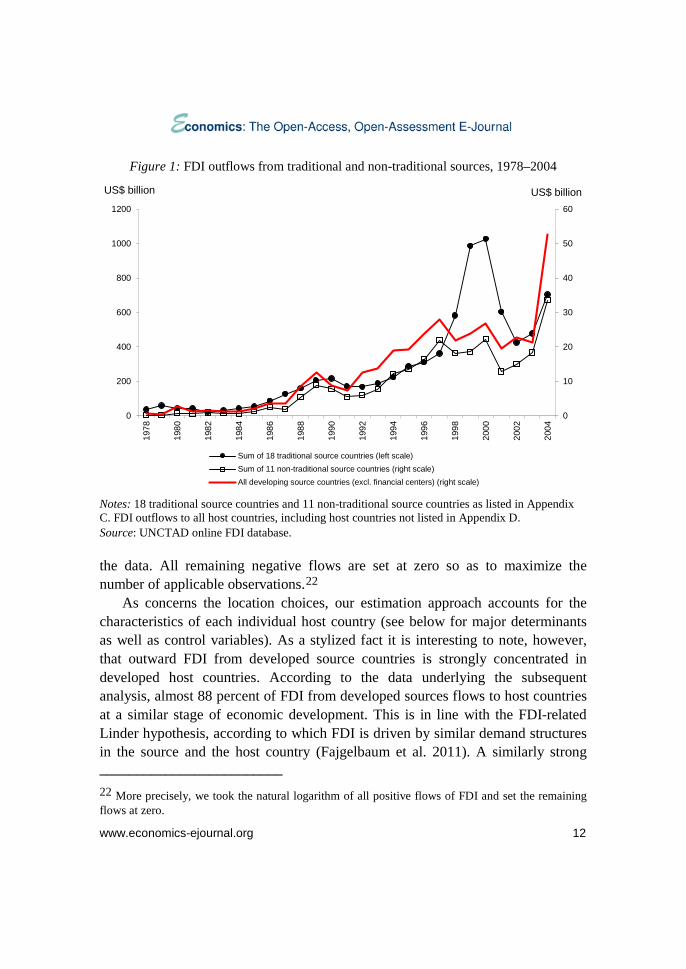
The dataset covers the period from 1978 to 2004.19 Our sample of source countries includes 11 emerging economies and 18 developed countries. The sample includes all countries for which UNCTAD’s Data Extract Service had collected sufficiently long time series. Figure 1 portrays the trends of FDI outflows for the sub-samples of 11 emerging economies and 18 developed countries. Not surprisingly, the former account for only a small fraction of the latter’s FDI outflows during the period of observation (4.2 percent, on average, in 2002–2004, compared to 0.8 percent, on average, in 1978–1980). Importantly, our sub-sample of 11 emerging economies covers the bulk of FDI outflows from all developing countries in the 1978–2004 period.20
The list of (traditional and non-traditional) source countries and the respective periods of FDI data coverage are given in Appendix C. For each of these 29 source countries we cover 110 host countries. The host country sample includes essentially all developing and emerging host countries as well as all developed host countries (listed in Appendix D). The large number of more than 3,000 source-host country pairs allows us to avoid sample selection bias.21 As noted before, the key contribution of our analysis is to assess whether the location choices among the 110 host countries differ between the 11 emerging source countries and the 18 developed source countries. Given the high fluctuation of annual bilateral FDI flows we calculate 3-year averages so as to smooth our dependent variable and, at the same time, ensure that we have enough variation in
_________________________ 19 UNCTAD data on bilateral FDI flows are scarce for earlier years. We choose to start with 1978 to avoid any possible bias arising from small samples. As described in more detail in Section 4 below, we also perform estimations for a shorter period of observation, 1990–2004. 20 Figure 1 also presents FDI outflows from all developing countries, taken from UNCTAD’s aggregate FDI statistics, as a proxy of total FDI outflows from all non-traditional sources. Throughout the period of observation, our sub-sample of 11 emerging economies contributed more than 70 percent to FDI outflows from all developing countries. 21 We exclude offshore financial centers like Panama, the Bahamas or the Cayman Islands. Note that FDI channeled for tax reasons through financial centers to other host countries in our sample cannot be accounted for.
www.economics-ejournal.org 12
Figure 1: FDI outflows from traditional and non-traditional sources, 1978–2004
Notes: 18 traditional source countries and 11 non-traditional source countries as listed in Appendix C. FDI outflows to all host countries, including host countries not listed in Appendix D. Source: UNCTAD online FDI database.
the data. All remaining negative flows are set at zero so as to maximize the number of applicable observations.22
As concerns the location choices, our estimation approach accounts for the characteristics of each individual host country (see below for major determinants as well as control variables). As a stylized fact it is interesting to note, however, that outward FDI from developed source countries is strongly concentrated in developed host countries. According to the data underlying the subsequent analysis, almost 88 percent of FDI from developed sources flows to host countries at a similar stage of economic development. This is in line with the FDI-related Linder hypothesis, according to which FDI is driven by similar demand structures in the source and the host country (Fajgelbaum et al. 2011). A similarly strong _________________________ 22 More precisely, we took the natural logarithm of all positive flows of FDI and set the remaining flows at zero.
0
10
20
30
40
50
60
0
200
400
600
800
1000
1200
1978
1980
1982
1984
1986
1988
1990
1992
1994
1996
1998
2000
2002
2004
Sum of 18 traditional source countries (left scale)Sum of 11 non-traditional source countries (right scale)All developing source countries (excl. financial centers) (right scale)
US$ billion US$ billion
www.economics-ejournal.org 13
concentration of FDI from emerging source countries in host countries at a similar stage of economic development is not present in our data. Nevertheless, host countries with relatively low per-capita incomes clearly play a relatively more important role for FDI from emerging source countries (almost 40 percent of total FDI from these sources) than for FDI from developed source countries (12 percent).
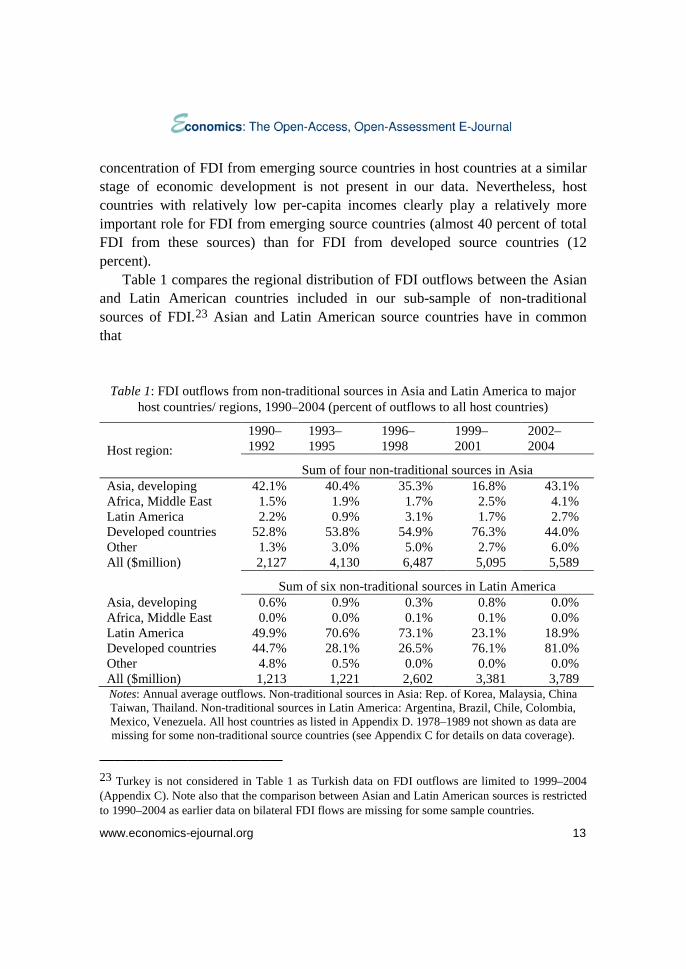
Table 1 compares the regional distribution of FDI outflows between the Asian and Latin American countries included in our sub-sample of non-traditional sources of FDI.23 Asian and Latin American source countries have in common that
Table 1: FDI outflows from non-traditional sources in Asia and Latin America to major host countries/ regions, 1990–2004 (percent of outflows to all host countries)
Host region: 1990–1992
1993–1995
1996–1998
1999–2001
2002–2004
Sum of four non-traditional sources in Asia Asia, developing 42.1% 40.4% 35.3% 16.8% 43.1% Africa, Middle East 1.5% 1.9% 1.7% 2.5% 4.1% Latin America 2.2% 0.9% 3.1% 1.7% 2.7% Developed countries 52.8% 53.8% 54.9% 76.3% 44.0% Other 1.3% 3.0% 5.0% 2.7% 6.0% All ($million) 2,127 4,130 6,487 5,095 5,589
Sum of six non-traditional sources in Latin America Asia, developing 0.6% 0.9% 0.3% 0.8% 0.0% Africa, Middle East 0.0% 0.0% 0.1% 0.1% 0.0% Latin America 49.9% 70.6% 73.1% 23.1% 18.9% Developed countries 44.7% 28.1% 26.5% 76.1% 81.0% Other 4.8% 0.5% 0.0% 0.0% 0.0% All ($million) 1,213 1,221 2,602 3,381 3,789 Notes: Annual average outflows. Non-traditional sources in Asia: Rep. of Korea, Malaysia, China Taiwan, Thailand. Non-traditional sources in Latin America: Argentina, Brazil, Chile, Colombia, Mexico, Venezuela. All host countries as listed in Appendix D. 1978–1989 not shown as data are missing for some non-traditional source countries (see Appendix C for details on data coverage).
_________________________ 23 Turkey is not considered in Table 1 as Turkish data on FDI outflows are limited to 1999–2004 (Appendix C). Note also that the comparison between Asian and Latin American sources is restricted to 1990–2004 as earlier data on bilateral FDI flows are missing for some sample countries.
www.economics-ejournal.org 14
intra-regional FDI outflows figured prominently until the late 1990s. Economic crises dented the growth of outward FDI by Asian countries, and were associated with a shift towards developed host countries – notably in the case of Latin American FDI. Africa and the Middle East played a marginal role as a host region for both Asian and Latin American FDI until recently. It was only at the end of our period of observation that this region attracted a considerable amount of FDI, probably mainly of the resource-seeking type, from Asia.
3.3 Major Determinants
We include a fairly standard group of independent variables, based on the previous literature.24 Importantly, various variables are closely linked to the hypotheses introduced in Section 2. First, we consider a set of gravity-type variables to measure distance between the source and the host country. The distance in kilometers between both countries is calculated as the weighted average of the distances between their main cities (logdistance).25 In addition, three dummy variables are set equal to one if the source and the host country share a common border (contig), a common language (comlang) or colonial ties (colony). All these variables are available from the Centre d'Etudes Prospectives et d'Informations Internationales (CEPII 2011). We expect the effect of distance to be significant and negative for both groups of source countries. However, hypothesis H1 predicts that distance should discourage FDI from emerging economies more strongly than FDI from developed countries. On the other hand, sharing a border, language or colonial ties should affect bilateral FDI flows positively. According to H1, this should apply particularly to FDI from emerging economies.
Several of our independent variables relate to hypothesis H2 which claims that FDI from emerging economies is less discouraged by political uncertainty and _________________________ 24 For detailed definitions of the subsequent variables, data sources and summary statistics, see Appendices A and B. 25 The population of the main cities is used as weights for calculating the average distance. In our pair fixed effects specification, we replace this time-invariant distance measure (and other time-invariant gravity variables) by an alternative distance measure that varies over time. Specifically, we follow Polak (1996) and Warin et al. (2009) and divide logdistance by the population of the host country (see below).
www.economics-ejournal.org 15
economic instability. As for political uncertainty we enter polcon which measures the political constraints of the executive branch, as constructed by Henisz (2000). This variable is expected to have a positive effect on FDI as higher values imply stricter constraints and less political discretion. FDI from emerging countries might be less affected by polcon due to the familiarity with less stable political environments. Inflation is expected to affect FDI negatively as it proxies macroeconomic instability. Again, investors from emerging markets might be less affected because of their familiarity with economic uncertainty.26 In order to assess hypothesis H3 we include the host country’s GDP (loggdphost) and GDP growth (hostgrw). Both market size and growth are widely expected to induce horizontal FDI as they signal the attractiveness of the country for the parent company to set up a production facility to serve the local market. As for H4 we incorporate the difference in GDP per capita between the source and the host country (diffgpdpc).
As concerns H5 we include the depletion of natural resources in percent of gross national income of the host country (resourcedeplet), as available from the World Bank. This variable should have a positive sign if FDI is oriented to countries rich in natural resources where the rate of depletion is high.27 In extended specifications, we also enter the intensity of patenting (patents) in the host countries of FDI. Higher values of patents are supposed to reflect a technologically advanced position of the host country so that this variable allows us to address hypothesis H6.
3.4 Control Variables
We complement the explanatory variables of major interest by various control variables. We introduce several dummy variables on bilateral and regional agreements that may induce higher FDI flows. In particular, we control for
_________________________ 26 As noted in Section 2, the familiarity with local conditions and similarities between source and host countries are difficult to measure in cross-country studies. We perform additional estimations with alternative risk measures to address measurement problems at least tentatively; see below for details. 27 More precisely, the odds or incidence rate ratios of the models introduced below should be significantly above one, though not necessarily for FDI from emerging economies according to H5.

www.economics-ejournal.org 16
bilateral investment treaties (bit), double taxation treaties (dtt) and regional trade agreements (rta) to which source-host country pairs are members. In addition, we take into account that the host country’s openness to trade (hosttrade) may induce vertical FDI.28 Finally, we account for the well-documented effect of agglomeration on FDI.29 Agglomeration is proxied by the total stock of FDI from all sources in the host country (logfdistock). We expect investors from emerging markets to be attracted even more by agglomeration than investors from traditional source countries. FDI in countries with a long reputation of being attractive would be regarded as profitable by latecomers which are, therefore, likely to follow the location choices of their more experienced peers.
3.5 Logit and Poisson Estimators
To test our hypotheses we make use of two different estimators. We start by analyzing the determinants of a country to undertake any FDI at all in another country. For the first stage we rely on a Logit model, where the dependent variable is discrete and set equal to one if a source country invests any positive amount in a host country.
At the second stage our dependent variable is the total amount in US dollars invested by a source country in a host country. Given the fact that bilateral FDI flows are zero for around three quarters of our observations we cannot use Ordinary Least Squares to estimate the model as results would be highly biased. We must use a non-linear model to account for the censored FDI data. As explained by Head and Ries (2008), the problem was originally tackled by Eaton and Tamura (1994) and later Wei (2000) by using a Tobit approach. Subsequently, Santos Silva and Tenreyro (2006) proved that the Tobit approach would yield biased results if the model suffered from heteroskedasticity. The authors suggest using Poisson Pseudo Maximum Likelihood (PML), which they prove to be robust and to yield consistent estimates. An additional advantage of the Poisson PML is that it incorporates the zero values of the dependent variable, as opposed to _________________________ 28 Closed economies are hardly attractive to vertical FDI which involves fragmented production patterns and international trade in intermediates. 29 See, for example, the initial work of Head et al. (1995) and more recently Head and Mayer (2004) or Buch et al. (2005).
www.economics-ejournal.org 17
Tobit.30 Against this backdrop we estimate a fixed effects Poisson PML model in the second stage of our analysis.
As noted before, we are primarily interested to identify the different impact of our independent variables on outward FDI decisions by emerging economies and developed countries. Instead of running separate regressions for the subsample of emerging economies, i.e., the non-traditional sources of FDI, and then comparing the results with some benchmark results for developed countries, we run pooled regressions with all source countries so as to increase the flexibility of testing for statistically significant differences between non-traditional and traditional sources. We test for such differences by introducing a dummy variable for the non-traditional source countries (emerging) and interacting this dummy with all independent variables introduced above.
The coefficients of interaction terms in non-linear models like Logit cannot be directly interpreted. However, as discussed in Gill (2001), it is possible to estimate the model in the odds of a successful outcome, instead of in probabilities. Specifically for our first stage estimation of bilateral FDI flows such specification would imply estimating the odds of a source country choosing to invest in a host country versus the odds of not choosing that host country. Mathematically this can be expressed as:
==
XYPXYP
i
i
|0)(|1)(log (2)
With this transformation the specification of interaction terms becomes straightforward as in linear models and can be estimated with standard numerical procedures like maximum likelihood. According to Gill (2001), if the fitness of the model improves by the introduction of interaction terms then at least part of the true interaction between the variables of the model will be captured by the estimation. Consequently, we specify our model in the log of odds so as to be able to interpret our results directly. We follow the same rationale for the Poisson PML
_________________________ 30 Wooldridge (2002, Chapter 19) details the properties of the Poisson PML for continuous and non-negative independent variables. Importantly, Poisson PML allows for over- and under-dispersion, i.e., the conditional variance of the dependent variable does not have to be equal to the conditional mean (see, e.g., Santos Silva and Tenreyro 2006).
www.economics-ejournal.org 18
model and estimate it in incidence rate ratios, which can be interpreted similarly as odds in Logit models.
4 Results
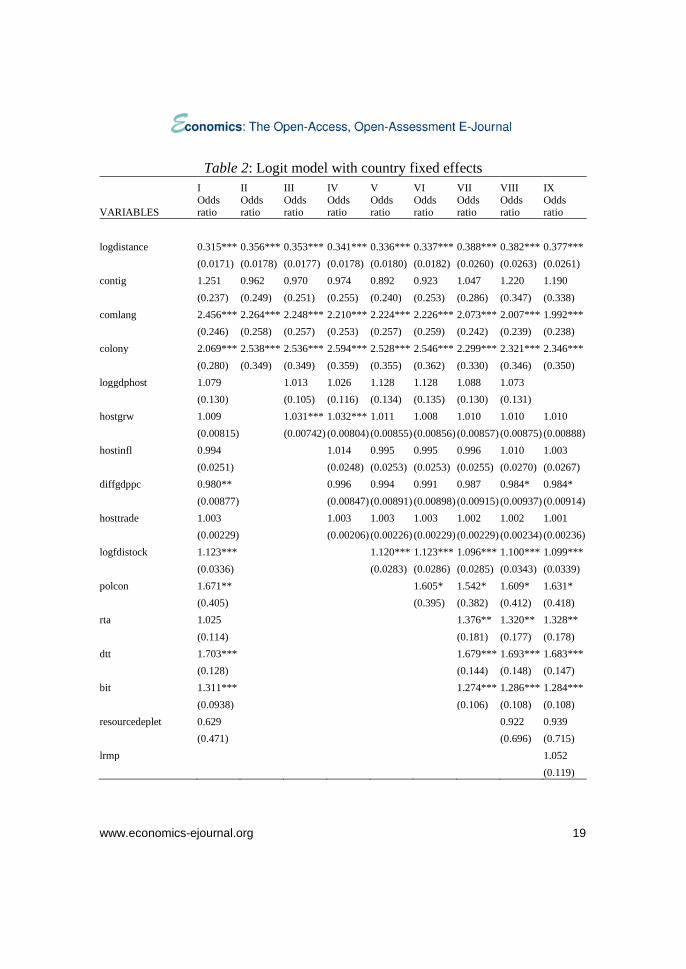
We present our estimation results in several steps. Table 2 summarizes the Logit results in terms of odds ratios in order to assess the decisions of foreign investors on whether or not to engage with FDI in a particular location. Location choices at this gatekeeping stage, as it is often called in the literature on the allocation of foreign aid, imply a binary dependent variable taking the value of one whenever FDI flows from a particular source country to a particular host country (independent of the size of the flow), and zero when there is no bilateral FDI flow in period t. In the next step, we present Poisson Pseudo Maximum Likelihood estimations in terms of exponentiated coefficients, i.e., incidence rate ratios (IRRs) with the log of bilateral FDI flows as the dependent variable (Table 3). Note that odds ratios and IRRs below one reveal a negative impact of the corresponding determinant on bilateral FDI flows, whereas ratios above one reveal a positive impact. It should also be recalled from Section 3 that all Logit and Poisson models in Tables 2 and 3 include time dummies as well as source-country and host-country fixed effects. In this way, we account for time-specific effects on bilateral FDI flows that essentially affect all source-host country pairs as well as unobserved heterogeneity among source and host countries of FDI. We proceed with robustness tests in Section 4.3. Finally, we extend the specification of the basic Poisson model and perform panel estimations with fixed effects for each source-host country pair in Section 4.4.
4.1 Logit Model Results
The Logit estimation shown in column I of Table 2 pools all traditional (developed) and non-traditional (emerging) source countries without attempting to capture varying effects of FDI determinants between the two subgroups. However, we include a dummy variable set equal to one for non-traditional source countries (emerging) which reveals that the odds of engaging with bilateral FDI are
www.economics-ejournal.org 19
Table 2: Logit model with country fixed effects I II III IV V VI VII VIII IX
VARIABLES Odds ratio
Odds ratio
Odds ratio
Odds ratio
Odds ratio
Odds ratio
Odds ratio
Odds ratio
Odds ratio
logdistance 0.315*** 0.356*** 0.353*** 0.341*** 0.336*** 0.337*** 0.388*** 0.382*** 0.377*** (0.0171) (0.0178) (0.0177) (0.0178) (0.0180) (0.0182) (0.0260) (0.0263) (0.0261) contig 1.251 0.962 0.970 0.974 0.892 0.923 1.047 1.220 1.190 (0.237) (0.249) (0.251) (0.255) (0.240) (0.253) (0.286) (0.347) (0.338) comlang 2.456*** 2.264*** 2.248*** 2.210*** 2.224*** 2.226*** 2.073*** 2.007*** 1.992*** (0.246) (0.258) (0.257) (0.253) (0.257) (0.259) (0.242) (0.239) (0.238) colony 2.069*** 2.538*** 2.536*** 2.594*** 2.528*** 2.546*** 2.299*** 2.321*** 2.346*** (0.280) (0.349) (0.349) (0.359) (0.355) (0.362) (0.330) (0.346) (0.350) loggdphost 1.079 1.013 1.026 1.128 1.128 1.088 1.073 (0.130) (0.105) (0.116) (0.134) (0.135) (0.130) (0.131) hostgrw 1.009 1.031*** 1.032*** 1.011 1.008 1.010 1.010 1.010 (0.00815) (0.00742) (0.00804) (0.00855) (0.00856) (0.00857) (0.00875) (0.00888) hostinfl 0.994 1.014 0.995 0.995 0.996 1.010 1.003 (0.0251) (0.0248) (0.0253) (0.0253) (0.0255) (0.0270) (0.0267) diffgdppc 0.980** 0.996 0.994 0.991 0.987 0.984* 0.984* (0.00877) (0.00847) (0.00891) (0.00898) (0.00915) (0.00937) (0.00914) hosttrade 1.003 1.003 1.003 1.003 1.002 1.002 1.001 (0.00229) (0.00206) (0.00226) (0.00229) (0.00229) (0.00234) (0.00236) logfdistock 1.123*** 1.120*** 1.123*** 1.096*** 1.100*** 1.099*** (0.0336) (0.0283) (0.0286) (0.0285) (0.0343) (0.0339) polcon 1.671** 1.605* 1.542* 1.609* 1.631* (0.405) (0.395) (0.382) (0.412) (0.418) rta 1.025 1.376** 1.320** 1.328** (0.114) (0.181) (0.177) (0.178) dtt 1.703*** 1.679*** 1.693*** 1.683*** (0.128) (0.144) (0.148) (0.147) bit 1.311*** 1.274*** 1.286*** 1.284*** (0.0938) (0.106) (0.108) (0.108) resourcedeplet 0.629 0.922 0.939 (0.471) (0.696) (0.715) lrmp 1.052 (0.119)
www.economics-ejournal.org 20
Table 2: continued
I II III IV V VI VII VIII IX
VARIABLES Odds ratio
Odds ratio
Odds ratio
Odds ratio
Odds ratio
Odds ratio
Odds ratio
Odds ratio
Odds ratio
emerging 0.224*** 23.61*** 17.86*** 3.044 4.155 4.042 4.733 3.475 0.750 (0.0677) (21.68) (17.57) (3.362) (4.840) (4.717) (5.895) (4.436) (1.126) emerging_logdistance 0.604*** 0.584*** 0.598*** 0.593*** 0.588*** 0.568*** 0.590*** 0.606*** (0.0604) (0.0600) (0.0622) (0.0640) (0.0638) (0.0693) (0.0739) (0.0760) emerging_contig 1.040 0.998 1.122 1.206 1.134 0.981 0.882 0.943 (0.373) (0.359) (0.410) (0.452) (0.431) (0.376) (0.346) (0.370) emerging_comlang 1.372 1.399 1.646** 1.718** 1.714** 1.586* 1.663** 1.657** (0.307) (0.322) (0.387) (0.412) (0.413) (0.385) (0.411) (0.403) emerging_colony 0.882 0.851 0.823 0.737 0.732 0.847 0.818 0.797 (0.335) (0.327) (0.317) (0.287) (0.286) (0.333) (0.323) (0.315) emerging_loggdphost 1.047 1.172*** 1.089 1.085 1.086 1.078 (0.0343) (0.0531) (0.0703) (0.0706) (0.0724) (0.0756) emerging_hostgrw 1.004 0.982 0.990 0.992 0.991 0.992 0.996 (0.0131) (0.0133) (0.0142) (0.0144) (0.0144) (0.0151) (0.0153) emerging_hostinfl 0.909** 0.924* 0.925* 0.932* 0.929* 0.949 (0.0357) (0.0374) (0.0376) (0.0381) (0.0391) (0.0407) emerging_diffgdppc 1.023*** 1.018** 1.019** 1.021** 1.024** 1.027*** (0.00897) (0.00901) (0.00921) (0.00969) (0.00979) (0.00974) emerging_hosttrade 1.009*** 1.007*** 1.007*** 1.007*** 1.008*** 1.006*** (0.00179) (0.00193) (0.00196) (0.00199) (0.00205) (0.00170) emerging_logfdistock 1.065 1.065 1.077 1.092* 1.109*** (0.0504) (0.0507) (0.0518) (0.0576) (0.0435) emerging_polcon 1.212 1.319 1.029 1.014 (0.411) (0.454) (0.372) (0.366) emerging_rta 0.770 0.787 0.787 (0.206) (0.212) (0.210) emerging_dtt 0.977 0.955 0.960 (0.153) (0.153) (0.151) emerging_bit 1.032 0.982 0.970 (0.166) (0.160) (0.158) emerging_ resourcedeplet 0.111** 0.191* (0.101) (0.177)
www.economics-ejournal.org 21
Table 2: continued
I II III IV V VI VII VIII IX
VARIABLES Odds ratio
Odds ratio
Odds ratio
Odds ratio
Odds ratio
Odds ratio
Odds ratio
Odds ratio
Odds ratio
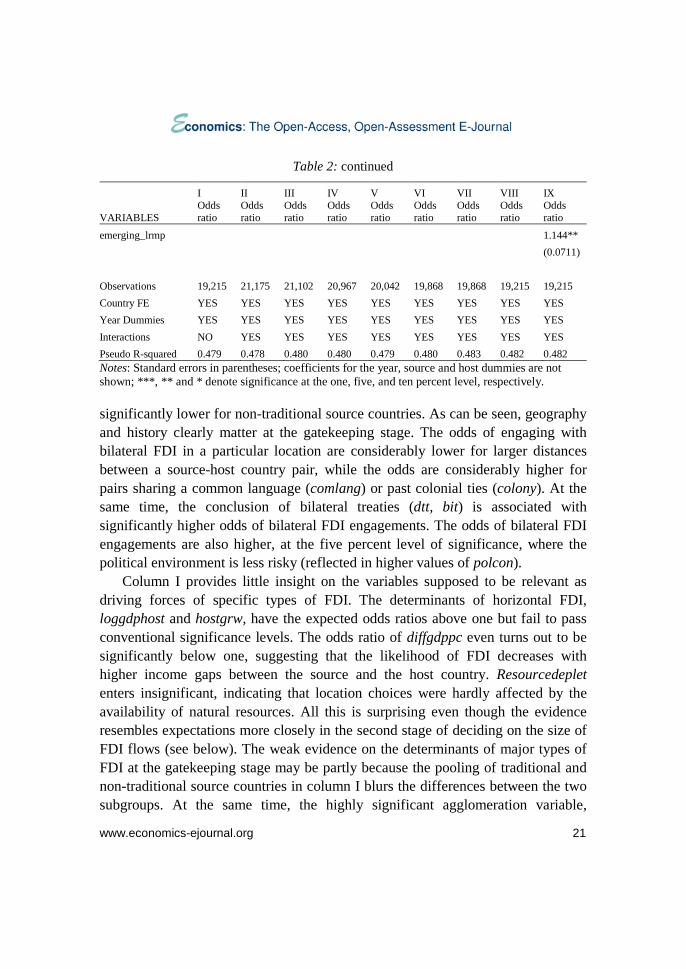
emerging_lrmp 1.144** (0.0711) Observations 19,215 21,175 21,102 20,967 20,042 19,868 19,868 19,215 19,215 Country FE YES YES YES YES YES YES YES YES YES Year Dummies YES YES YES YES YES YES YES YES YES Interactions NO YES YES YES YES YES YES YES YES Pseudo R-squared 0.479 0.478 0.480 0.480 0.479 0.480 0.483 0.482 0.482 Notes: Standard errors in parentheses; coefficients for the year, source and host dummies are not shown; ***, ** and * denote significance at the one, five, and ten percent level, respectively. significantly lower for non-traditional source countries. As can be seen, geography and history clearly matter at the gatekeeping stage. The odds of engaging with bilateral FDI in a particular location are considerably lower for larger distances between a source-host country pair, while the odds are considerably higher for pairs sharing a common language (comlang) or past colonial ties (colony). At the same time, the conclusion of bilateral treaties (dtt, bit) is associated with significantly higher odds of bilateral FDI engagements. The odds of bilateral FDI engagements are also higher, at the five percent level of significance, where the political environment is less risky (reflected in higher values of polcon).
Column I provides little insight on the variables supposed to be relevant as driving forces of specific types of FDI. The determinants of horizontal FDI, loggdphost and hostgrw, have the expected odds ratios above one but fail to pass conventional significance levels. The odds ratio of diffgdppc even turns out to be significantly below one, suggesting that the likelihood of FDI decreases with higher income gaps between the source and the host country. Resourcedeplet enters insignificant, indicating that location choices were hardly affected by the availability of natural resources. All this is surprising even though the evidence resembles expectations more closely in the second stage of deciding on the size of FDI flows (see below). The weak evidence on the determinants of major types of FDI at the gatekeeping stage may be partly because the pooling of traditional and non-traditional source countries in column I blurs the differences between the two subgroups. At the same time, the highly significant agglomeration variable,
www.economics-ejournal.org 22
logfdistock, suggests that FDI generally flows to where high FDI stocks accumulated from all sources in the past point to a particularly attractive location.
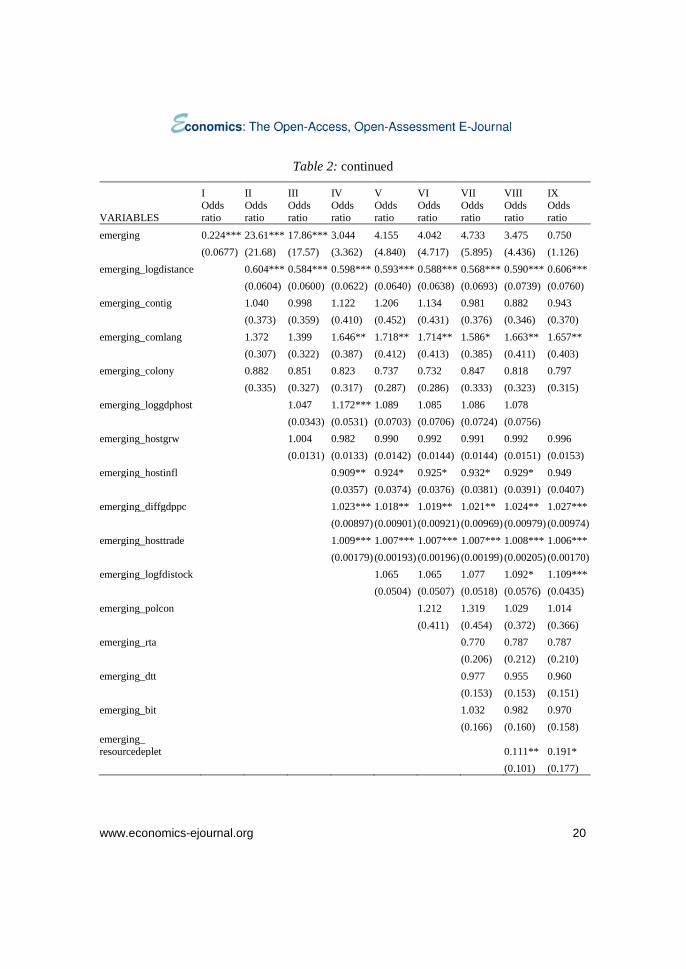
In columns II–IX we successively introduce the determinants of FDI plus the corresponding interaction terms with the dummy for non-traditional source countries (emerging). Some of the hypotheses presented in Section 2 are supported, while some other hypotheses are clearly rejected at the gatekeeping stage of FDI-related location choices. Empirical support is particularly strong for H1 on the effects of geographical distance. This is hardly surprising, recalling from Section 3 that intra-regional FDI figured prominently for the two major sources of non-traditional FDI – Asia and Latin America. The odds ratio of the interaction term emerging_logdistance is consistently below one at the one percent level of significance. This means that the discouraging effect of larger distances between the source and the host country on bilateral FDI flows is significantly stronger for FDI from non-traditional sources.31 The dummy variable for neighboring countries with a common border, contig, and its interaction with emerging does not offer significant information in addition to the distance variable. By contrast, the effect of a common language is significantly stronger for FDI from non-traditional sources in almost all specifications. Probably, this result is mainly driven by FDI flows among Spanish speaking countries in Central and South America (see Table 1 above).
The widely held belief according to which FDI from non-traditional sources is less affected by political uncertainty and economic instability (H2) is not supported in Table 2. The interaction of emerging with political uncertainty, reflected in polcon, proves to be insignificant at conventional levels. Economic instability, proxied by higher inflation (hostinfl), tends to discourage FDI from non-traditional sources, even though the interaction is only weekly significant.
According to the results reported in column IV of Table 2, the odds that host countries with larger local markets attract FDI from non-traditional sources are significantly higher than the benchmark, as revealed by the interaction term emerging_loggdphost.32 This appears to be in conflict with H3. However, this
_________________________ 31 Recall from Section 2 that it cannot be ruled out that distance also had a stronger effect on FDI from developed countries in earlier stages of their internationalization. 32 The same result is shown in column IX of Table 2 where we replace loggdphost by lmrp as the proxy of the size of the relevant host-country market. As argued by Head and Mayer (2004) the
www.economics-ejournal.org 23
effect is highly sensitive to minor changes in the specification of the Logit model. By contrast, the interaction term emerging_diffgdppc is above one whenever included in the specification, at the five percent level or better (H4). This is in line with Wells (1983) and Aykut and Ratha (2003) who stressed the role of cost savings for FDI from non-traditional sources, but it does not hold beyond the gatekeeping stage (see below). The agglomeration effect of already existing FDI stocks from all sources tends to be slightly stronger for bilateral FDI flows from emerging economies; the interaction terms emerging_logfdistock prove to be significant at the ten percent level or better in the fully specified models.
In columns VIII and IX, we also account for the host countries’ endowment of raw materials, which may attract resource-seeking FDI, by introducing resourcedeplet as well as its interaction with the dummy for emerging economies. While this variable per se does not appear to matter for the benchmark at the gatekeeping stage, the corresponding interaction term supports H5 in that resource abundance seems to play a minor role for the location choices of direct investors from emerging economies. The latter result is in line with country-specific studies such as Buckley et al. (2007) and Cheung et al. (2012). However, our analysis shares an important limitation with these studies: due to data constraints we largely miss the recent increase in resource-seeking FDI. This is evident from Table 1 where Africa and the Middle East accounted for marginal shares of outward FDI from non-traditional sources, while the region has emerged as an important destination of resource-seeking FDI since recently. Reportedly, it is primarily China and India who are increasingly engaged in Africa with this type of FDI; but resource-seeking FDI from Latin American sources like Brazil has gained considerable importance, too (Campanario et al. 2012) .
4.2 Poisson Model: Basic Results
Column I of Table 3 resembles the corresponding Logit estimation in several respects. At the second stage of deciding on FDI amounts, too, larger distances between the source and the host country discourage bilateral FDI. A common
_________________________ market potential measure derives from Krugman’s economic geography model (Krugman 1991) and includes demand from multiple locations discounted by distance, while at the same time incorporating the effects of borders as well as an adjustment from competition derived theoretically.
www.economics-ejournal.org 24
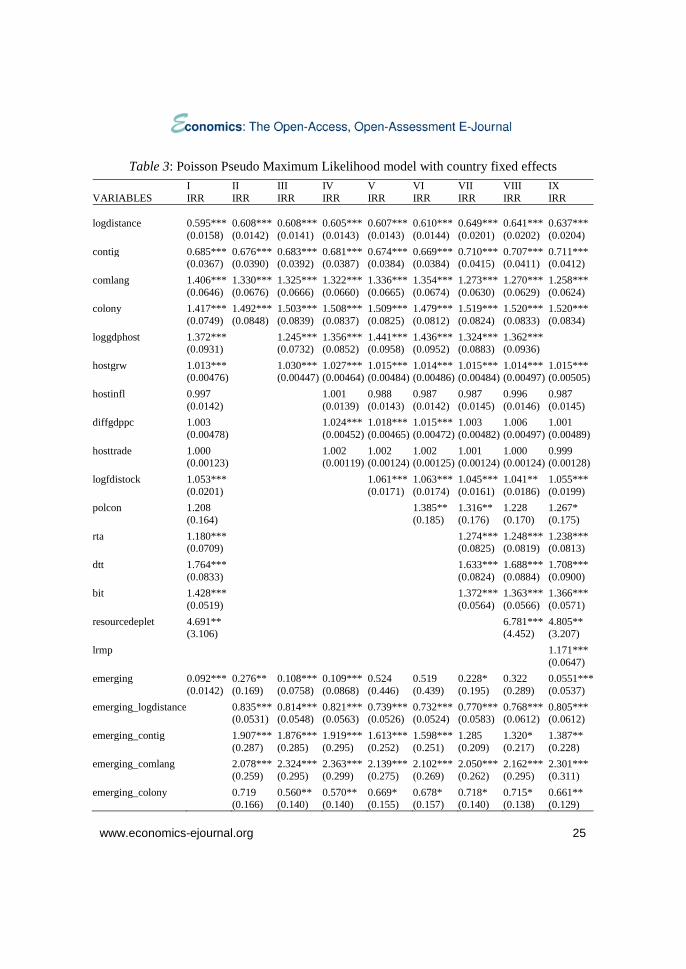
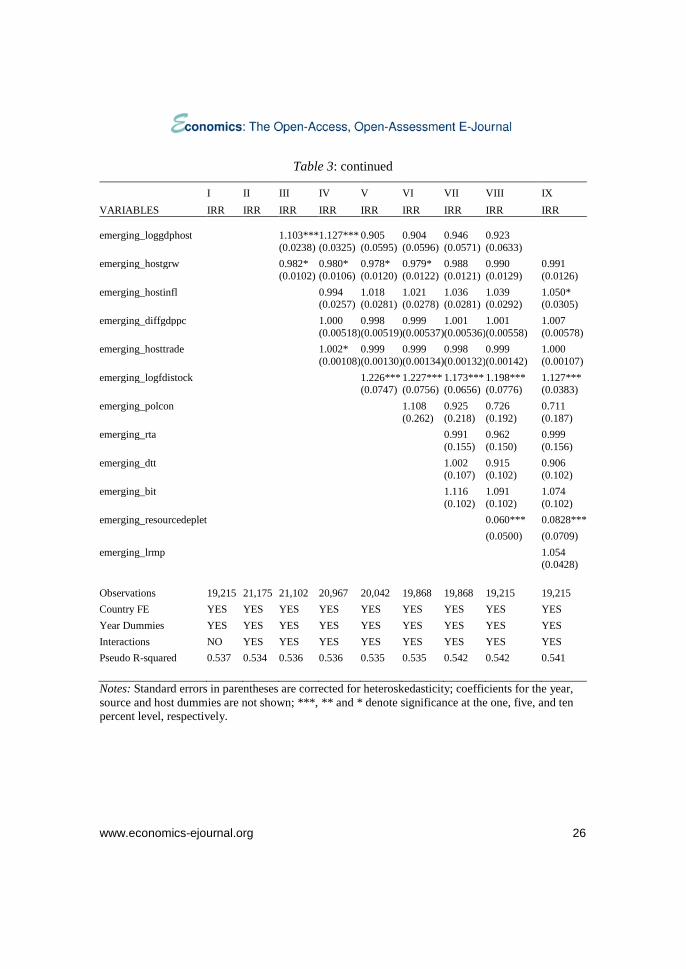
language, historical ties, and current bilateral and regional treaties encourage larger FDI flows.33 In some other respects, however, the Poisson results differ from the Logit results reported above. Most notably, we now find strong evidence for the driving forces of horizontal FDI. Both the size (loggdphost) and the growth (hostgrw) of local markets are associated with higher bilateral FDI flows at the one percent level of significance. We also find that host countries’ endowment of natural resources (resourcedeplet) induces higher bilateral FDI flows. Turning to the differences between traditional and non-traditional sources, Table 3 strengthens the support of H1. The intra-regional focus of non-traditional FDI from Asian and Latin American sources is captured not only at the gatekeeping stage. FDI from non-traditional sources is also more sensitive to distance at the second stage of deciding on FDI amounts. In addition, larger amounts of FDI from non-traditional sources flow to neighboring countries, which is in striking contrast to the benchmark result on contig. Taken together, these estimation results clearly fit into the regionally concentrated pattern of FDI amounts shown for developing Asia and Latin America in Table 1 above. The IRR on the interaction between contig and emerging and its statistical significance weakens when successively adding further FDI determinants and the corresponding interaction terms. Nevertheless, the IRR continues to be larger than one at the ten percent level of significance or better when estimating the fully specified model in columns VIII and IX. Likewise, FDI amounts from non-traditional sources are encouraged over-proportionately if the source and the host country share a common language (emerging_comlang).34
As concerns H2, the interaction terms capturing risk-related FDI determinants are again in conflict with the view that MNEs from emerging economies are less risk adverse due to their familiarity with political uncertainty and economic
_________________________ 33 In contrast to the Logit estimation, contig enters significantly below one in column I of Table 3. This is surprising even though economic relations between neighboring countries tend to be dominated by trade rather than FDI. 34 By contrast, past colonial ties stimulate bilateral FDI flows from non-traditional sources less strongly than FDI from traditional sources. This is hardly surprising considering that the former colonial powers typically belong to the second group of source countries.
www.economics-ejournal.org 25
Table 3: Poisson Pseudo Maximum Likelihood model with country fixed effects I II III IV V VI VII VIII IX VARIABLES IRR IRR IRR IRR IRR IRR IRR IRR IRR logdistance 0.595*** 0.608*** 0.608*** 0.605*** 0.607*** 0.610*** 0.649*** 0.641*** 0.637*** (0.0158) (0.0142) (0.0141) (0.0143) (0.0143) (0.0144) (0.0201) (0.0202) (0.0204) contig 0.685*** 0.676*** 0.683*** 0.681*** 0.674*** 0.669*** 0.710*** 0.707*** 0.711*** (0.0367) (0.0390) (0.0392) (0.0387) (0.0384) (0.0384) (0.0415) (0.0411) (0.0412) comlang 1.406*** 1.330*** 1.325*** 1.322*** 1.336*** 1.354*** 1.273*** 1.270*** 1.258*** (0.0646) (0.0676) (0.0666) (0.0660) (0.0665) (0.0674) (0.0630) (0.0629) (0.0624) colony 1.417*** 1.492*** 1.503*** 1.508*** 1.509*** 1.479*** 1.519*** 1.520*** 1.520*** (0.0749) (0.0848) (0.0839) (0.0837) (0.0825) (0.0812) (0.0824) (0.0833) (0.0834) loggdphost 1.372*** 1.245*** 1.356*** 1.441*** 1.436*** 1.324*** 1.362*** (0.0931) (0.0732) (0.0852) (0.0958) (0.0952) (0.0883) (0.0936) hostgrw 1.013*** 1.030*** 1.027*** 1.015*** 1.014*** 1.015*** 1.014*** 1.015*** (0.00476) (0.00447) (0.00464) (0.00484) (0.00486) (0.00484) (0.00497) (0.00505) hostinfl 0.997 1.001 0.988 0.987 0.987 0.996 0.987 (0.0142) (0.0139) (0.0143) (0.0142) (0.0145) (0.0146) (0.0145) diffgdppc 1.003 1.024*** 1.018*** 1.015*** 1.003 1.006 1.001 (0.00478) (0.00452) (0.00465) (0.00472) (0.00482) (0.00497) (0.00489) hosttrade 1.000 1.002 1.002 1.002 1.001 1.000 0.999 (0.00123) (0.00119) (0.00124) (0.00125) (0.00124) (0.00124) (0.00128) logfdistock 1.053*** 1.061*** 1.063*** 1.045*** 1.041** 1.055*** (0.0201) (0.0171) (0.0174) (0.0161) (0.0186) (0.0199) polcon 1.208 1.385** 1.316** 1.228 1.267* (0.164) (0.185) (0.176) (0.170) (0.175) rta 1.180*** 1.274*** 1.248*** 1.238*** (0.0709) (0.0825) (0.0819) (0.0813) dtt 1.764*** 1.633*** 1.688*** 1.708*** (0.0833) (0.0824) (0.0884) (0.0900) bit 1.428*** 1.372*** 1.363*** 1.366*** (0.0519) (0.0564) (0.0566) (0.0571) resourcedeplet 4.691** 6.781*** 4.805** (3.106) (4.452) (3.207) lrmp 1.171*** (0.0647) emerging 0.092*** 0.276** 0.108*** 0.109*** 0.524 0.519 0.228* 0.322 0.0551*** (0.0142) (0.169) (0.0758) (0.0868) (0.446) (0.439) (0.195) (0.289) (0.0537) emerging_logdistance 0.835*** 0.814*** 0.821*** 0.739*** 0.732*** 0.770*** 0.768*** 0.805*** (0.0531) (0.0548) (0.0563) (0.0526) (0.0524) (0.0583) (0.0612) (0.0612) emerging_contig 1.907*** 1.876*** 1.919*** 1.613*** 1.598*** 1.285 1.320* 1.387** (0.287) (0.285) (0.295) (0.252) (0.251) (0.209) (0.217) (0.228) emerging_comlang 2.078*** 2.324*** 2.363*** 2.139*** 2.102*** 2.050*** 2.162*** 2.301*** (0.259) (0.295) (0.299) (0.275) (0.269) (0.262) (0.295) (0.311) emerging_colony 0.719 0.560** 0.570** 0.669* 0.678* 0.718* 0.715* 0.661** (0.166) (0.140) (0.140) (0.155) (0.157) (0.140) (0.138) (0.129)
www.economics-ejournal.org 26
Table 3: continued
I II III IV V VI VII VIII IX VARIABLES IRR IRR IRR IRR IRR IRR IRR IRR IRR emerging_loggdphost 1.103*** 1.127*** 0.905 0.904 0.946 0.923 (0.0238) (0.0325) (0.0595) (0.0596) (0.0571) (0.0633) emerging_hostgrw 0.982* 0.980* 0.978* 0.979* 0.988 0.990 0.991 (0.0102) (0.0106) (0.0120) (0.0122) (0.0121) (0.0129) (0.0126) emerging_hostinfl 0.994 1.018 1.021 1.036 1.039 1.050* (0.0257) (0.0281) (0.0278) (0.0281) (0.0292) (0.0305) emerging_diffgdppc 1.000 0.998 0.999 1.001 1.001 1.007 (0.00518) (0.00519) (0.00537) (0.00536) (0.00558) (0.00578) emerging_hosttrade 1.002* 0.999 0.999 0.998 0.999 1.000 (0.00108) (0.00130) (0.00134) (0.00132) (0.00142) (0.00107) emerging_logfdistock 1.226*** 1.227*** 1.173*** 1.198*** 1.127*** (0.0747) (0.0756) (0.0656) (0.0776) (0.0383) emerging_polcon 1.108 0.925 0.726 0.711 (0.262) (0.218) (0.192) (0.187) emerging_rta 0.991 0.962 0.999 (0.155) (0.150) (0.156) emerging_dtt 1.002 0.915 0.906 (0.107) (0.102) (0.102) emerging_bit 1.116 1.091 1.074 (0.102) (0.102) (0.102) emerging_resourcedeplet 0.060*** 0.0828*** (0.0500) (0.0709) emerging_lrmp 1.054 (0.0428) Observations 19,215 21,175 21,102 20,967 20,042 19,868 19,868 19,215 19,215 Country FE YES YES YES YES YES YES YES YES YES Year Dummies YES YES YES YES YES YES YES YES YES Interactions NO YES YES YES YES YES YES YES YES Pseudo R-squared 0.537 0.534 0.536 0.536 0.535 0.535 0.542 0.542 0.541 Notes: Standard errors in parentheses are corrected for heteroskedasticity; coefficients for the year, source and host dummies are not shown; ***, ** and * denote significance at the one, five, and ten percent level, respectively.
www.economics-ejournal.org 27
instability at home. Almost all IRRs of the interaction terms with polcon and hostinfl are statistically insignificant at conventional levels.35
Table 3 provides mixed evidence concerning the differential impact of the driving forces of specific types of FDI. Similar to the gatekeeping stage, the Poisson model in columns VIII and IX of Table 3 reveals that the host countries’ endowment of natural resources represents a less important driving force of FDI amounts from non-traditional sources (H5). The evidence is more ambiguous with respect to the size of host-country markets as a driving force of horizontal FDI from non-traditional sources (H3). The IRRs on the interaction term emerging_loggdphost, which accounts for the differential impact of market size, are significantly above one in columns III and IV. However, they prove to be insignificant at conventional levels once the model is specified more fully. The insignificance of emerging_loggdphost in columns V-VIII is mainly due to the inclusion of our proxy of agglomeration effects and its interaction with the dummy for emerging economies, emerging_logfdistock.36 Agglomeration effects, which are particularly strong for FDI from non-traditional sources, are likely to induce various types of FDI. Hence, they should be taken into account in order to avoid biased results for the determinants of specific types of FDI. In other words, the results reported in Table 3 suggest that host-country markets play a similarly important role for FDI from traditional and non-traditional sources.
In contrast to the gatekeeping stage, the IRRs of the interaction term emerging_diffgdppc do not differ significantly from one in Table 3. In other words, we no longer find evidence suggesting that vertical FDI figures more prominently for MNEs based in emerging economies. However, the Poisson
_________________________ 35 The only exception is in column IX where host-country inflation appears to be associated positively with FDI from emerging economies, at the ten percent level of significance. Note also that the results on dtt, bit and rta in columns VII–IX suggest that bilateral and regional agreements are effective in inducing higher bilateral FDI. However, the insignificant interaction terms indicate that the effectiveness of the agreements does not depend on the source of FDI. 36 In additional estimations not shown in detail, we excluded the proxy of agglomeration effects from the specifications in columns V–VIII of Table 3. With this modification emerging_loggdphost proved to be significantly above one. Likewise, the interaction of the dummy for emerging markets with the alternative measure of market size, emerging_lrmp, proved to be significantly above one when excluding the proxy of agglomeration effects in column IX of Table 3.
www.economics-ejournal.org 28
results also reject the view according to which larger income gaps between the source and the host country are driving (vertical) FDI mainly from developed countries. We suspect that income gaps reflected in diffgdppc – though widely used in the literature on FDI determinants – are insufficient to isolate the location choices with respect to vertical FDI from those with respect to other types of FDI. On the one hand, productivity adjusted wage differentials would be required to better capture the relevance of cost savings for the location choices of MNEs based in high-wage locations.37 On the other hand, MNEs based in emerging economies may undertake both vertical and horizontal FDI in lower-income countries, with horizontal FDI in these locations possibly serving as testing grounds and springboards for subsequent engagements in more developed markets.38 Furthermore, the results reported so far on the interaction term emerging_diffgdppc may also be shaped by asset-augmenting FDI (see also Section 4.4).
4.3 Robustness Tests
Before extending the specification of our empirical model, we perform several robustness tests of the basic Poisson estimations in columns I and VIII of Table 3. First, we consider alternative risk indicators. For instance, the evidence on polcon as well as its interaction with the dummy variable for FDI from emerging economies may be weak because this indicator does not capture the most relevant aspects of risk related to institutional void and poor governance. We replaced polcon by an index on corruption in the host countries.39 The results for the other variables were hardly affected by this modification.40 The results on corruption
_________________________ 37 Data on unit labor cost are available for a small part of our sample of host countries only. 38 Recalling the intra-regional focus of FDI shown in Table 1, the coincidence of horizontal and vertical FDI motives could have resulted from institutionalized integration schemes such as Mercosur in South America as well as market-driven regional integration along the so-called flying geese pattern in developing Asia. 39 The index is taken from the International Country Risk Guide (http://www.prsgroup.com/ICRG.aspx) and ranges from zero (highly corrupt) to six (not corrupt). 40 There is just one notable exception: The IRR on resourcedeplet is no longer significant in the estimation with corruption. This is probably because using the ICRG index results in the loss of
www.economics-ejournal.org 29
largely resemble those on polcon. In particular, the interaction of the corruption index with the dummy variable for FDI from emerging economies proved to be insignificant, corroborating the earlier conclusion that non-traditional investors are no less risk adverse than the benchmark of all source countries.
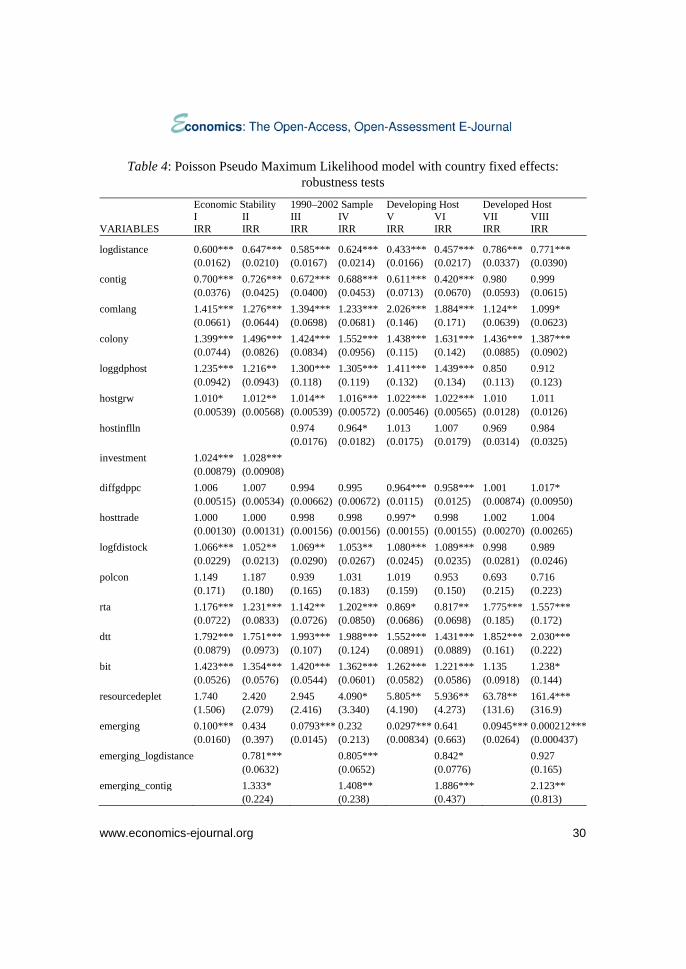
The latter conclusion no longer holds, however, when replacing our proxy of economic instability, hostinfl, by another index from the International Country Risk Guide. The so-called investment profile of countries (investment) comprises three components – contract viability/ expropriation, profits repatriation and payment delays – and ranges from 0 (highest risk) to 12 (lowest risk). In contrast to hostinfl, the IRR of investment per se proves to be significantly above one, while its interaction with emerging indicates that FDI from non-traditional source countries is significantly less discouraged by risk as reflected in the host country’s investment profile (column II in Table 4).41
Second, we replicate our baseline estimation for a shorter period of observation. The estimations reported in columns III and IV in Table 4 cover the period 1990–2004, instead of 1978–2004. In this way, we may check whether the baseline results are distorted due to the more recent nature of FDI from emerging
_________________________ almost 2,000 observations, mainly involving pairs with small, poor and resource-dependent host countries. Detailed results are not reported here for the sake of brevity, but are available on request. 41 In all other respects, this robustness test resembles the previous robustness test.
www.economics-ejournal.org 30
Table 4: Poisson Pseudo Maximum Likelihood model with country fixed effects: robustness tests
Economic Stability 1990–2002 Sample Developing Host Developed Host I II III IV V VI VII VIII VARIABLES IRR IRR IRR IRR IRR IRR IRR IRR
logdistance 0.600*** 0.647*** 0.585*** 0.624*** 0.433*** 0.457*** 0.786*** 0.771*** (0.0162) (0.0210) (0.0167) (0.0214) (0.0166) (0.0217) (0.0337) (0.0390) contig 0.700*** 0.726*** 0.672*** 0.688*** 0.611*** 0.420*** 0.980 0.999 (0.0376) (0.0425) (0.0400) (0.0453) (0.0713) (0.0670) (0.0593) (0.0615) comlang 1.415*** 1.276*** 1.394*** 1.233*** 2.026*** 1.884*** 1.124** 1.099* (0.0661) (0.0644) (0.0698) (0.0681) (0.146) (0.171) (0.0639) (0.0623) colony 1.399*** 1.496*** 1.424*** 1.552*** 1.438*** 1.631*** 1.436*** 1.387*** (0.0744) (0.0826) (0.0834) (0.0956) (0.115) (0.142) (0.0885) (0.0902) loggdphost 1.235*** 1.216** 1.300*** 1.305*** 1.411*** 1.439*** 0.850 0.912 (0.0942) (0.0943) (0.118) (0.119) (0.132) (0.134) (0.113) (0.123) hostgrw 1.010* 1.012** 1.014** 1.016*** 1.022*** 1.022*** 1.010 1.011 (0.00539) (0.00568) (0.00539) (0.00572) (0.00546) (0.00565) (0.0128) (0.0126) hostinflln 0.974 0.964* 1.013 1.007 0.969 0.984 (0.0176) (0.0182) (0.0175) (0.0179) (0.0314) (0.0325) investment 1.024*** 1.028*** (0.00879) (0.00908) diffgdppc 1.006 1.007 0.994 0.995 0.964*** 0.958*** 1.001 1.017* (0.00515) (0.00534) (0.00662) (0.00672) (0.0115) (0.0125) (0.00874) (0.00950) hosttrade 1.000 1.000 0.998 0.998 0.997* 0.998 1.002 1.004 (0.00130) (0.00131) (0.00156) (0.00156) (0.00155) (0.00155) (0.00270) (0.00265) logfdistock 1.066*** 1.052** 1.069** 1.053** 1.080*** 1.089*** 0.998 0.989 (0.0229) (0.0213) (0.0290) (0.0267) (0.0245) (0.0235) (0.0281) (0.0246) polcon 1.149 1.187 0.939 1.031 1.019 0.953 0.693 0.716 (0.171) (0.180) (0.165) (0.183) (0.159) (0.150) (0.215) (0.223) rta 1.176*** 1.231*** 1.142** 1.202*** 0.869* 0.817** 1.775*** 1.557*** (0.0722) (0.0833) (0.0726) (0.0850) (0.0686) (0.0698) (0.185) (0.172) dtt 1.792*** 1.751*** 1.993*** 1.988*** 1.552*** 1.431*** 1.852*** 2.030*** (0.0879) (0.0973) (0.107) (0.124) (0.0891) (0.0889) (0.161) (0.222) bit 1.423*** 1.354*** 1.420*** 1.362*** 1.262*** 1.221*** 1.135 1.238* (0.0526) (0.0576) (0.0544) (0.0601) (0.0582) (0.0586) (0.0918) (0.144) resourcedeplet 1.740 2.420 2.945 4.090* 5.805** 5.936** 63.78** 161.4*** (1.506) (2.079) (2.416) (3.340) (4.190) (4.273) (131.6) (316.9) emerging 0.100*** 0.434 0.0793*** 0.232 0.0297*** 0.641 0.0945*** 0.000212*** (0.0160) (0.397) (0.0145) (0.213) (0.00834) (0.663) (0.0264) (0.000437) emerging_logdistance 0.781*** 0.805*** 0.842* 0.927 (0.0632) (0.0652) (0.0776) (0.165) emerging_contig 1.333* 1.408** 1.886*** 2.123** (0.224) (0.238) (0.437) (0.813)
www.economics-ejournal.org 31
Table 4: continued Economic Stability 1990–2002 Sample Developing Host Developed Host I II III IV V VI VII VIII VARIABLES IRR IRR IRR IRR IRR IRR IRR IRR emerging_comlang 2.180*** 2.204*** 1.226 6.645*** (0.303) (0.313) (0.240) (2.046) emerging_colony 0.724 0.680* 3.07e-08*** 0.882 (0.142) (0.138) (3.25e-08) (0.155) emerging_loggdphost 0.925 0.963 0.808** 1.349*** (0.0673) (0.0681) (0.0706) (0.130) emerging_hostgrw 0.988 0.987 1.002 1.001 (0.0136) (0.0128) (0.0141) (0.0346) emerging_hostinflln 1.067** 1.055 0.902 (0.0316) (0.0352) (0.0590) emerging_investment 0.962** (0.0175) emerging_diffgdppc 0.998 0.992 1.046*** 1.029* (0.00548) (0.00585) (0.0135) (0.0156) emerging_hosttrade 0.999 0.999 0.997** 1.007*** (0.00144) (0.00140) (0.00158) (0.00265) emerging_logfdistock 1.199** 1.121* 0.966 1.325*** (0.0854) (0.0758) (0.0749) (0.102) emerging_polcon 0.679 0.545** 1.510 0.586 (0.187) (0.150) (0.423) (0.397) emerging_rta 1.037 0.977 1.216 0.866 (0.165) (0.158) (0.227) (0.308) emerging_dtt 0.836 0.788** 1.116 0.912 (0.0950) (0.0928) (0.164) (0.154) emerging_bit 1.128 1.119 1.352** 0.756* (0.105) (0.106) (0.174) (0.127) emerging_resourcedeplet 0.0805*** 0.0703*** 0.230* 0.00119*** (0.0685) (0.0573) (0.176) (0.00283) Observations 17,168 17,168 15,376 15,376 14,622 14,622 4,593 4,593 Country FE YES YES YES YES YES YES/ YES YES Year Dummies YES YES YES YES YES YES YES YES Interactions NO YES NO YES NO YES NO YES Pseudo R-squared 0.533 0.537 0.535 0.539 0.538 0.543 0.447 0.463 Notes: Standard errors in parentheses are corrected for heteroskedasticity; coefficients for the year, source and host dummies are not shown; ***, ** and * denote significance at the one, five, and ten percent level, respectively.
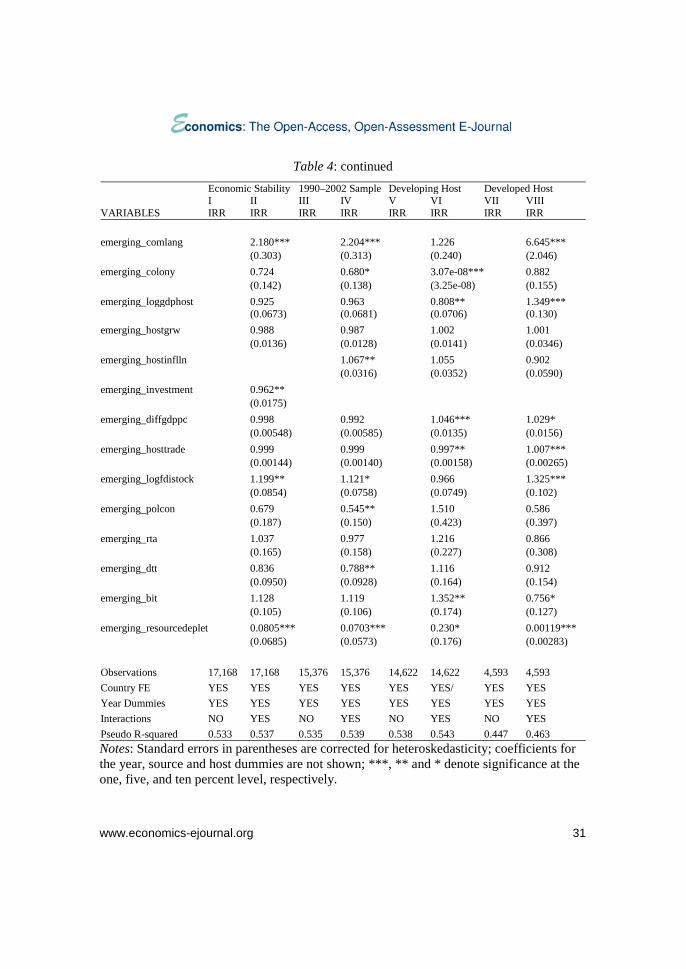
www.economics-ejournal.org 32
economies.42 This does not appear to be the case. Focusing on the differences between traditional and non-traditional sources of FDI with regard to the explanatory variables of major interest, it is only with respect to H2 that the results in Table 4 deviate substantially from the corresponding baseline results.43 Similar to the previous robustness test, we find evidence for the shorter period of observation suggesting that FDI from non-traditional sources is less discouraged by economic instability and political uncertainty. This is reflected in IRRs significantly above one for emerging_hostinfl, and significantly below one for emerging_polcon. On the other hand, it still holds that FDI from non-traditional sources is discouraged more strongly by distance than FDI from traditional sources, even though distance-related factors are perceived to matter most in the early stages of internationalization (Section 2).
Third, we split the sample of 110 host countries into two sub-groups: (i) 25 developed host countries, and (ii) 85 host countries with lower per-capita incomes (emerging economies, developing countries and transition economies). The results in columns V–VIII of Table 4 reveal that the previous benchmark results for the Poisson estimations reported in Table 3 (columns I and VIII) are mainly driven by the sub-group of host countries with lower per-capita incomes. This is not surprising as the number of observations is three times as large for this sub-group as for the sub-group of developed host countries. In particular with regard to the driving forces of horizontal FDI (loggdphost, hostgrw), the benchmark results are relatively weak for the sub-group of developed host countries. The benchmark results for the larger sub-group of host countries with lower per-capita incomes are _________________________ 42 FDI from emerging economies could be underrepresented in the earlier part of the whole period of observation. The comparison between traditional and non-traditional sources could be distorted if FDI data in the 1970s and 1980s covered almost exclusively developed source countries. However, missing observations in 1978–1989 are almost equally distributed between emerging and developed source countries. For instance, the time series of available FDI data range back to 1978 for three out of 11 emerging economies and three out of 18 developed countries. On the other hand, the time series are complete since 1990 for all emerging and developed source countries with just one exception in each sub-sample (Switzerland and Turkey, respectively). See Appendix C for details on the time span over which FDI data are available for particular source countries. 43 Notable changes with regard to some control variables include the weaker significance of differences in agglomeration effects (emerging_logfdistock) and the significantly weaker effect of double taxation treaties on non-traditional FDI (emerging_dtt).
www.economics-ejournal.org 33
only striking in that the IRR of diffgdppc proves to be significantly below one, which resembles the corresponding Logit estimation in Table 1 but conflicts with the corresponding Poisson estimation in Table 3.
Turning to the interaction terms and focusing on our major hypotheses, the findings shown in columns VI and VIII of Table 4 are noteworthy in several respects. First of all, H1 on distance-related factors is supported for both sub-groups of host countries. This is even though emerging_logdistance enters insignificant at conventional levels for the smaller sub-group of developed host countries. FDI flows from emerging source countries to developed host countries rather react particularly strongly to sharing a common language (emerging_comlang). Moreover, FDI flows from emerging source countries to both sub-groups of host countries react particularly strongly to sharing a common border (emerging_contig).
Second, for both sub-groups of host countries, the evidence on hypotheses H2 and H5 closely resembles the earlier findings for the overall sample of 110 host countries in Table 3. FDI from emerging economies does not appear to be less risk adverse than FDI from developed countries in either of the two sub-groups of host countries (H2). At the same time, resource abundance in any sub-group of host countries provides a weaker attraction for FDI from emerging economies than for FDI from developed countries (H5). Third, FDI flows from emerging economies to both sub-groups of host countries differ strikingly from the benchmark results with respect to diffgdppc as a possible pull factor of cost-oriented, vertical FDI. Surprisingly, the IRRs of the interaction term emerging_diffgdppc prove to be significantly above one, similar to the corresponding odds ratios in the Logit estimations in Table 2.
Finally, splitting the host-country sample reveals an interesting finding with regard to H3 on the impact of local market size as a pull factor of horizontal FDI. As concerns FDI flows to the larger sub-group of host countries with relatively low per-capita incomes, we find support for the argument that the similarity with market conditions at home weakens the impact of the size of host-country markets on FDI from emerging economies, compared to FDI from developed countries. In sharp contrast, however, the size of local markets in developed host countries appears to be a stronger attraction to FDI from emerging economies, compared to FDI from developed countries.
www.economics-ejournal.org 34
4.4 Extended Specification and Pair Fixed Effects
The estimations shown so far do not explicitly account for H6 according to which location choices may be shaped by the availability of superior technologies in developed host countries. This could possibly be an important omission: as discussed in Section 3 above, developed countries attract a large share of FDI from non-traditional sources in developing Asia and Latin America. The possibility of asset-augmenting FDI flowing from relatively poor source countries to richer host countries could bias downwards any positive correlation between diffgdppc and bilateral FDI of the vertical type.44
We estimate an extended specification of the Poisson model to separate the determinants of vertical FDI from the determinants of asset-augmenting FDI at least tentatively. The number of patents per 1,000 inhabitants of the host country (patents) is added to the list of FDI determinants. We follow previous country studies, notably Buckley et al. (2007) and Pradhan (2011), in regarding the intensity of patenting as a proxy capturing the technological sophistication of host countries which may attract asset-augmenting FDI. Data on patents are unavailable for various host countries in our sample so that the results in Table 5 are based on a much smaller number of observations. Nevertheless, the results on our standard list of FDI determinants are surprisingly robust.45
Most importantly, concerns that the results on diffgdppc and its interaction with emerging might be biased downwards in previous estimations appear to be unjustified. At the same time, the patent variable per se offers limited additional insights. One might suspect that the weak evidence on patents is due to collinearity with diffgdppc. This is not the case, however. Dropping diffgdppc from the list of _________________________ 44 Unless effectively controlled for, asset-augmenting FDI tends to imply a negative correlation between diffgdppc and bilateral FDI. This would primarily affect the interaction term emerging_diffgdppc if asset-augmenting FDI figured prominently in the FDI portfolio of non-traditional source countries. 45 The most notable exception is that the impact of resource abundance on location choices weakens considerably; all related variables prove to be insignificant at conventional levels in Table 5. The same applies to the interaction terms with the dummy variable for neighboring countries (emerging_contig) and for colonial ties (emerging_colony).
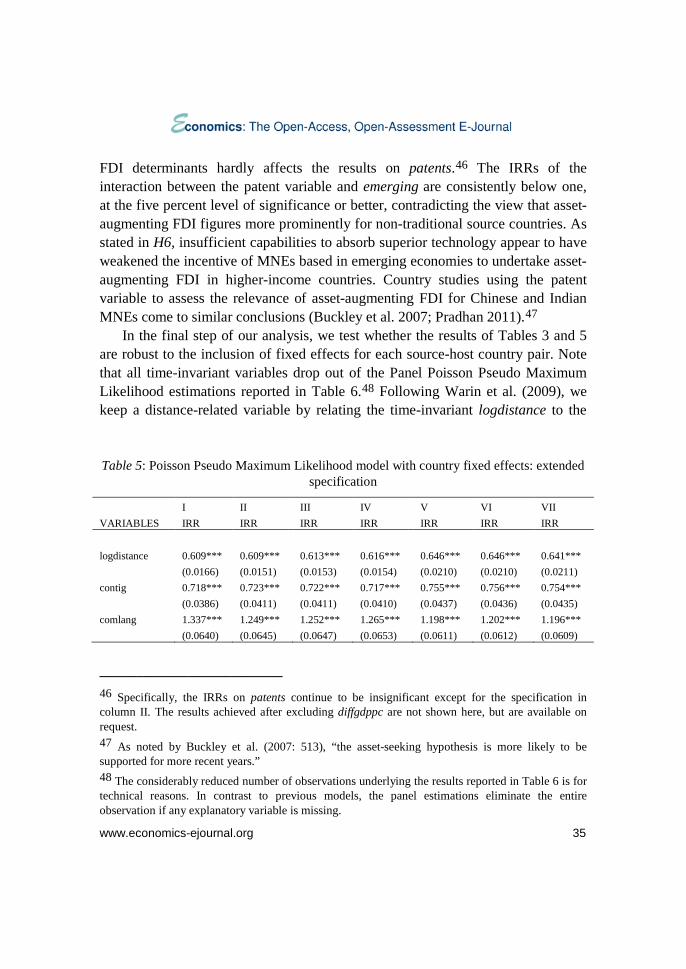
www.economics-ejournal.org 35
FDI determinants hardly affects the results on patents.46 The IRRs of the interaction between the patent variable and emerging are consistently below one, at the five percent level of significance or better, contradicting the view that asset-augmenting FDI figures more prominently for non-traditional source countries. As stated in H6, insufficient capabilities to absorb superior technology appear to have weakened the incentive of MNEs based in emerging economies to undertake asset- augmenting FDI in higher-income countries. Country studies using the patent variable to assess the relevance of asset-augmenting FDI for Chinese and Indian MNEs come to similar conclusions (Buckley et al. 2007; Pradhan 2011).47
In the final step of our analysis, we test whether the results of Tables 3 and 5 are robust to the inclusion of fixed effects for each source-host country pair. Note that all time-invariant variables drop out of the Panel Poisson Pseudo Maximum Likelihood estimations reported in Table 6.48 Following Warin et al. (2009), we keep a distance-related variable by relating the time-invariant logdistance to the
Table 5: Poisson Pseudo Maximum Likelihood model with country fixed effects: extended specification
I II III IV V VI VII VARIABLES IRR IRR IRR IRR IRR IRR IRR logdistance 0.609*** 0.609*** 0.613*** 0.616*** 0.646*** 0.646*** 0.641*** (0.0166) (0.0151) (0.0153) (0.0154) (0.0210) (0.0210) (0.0211) contig 0.718*** 0.723*** 0.722*** 0.717*** 0.755*** 0.756*** 0.754*** (0.0386) (0.0411) (0.0411) (0.0410) (0.0437) (0.0436) (0.0435) comlang 1.337*** 1.249*** 1.252*** 1.265*** 1.198*** 1.202*** 1.196*** (0.0640) (0.0645) (0.0647) (0.0653) (0.0611) (0.0612) (0.0609)
_________________________ 46 Specifically, the IRRs on patents continue to be insignificant except for the specification in column II. The results achieved after excluding diffgdppc are not shown here, but are available on request. 47 As noted by Buckley et al. (2007: 513), “the asset-seeking hypothesis is more likely to be supported for more recent years.” 48 The considerably reduced number of observations underlying the results reported in Table 6 is for technical reasons. In contrast to previous models, the panel estimations eliminate the entire observation if any explanatory variable is missing.
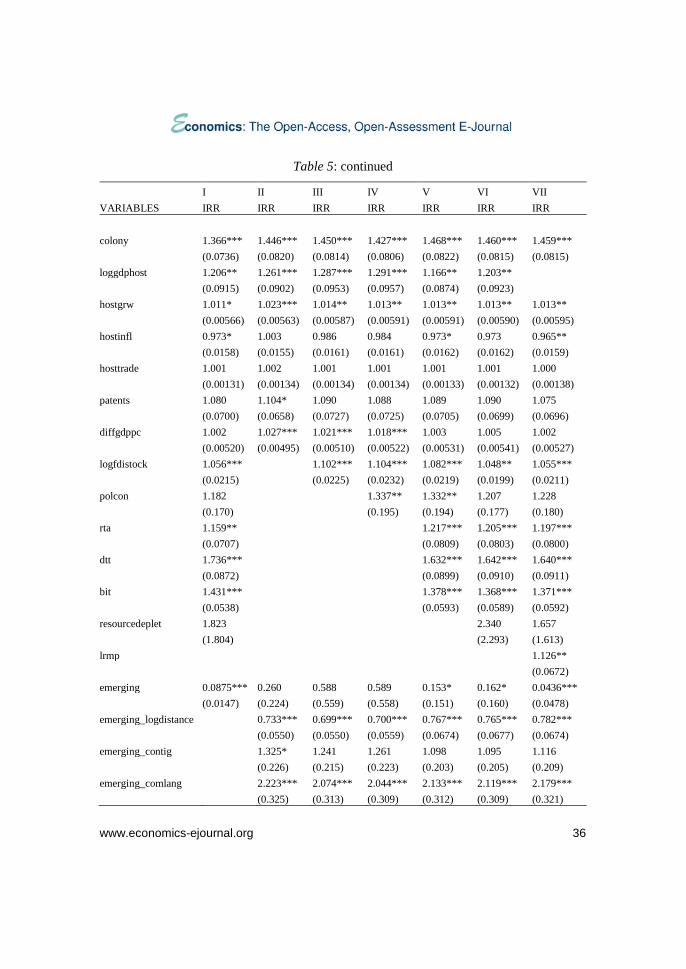
www.economics-ejournal.org 36
Table 5: continued
I II III IV V VI VII VARIABLES IRR IRR IRR IRR IRR IRR IRR colony 1.366*** 1.446*** 1.450*** 1.427*** 1.468*** 1.460*** 1.459*** (0.0736) (0.0820) (0.0814) (0.0806) (0.0822) (0.0815) (0.0815) loggdphost 1.206** 1.261*** 1.287*** 1.291*** 1.166** 1.203** (0.0915) (0.0902) (0.0953) (0.0957) (0.0874) (0.0923) hostgrw 1.011* 1.023*** 1.014** 1.013** 1.013** 1.013** 1.013** (0.00566) (0.00563) (0.00587) (0.00591) (0.00591) (0.00590) (0.00595) hostinfl 0.973* 1.003 0.986 0.984 0.973* 0.973 0.965** (0.0158) (0.0155) (0.0161) (0.0161) (0.0162) (0.0162) (0.0159) hosttrade 1.001 1.002 1.001 1.001 1.001 1.001 1.000 (0.00131) (0.00134) (0.00134) (0.00134) (0.00133) (0.00132) (0.00138) patents 1.080 1.104* 1.090 1.088 1.089 1.090 1.075 (0.0700) (0.0658) (0.0727) (0.0725) (0.0705) (0.0699) (0.0696) diffgdppc 1.002 1.027*** 1.021*** 1.018*** 1.003 1.005 1.002 (0.00520) (0.00495) (0.00510) (0.00522) (0.00531) (0.00541) (0.00527) logfdistock 1.056*** 1.102*** 1.104*** 1.082*** 1.048** 1.055*** (0.0215) (0.0225) (0.0232) (0.0219) (0.0199) (0.0211) polcon 1.182 1.337** 1.332** 1.207 1.228 (0.170) (0.195) (0.194) (0.177) (0.180) rta 1.159** 1.217*** 1.205*** 1.197*** (0.0707) (0.0809) (0.0803) (0.0800) dtt 1.736*** 1.632*** 1.642*** 1.640*** (0.0872) (0.0899) (0.0910) (0.0911) bit 1.431*** 1.378*** 1.368*** 1.371*** (0.0538) (0.0593) (0.0589) (0.0592) resourcedeplet 1.823 2.340 1.657 (1.804) (2.293) (1.613) lrmp 1.126** (0.0672) emerging 0.0875*** 0.260 0.588 0.589 0.153* 0.162* 0.0436*** (0.0147) (0.224) (0.559) (0.558) (0.151) (0.160) (0.0478) emerging_logdistance 0.733*** 0.699*** 0.700*** 0.767*** 0.765*** 0.782*** (0.0550) (0.0550) (0.0559) (0.0674) (0.0677) (0.0674) emerging_contig 1.325* 1.241 1.261 1.098 1.095 1.116 (0.226) (0.215) (0.223) (0.203) (0.205) (0.209) emerging_comlang 2.223*** 2.074*** 2.044*** 2.133*** 2.119*** 2.179*** (0.325) (0.313) (0.309) (0.312) (0.309) (0.321)
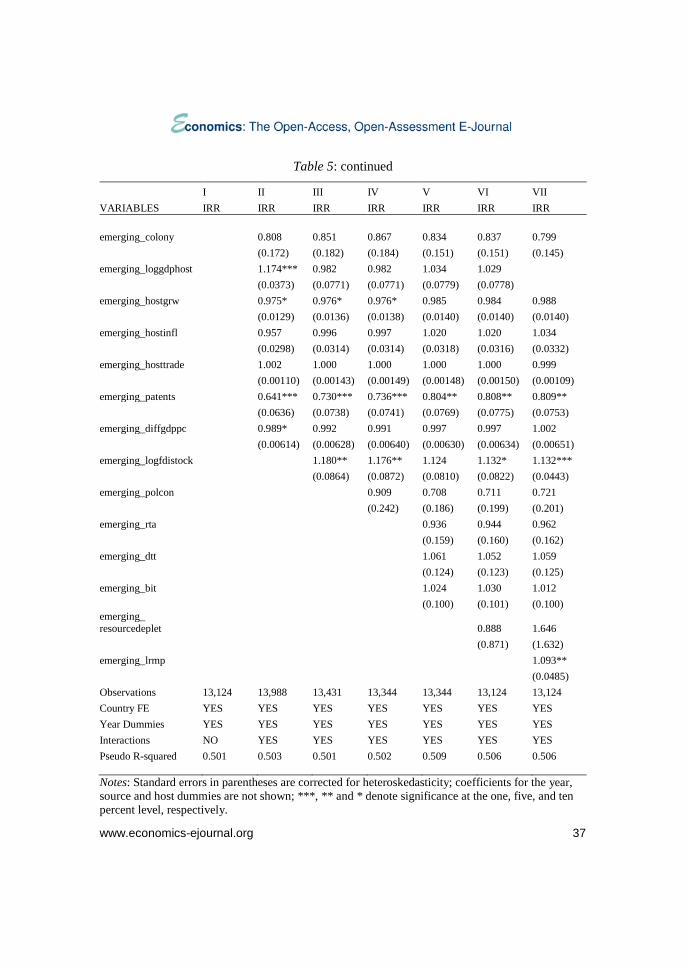
www.economics-ejournal.org 37
Table 5: continued
I II III IV V VI VII VARIABLES IRR IRR IRR IRR IRR IRR IRR emerging_colony 0.808 0.851 0.867 0.834 0.837 0.799 (0.172) (0.182) (0.184) (0.151) (0.151) (0.145) emerging_loggdphost 1.174*** 0.982 0.982 1.034 1.029 (0.0373) (0.0771) (0.0771) (0.0779) (0.0778) emerging_hostgrw 0.975* 0.976* 0.976* 0.985 0.984 0.988 (0.0129) (0.0136) (0.0138) (0.0140) (0.0140) (0.0140) emerging_hostinfl 0.957 0.996 0.997 1.020 1.020 1.034 (0.0298) (0.0314) (0.0314) (0.0318) (0.0316) (0.0332) emerging_hosttrade 1.002 1.000 1.000 1.000 1.000 0.999 (0.00110) (0.00143) (0.00149) (0.00148) (0.00150) (0.00109) emerging_patents 0.641*** 0.730*** 0.736*** 0.804** 0.808** 0.809** (0.0636) (0.0738) (0.0741) (0.0769) (0.0775) (0.0753) emerging_diffgdppc 0.989* 0.992 0.991 0.997 0.997 1.002 (0.00614) (0.00628) (0.00640) (0.00630) (0.00634) (0.00651) emerging_logfdistock 1.180** 1.176** 1.124 1.132* 1.132*** (0.0864) (0.0872) (0.0810) (0.0822) (0.0443) emerging_polcon 0.909 0.708 0.711 0.721 (0.242) (0.186) (0.199) (0.201) emerging_rta 0.936 0.944 0.962 (0.159) (0.160) (0.162) emerging_dtt 1.061 1.052 1.059 (0.124) (0.123) (0.125) emerging_bit 1.024 1.030 1.012 (0.100) (0.101) (0.100) emerging_ resourcedeplet 0.888 1.646 (0.871) (1.632) emerging_lrmp 1.093** (0.0485) Observations 13,124 13,988 13,431 13,344 13,344 13,124 13,124 Country FE YES YES YES YES YES YES YES Year Dummies YES YES YES YES YES YES YES Interactions NO YES YES YES YES YES YES Pseudo R-squared 0.501 0.503 0.501 0.502 0.509 0.506 0.506 Notes: Standard errors in parentheses are corrected for heteroskedasticity; coefficients for the year, source and host dummies are not shown; ***, ** and * denote significance at the one, five, and ten percent level, respectively.
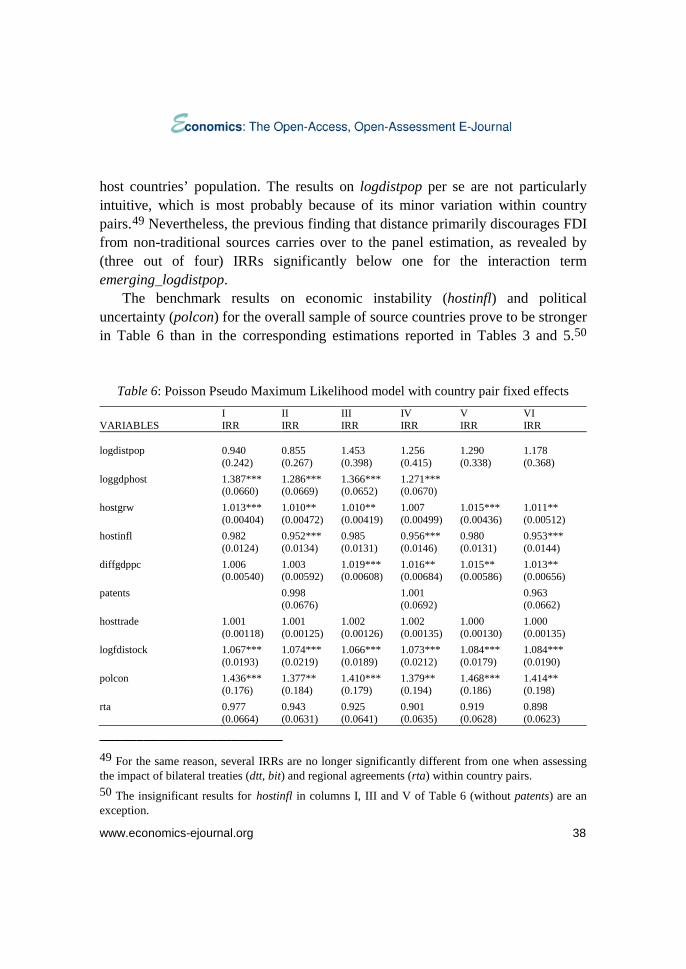
www.economics-ejournal.org 38
host countries’ population. The results on logdistpop per se are not particularly intuitive, which is most probably because of its minor variation within country pairs.49 Nevertheless, the previous finding that distance primarily discourages FDI from non-traditional sources carries over to the panel estimation, as revealed by (three out of four) IRRs significantly below one for the interaction term emerging_logdistpop.
The benchmark results on economic instability (hostinfl) and political uncertainty (polcon) for the overall sample of source countries prove to be stronger in Table 6 than in the corresponding estimations reported in Tables 3 and 5.50
Table 6: Poisson Pseudo Maximum Likelihood model with country pair fixed effects I II III IV V VI VARIABLES IRR IRR IRR IRR IRR IRR logdistpop 0.940 0.855 1.453 1.256 1.290 1.178 (0.242) (0.267) (0.398) (0.415) (0.338) (0.368) loggdphost 1.387*** 1.286*** 1.366*** 1.271*** (0.0660) (0.0669) (0.0652) (0.0670) hostgrw 1.013*** 1.010** 1.010** 1.007 1.015*** 1.011** (0.00404) (0.00472) (0.00419) (0.00499) (0.00436) (0.00512) hostinfl 0.982 0.952*** 0.985 0.956*** 0.980 0.953*** (0.0124) (0.0134) (0.0131) (0.0146) (0.0131) (0.0144) diffgdppc 1.006 1.003 1.019*** 1.016** 1.015** 1.013** (0.00540) (0.00592) (0.00608) (0.00684) (0.00586) (0.00656) patents 0.998 1.001 0.963 (0.0676) (0.0692) (0.0662) hosttrade 1.001 1.001 1.002 1.002 1.000 1.000 (0.00118) (0.00125) (0.00126) (0.00135) (0.00130) (0.00135) logfdistock 1.067*** 1.074*** 1.066*** 1.073*** 1.084*** 1.084*** (0.0193) (0.0219) (0.0189) (0.0212) (0.0179) (0.0190) polcon 1.436*** 1.377** 1.410*** 1.379** 1.468*** 1.414** (0.176) (0.184) (0.179) (0.194) (0.186) (0.198) rta 0.977 0.943 0.925 0.901 0.919 0.898 (0.0664) (0.0631) (0.0641) (0.0635) (0.0628) (0.0623) _________________________ 49 For the same reason, several IRRs are no longer significantly different from one when assessing the impact of bilateral treaties (dtt, bit) and regional agreements (rta) within country pairs. 50 The insignificant results for hostinfl in columns I, III and V of Table 6 (without patents) are an exception.
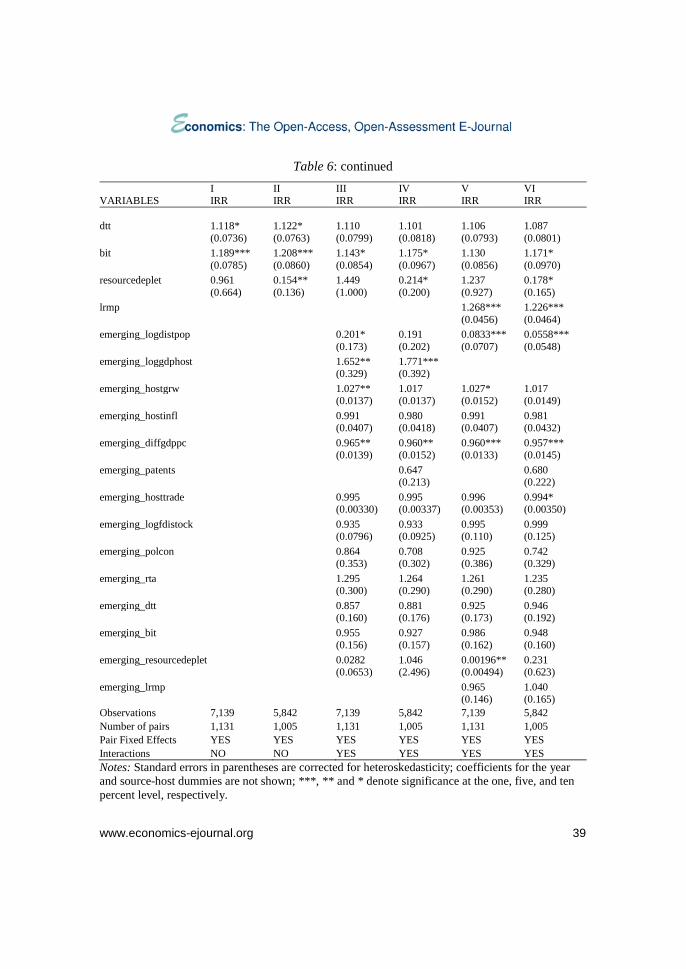
www.economics-ejournal.org 39
Table 6: continued I II III IV V VI VARIABLES IRR IRR IRR IRR IRR IRR dtt 1.118* 1.122* 1.110 1.101 1.106 1.087 (0.0736) (0.0763) (0.0799) (0.0818) (0.0793) (0.0801) bit 1.189*** 1.208*** 1.143* 1.175* 1.130 1.171* (0.0785) (0.0860) (0.0854) (0.0967) (0.0856) (0.0970) resourcedeplet 0.961 0.154** 1.449 0.214* 1.237 0.178* (0.664) (0.136) (1.000) (0.200) (0.927) (0.165) lrmp 1.268*** 1.226*** (0.0456) (0.0464) emerging_logdistpop 0.201* 0.191 0.0833*** 0.0558*** (0.173) (0.202) (0.0707) (0.0548) emerging_loggdphost 1.652** 1.771*** (0.329) (0.392) emerging_hostgrw 1.027** 1.017 1.027* 1.017 (0.0137) (0.0137) (0.0152) (0.0149) emerging_hostinfl 0.991 0.980 0.991 0.981 (0.0407) (0.0418) (0.0407) (0.0432) emerging_diffgdppc 0.965** 0.960** 0.960*** 0.957*** (0.0139) (0.0152) (0.0133) (0.0145) emerging_patents 0.647 0.680 (0.213) (0.222) emerging_hosttrade 0.995 0.995 0.996 0.994* (0.00330) (0.00337) (0.00353) (0.00350) emerging_logfdistock 0.935 0.933 0.995 0.999 (0.0796) (0.0925) (0.110) (0.125) emerging_polcon 0.864 0.708 0.925 0.742 (0.353) (0.302) (0.386) (0.329) emerging_rta 1.295 1.264 1.261 1.235 (0.300) (0.290) (0.290) (0.280) emerging_dtt 0.857 0.881 0.925 0.946 (0.160) (0.176) (0.173) (0.192) emerging_bit 0.955 0.927 0.986 0.948 (0.156) (0.157) (0.162) (0.160) emerging_resourcedeplet 0.0282 1.046 0.00196** 0.231 (0.0653) (2.496) (0.00494) (0.623) emerging_lrmp 0.965 1.040 (0.146) (0.165) Observations 7,139 5,842 7,139 5,842 7,139 5,842 Number of pairs 1,131 1,005 1,131 1,005 1,131 1,005 Pair Fixed Effects YES YES YES YES YES YES Interactions NO NO YES YES YES YES Notes: Standard errors in parentheses are corrected for heteroskedasticity; coefficients for the year and source-host dummies are not shown; ***, ** and * denote significance at the one, five, and ten percent level, respectively.
www.economics-ejournal.org 40
IRRs significantly below one for hostinfl and IRRs significantly above one for polcon suggest that bilateral FDI within country pairs is generally discouraged under conditions of increasing economic instability and political uncertainty. All the same, the panel results in Table 6 reinforce the previous finding from the basic specification that FDI from non-traditional sources is as sensitive to economic instability and political uncertainty as FDI from traditional sources. None of the relevant interaction terms, emerging_hostinfl and emerging_polcon, differs significantly from one in Table 6 – similar to the corresponding estimations in Tables 3 and 5 before.
Turning to the determinants of major types of FDI, the benchmark results for all source countries in Table 6 are closely in line with previous results in the corresponding columns of Tables 3 and 5 on the driving forces of horizontal FDI. The IRRs for the size and growth of host-country markets (loggdphost, hostgrw) as well as the real market potential (lrmp) are typically above one and highly significant. The evidence is less clear with regard to the interactions of these variables with the dummy variable for non-traditional source countries. The interactions with loggdphost suggest that the size of host-country markets figures more prominently for the location choices of non-traditional direct investors. It does not fit well with H3 that increasing market size (and, in some cases, also higher market growth) has stronger effects on FDI flows from emerging economies within country pairs. Yet the evidence is not consistently in conflict with H3, taking into account that the interaction with lrmp proves to be insignificant at conventional levels of significance.
The estimations with pair fixed effects in columns I and II of Table 6 indicate that the impact of differences in GDP per capita (diffgdppc) tends to be blurred when pooling traditional and non-traditional source countries. Allowing for differential effects between traditional and non-traditional sources, the IRRs for diffgdppc per se prove to be significantly above one, while the IRRs for its interaction with the dummy variable for non-traditional sources prove to be significantly below one. This finding is largely in line with H4. Increasing income gaps within source-host country pairs are generally associated with higher (vertical) FDI flows, while this effect is comparatively weak for pairs with non-traditional source countries.
www.economics-ejournal.org 41
Table 6 also supports H5 that the endowment of host countries with natural resources is unlikely to represent a particularly strong attraction for outward FDI from emerging economies. As in Tables 3 and 5 before, the interaction between resource abundance and the dummy variable for FDI from non-traditional sources is either insignificant or below one (at the five percent level in column V of Table 6). In general, the results on resourcedeplet are less intuitive once pair fixed effects are accounted for. This is probably because the endowment of raw materials varies only moderately within country pairs. Finally, the inclusion of the patent variable (patents) in columns II, IV and VI of Table 6 offers no additional insights.
5 Summary and Conclusion
Proponents of globalization as well as prominent critics largely agree that FDI could bring considerable benefits to the host countries (e.g., OECD 2002; Stiglitz 2000). However, various locations where the need for foreign capital, technology and know-how appears to be greatest have traditionally been sidelined by multinational enterprises. According to the so-called Monterrey Consensus, achieved at the UN summit on financing for development in 2003, “a central challenge, therefore, is to create the necessary domestic and international conditions to facilitate direct investment flows (…) to developing countries, particularly Africa, least developed countries, small island developing states, and landlocked developing countries, and also to countries with economies in transition” (UN 2003: 9).
The rise of “new” foreign investors from emerging economies could help meet this challenge. This development could be highly relevant for the host countries of FDI, by providing better chances to attract more FDI. Potentially, investment promotion agencies have more options available to lure FDI from different sources (see also Sauvant 2008). Furthermore, FDI from emerging markets is widely perceived to be better adapted to local conditions in developing host countries. Hence, it could be especially those host countries that had been sidelined by direct investors from developed countries which can now benefit from non-traditional FDI flows.
www.economics-ejournal.org 42
Yet it is open to question under which conditions the policymakers in host countries effectively have more options to tap FDI from different sources. Much depends on whether the determinants of FDI differ systematically between traditional and non-traditional source countries. We performed Logit and Poisson Pseudo Maximum Likelihood estimations on bilateral FDI flows for large samples of source and host countries to address this question.
We find that the availability of superior technologies in advanced host countries was a minor driving force of FDI from non-traditional sources. This tends to be disguised by some large and publicized acquisitions of European and US firms by investors from emerging markets (e.g., the acquisitions of Arcelor by Mittal in the steel industry and IBM’s PC business by Lenovo). Asset-augmenting FDI may figure more prominently in the future. Policymakers in emerging economies could possibly expedite this process by supporting local MNEs and helping redress persistent constraints in absorbing superior technologies available in more advanced host countries.
Likewise, we find little evidence that FDI from non-traditional sources is mainly resource seeking. In contrast to widespread belief, the endowment of host countries with natural resources proved to be of minor importance for FDI from non-traditional sources, compared to FDI from traditional sources. This implies that the chances of policymakers in resource-poor countries to attract FDI from non-traditional sources are not systematically worse than in resource-rich countries. It has to be stressed, however, that data constraints prevent us from capturing the recent increase in resource-seeking FDI, notably by non-traditional source countries such as China, India, and Brazil.
Various host countries will find it as difficult to attract FDI from non-traditional sources as before from traditional sources. First of all, there is strong empirical support for the hypothesis that direct investors based in emerging markets are more discouraged than their peers based in developed countries to engage in more distant host countries. This holds for both stages of location choice, i.e., the decision to undertake any FDI at all as well as the decision on the amount of FDI in host countries having passed the gatekeeping stage. Accordingly, investment promotion agencies are well advised to target new sources of FDI in the closer neighborhood.
The evidence on the driving forces of horizontal and vertical FDI is more ambiguous. It appears that cost savings do not only motivate vertical FDI flows
www.economics-ejournal.org 43
from the most advanced source countries, even though the impact on FDI amounts tends to be weaker for non-traditional sources. By contrast, large and growing local markets are generally no less attractive for FDI from non-traditional sources than for FDI from traditional sources. This may impair the chances for small host countries with limited purchasing power to target new investors based in emerging markets as alternative sources of FDI. At least in the short run, it is clearly beyond the remit of policymakers in these host countries to escape this situation. This conclusion is corroborated by particularly strong agglomeration effects on FDI from non-traditional sources.
Most strikingly perhaps, our findings contradict the view that non-traditional investors are generally less risk adverse than their peers based in advanced source countries. The familiarity of non-traditional investors with macroeconomic instability, political discretion and corruption at home does not necessarily imply that the choice of foreign locations is less affected by such risk factors, even though country-specific circumstances and the measurement of risk may matter. Consequently, it would be self-defeating if policymakers in the host countries gave less priority to macroeconomic stabilization and containing political uncertainty by institutional reforms and better governance. This would not only deter traditional investors but also investors from emerging markets, even though future research may reveal that direct investors operating under difficult political and economic conditions at home may react differently to specific aspects of risk.
Acknowledgement: We would like to thank the reviewers and the co-editor for their assessment of our paper and useful suggestions and advice.
www.economics-ejournal.org 44
References: Anderson, J., & van Wincoop, E. (2003). Gravity with gravitas: A solution to the border
puzzle. American Economic Review, 93(1), 170–192. http://ideas.repec.org/a/aea/aecrev/v93y2003i1p170-192.html
Aykut, D., & Ratha, D. (2003). South-south FDI flows: How big are they? Transnational Corporations, 13(1), 149–176. http://archive.unctad.org/en/docs/iteiit20043_en.pdf#page=155
Baier, S. L., & Bergstrand, J. H. (2007). Do free trade agreements actually increase members’ international trade? Journal of International Economics, 71(1), 72–95. http://ideas.repec.org/a/eee/inecon/v71y2007i1p72-95.html
Bergstrand, J. H., & Egger, P. (2007). A knowledge-and-physical-capital model of international trade flows, foreign direct investment, and multinational enterprises. Journal of International Economics, 73(2), 278–308. http://ideas.repec.org/a/eee/inecon/v73y2007i2p278-308.html
Blonigen, B. A. (2005). A review of the empirical literature on FDI determinants. Atlantic Economic Journal, 33(4), 383–403. http://ideas.repec.org/a/kap/atlecj/v33y2005i4p383-403.html
Blonigen, B. A., Davies R. B, Waddell, G. R., & Naughton, H.T. (2007). FDI in space: Spatial autoregressive relationships in foreign direct investment. European Economic Review, 51(5), 1303–1325. http://ideas.repec.org/a/eee/eecrev/v51y2007i5p1303-1325.html
Boston Consulting Group (2006). The New Global Challengers: How 100 Top Companies from Rapidly Developing Economies are Challenging the World. Boston: Boston Consulting Group. http://www.bcg.com.cn/en/newsandpublications/publications/reports/report20060506001.html
Buch, C. M., Kleinert, J., Lipponer, A., & Toubal, F. (2005). Determinants and effects of foreign direct investment: Evidence from German firm-level data. Economic Policy, 20 (1), 52–110. http://ideas.repec.org/a/bla/ecpoli/v20y2005i41p52-110.html
Buckley, P. J., Clegg, L. J., Cross, A. R., Liu, X., Voss, H., & Zheng, P. (2007). The determinants of Chinese outward foreign direct investment. Journal of International Business Studies, 38(4), 499–518. http://ideas.repec.org/a/pal/jintbs/v38y2007i4p499-518.html
Busse, M., Königer, J., & Nunnenkamp, P. (2010). FDI promotion through bilateral investment treaties: More than a bit? Review of World Economics, 146(1), 146–177. http://ideas.repec.org/p/ner/ifwkie/infohdl10419-39891.html
www.economics-ejournal.org 45
Campanario, M. de Abreu, Stal, E., & da Silva, M. (2012). Outward FDI from Brazil and its policy context, 2012. Columbia FDI Profiles. Vale Columbia Center New York. http://academiccommons.columbia.edu/catalog/ac:148486
Carr, D. L., Markusen, J. R., & Maskus, K.E. (2001). Estimating the knowledge-capital model of the multinational enterprise. American Economic Review, 91(3), 693–708. http://ideas.repec.org/a/aea/aecrev/v91y2001i3p693-708.html
CEPII (2011). The CEPII Gravity Dataset. Internet Posting: http://www.cepii.fr/anglaisgraph/bdd/distances.htm (accessed: December 2011).
Chakrabarti, A. (2001). The determinants of foreign direct investment: Sensitivity analyses of cross-country regressions. Kyklos, 54(1), 89–114. http://ideas.repec.org/a/bla/kyklos/v54y2001i1p89-113.html
Cheung, Y.-W., de Haan, J., Qian, X. W., & Yu, S. (2012). China’s outward direct investment in Africa. Review of International Economics, 20(2), 201-220. http://ideas.repec.org/a/bla/reviec/v20y2012i2p201-220.html
Chudnovsky, D., & López, A. (2000). A third wave of FDI from developing countries: Latin American TNCs in the 1990s. Transnational Corporations, 9(2), 31–73. http://unctad.org/en/docs/iteiit21v9n2_en.pdf#page=37
Dunning, J. H. (1981). Explaining the international direct investment position of countries: Towards a dynamic or developmental approach. Weltwirtschaftliches Archiv, 117(1), 30–64. http://ideas.repec.org/a/spr/weltar/v117y1981i1p30-64.html
Dunning, J. H. (2001). The eclectic (OLI) paradigm of international production: Past, present and future. International Journal of the Economics of Business, 8(2), 173–190. http://ideas.repec.org/a/taf/ijecbs/v8y2001i2p173-190.html
Dunning, J. H., van Hoesel, R., & Narula, R. (1998). Third World multinationals revisited: New developments and theoretical implications. In J. H. Dunning (Ed.), Globalization, Trade and Foreign Direct Investment (pp. 255-286). Amsterdam: Elsevier.
Dunning, J. H., Kim, C., & Park, D. (2008). Old wine in new bottles: A comparison of emerging-market TNCs today and developed-country TNCs thirty years ago. In K. P. Sauvant (Ed.), The Rise of Transnational Corporations from Emerging Markets: Threat or Opportunity? (pp. 158-180). Cheltenham: Edward Elgar.
Eaton, J., & Tamura, A. (1994). Bilateralism and regionalism in Japanese and U.S. trade and direct foreign investment patterns. Journal of the Japanese and International Economies, 8(4), 478–510. http://ideas.repec.org/a/eee/jjieco/v8y1994i4p478-510.html
www.economics-ejournal.org 46
Egger, P. (2000). A note on the proper econometric specification of the gravity equation. Economics Letters, 66(1), 25–31. http://ideas.repec.org/a/eee/ecolet/v66y2000i1p25-31.html
Fajgelbaum, P. D., Grossman, G.M., & Helpman, E. (2011). A Linder hypothesis for foreign direct investment. Working Paper 17550. Cambridge, MA: NBER. http://ideas.repec.org/p/nbr/nberwo/17550.html
Feenstra, R. (2004). Advanced International Trade: Theory and Evidence. Princeton: Princeton University Press.
Gao, T. (2005). Foreign direct investment from developing Asia: Some distinctive features. Economics Letters, 86(1), 29–35. http://ideas.repec.org/a/eee/ecolet/v86y2005i1p29-35.html
Gill, J. (2001). Interpreting interactions and interaction hierarchies in generalized linear models: Issues and applications. Paper presented at the Annual Meeting of the American Political Science Association, San Francisco. http://www.artsci.wustl.edu/~jgill/papers/interactions3.pdf
Head, K., & Mayer, T. (2004). Market potential and the location of Japanese investment in the European Union. Review of Economics and Statistics, 86(4), 959–972. http://ideas.repec.org/a/tpr/restat/v86y2004i4p959-972.html
Head, K., & Ries, J. (2008). FDI as an outcome of the market for corporate control: Theory and evidence. Journal of International Economics, 74(1), 2–20. http://ideas.repec.org/a/eee/inecon/v74y2008i1p2-20.html
Head, K., Ries, J., & Swenson, D. (1995). Agglomeration benefits and location choice: Evidence from Japanese manufacturing investment in the United States. Journal of International Economics, 38(3–4), 223–247. http://ideas.repec.org/a/eee/inecon/v38y1995i3-4p223-247.html
Helpman, E., Melitz, M.J., & Yeaple, S.R. (2004). Export versus FDI with heterogeneous firms. American Economic Review, 94(1), 300–316. http://ideas.repec.org/a/aea/aecrev/v94y2004i1p300-316.html
Henisz, W. (2000). The institutional environment for multinational investment. Journal of Law, Economics and Organization, 16(2), 334–364. http://ideas.repec.org/a/oup/jleorg/v16y2000i2p334-64.html
Hernández, Z. (2008). Outward foreign direct investment from emerging markets: An annotated bibliography. In K. P. Sauvant (Ed.), The Rise of Transnational Corporations from Emerging Markets: Threat or Opportunity? (pp. 339-373). Cheltenham: Edward Elgar.
www.economics-ejournal.org 47
Herzer, D. (2011). The long-run relationship between outward foreign direct investment and total factor productivity: Evidence for developing countries. Journal of Development Studies 47 (5): 767-785. http://ideas.repec.org/p/got/iaidps/199.html
Hymer, S. H. (1976). The International Operations of National Firms: A Study of Direct Investment. Cambridge, MA: MIT Press.
Krugman, P. (1991). Increasing returns and economic geography. Journal of Political Economy, 99(3), 483–499. http://ideas.repec.org/a/ucp/jpolec/v99y1991i3p483-99.html
Lall, S. (1983). The New Multinationals: The Spread of Third World Enterprises. Chichester: John Wiley & Sons.
Linder, S. B. (1961). An Essay on Trade and Transformation. Uppsala: Almqvist & Wiksells.
Liu, W.-H., & Nunnenkamp, P. (2011). Domestic repercussions of different types of FDI: Firm-level evidence for Taiwanese manufacturing. World Development, 39(5), 808–823. http://ideas.repec.org/a/eee/wdevel/v39y2011i5p808-823.html
Luo, Y., & Tung, R. L. (2007). International expansion of emerging market enterprises: A springboard perspective. Journal of International Business Studies, 38(4), 481–498. http://ideas.repec.org/a/pal/jintbs/v38y2007i4p481-498.html
Mátyás, L. (1997). Proper econometric specification of the gravity model. World Economy, 20(3), 363–368. http://ideas.repec.org/a/bla/worlde/v20y1997i3p363-368.html
Moon, H.-C., & Roehl, T. W. (2001). Unconventional foreign direct investment and the imbalance theory. International Business Review, 10(2), 197–215. http://ideas.repec.org/a/eee/iburev/v10y2001i2p197-215.html
OECD (2002). Foreign Direct Investment for Development: Maximising Benefits, Minimising Costs. Paris: Organisation for Economic Co-operation and Development.
Pradhan, J. P. (2011). Emerging multinationals: A comparison of Chinese and Indian outward foreign direct investment. International Journal of Institutions and Economies, 3(1), 113–148. http://ideas.repec.org/a/umk/journl/v3y2011i1p113-148.html
Polak, J. (1996). Is APEC a natural regional trading bloc? A critique of the ‘gravity model’ of international trade. World Economy, 19(5), 533–543. http://onlinelibrary.wiley.com/doi/10.1111/j.1467-9701.1996.tb00695.x/abstract
Ramamurti, R. (2009a). Why study emerging market multinationals? In R. Ramamurti & J. V. Singh (Eds.), Emerging Multinationals in Emerging Markets (pp. 3-22). Cambridge: Cambridge University Press. http://dx.doi.org/10.1017/CBO9780511576485.001
www.economics-ejournal.org 48
Ramamurti, R. (2009b). What have we learned about emerging-market MNEs? In R. Ramamurti & J. V. Singh (Eds.), Emerging Multinationals in Emerging Markets (pp. 399-426). Cambridge: Cambridge University Press. http://gdex.dk/ofdi/68%20Ramamurti%20Ravi.pdf
Reisen, H., & Rieländer, J. (2011). Africa attracts FDI – but does it help? Mimeo.
Rugman, A. M. (2009). Theoretical aspects of MNEs from emerging economies. In R. Ramamurti & J. V. Singh (Eds.), Emerging Multinationals in Emerging Markets (pp. 42-63). Cambridge: Cambridge University Press. http://dx.doi.org/10.1017/CBO9780511576485.003
Santiso, J. (2007). The emergence of Latin multinationals. Deutsche Bank Research, Current Issues, March 7. Frankfurt. http://ideas.repec.org/p/pra/mprapa/12904.html
Santos Silva, J., & Tenreyro, S. (2006). The log of gravity. Review of Economics and Statistics, 88(4), 641–658. http://ideas.repec.org/a/tpr/restat/v88y2006i4p641-658.html
Sauvant, K. P. (2008). The rise of TNCs from emerging markets: The issues. In K. P. Sauvant (Ed.), The Rise of Transnational Corporations from Emerging Markets: Threat or Opportunity? (pp. 3-14). Cheltenham: Edward Elgar. http://www.vcc.columbia.edu/pubs/documents/KarlP.Sauvant-RiseofTNCs_000.pdf
Stiglitz, J. E. (2000). Capital market liberalization, economic growth, and instability. World Development, 28(6), 1075–1086. http://ideas.repec.org/a/eee/wdevel/v28y2000i6p1075-1086.html
The Economist (2008). The challengers: A new breed of multinational company has emerged. January 12, 58–60.
UN (2003). Monterrey Consensus of the International Conference on Financing for Development. New York: A/CONF, 198/11, chapter 1, resolution 1, annex. http://www.un.org/esa/ffd/monterrey/MonterreyConsensus.pdf (accessed: 5 January 2012).
UNCTAD (2006). World Investment Report 2006. New York and Geneva: United Nations.
UNCTAD (2011). World Investment Report 2011. New York and Geneva. United Nations.
Warin, T., Wunnava, P. V., & Janicki, H. (2009). Testing Mundell’s intuition of endogenous OCA theory. Review of International Economics, 17(1), 74–86. http://ideas.repec.org/a/bla/reviec/v17y2009i1p74-86.html
Wei, S.-J. (2000). How taxing is corruption on international investors? Review of Economics and Statistics, 82(1), 1–11. http://ideas.repec.org/a/tpr/restat/v82y2000i1p1-11.html
www.economics-ejournal.org 49
Wells jr., L. T. (1983). Third World Multinationals: The Rise of Foreign Investment from Developing Countries. Cambridge, MA: MIT Press. http://ideas.repec.org/b/mtp/titles/026273169x.html
Wells jr., L. T. (2009). Third World multinationals: A look back. In R. Ramamurti & J. V. Singh (Eds.), Emerging Multinationals in Emerging Markets (pp. 23-41). Cambridge: Cambridge University Press.
Wooldridge, J. M. (2002). Econometric Analysis of Cross Section and Panel Data. Cambridge, MA: MIT Press. http://ideas.repec.org/b/mtp/titles/0262232588.html
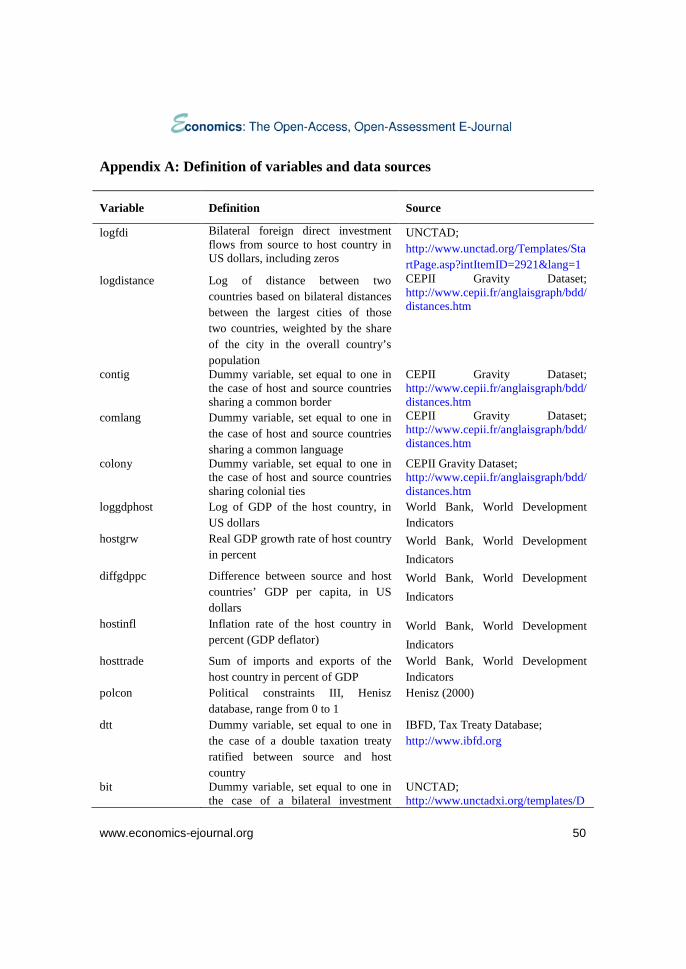
www.economics-ejournal.org 50
Appendix A: Definition of variables and data sources
Variable Definition Source
logfdi Bilateral foreign direct investment flows from source to host country in US dollars, including zeros
UNCTAD; http://www.unctad.org/Templates/StartPage.asp?intItemID=2921&lang=1
logdistance Log of distance between two countries based on bilateral distances between the largest cities of those two countries, weighted by the share of the city in the overall country’s population
CEPII Gravity Dataset; http://www.cepii.fr/anglaisgraph/bdd/distances.htm
contig Dummy variable, set equal to one in the case of host and source countries sharing a common border
CEPII Gravity Dataset; http://www.cepii.fr/anglaisgraph/bdd/distances.htm
comlang Dummy variable, set equal to one in the case of host and source countries sharing a common language
CEPII Gravity Dataset; http://www.cepii.fr/anglaisgraph/bdd/distances.htm
colony Dummy variable, set equal to one in the case of host and source countries sharing colonial ties
CEPII Gravity Dataset; http://www.cepii.fr/anglaisgraph/bdd/distances.htm
loggdphost Log of GDP of the host country, in US dollars
World Bank, World Development Indicators
hostgrw Real GDP growth rate of host country in percent
World Bank, World Development Indicators
diffgdppc Difference between source and host countries’ GDP per capita, in US dollars
World Bank, World Development Indicators
hostinfl Inflation rate of the host country in percent (GDP deflator)
World Bank, World Development Indicators
hosttrade Sum of imports and exports of the host country in percent of GDP
World Bank, World Development Indicators
polcon Political constraints III, Henisz database, range from 0 to 1
Henisz (2000)
dtt Dummy variable, set equal to one in the case of a double taxation treaty ratified between source and host country
IBFD, Tax Treaty Database; http://www.ibfd.org
bit Dummy variable, set equal to one in the case of a bilateral investment
UNCTAD; http://www.unctadxi.org/templates/D
www.economics-ejournal.org 51
treaty ratified between source and host country
ocSearch____779.aspx
rta Dummy variable, set equal to one in the case of a regional trade agreement with source and host country as members
WTO; http://www.wto.org/ english/tratop_e/region_e/region_e.htm
logfdistock Log of the stock of foreign direct investment in the host country in US dollars
UNCTAD http://unctadstat.unctad.org/ReportFolders/reportFolders.aspx
patents Patent applications by residents and non-residents, divided by total population in thousands
World Intellectual Property Organization http://www.wipo.int/ipstats/en/statistics/patents/
resourcedeplet Natural resources depletion in percent of gross national income; sum of net forest depletion, energy depletion, and mineral depletion.
World Bank, World Development Indicators
lrmp Log of real market potential computed using Head and Mayer (2004)’s method
Market Potential and Development CEPII working paper N° 2009-24. http://www.cepii.fr/anglaisgraph/bdd/marketpotentials.htm
investment Score of country investment risk, measuring contract viability/ expropriation, profits repatriation and payment delays; ranging from 0 (highest risk) to 12 (lowest risk).
International Country Risk Guide
emerging Dummy variable, set equal to one when the source country is an emerging economy
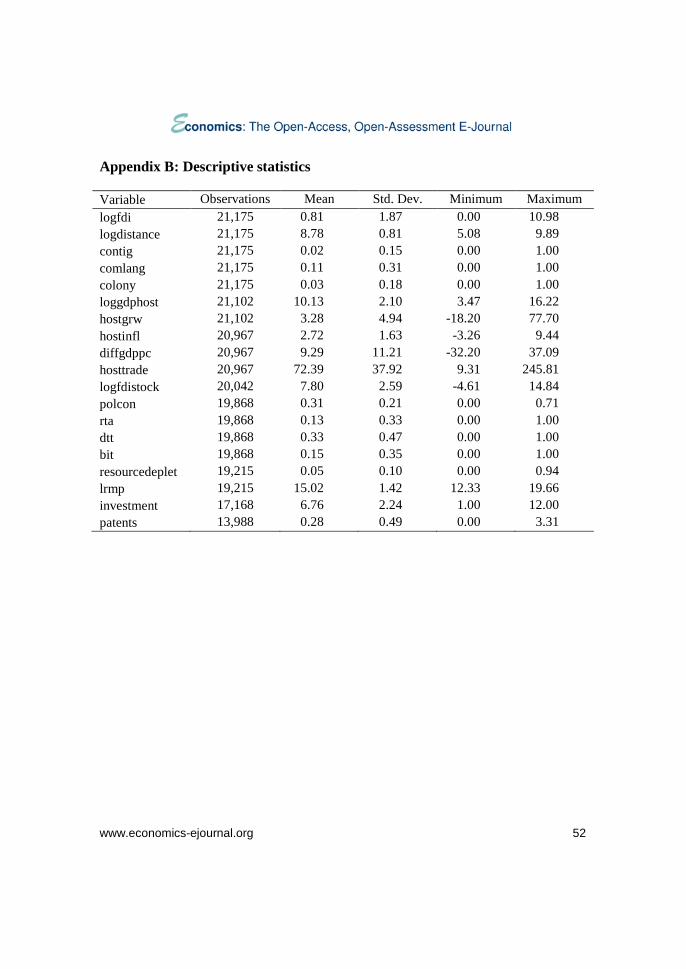
www.economics-ejournal.org 52
Appendix B: Descriptive statistics
Variable Observations Mean Std. Dev. Minimum Maximum logfdi 21,175 0.81 1.87 0.00 10.98 logdistance 21,175 8.78 0.81 5.08 9.89 contig 21,175 0.02 0.15 0.00 1.00 comlang 21,175 0.11 0.31 0.00 1.00 colony 21,175 0.03 0.18 0.00 1.00 loggdphost 21,102 10.13 2.10 3.47 16.22 hostgrw 21,102 3.28 4.94 -18.20 77.70 hostinfl 20,967 2.72 1.63 -3.26 9.44 diffgdppc 20,967 9.29 11.21 -32.20 37.09 hosttrade 20,967 72.39 37.92 9.31 245.81 logfdistock 20,042 7.80 2.59 -4.61 14.84 polcon 19,868 0.31 0.21 0.00 0.71 rta 19,868 0.13 0.33 0.00 1.00 dtt 19,868 0.33 0.47 0.00 1.00 bit 19,868 0.15 0.35 0.00 1.00 resourcedeplet 19,215 0.05 0.10 0.00 0.94 lrmp 19,215 15.02 1.42 12.33 19.66 investment 17,168 6.76 2.24 1.00 12.00 patents 13,988 0.28 0.49 0.00 3.31
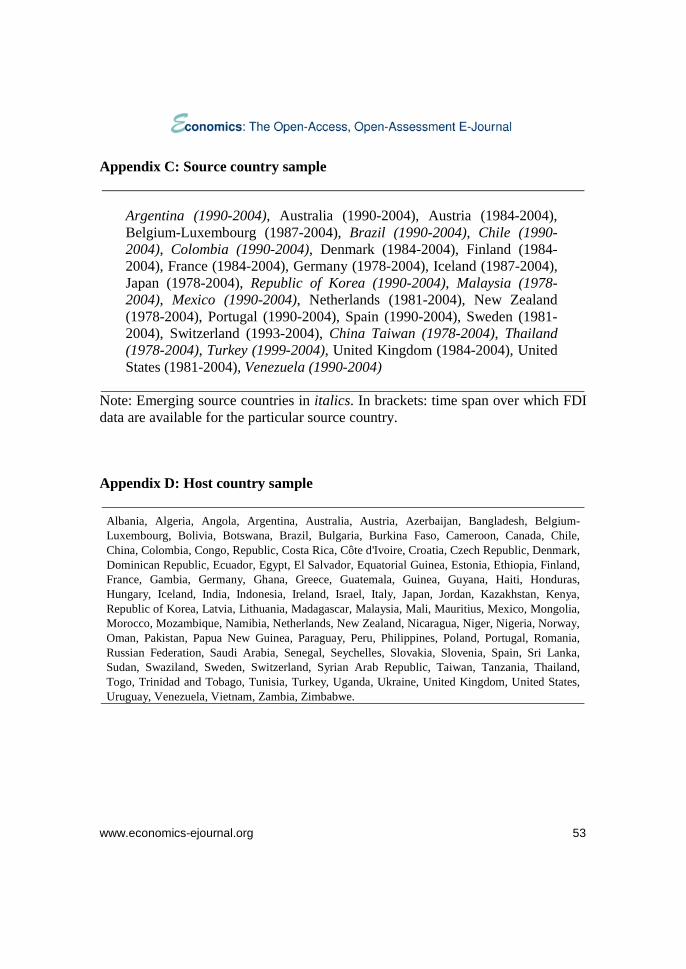
www.economics-ejournal.org 53
Appendix C: Source country sample
Argentina (1990-2004), Australia (1990-2004), Austria (1984-2004), Belgium-Luxembourg (1987-2004), Brazil (1990-2004), Chile (1990-2004), Colombia (1990-2004), Denmark (1984-2004), Finland (1984-2004), France (1984-2004), Germany (1978-2004), Iceland (1987-2004), Japan (1978-2004), Republic of Korea (1990-2004), Malaysia (1978-2004), Mexico (1990-2004), Netherlands (1981-2004), New Zealand (1978-2004), Portugal (1990-2004), Spain (1990-2004), Sweden (1981-2004), Switzerland (1993-2004), China Taiwan (1978-2004), Thailand (1978-2004), Turkey (1999-2004), United Kingdom (1984-2004), United States (1981-2004), Venezuela (1990-2004)
Note: Emerging source countries in italics. In brackets: time span over which FDI data are available for the particular source country.
Appendix D: Host country sample
Albania, Algeria, Angola, Argentina, Australia, Austria, Azerbaijan, Bangladesh, Belgium-Luxembourg, Bolivia, Botswana, Brazil, Bulgaria, Burkina Faso, Cameroon, Canada, Chile, China, Colombia, Congo, Republic, Costa Rica, Côte d'Ivoire, Croatia, Czech Republic, Denmark, Dominican Republic, Ecuador, Egypt, El Salvador, Equatorial Guinea, Estonia, Ethiopia, Finland, France, Gambia, Germany, Ghana, Greece, Guatemala, Guinea, Guyana, Haiti, Honduras, Hungary, Iceland, India, Indonesia, Ireland, Israel, Italy, Japan, Jordan, Kazakhstan, Kenya, Republic of Korea, Latvia, Lithuania, Madagascar, Malaysia, Mali, Mauritius, Mexico, Mongolia, Morocco, Mozambique, Namibia, Netherlands, New Zealand, Nicaragua, Niger, Nigeria, Norway, Oman, Pakistan, Papua New Guinea, Paraguay, Peru, Philippines, Poland, Portugal, Romania, Russian Federation, Saudi Arabia, Senegal, Seychelles, Slovakia, Slovenia, Spain, Sri Lanka, Sudan, Swaziland, Sweden, Switzerland, Syrian Arab Republic, Taiwan, Tanzania, Thailand, Togo, Trinidad and Tobago, Tunisia, Turkey, Uganda, Ukraine, United Kingdom, United States, Uruguay, Venezuela, Vietnam, Zambia, Zimbabwe.
Please note:
You are most sincerely encouraged to participate in the open assessment of this article. You can do so by either recommending the article or by posting your comments.
Please go to:
http://dx.doi.org/10.5018/economics-ejournal.ja.2013-1
The Editor
© Author(s) 2013. Licensed under the Creative Commons License Attribution 3.0.