fast fast foforwrw ard - BorgWarner
116
2013 ANNUAL REPORT ON FORM 10-K fast forward fast forward
Transcript of fast fast foforwrw ard - BorgWarner

2 0 1 3 A N N U A L R E P O R T O N F O R M 1 0 - K
fast forwardfast forward

Dear Stockholder
This broader vision moves beyond the
powertrain products we produce to how and
why we make them. It encompasses key
trends that continue to gain importance
across the globe. We believe our product
portfolio and operating model are wholly
aligned with this vision. In true BorgWarner fash-
ion, the new broader vision has re-energized
the company around creating innovative
products and developing, monitoring and
communicating clearly defined sustainability
initiatives at our facilities aimed at using our
natural resources wisely and producing
environmentally friendly solutions.
Our Strong Track Record in 2013 Drives Our Strong Outlook for 2014 Our talented global workforce continued to
execute BorgWarner’s strategy and leverage
our leading-edge technologies to propel the
company forward in 2013. This execution,
coupled with our strong business model, will
drive the company’s success for years to
come. We expect to continue to outperform
the market as BorgWarner’s long-term
vision and strategy evolve to best serve
our customers and shareholders.
Fast Forward: Refining Our Vision, Mission and Key Strategies During the “Fast Forward: The Next 10
Years” conference held in November,
BorgWarner gathered 140 of the company’s
leaders from around the world to discuss
the vision, mission and strategies that will
accelerate our success. While we’re still on
the same road, the entire enterprise has
sharpened its focus on our destination.
Sales GrowthBillions of Dollars
'13
'06
'07
'08
'09
'10
‘11
‘12
$7.4
$4.6
$5.3
$5.3
$4.0
$5.7
$7.1
$7.2
Earnings Performance*Per Diluted Share *Excludes special items.
$2.89
$1.02
$1.22
$1.04
$0.20
$2.49
$2.23
'13
'06
'07
'08
'09
‘10
‘11
‘12
$1.51
1
James Verrier,
President and
Chief Executive Officer
At the event, we introduced our revised vision:
A Clean, Energy-Efficient World.

This revised vision closely aligns with our new mission: to Deliver Innovative Powertrain Solutions that Improve Fuel Economy, Emissions & Performance. The successful execution of our mission continues to
drive BorgWarner’s growth.
Importantly, the core beliefs by which we run the company remain unchanged:
• Respect for Each Other,• Power of Collaboration, • Passion for Excellence,
• Personal Integrity and • Responsibility to Our Communities
S T R A T E G Y :
Drive Intense Focus on Product Leadership and Process Innovation Product leadership and innovation have always been key differentiators for BorgWarner. We are re-emphasizing
our focus onmanufacturing technology recognizing that it is also key to our differentiation strategy.
S T R A T E G Y :
Manage Our Product and Customer Portfolio for Sustainable Profitable Growth To ensure BorgWarner’s profitable growth over the long-term, we will continue to actively strengthen our
product portfolio and customer relationships, as our customers are now, more than ever, seeking new
technologies to gain a competitive edge in the market.
S T R A T E G Y :
Passion for Quality and Excellence in Everything We Do Our passion for quality and excellence is not limited to products. It is a deeper commitment that encompasses
all aspects of the business and embodies a key component of BorgWarner’s culture.
S T R A T E G Y :
Develop, Retain, and Attract Talent to Execute Our Strategies The “can-do” attitude of our employees has always driven the innovations that built BorgWarner’s success and
its proven ability to prosper through various economic environments and industry transitions. We have a successful
track record of integrating new employees into the BorgWarner team every year, and we expect to bring on an
additional 10,000 employees by the end of the decade to allow us to fulfill our growth potential.
S T R A T E G Y :
One BorgWarner Business Culture and Operating Model to Drive Speed and Agility The One BorgWarner Culture represents the company’s core values as well as the continuity we have built
across our global team. BorgWarner provides its plants with global resources, while nurturing the entrepreneurial
spirit, autonomy and responsibility needed locally to innovate and grow. Throughout the company, our operating
model is focused on serving our customers’ evolving needs and addressing them with speed and agility.
As we move forward and maintain our growth trajectory, we have simplified our long-term strategy into five core imperatives:
B O R G W A R N E R S T O C K H O L D E R S ’ L E T T E R 2 0 1 3 2

3
During the year, our strong balance sheet
and cash flow enabled us to execute a
number of important initiatives as part of our
balanced approach to capital allocation:
• In July, the Board initiated a quarterly
cash dividend of $0.125 per share
of common stock (split adjusted),
which will remain an important
component of our balanced capital
allocation strategy going forward.
• We repurchased approximately 5.2 million
shares in 2013 and will continue to
opportunistically return capital to
shareholders through share repurchases.
• The company signed an agreement to acquire
Wahler, a producer of exhaust gas recirculation
(EGR) valves, EGR tubes and thermostats.
An excellent fit from a technology and
geographical standpoint, this acquisition will
strengthen BorgWarner’s strategic position
as a producer of complete EGR systems
and enhance our capabilities in thermal
management. Going forward, we will maintain
our disciplined acquisition strategy with a
specific focus on technology.
• We continued to make strategic investments
in our businesses across the globe in 2013.
This included the expansion of our already
strong position in Europe with new facilities
Record Successes in 2013
2013 was another great year for BorgWarner.
From an operational and financial standpoint,
the company achieved record revenues of
$7.4 billion and earnings of $2.89 per diluted
share, excluding non-comparable items.
Even more impressively, this profitable
growth came amidst the ongoing, challenging
macroeconomic environment, particularly
for European and global commercial
vehicle markets. Our industry-leading
operating income margin reached a record
12.4%, excluding non-comparable items,
driven by operational efficiency and cost
controls. This outstanding performance
highlights our manufacturing proficiency,
our innovative product portfolio and our key
long-standing customer relationships.
We continued to create substantial value
for our shareholders with total returns of
57% in 2013 with our share price reaching
an all-time high. In December, we also made
the important decision to split our stock.
in Portugal and Poland, driven by increasing
demand for environmentally friendly and
fuel-efficient technologies, such as our EGR
product lines. We also expanded our presence
in emerging markets, which included a new
plant in India, as well as a new produc-
tion facility and engineering center in
Brazil, which was driven by new legislation
to improve fuel economy and reduce
emissions in this rapidly growing South
American market.
We were able to complete these important
initiatives while maintaining our investment
grade credit rating, a clear signal that our
balance sheet remains strong and provides
flexibility for the future. Going forward, we
will continue to manage our capital deployment
prudently, with a priority on reinvesting in the
business and pursuing strategic acquisitions,
while returning cash to our shareholders.
BorgWarner also achieved a number of other
notable accomplishments through the year, and
we continue to be recognized for our industry-
leading innovations and technologies.
net sales
$7.4 billion
operating income margin
12.4%
earnings per share
$2.89
2 0 1 3 – S E T T I N G N E W R E C O R D S

B O R G W A R N E R S T O C K H O L D E R S ’ L E T T E R 2 0 1 3 4
• We received awards from GM,
Daimler, Renault, BMW and Ford
for delivery reliability, quality and
innovation – tangible recognition
of our employees’ dedication
to excellence.
Driving Growth in 2014
BorgWarner has a strong foundation in place
for continued growth. Across our portfolio
of leading powertrain technologies, we are
constantly seeking to enhance our already
strong competitive position through innovation,
operational excellence, and customer and
geographic diversity.
Our product innovation and design process,
combined with innovative manufacturing
technology, allows us to grow our
long-standing customer relationships with
every major OEM worldwide. Understanding
our customers allows us to address
their critical needs and remains a
key component to our success.
Clearly, the development of
our innovative technologies
requires investment. We remain
committed to fueling product
innovation through our strategic
focus on R&D spending, regardless of
market conditions. To further boost our focus
on technology, we appointed a new Chief
Technology Officer, ensuring that we have
the right pipeline of technologies in place to
anticipate and capitalize on our customers’
needs in the ever-changing, competitive
landscape. We have also made several
focused engineering hires in 2013, and
instituted an annual innovation symposium
and a venture capital fund to foster innovation
throughout the enterprise.
While we continue to maintain our growth
trajectory through engineering and product
leadership, we will increasingly leverage our
• Our regulated three-stage (R3S)
turbocharging system for diesel
engines earned a prestigious
2013 Automotive News PACE
Award – our seventh award in nine
years – as well as a PACE Innovation
Partnership Award for our collaboration
with BMW on the R3S system. PACE
stands for Premier Automotive Supplier’s
Contribution to Excellence. In addition,
BorgWarner’s Eco-Launch solenoid valve has
been named a finalist for a 2014 PACE Award.
• We presented five CEO’s Safety Excellence
Awards to our plants in 2013, a record
for the company. The award is achieved
through one million hours or three consecutive
years worked without a recordable incident.
Moreover, the awards were earned at facilities
in Brazil, China, Hungary, the United States
and South Korea, a further testament
to the culture we have established
throughout BorgWarner’s operations
around the world.
• We launched several high
profile programs in 2013
including: EGR coolers
for Renault’s 1.6-liter diesel
engine, available on the
European Scénic and Mégane as well as
Nissan’s crossover Qashqai; DualTronic®
control modules and clutch modules for
SAIC Motor Corporation’s new six-speed
wet dual-clutch transmission in China;
and the world’s first electronic limited slip
differential for a front-wheel drive vehicle
on the 2013 Volkswagen Golf GTI with
Performance Pack.
operational excellence standards to capture
additional market share and drive our
world-class performance. Our strong
leadership team based around the globe
has the autonomy and support to run their
businesses, an operating philosophy that
will remain a cornerstone of our success.
These market-leading positions align with
our robust backlog. BorgWarner’s optimistic
growth outlook of $2.9 billion of expected net
new powertrain business for 2014 through
2016 is up 26% from the previous three-year
net new business announced in November.
From a product perspective, our growth
will be driven by demand for advanced
powertrain technologies that improve fuel
economy, reduce emissions and enhance
performance for virtually all vehicle types,
from passenger cars and heavy-duty trucks
to commercial vehicles and construction
equipment. The benefits our products offer
are becoming increasingly important to
automakers and consumers around the
world. Our backlog of net new business
proves BorgWarner’s global leadership.
$2.9 billion of expected net new
powertrain business
is expected for
2014 through 2016

5
BorgWarner Driven
Although BorgWarner’s strategic initiatives
and growth engines are vital to accelerating
our long-term growth, we know that our success
is built on our global talent and culture.
Across the entire BorgWarner enterprise,
talent and culture have a symbiotic relationship.
Our culture draws the type of talent that
we need to grow, while the infusion of
new talent across our worldwide locations
enriches our culture of respect, collaboration,
excellence, integrity and responsibility.
BorgWarner’s highly developed organi-
zational structure focuses on attracting,
developing and retaining world class talent
to drive innovation. A key differentiator for
BorgWarner, talent is critical to achieving
our superior industry growth, margins and
market share. As a management team,
we are committed to nurturing and
empowering our team to build upon the
tremendous success BorgWarner has
attained over the past 20 years. We look
forward to a strong start to 2014 and
continued success for many years to come.
James Verrier,
President and Chief Executive Officer
Customer and geographic diversification
also support our backlog of net new
business. The European market accounts
for approximately 27% of our expected
new business. While Europe remains an
important market for BorgWarner, the
adoption of our advanced powertrain
technology in other parts of the world is
expected to outpace Europe over the next
few years. In Asia, our new business sales
are expected to account for approximately
47% of net new business by the end of
the period, primarily driven by China,
the world’s fastest growing market. The
Americas are expected to account for
about 27% of new business over the three
years, including 19% from North American
domestic OEMs compared with 11% in
the prior three-year period.
Our backlog’s regional mix is well-aligned
with global auto trends and also reflects
the shift in BorgWarner’s manufacturing
footprint to lower cost economies. The top
five customers in the backlog are Ford,
General Motors, Great Wall, Hyundai/Kia
and Volkswagen, a diverse group from a
geographic perspective. Eight of our top 25
customers are Chinese OEMs. BorgWarner
is also diversifying from a market perspective,
with five of our top 25 customers in the
commercial vehicle market.Approximately 47% of our net new business sales
is expected to be generated
by Asia in 2014 through 2016

B O R G W A R N E R S T O C K H O L D E R S ’ L E T T E R 2 0 1 3 6
Turbochargers Leading designer and manufacturer of turbochargers and actuators for passenger cars, light trucks and commercial vehicles. Turbochargers increase power for a given engine size, enhance fuel efficiency and reduce emissions.
BERU Systems A worldwide leading supplier of glow plugs and instant starting systems that enhance combustion for diesel engines during cold starts, pressure sensor glow plugs that also monitor the combustion process of a diesel engine and advanced ignition technology for gasoline engines.
Morse TEC Global leader in the design and manufacture of engine timing systems, including variable cam timing (VCT), that enable precise control of air and exhaust flow through the engine, improving fuel economy and emissions. Also a global leader in the design and manufacture of HY-VO® front-wheel drive transmission chain and four-wheel drive chain for light vehicles.
Emissions Systems A global leader in the design and supply of exhaust gas recirculation (EGR) systems and electric air pumps for enhanced engine performance, fuel economy, and reduced emissions.
Thermal Systems A leading provider of products and systems designed to optimize engine temperatures and minimize parasitic horsepower losses, which improve engine efficiency, fuel economy and emissions performance.
Cooling Systems
Engine TimingRegulated Two-Stage Turbocharger
Diesel Cold-Start Technology
Exhaust Gas Recirculation
Cam Torque Actuated Variable Cam Timing
K E Y T E C H N O L O G I E S
Engine S E G M E N T
SALES in Millions of Dollars $4
,913
M
$5,0
22M
$2,8
83 M $4
,061
M $5,0
51M
‘13 ‘09 ‘10 ‘11 ‘12
The Engine Segment develops air management
strategies and products to optimize engines for
fuel efficiency, reduced emissions and enhanced
performance. BorgWarner’s expertise in engine timing
systems, boosting systems, ignition systems, air
and noise management, cooling and controls is the
foundation for this collaboration in development.
K E Y T E C H N O L O G I E S
Transmission Products A global designer and manufacturer of automatic transmission components and modules and supplier to virtually every major automatic transmission manufacturer in the world. Friction and mechanical products include dual clutch modules, friction clutch modules, friction and steel plates, transmission bands, torque converter clutches, one-way clutches and torsional vibration dampers. Controls products feature electro-hydraulic solenoids for standard and high pressure hydraulic systems, transmission solenoid modules and dual clutch control modules.
Torque Management Leading global designer and producer of torque management products including coupling systems for front-wheel drive vehicles and transfer cases for rear-wheel drive applications, focused on electronically controlled torque management devices that will enhance stability, security and drivability of passenger cars, crossover vehicles, SUVs and light trucks.
Drivetrain S E G M E N T
SALES in Millions of Dollars
The Drivetrain Segment harnesses a legacy of more than
100 years as an industry innovator in transmission and
all-wheel drive technology. The group is leveraging its
understanding of powertrain clutching technology to
develop interactive control systems and strategies for
all types of torque management.
‘13 ‘09 ‘10 ‘11 ‘12
$2,2
99 M
$1,6
11 M
$2,0
85 M
$2,4
47
M
$1,0
94 M
All-Wheel Drive Transfer Cases
TransmissionFriction Products
DualTronic™ Transmission Clutch Modules
Transmission One-Way Clutches
TransmissionControl Modules
GenerationV All-Wheel Drive
BorgWarner will provide its full financial report electronically as part of its environmental initiative to conserve resources and reduce costs. For more information on the company’s financial performance and sustainability initiatives, please visit our website at borgwarner.com.

7
Total Shareholder Return$100 invested on 12/31/08 in stock or index, including reinvestment of dividends. Fiscal year ending December 31.
BorgWarner Inc. S&P 500
Peer Group SIC Code Index
$0
$100
$200
$300
$400
$500
$600
Peer
SIC
S&P
BW
201320122011201020092008 Net New Business 2014 thru 2016$2.9 Billion of Net New Business – By Product
Engine – 78%
Drivetrain – 22%
7% DCT Modules
8% Emissions Systems 11% All-Wheel Drive
23% Gas Turbochargers
28% Diesel Turbochargers
13% Engine Timing and VCT
4% Traditional Transmission Components
3% Thermal Systems
3% Ignition Systems
Asian OEMs 2%
Toyota 4%
Hyundai/Kia 4%
Nissan 1%
12% VW/Audi
3% Commercial Vehicles
10% Other
6% Daimler
3% BMW
3% Renault
1% Fiat1% GM1% PSA
Honda 1%
China 10%
Other 7%
Ford 7%
Chrysler 5%
GM 4%Commercial Vehicles 5%
Other 5%
5% Ford
*NSK-Warner included **NSK-Warner excluded
Customer Diversity Worldwide 2014 Sales Outlook*
Asia ~26%* 22%**
Americas ~28%* 30%**
Europe ~46%* 48%**

UNITED STATESSECURITIES AND EXCHANGE COMMISSION
Washington D.C. 20549
Form 10-KANNUAL REPORT
(Mark One)Í Annual Report Pursuant to Section 13 or 15(d) of
the Securities Exchange Act of 1934For the fiscal year ended December 31, 2013
OR‘ Transition Report Pursuant to Section 13 or 15(d) of
the Securities Exchange Act of 1934For the transition period from to
Commission File Number: 1-12162
BorgWarner Inc.(Exact name of registrant as specified in its charter)
Delaware 13-3404508State or other jurisdiction ofIncorporation or organization
(I.R.S. Employer Identification No.)
3850 Hamlin Road,Auburn Hills, Michigan 48326
(Address of principal executive offices) (Zip Code)
Registrant’s telephone number, including area code: (248) 754-9200Securities registered pursuant to Section 12(b) of the Act:
Title of each className of each exchange on
which registered
Common Stock, par value $0.01 per share . . . . . . . . . . . . . . . . . . . . . . . . . . . . . . . . . . . . . . . . . New York Stock Exchange
Securities registered Pursuant to Section 12(g) of the Act: None
Indicate by check mark if the registrant is a well-known seasoned issuer, as defined in Rule 405 of the Securities Act.Yes Í No ‘
Indicate by check mark if the registrant is not required to file reports pursuant to Section 13 or Section 15(d) of the Act.Yes ‘ No Í
Indicate by check mark whether the registrant (1) has filed all reports required to be filed by Section 13 or 15(d) of the SecuritiesExchange Act of 1934 during the preceding 12 months (or for such shorter period that the registrant was required to file such reports), and(2) has been subject to such filing requirements for the past 90 days.
Yes Í No ‘
Indicate by check mark whether the registrant has submitted electronically and posted on its corporate Web site, if any, everyInteractive Data File required to be submitted and posted pursuant to Rule 405 of Regulation S-T during the preceding 12 months (or forsuch shorter period that the registrant was required to submit and post such files).
Yes Í No ‘
Indicate by check mark if disclosure of delinquent filers pursuant to Item 405 of Regulation S-K (§ 229.405 of this chapter) is notcontained herein, and will not be contained, to the best of registrant’s knowledge, in definitive proxy or information statements incorporatedby reference in Part III of this Form 10-K or any amendment to this Form 10-K Í
Indicate by check mark whether the registrant is a large accelerated filer, an accelerated filer, a non-accelerated filer, or a smallerreporting company. See the definitions of “large accelerated filer,” “accelerated filer” and “smaller reporting company” in Rule 12b-2 of theExchange Act. (Check one):
Large accelerated filer Í Accelerated filer ‘ Non-accelerated filer ‘ Smaller reporting company ‘(Do not check if a smaller reporting company)
Indicate by check mark whether the registrant is a shell company (as defined in Rule 12b-2 of the Exchange Act).Yes ‘ No Í
The aggregate market value of the voting common stock of the registrant held by stockholders (not including voting commonstock held by directors and executive officers of the registrant) on June 28, 2013 (the last business day of the most recentlycompleted second fiscal quarter) was approximately $9.9 billion.
As of February 7, 2014, the registrant had 227,944,747 shares of voting common stock outstanding.
DOCUMENTS INCORPORATED BY REFERENCE
Portions of the following documents are incorporated herein by reference into the Part of the Form 10-K indicated.
Document
Part of Form 10-Kinto which
incorporated
Portions of the BorgWarner Inc. Proxy Statement for the 2014 Annual Meeting of Stockholders . . . . . . . . . . . . . . . . . . Part III

BORGWARNER INC.
FORM 10-K
YEAR ENDED DECEMBER 31, 2013
INDEX
Page No.
PART I.
Item 1. Business . . . . . . . . . . . . . . . . . . . . . . . . . . . . . . . . . . . . . . . . . . . . . . . . . . . . . . . . . . . . 4
Item 1A. Risk Factors . . . . . . . . . . . . . . . . . . . . . . . . . . . . . . . . . . . . . . . . . . . . . . . . . . . . . . . . . 14
Item 1B. Unresolved Staff Comments . . . . . . . . . . . . . . . . . . . . . . . . . . . . . . . . . . . . . . . . . . . 20
Item 2. Properties . . . . . . . . . . . . . . . . . . . . . . . . . . . . . . . . . . . . . . . . . . . . . . . . . . . . . . . . . . . 21
Item 3. Legal Proceedings . . . . . . . . . . . . . . . . . . . . . . . . . . . . . . . . . . . . . . . . . . . . . . . . . . . . 22
Item 4. Mine Safety Disclosures . . . . . . . . . . . . . . . . . . . . . . . . . . . . . . . . . . . . . . . . . . . . . . . 22
PART II.
Item 5. Market for the Registrant’s Common Equity, Related Stockholder Matters and
Issuer Purchases of Equity Securities . . . . . . . . . . . . . . . . . . . . . . . . . . . . . . . . . . . . 22
Item 6. Selected Financial Data . . . . . . . . . . . . . . . . . . . . . . . . . . . . . . . . . . . . . . . . . . . . . . . 25
Item 7. Management’s Discussion and Analysis of Financial Condition and Results of
Operations . . . . . . . . . . . . . . . . . . . . . . . . . . . . . . . . . . . . . . . . . . . . . . . . . . . . . . . . . . 26
Item 7A. Quantitative and Qualitative Disclosures About Market Risk . . . . . . . . . . . . . . . . . . 49
Item 8. Financial Statements and Supplementary Data . . . . . . . . . . . . . . . . . . . . . . . . . . . . 49
Item 9. Changes in and Disagreements With Accountants on Accounting and Financial
Disclosure . . . . . . . . . . . . . . . . . . . . . . . . . . . . . . . . . . . . . . . . . . . . . . . . . . . . . . . . . . 98
Item 9A. Controls and Procedures . . . . . . . . . . . . . . . . . . . . . . . . . . . . . . . . . . . . . . . . . . . . . . 98
Item 9B. Other Information . . . . . . . . . . . . . . . . . . . . . . . . . . . . . . . . . . . . . . . . . . . . . . . . . . . . 98
PART III.
Item 10. Directors, Executive Officers and Corporate Governance . . . . . . . . . . . . . . . . . . . . 99
Item 11. Executive Compensation . . . . . . . . . . . . . . . . . . . . . . . . . . . . . . . . . . . . . . . . . . . . . . 99
Item 12. Security Ownership of Certain Beneficial Owners and Management and Related
Stockholder Matters . . . . . . . . . . . . . . . . . . . . . . . . . . . . . . . . . . . . . . . . . . . . . . . . . . 99
Item 13. Certain Relationships and Related Transactions and Director Independence . . . . 99
Item 14. Principal Accountant Fees and Services . . . . . . . . . . . . . . . . . . . . . . . . . . . . . . . . . . 99
PART IV.
Item 15. Exhibits and Financial Statement Schedules . . . . . . . . . . . . . . . . . . . . . . . . . . . . . . 99
2

CAUTIONARY STATEMENTS FOR FORWARD-LOOKING INFORMATION
Statements contained in this Form 10-K (including Management’s Discussion and Analysis of
Financial Condition and Results of Operations) may contain forward-looking statements as
contemplated by the 1995 Private Securities Litigation Reform Act (the “Act”) that are based on
management’s current outlook, expectations, estimates and projections. Words such as “anticipates,”
“believes,” “continues,” “could,” “designed,” “effect,” “estimates,” “evaluates,” “expects,”
“forecasts,” “goal,” “initiative,” “intends,” “outlook,” “plans,” “potential,” “project,” “pursue,” “seek,”
“should,” “target,” “when,” “would,” variations of such words and similar expressions are intended to
identify such forward-looking statements. All statements, other than statements of historical fact
contained or incorporated by reference in this Form 10-K, that we expect or anticipate will or may
occur in the future regarding our financial position, business strategy and measures to implement that
strategy, including changes to operations, competitive strengths, goals, expansion and growth of our
business and operations, plans, references to future success and other such matters, are forward-
looking statements. Accounting estimates, such as those described under the heading “Critical
Accounting Policies” in Item 7 of this Annual Report on Form 10-K, are inherently forward-looking.
These statements are based on assumptions and analyses made by us in light of our experience and
our perception of historical trends, current conditions and expected future developments, as well as
other factors we believe are appropriate in the circumstances. Forward-looking statements are not
guarantees of performance and the Company’s actual results may differ materially from those
expressed, projected or implied in or by the forward-looking statements.
You should not place undue reliance on these forward-looking statements, which speak only as
of the date of this Annual Report. Forward-looking statements are subject to risks and uncertainties,
many of which are difficult to predict and generally beyond our control. Such risks and uncertainties
include: fluctuations in domestic or foreign vehicle production, the continued use by original
equipment manufacturers of outside suppliers, fluctuations in demand for vehicles containing our
products, changes in general economic conditions, as well as the other risks noted under Item 1A,
“Risk Factors,” and in other reports that we file with the Securities and Exchange Commission. We do
not undertake any obligation to update or announce publicly any updates to or revision to any of the
forward-looking statements in this Form 10-K to reflect any change in our expectations or any change
in events, conditions, circumstances, or assumptions underlying the statements.
This section and the discussions contained in Item 1A, “Risk Factors,” and in Item 7, subheading
“Critical Accounting Policies” in this report, are intended to provide meaningful cautionary statements
for purposes of the safe harbor provisions of the Act. This should not be construed as a complete list
of all of the economic, competitive, governmental, technological and other factors that could
adversely affect our expected consolidated financial position, results of operations or liquidity.
Additional risks and uncertainties not currently known to us or that we currently believe are immaterial
also may impair our business, operations, liquidity, financial condition and prospects.
3

PART I
ITEM 1. BUSINESS
BorgWarner Inc. and Consolidated Subsidiaries (the “Company”) is a Delaware corporation
incorporated in 1987. We are a leading global supplier of highly engineered automotive systems and
components primarily for powertrain applications. Our products help improve vehicle performance,
fuel efficiency, stability and air quality. These products are manufactured and sold worldwide,
primarily to original equipment manufacturers (“OEMs”) of light vehicles (passenger cars, sport-utility
vehicles (“SUVs”), vans and light trucks). The Company’s products are also sold to other OEMs of
commercial vehicles (medium-duty trucks, heavy-duty trucks and buses) and off-highway vehicles
(agricultural and construction machinery and marine applications). We also manufacture and sell our
products to certain Tier One vehicle systems suppliers and into the aftermarket for light, commercial
and off-highway vehicles. The Company operates manufacturing facilities serving customers in the
Americas, Europe and Asia and is an original equipment supplier to every major automotive OEM in
the world.
Financial Information About Reporting Segments
Refer to Note 18, “Reporting Segments and Related Information,” to the Consolidated Financial
Statements in Item 8 of this report for financial information about the Company’s reporting segments.
Narrative Description of Reporting Segments
The Company reports its results under two reporting segments: Engine and Drivetrain. Net sales
by reporting segment for the years ended December 31, 2013, 2012 and 2011 are as follows:
Year Ended December 31,
(millions of dollars) 2013 2012 2011
Engine . . . . . . . . . . . . . . . . . . . . . . . . . . . . . . . . . . . . . . . . . . $5,022.1 $4,913.0 $5,050.6
Drivetrain . . . . . . . . . . . . . . . . . . . . . . . . . . . . . . . . . . . . . . . 2,446.5 2,298.7 2,084.5
Inter-segment eliminations . . . . . . . . . . . . . . . . . . . . . . . . . (32.0) (28.5) (20.4)
Net sales . . . . . . . . . . . . . . . . . . . . . . . . . . . . . . . . . . . . . . $7,436.6 $7,183.2 $7,114.7
The sales information presented above excludes the sales by the Company’s unconsolidated
joint ventures (See sub-heading “Joint Ventures”). Such unconsolidated sales totaled approximately
$756 million, $871 million and $817 million for the years ended December 31, 2013, 2012 and 2011,
respectively.
Engine
The Engine Segment develops and manufactures products to improve fuel economy, reduce
emissions and enhance performance. Increasingly stringent regulation of, and consumer demand for,
better fuel economy and emissions performance are driving demand for the Engine Segment’s
products in gasoline and diesel engines and alternative powertrains. The Engine Segment’s products
include: turbochargers, timing systems, emissions systems, thermal systems, diesel cold start and
gasoline ignition technology.
Turbochargers provide several benefits including increased power for a given engine size,
improved fuel economy and reduced emissions. The Engine Segment has benefited from the growth
in turbocharger demand around the world for both diesel and gasoline engines. The Engine Segment
provides turbochargers for light, commercial and off-highway applications for diesel and gasoline
4

engine manufacturers in the Americas, Europe and Asia. The Engine Segment also designs and
manufactures turbo actuators using integrated electronics to precisely control turbocharger speed
and pressure ratio.
Sales of turbochargers for light vehicles represented approximately 26% of total net sales for the
years ended December 31, 2013, 2012 and 2011. The Engine Segment currently supplies
turbochargers to many OEMs including BMW, Daimler, Fiat, Ford, Geely, General Motors, Great Wall,
Hyundai, PSA, Renault and Volkswagen. The Engine Segment also supplies turbochargers to several
commercial vehicle and off-highway OEMs including Caterpillar, Daimler, Deutz, John Deere, MAN
and Navistar.
The Engine Segment’s newest turbocharger technologies are its regulated two-stage
turbocharging system, known as R2S®, regulated 3-stage turbocharging systems (“R3S”), variable
turbine geometry (“VTG”) turbochargers and turbochargers for gasoline direct injected engines, all of
which may be found in numerous applications around the world. For example, the Engine Segment
supplies its award winning R2S® turbocharger technology to BMW’s, Daimler’s and Volkswagen’s
four- and six-cylinder common-rail diesel engines and its R3S turbocharger system, an industry first,
to BMW for its new high-powered 3.0 liter diesel engine. Also, the Engine Segment supplies VTG
turbochargers to Renault’s 1.6 liter R9M diesel engine, featured in various Renault and Nissan
vehicles and to Great Wall for its 2.0 liter diesel engine. Ford selected the Engine Segment’s leading
gasoline turbocharger technology for its new 1.5 liter, 1.6 liter and 2.0 liter four-cylinder EcoBoost
engines. The Engine Segment supplies turbochargers for Hyundai's first turbocharged gasoline direct
injected engine.
The Engine Segment's timing systems enable precise control of air and exhaust flow through the
engine, improving fuel economy and emissions. The Engine Segment's timing systems products
include timing chain, variable cam timing (“VCT”), crankshaft and camshaft sprockets, tensioners,
guides and snubbers, HY-VO® front-wheel drive (“FWD”) transmission chain and four-wheel drive
(“4WD”) chain for light vehicles. The Engine Segment is a leading manufacturer of timing systems to
OEMs around the world.
BorgWarner timing chain systems are featured on Ford's family of engines, including Duratec,
Modular and in-line four-cylinder engines, Chrysler's 3.6 liter Pentastar engine, Volkswagen’s EA888
family, Hyundai's Gamma, Nu and Theta families and numerous other applications around the world.
The Engine Segment’s newest engine timing technology is its VCT with mid position lock, which
allows a greater range of camshaft positioning thereby enabling greater control over airflow and the
opportunity to improve fuel economy, reduce emissions and improve engine performance compared
with conventional VCT systems. VCT with mid position lock made its debut on Subaru’s Boxer® 2.0
liter engine. BorgWarner is currently working with a number of other OEMs interested in implementing
this technology.
The Engine Segment’s emissions and systems products improve emissions performance and fuel
economy. Products include electric air pumps and exhaust gas recirculation (“EGR”) coolers, EGR
tubes and EGR valves for gasoline and diesel applications. In 2010, the Company acquired Dytech
Ensa S.L., a leading producer of EGR coolers, EGR tubes and integrated EGR modules for light,
commercial and off-highway applications.
The Engine Segment’s thermal systems products are designed to optimize engine temperatures
and minimize parasitic horsepower losses, which improve engine efficiency, fuel economy and
emissions performance. Products include viscous fan drives that sense and respond to multiple
cooling requirements, polymer fans and coolant pumps. The Engine Segment has been awarded the
5

“standard position” (the OEM-designated preferred supplier of component systems available to the
end-customer) at several major global commercial vehicle OEMs.
The Engine Segment’s ignition systems products improve combustion efficiency for both diesel
and gasoline engines. Products include glow plugs and instant starting systems that enhance
combustion for diesel engines during cold starts, pressure sensor glow plugs that also monitor the
combustion process of a diesel engine and advanced ignition technology for gasoline engines.
In December 2013, the Company announced that it had signed an agreement to acquire Gustav
Wahler GmbH u. Co. KG and its general partner (“Wahler”). The deal is expected to close in the first
quarter of 2014 subject to standard regulatory approvals. Wahler is a producer of EGR valves, EGR
tubes and thermostats and has operations in Germany, Brazil, the U.S., China and Slovakia. Wahler's
sales for 2013 are expected to be approximately $350 million and this acquisition strengthens the
Company's strategic position as a producer of complete EGR systems and creates additional market
opportunities in both passenger and commercial vehicle applications.
The Company sold its tire pressure monitoring and spark plug businesses during the fourth
quarter of 2011 and third quarter of 2012, respectively. The sale of these businesses will allow the
Company to continue to focus on expanding BERU Systems’ core products of glow plugs, diesel cold
start systems and other gasoline ignition technologies.
In 2009, the Company announced the purchase of advanced gasoline ignition technology and
related intellectual property from Florida-based Etatech, Inc. The high-frequency ignition technology is
expected to enable high-performing, lean-burning engines to significantly improve fuel economy and
reduce emissions compared with conventional combustion technologies.
Drivetrain
The Drivetrain Segment develops and manufactures products for automatic transmissions and
all-wheel drive (“AWD”) vehicles. Precise controls, better response times and minimal parasitic losses,
all of which improve fuel economy and vehicle performance, are the core design features of the
Drivetrain Segment's product portfolio. The Drivetrain Segment's products include friction,
mechanical and controls products for automatic transmissions and torque management products for
AWD vehicles.
Friction and mechanical products for automatic transmissions include dual clutch modules,
friction clutch modules, friction and steel plates, transmission bands, torque converter clutches, one-
way clutches and torsional vibration dampers. Controls products for automatic transmissions feature
electro-hydraulic solenoids for standard and high pressure hydraulic systems, transmission solenoid
modules and dual clutch control modules. The Company's 50%-owned joint venture in Japan, NSK-
Warner KK (“NSK-Warner”), is a leading producer of friction plates and one-way clutches in Japan
and China.
The Drivetrain Segment has led the globalization of today's dual clutch transmission (“DCT”)
technology for over 10 years. BorgWarner's award-winning DualTronic® technology enables a
conventional, manual gearbox to function as a fully automatic transmission by eliminating the
interruption in power flow that occurs when shifting a single clutch manual transmission. The result is
a smooth shifting automatic transmission with the fuel efficiency and driving experience of a manual
gearbox.
The Drivetrain Segment established its industry-leading position in 2003 with the production
launch of its DualTronic® innovations with VW/Audi, followed by program launches with Ford and
6

BMW. In 2007, the Drivetrain Segment launched its first dual-clutch technology application in a
Japanese transmission with Nissan. In 2008, the Company entered into a joint venture agreement with
China Automobile Development United Investment Company, a company owned by 12 leading
Chinese automakers, to produce various DCT modules for the Chinese market. The Company owns
66% of the joint venture. In 2013, the Drivetrain Segment launched its first DCT application in a
Chinese transmission with SAIC. The Drivetrain Segment is working on several other DCT programs
with OEMs around the world.
The Drivetrain Segment’s torque management products include rear-wheel drive (“RWD”)/AWD
transfer case systems, FWD/AWD coupling systems and cross-axle coupling systems. The Drivetrain
Segment’s focus is on developing electronically controlled torque management devices and systems
that will benefit fuel economy and vehicle dynamics.
Transfer cases are installed on RWD based light trucks, SUVs, cross-over utility vehicles, and
passenger cars. A transfer case attaches to the transmission and distributes torque to the front and
rear axles improving vehicle traction and stability in dynamic driving conditions. There are many
variants of the Drivetrain Segment’s transfer case technology in the market today, including Torque
On-Demand (TOD®), chain-driven, gear-driven, 1-speed and 2-speed transfer cases. The Drivetrain
Segment’s transfer cases are featured on the Ford F-150 and on the Dodge Ram light-duty and
heavy-duty trucks.
The Drivetrain Segment is involved in the AWD market for FWD based vehicles with couplings
that use electronically-controlled clutches to distribute power to the rear wheels as traction is
required. The Drivetrain Segment’s latest coupling innovation, the Centrifugal Electro-Hydraulic
(“CEH”) Actuator, which is utilized to engage the clutches in the coupling, produces outstanding
vehicle stability and traction while promoting better fuel economy with reduced weight. The CEH
Actuator is found in the AWD couplings featured in several current FWD/AWD vehicles including the
Audi A3, Skoda Octavia,Volvo XC60 and VW Golf.
In 2011, the Company acquired the Traction Systems division of Haldex Group, a leading
provider of innovative AWD products for the global vehicle industry headquartered in Stockholm,
Sweden. This acquisition has accelerated BorgWarner’s growth in the global AWD market as it
continues to shift toward FWD based vehicles. The acquisition adds industry leading AWD
technologies for FWD based vehicles, with a strong European customer base, to BorgWarner’s
portfolio of front- and rear-wheel drive based products and enables BorgWarner to offer global
customers a broader range of AWD solutions to meet their vehicle needs.
7

Joint Ventures
As of December 31, 2013, the Company had nine joint ventures in which it had a less-than-100%
ownership interest. Results from the six joint ventures in which the Company is the majority owner are
consolidated as part of the Company’s results. Results from the three joint ventures in which the
Company’s effective ownership interest is 50% or less, were reported by the Company using the
equity method of accounting.
Management of the unconsolidated joint ventures is shared with the Company’s respective joint
venture partners. Certain information concerning the Company’s joint ventures is set forth below:
Joint venture ProductsYear
organized
Percentageowned by
theCompany
Location ofoperation Joint venture partner
Fiscal 2013net sales
(millions ofdollars)(a)
Unconsolidated:
NSK-Warner Transmission components 1964 50% Japan/China NSK Ltd. $604.0
Turbo Energy Limited(b) Turbochargers 1987 32.6% India Sundaram Finance
Limited; Brakes
India Limited
$148.0
BERU Diesel Start
Systems Pvt. Ltd.
Glow Plugs 1996 49% India Jayant Dave $ 3.5
Consolidated:
BorgWarner Transmission
Systems Korea Ltd.(c)
Transmission components 1987 60% Korea NSK-Warner $290.2
Divgi-Warner Private
Limited
Transfer cases and
synchronizer rings
1995 60% India Divgi Metalwares,
Ltd.
$ 17.5
Borg-Warner Shenglong
(Ningbo) Co. Ltd.
Fans and fan drives 1999 70% China Ningbo Shenglong
Automotive
Powertrain Systems
Co., Ltd.
$ 36.6
BorgWarner TorqTransfer
Systems Beijing Co. Ltd.
Transfer cases 2000 80% China Beijing Automotive
Components Stock
Co. Ltd.
$ 92.4
SeohanWarner Turbo
Systems Ltd.
Turbochargers 2003 71% Korea Korea Flange
Company
$119.1
BorgWarner United
Transmission Systems
Co. Ltd.
Transmission components 2009 66% China China Automobile
Development United
Investment Co., Ltd.
$ 9.1
(a) All sales figures are for the year ended December 31, 2013, except NSK-Warner and Turbo
Energy Limited. NSK-Warner’s sales are reported for the 12 months ended November 30, 2013.
Turbo Energy Limited’s sales are reported for the 12 months ended September 30, 2013.
(b) The Company made purchases from Turbo Energy Limited totaling $39.1 million, $24.2 million
and $22.5 million for the years ended December 31, 2013, 2012 and 2011, respectively.
(c) BorgWarner Inc. owns 50% of NSK-Warner, which has a 40% interest in BorgWarner
Transmission Systems Korea Ltd. This gives the Company an additional indirect effective
ownership percentage of 20%. This results in a total effective ownership interest of 80%.
Financial Information About Geographic Areas
During the year ended December 31, 2013, approximately 74% of the Company’s consolidated
net sales were outside the United States (“U.S.”), attributing sales to the location of production rather
than the location of the customer.
8

Refer to Note 18, “Reporting Segments and Related Information,” to the Consolidated Financial
Statements in Item 8 of this report for financial information about geographic areas.
Product Lines and Customers
During the year ended December 31, 2013, approximately 80% of the Company’s net sales were
for light-vehicle applications; approximately 9% were for commercial vehicle applications;
approximately 6% were for off-highway vehicle applications; and approximately 5% were to
distributors of aftermarket replacement parts.
The Company’s worldwide net sales to the following customers (including their subsidiaries) were
approximately as follows:
Year EndedDecember 31,
Customer 2013 2012 2011
Volkswagen . . . . . . . . . . . . . . . . . . . . . . . . . . . . . . . . . . . . . . . . . . . . . . . . . 16% 17% 19%
Ford . . . . . . . . . . . . . . . . . . . . . . . . . . . . . . . . . . . . . . . . . . . . . . . . . . . . . . . . 14% 13% 12%
No other single customer accounted for more than 10% of our consolidated net sales in any of
the years presented.
The Company’s automotive products are generally sold directly to OEMs, substantially pursuant
to negotiated annual contracts, long-term supply agreements or terms and conditions as may be
modified by the parties. Deliveries are subject to periodic authorizations based upon OEM production
schedules. The Company typically ships its products directly from its plants to the OEMs.
Sales and Marketing
Each of the Company’s businesses within its two reporting segments has its own sales function.
Account executives for each of our businesses are assigned to serve specific OEM customers for one
or more of a businesses’ products. Our account executives spend the majority of their time in direct
contact with OEM purchasing and engineering employees and are responsible for servicing existing
business and for identifying and obtaining new business. Because of their close relationship with
OEMs, account executives are able to identify and meet customers’ needs based upon their
knowledge of our products’ design and manufacturing capabilities. Upon securing a new order,
account executives participate in product launch team activities and serve as a key interface with
customers.
In addition, the sales and marketing employees of our Engine and Drivetrain reporting segments
often work together to explore cross-development opportunities for the businesses. The development
of DualTronic®, the Company's wet-clutch and control-system technology for a new-concept
automated transmission, is an example of a successful collaboration.
Seasonality
Our operations are directly related to the automotive industry. Consequently, we may experience
seasonal fluctuations to the extent automotive vehicle production slows, such as in the summer
months when many customer plants typically close for model year changeovers or vacations.
Historically, model changeovers or vacations have generally resulted in lower sales volume in the third
quarter.
9
Research and Development
The Company conducts advanced Engine and Drivetrain research at the reporting segment level.
This advanced engineering function looks to leverage know-how and expertise across product lines to
create new Engine and Drivetrain systems and modules that can be commercialized. This function
manages a venture capital fund that was created by the Company as seed money for new innovation
and collaboration across businesses.
In addition, each of the Company’s businesses within its two reporting segments has its own
research and development (“R&D”) organization, including engineers and technicians, engaged in
R&D activities at facilities worldwide. The Company also operates testing facilities such as prototype,
measurement and calibration, life cycle testing and dynamometer laboratories.
By working closely with the OEMs and anticipating their future product needs, the Company’s
R&D personnel conceive, design, develop and manufacture new proprietary automotive components
and systems. R&D personnel also work to improve current products and production processes. The
Company believes its commitment to R&D will allow it to obtain new orders from its OEM customers.
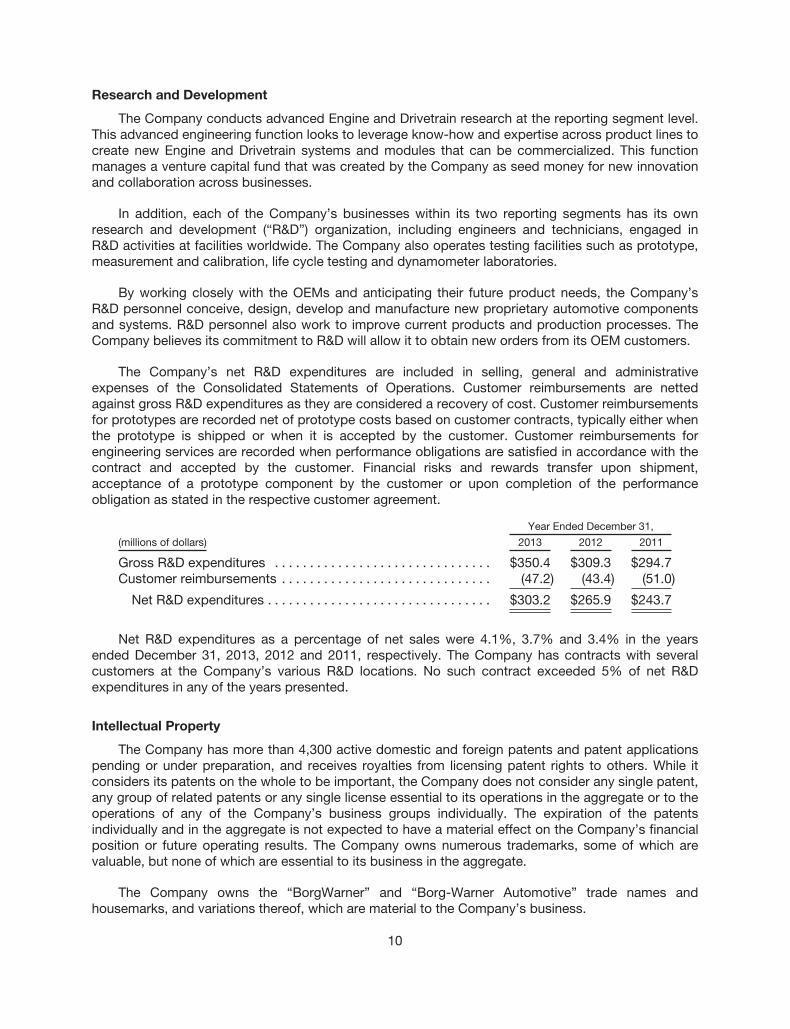
The Company’s net R&D expenditures are included in selling, general and administrative
expenses of the Consolidated Statements of Operations. Customer reimbursements are netted
against gross R&D expenditures as they are considered a recovery of cost. Customer reimbursements
for prototypes are recorded net of prototype costs based on customer contracts, typically either when
the prototype is shipped or when it is accepted by the customer. Customer reimbursements for
engineering services are recorded when performance obligations are satisfied in accordance with the
contract and accepted by the customer. Financial risks and rewards transfer upon shipment,
acceptance of a prototype component by the customer or upon completion of the performance
obligation as stated in the respective customer agreement.
Year Ended December 31,
(millions of dollars) 2013 2012 2011
Gross R&D expenditures . . . . . . . . . . . . . . . . . . . . . . . . . . . . . . . $350.4 $309.3 $294.7
Customer reimbursements . . . . . . . . . . . . . . . . . . . . . . . . . . . . . . (47.2) (43.4) (51.0)
Net R&D expenditures . . . . . . . . . . . . . . . . . . . . . . . . . . . . . . . . $303.2 $265.9 $243.7
Net R&D expenditures as a percentage of net sales were 4.1%, 3.7% and 3.4% in the years
ended December 31, 2013, 2012 and 2011, respectively. The Company has contracts with several
customers at the Company’s various R&D locations. No such contract exceeded 5% of net R&D
expenditures in any of the years presented.
Intellectual Property
The Company has more than 4,300 active domestic and foreign patents and patent applications
pending or under preparation, and receives royalties from licensing patent rights to others. While it
considers its patents on the whole to be important, the Company does not consider any single patent,
any group of related patents or any single license essential to its operations in the aggregate or to the
operations of any of the Company’s business groups individually. The expiration of the patents
individually and in the aggregate is not expected to have a material effect on the Company’s financial
position or future operating results. The Company owns numerous trademarks, some of which are
valuable, but none of which are essential to its business in the aggregate.
The Company owns the “BorgWarner” and “Borg-Warner Automotive” trade names and
housemarks, and variations thereof, which are material to the Company’s business.
10
Competition
The Company’s reporting segments compete worldwide with a number of other manufacturers
and distributors that produce and sell similar products. Many of these competitors are larger and have
greater resources than the Company. Technological innovation, application engineering development,
quality, price, delivery and program launch support are the primary elements of competition.
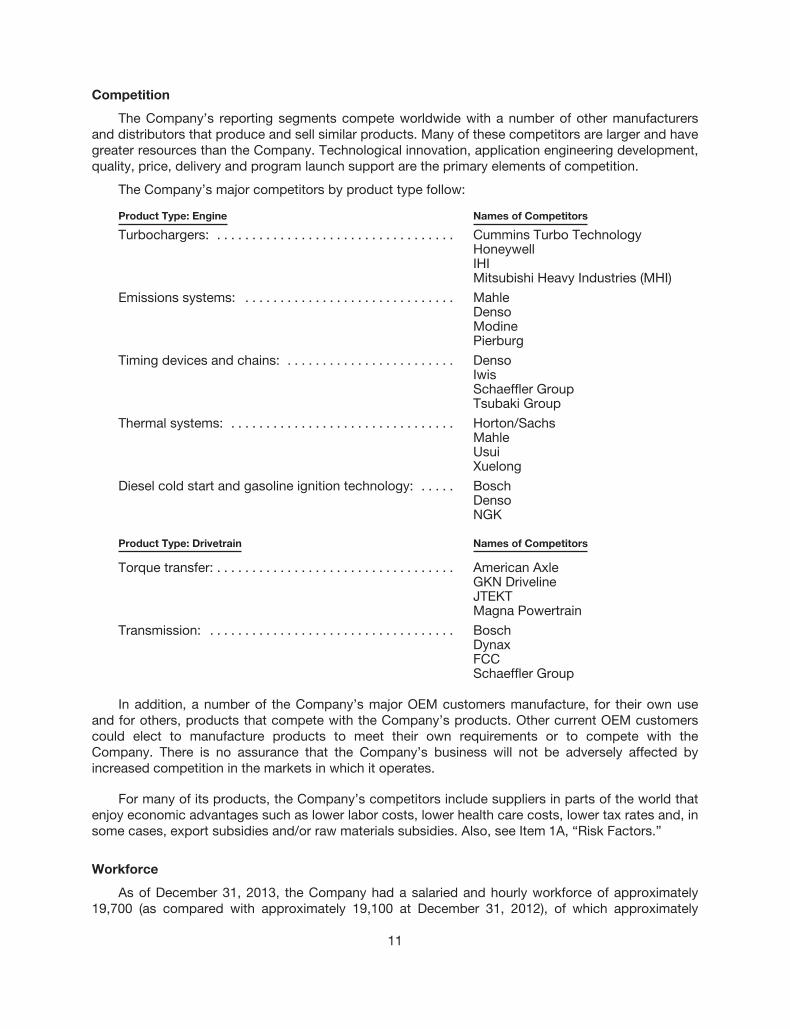
The Company’s major competitors by product type follow:
Product Type: Engine Names of Competitors
Turbochargers: . . . . . . . . . . . . . . . . . . . . . . . . . . . . . . . . . . Cummins Turbo TechnologyHoneywellIHIMitsubishi Heavy Industries (MHI)
Emissions systems: . . . . . . . . . . . . . . . . . . . . . . . . . . . . . . MahleDensoModinePierburg
Timing devices and chains: . . . . . . . . . . . . . . . . . . . . . . . . DensoIwisSchaeffler GroupTsubaki Group
Thermal systems: . . . . . . . . . . . . . . . . . . . . . . . . . . . . . . . . Horton/SachsMahleUsuiXuelong
Diesel cold start and gasoline ignition technology: . . . . . BoschDensoNGK
Product Type: Drivetrain Names of Competitors
Torque transfer: . . . . . . . . . . . . . . . . . . . . . . . . . . . . . . . . . . American AxleGKN DrivelineJTEKTMagna Powertrain
Transmission: . . . . . . . . . . . . . . . . . . . . . . . . . . . . . . . . . . . BoschDynaxFCCSchaeffler Group
In addition, a number of the Company’s major OEM customers manufacture, for their own use
and for others, products that compete with the Company’s products. Other current OEM customers
could elect to manufacture products to meet their own requirements or to compete with the
Company. There is no assurance that the Company’s business will not be adversely affected by
increased competition in the markets in which it operates.
For many of its products, the Company’s competitors include suppliers in parts of the world that
enjoy economic advantages such as lower labor costs, lower health care costs, lower tax rates and, in
some cases, export subsidies and/or raw materials subsidies. Also, see Item 1A, “Risk Factors.”
Workforce
As of December 31, 2013, the Company had a salaried and hourly workforce of approximately
19,700 (as compared with approximately 19,100 at December 31, 2012), of which approximately
11

5,500 were in the U.S. Approximately 20% of the Company’s U.S. workforce is unionized. The
workforces at certain international facilities are also unionized. The Company believes the present
relations with our workforce to be satisfactory.
Our only domestic collective bargaining agreement is for our New York facility. This agreement
expires in September 2016.
Raw Materials
The Company uses a variety of raw materials in the production of its automotive products
including steel, aluminum, copper, nickel, plastic resins and certain alloy elements. Manufacturing
operations for each of the Company’s operating segments are dependent upon natural gas, fuel oil
and electricity.
Commodity prices were relatively stable in 2013. The Company uses a variety of tactics in order
to limit the impact of supply shortages and inflationary pressures. The Company’s global procurement
organization works to accelerate cost reductions, purchases from lower cost regions, rationalize the
supply base, mitigate risk and collaborate on its buying activities. In addition, the Company uses
long-term contracts, cost sharing arrangements, design changes, customer buy programs and limited
financial instruments to help control costs. The Company intends to use similar measures in 2014 and
beyond. Refer to Note 10, “Financial Instruments,” of the Consolidated Financial Statements in Item 8
of this report for information related to the Company’s hedging activities.
For 2014, the Company believes that its supplies of raw materials are adequate and available
from multiple sources to support its manufacturing requirements.
Available Information
Through its Internet website (www.borgwarner.com), the Company makes available, free of
charge, its Annual Report on Form 10-K, Quarterly Reports on Form 10-Q, Current Reports on
Form 8-K, all amendments to those reports, and other filings with the Securities and Exchange
Commission, as soon as reasonably practicable after they are filed or furnished. The Company
also makes the following documents available on its Internet website: the Audit Committee Charter;
the Compensation Committee Charter; the Corporate Governance Committee Charter; the
Company’s Corporate Governance Guidelines; the Company’s Code of Ethical Conduct; and the
Company’s Code of Ethics for CEO and Senior Financial Officers. You may also obtain a copy of any
of the foregoing documents, free of charge, if you submit a written request to Investor Relations,
3850 Hamlin Road, Auburn Hills, Michigan 48326.
12

Executive Officers of the Registrant
Set forth below are the names, ages, positions and certain other information concerning the
executive officers of the Company as of February 13, 2014.
Name Age Position with the Company
James R. Verrier . . . . . . . . 51 President and Chief Executive Officer
Ronald T. Hundzinski . . . . 55 Vice President and Chief Financial Officer
Steven G. Carlson . . . . . . . 63 Vice President and Controller
Stefan Demmerle . . . . . . . . 49 Vice President
Brady D. Ericson . . . . . . . . 42 Vice President
Joseph F. Fadool . . . . . . . 47 Vice President
John J. Gasparovic . . . . . . 56 Vice President, General Counsel and Secretary
Kim R. Jenett . . . . . . . . . . . 54 Vice President, Human Resources
Robin Kendrick . . . . . . . . . 49 Vice President
Frederic B. Lissalde . . . . . 46 Vice President
Thomas J. McGill . . . . . . . 47 Vice President and Treasurer
Daniel Paterra . . . . . . . . . . 59 Vice President
Mr. Verrier has been President, Chief Executive Officer and member of BorgWarner’s Board of
Directors since January 1, 2013. From March 2012 through December 2012, he was the President
and Chief Operating Officer of the Company. From January 2010 to March 2012, he was Vice
President of the Company and President and General Manager of BorgWarner Morse TEC Inc. He
was Vice President and General Manager, Passenger Car of BorgWarner Turbo Systems Inc. from
January 2006 to January 2010.
Mr. Hundzinski has been Vice President and Chief Financial Officer of the Company since March
2012. From August 2011 through March 2012, he was Vice President and Treasurer of the Company.
From April 2010 until August 2011, he was Vice President and Controller of the Company. From June
2005 until April 2010, he was Vice President of Finance of BorgWarner Turbo Systems Inc.
Mr. Carlson has been Vice President and Controller of the Company since May 2012. From
August 2011 through April 2012, he was Vice President of Finance of BorgWarner Transmissions
Systems Inc. From June 2009 until August 2011, he was Vice President of Finance of BorgWarner
Morse TEC Inc. From November 2006 until June 2009, he was Group Controller of BorgWarner
Thermal Systems Inc.
Dr. Demmerle has been Vice President of the Company and President and General Manager of
BorgWarner TorqTransfer Systems Inc. since September 2012. From July 2010 to September 2012,
he was Vice President, Engine Control Electronics at Continental Automotive Systems. From
December 2007 to June 2010, he was President and CEO of Continental Diesel Systems US LLC
(formerly known as Siemens Diesel Systems Technology LLC).
Mr. Ericson has been Vice President of the Company and President and General Manager of
BorgWarner BERU Systems and Emissions Systems since September 2011. He was Vice President
and General Manager of BorgWarner Emissions Systems Inc. from April 2010 through August 2011.
From August 2009 through March 2010, he was Vice President, Global Manufacturing Strategies for
BorgWarner Turbo and Emissions Systems. From January 2008 through July 2009, he was Vice
President, Operations - China and Korea for BorgWarner Turbo and Emissions Systems.
Mr. Fadool has been Vice President of the Company and President and General Manager of
BorgWarner Morse TEC Inc. since May 2012. He was Vice President of the Company and President
and General Manager of BorgWarner TorqTransfer Systems Inc. from June 2011 until May 2012. He
was Vice President and General Manager of BorgWarner TorqTransfer Systems Inc. from July 2010
13

until June 2011. From May 2009 until July 2010, he was Vice President for North American Operations
for the Central Electronics Plants at Continental Automotive Systems. From July 2007 until July 2010,
he was Vice President, Huntsville Operations at SiemensVDO.
Mr. Gasparovic has been Vice President, General Counsel and Secretary of the Company since
January 2007.
Ms. Jenett has been Vice President, Human Resources of the Company since September 2013.
From July 2009 until September 2013, she was Vice President, Human Resources for BorgWarner
Morse TEC Inc. and BorgWarner Thermal Systems Inc. She was Vice President, Human Resources for
BorgWarner Transmission Systems from November 2005 until June 2009.
Mr. Kendrick has been Vice President of the Company and President and General Manager of
BorgWarner Transmissions Systems Inc. since September 2011. From January 2011 until September
2011, he was President and Chief Executive Officer of Ruia Global Fasteners, a spin-off of Acument
Global Technologies. From September 2008 to January 2011, he was Vice President and General
Manager, Europe for Acument Global Technologies.
Mr. Lissalde has been Vice President of the Company and President and General Manager of
BorgWarner Turbo Systems Inc. since May 2013. From May 2011 until May 2013 he was Vice
President of the Company and President and General Manager of BorgWarner Turbo Systems
Passenger Car Products. He was Acting President and General Manager of BorgWarner Turbo
Systems Passenger Car Products from March 2011 until May 2011. He was Vice President and
General Manager for BorgWarner Turbo Systems Passenger Car from January 2010 until March 2011.
He was Vice President and General Manager, DualTronic® and Clutch Systems, BorgWarner
Transmission Systems Inc. from January 2008 to January 2010.
Mr. McGill has been Vice President and Treasurer of the Company since May 2012. He was Vice
President of Finance of BorgWarner Turbo Systems Inc. from April 2010 until May 2012. He was Vice
President of Finance of BorgWarner Thermal Systems Inc. from June 2009 to April 2010. He was Vice
President of Finance of BorgWarner TorqTransfer Systems Inc. from February 2009 to June 2009. He
was Director of Audit & Analysis of the Company from December 2006 to February 2009.
Mr. Paterra has been Vice President of the Company and President and General Manager of
BorgWarner Thermal Systems Inc. since May 2013. From January 2010 to May 2013 he was Senior
Director of Operations for the North American Metals Division of Cooper-Standard Holdings Inc. From
September 1994 to August 2009 he held various plant management and vice president positions with
the Company.
Item 1A. Risk Factors
The following risk factors and other information included in this Annual Report on Form 10-K
should be considered. The risks and uncertainties described below are not the only ones we face.
Additional risks and uncertainties not presently known to us or that we currently deem immaterial also
may impact our business operations. If any of the following risks occur, our business including its
financial performance, financial condition, operating results and cash flows could be materially
adversely affected.
Risks related to our industry
Conditions in the automotive industry may adversely affect our business.
Our financial performance depends on conditions in the global automotive industry. Automotive
and truck production and sales are cyclical and sensitive to general economic conditions and other
14

factors including interest rates, consumer credit, and consumer spending and preferences. Economic
declines that result in significant reduction in automotive or truck production would have a material
adverse affect on our sales to OEMs.
We face strong competition.
We compete worldwide with a number of other manufacturers and distributors that produce and
sell products similar to ours. Price, quality, delivery, technological innovation, engineering
development and program launch support are the primary elements of competition. Our competitors
include vertically integrated units of our major OEM customers, as well as a large number of
independent domestic and international suppliers. We are not as large as a number of these
companies and do not have as many financial or other resources. Although OEMs have indicated that
they will continue to rely on outside suppliers, a number of our major OEM customers manufacture
products for their own uses that directly compete with our products. These OEMs could elect to
manufacture such products for their own uses in place of the products we currently supply. The
competitive environment has changed dramatically over the past few years as our traditional U.S.
OEM customers, faced with intense international competition, have expanded their worldwide
sourcing of components. As a result, we have experienced competition from suppliers in other parts
of the world that enjoy economic advantages, such as lower labor costs, lower health care costs,
lower tax rates and, in some cases, export or raw materials subsidies. Increased competition could
adversely affect our business.
Risks related to our business
We are under substantial pressure from OEMs to reduce the prices of our products.
There is substantial and continuing pressure on OEMs to reduce costs, including costs of
products we supply. Annual price reductions to OEM customers have become a permanent feature of
our business environment. To maintain our profit margins, we seek price reductions from our
suppliers, improved production processes to increase manufacturing efficiency, updated product
designs to reduce costs and develop new products, the benefits of which support stable or increased
prices. Our ability to pass through increased raw material costs to our OEM customers is limited, with
cost recovery often less than 100% and often on a delayed basis. Inability to reduce costs in an
amount equal to annual price reductions, increases in raw material costs, and increases in employee
wages and benefits could have an adverse effect on our business.
We continue to face highly volatile costs of commodities used in the production of ourproducts.
The Company uses a variety of commodities (including steel, nickel, copper, aluminum, plastic
resins, other raw materials and energy) and materials purchased in various forms such as castings,
powder metal, forgings, stampings and bar stock. Increasing commodity costs will have an impact on
our results. We have sought to alleviate the impact of increasing costs by including a material pass-
through provision in our customer contracts wherever possible and by selectively hedging certain
commodity exposures. Customers frequently challenge these contractual provisions and rarely pay
the full cost of any material increases. The discontinuation or lessening of our ability to pass-through
or hedge increasing commodity costs could adversely affect our business.
From time to time, commodity prices may also fall rapidly. When this happens, suppliers may
withdraw capacity from the market until prices improve which may cause periodic supply
interruptions. The same may be true of our transportation carriers and energy providers. If these
supply interruptions occur, it could adversely affect our business.
15

We use important intellectual property in our business. If we are unable to protect our intellectualproperty or if a third party makes assertions against us or our customers relating to intellectualproperty rights, our business could be adversely affected.
We own important intellectual property, including patents, trademarks, copyrights and trade
secrets, and are involved in numerous licensing arrangements. Our intellectual property plays an
important role in maintaining our competitive position in a number of the markets that we serve. Our
competitors may develop technologies that are similar or superior to our proprietary technologies or
design around the patents we own or license. Further, as we expand our operations in jurisdictions
where the protection of intellectual property rights is less robust, the risk of others duplicating our
proprietary technologies increases, despite efforts we undertake to protect them. Developments or
assertions by or against us relating to intellectual property rights, and any inability to protect these
rights, could materially adversely affect our business and our competitive position.
We are subject to business continuity risks associated with increasing centralization of ourinformation technology systems.
To improve efficiency and reduce costs, we have regionally centralized the information systems
that support our business processes such as invoicing, payroll and general management operations.
If the centralized systems are disrupted or disabled, key business processes could be interrupted,
which could adversely affect our business.
A failure of our information technology (IT) infrastructure could adversely impact our businessand operations.
We rely on the capacity, reliability and security of our IT systems and infrastructure. IT systems
are vulnerable to disruptions, including those resulting from natural disasters, cyber-attacks or failures
in third-party-provided services. Disruptions and attacks on our IT systems pose a risk to the security
of our systems and our ability to protect our networks and the confidentiality, availability and integrity
of our and customers’ data. As a result, such attacks or disruptions could potentially lead to the
inappropriate disclosure of confidential information, including our intellectual property, improper use
of our systems and networks, manipulation and destruction of data, production downtimes and both
internal and external supply shortages. This could cause significant damage to our reputation, affect
our relationships with our customers and suppliers, lead to claims against the Company and
ultimately adversely affect our business.
Our business success depends on attracting and retaining qualified personnel.
Our ability to sustain and grow our business requires us to hire, retain and develop a highly
skilled and diverse management team and workforce worldwide. Any unplanned turnover or inability
to attract and retain key employees in numbers sufficient for our needs could adversely affect our
business.
Part of our workforce is unionized which could subject us to work stoppages.
As of December 31, 2013, approximately 20% of our U.S. workforce was unionized. Our only
domestic collective bargaining agreement is for our New York facility. This agreement expires in
September 2016. The workforce at certain of our international facilities is also unionized. A prolonged
dispute with our employees could have an adverse effect on our business.
16

We are impacted by the rising cost of providing benefits and certain retirement benefit planswe sponsor are currently unfunded or underfunded.
We sponsor certain retirement benefit plans worldwide that are unfunded or underfunded and will
require cash payments. If the performance of the assets in our funded pension plans do not meet our
expectations, if medical costs continue to increase or actuarial assumptions are modified, our
required cash payments may be higher than we expect.
The Patient Protection and Affordable Care Act, as amended by the Health Care and Education
Reconciliation Act of 2010 (collectively, the Act), was signed into law in March 2010. We continue to
evaluate the effect of the Act, including its potential impact on the future cost of our benefit plans.
We are subject to extensive environmental regulations.
Our operations are subject to laws governing, among other things, emissions to air, discharges to
waters and the generation, handling, storage, transportation, treatment and disposal of waste and
other materials. The operation of automotive parts manufacturing plants entails risks in these areas,
and we cannot assure you that we will not incur material costs or liabilities as a result. Through
various acquisitions over the years, we have acquired a number of manufacturing facilities, and we
cannot assure you that we will not incur material costs and liabilities relating to activities that predate
our ownership. In addition, potentially significant expenditures could be required in order to comply
with evolving environmental, health and safety laws that may be adopted in the future. Costs
associated with failure to comply with environmental regulations could have an adverse effect on our
business.
We have liabilities related to environmental, product warranties, regulatory matters, litigationand other claims.
We and certain of our current and former direct and indirect corporate predecessors, subsidiaries
and divisions have been identified by the United States Environmental Protection Agency and certain
state environmental agencies and private parties as potentially responsible parties at various
hazardous waste disposal sites under the Comprehensive Environmental Response, Compensation
and Liability Act and equivalent state laws.
We provide product warranties to our customers for some of our products. Under these product
warranties, we may be required to bear costs and expenses for the repair or replacement of these
products. We cannot assure you that costs and expenses associated with these product warranties
will not be material, or that those costs will not exceed any amounts accrued for such product
warranties in our financial statements.
We are currently, and may in the future become, subject to legal proceedings and commercial or
contractual disputes. These claims typically arise in the normal course of business and may include,
but not be limited to, commercial or contractual disputes with our customers and suppliers,
intellectual property matters, personal injury, product liability, environmental and employment claims.
There is a possibility that such claims may have an adverse impact on our business that is greater
than we anticipate.
Negative or unexpected tax consequences could adversely affect our business.
Adverse changes in the underlying profitability and financial outlook of our operations in several
jurisdictions could lead to changes in our valuation allowances against deferred tax assets and other
tax accruals that could adversely affect our financial performance.
17

We are subject to tax audits by governmental authorities in the U.S. and numerous non-U.S.
jurisdictions, which are inherently uncertain. Negative or unexpected results from one or more such
tax audits or changes to tax laws governing the jurisdictions in which we operate could adversely
affect our business.
Our growth strategy may prove unsuccessful.
We have a stated goal of increasing sales and operating income at a rate greater than global
vehicle production by increasing content per vehicle with innovative new components and through
select acquisitions. We may not meet our goal because of any of the following: (a) the failure to
develop new products that will be purchased by our customers; (b) technology changes rendering our
products obsolete; (c) a reversal of the trend of supplying systems (which allows us to increase
content per vehicle) instead of components; and (d) the failure to find suitable acquisition targets or
the failure to integrate operations of acquired businesses quickly and cost effectively. Failure to
execute our growth strategy could adversely affect our business.
We are subject to risks related to our international operations.
We have manufacturing and technical facilities in many regions including the Americas, Europe
and Asia. For 2013, approximately 74% of our sales were outside the U.S. Consequently, our results
could be affected by changes in trade, monetary and fiscal policies, trade restrictions or prohibitions,
import or other charges or taxes, fluctuations in foreign currency exchange rates, limitations on the
repatriation of funds, changing economic conditions, unreliable intellectual property protection and
legal systems, insufficient infrastructures, social unrest, political instability and disputes, and
international terrorism. Compliance with multiple and potentially conflicting laws and regulations of
various countries is challenging, burdensome and expensive.
A downgrade in the ratings of our debt could restrict our ability to access the debt capitalmarkets.
Changes in the ratings that rating agencies assign to our debt may ultimately impact our access
to the debt capital markets and the costs we incur to borrow funds. If ratings for our debt fall below
investment grade, our access to the debt capital markets could become restricted.
Our revolving credit agreement includes an increase in interest rates if the ratings for our debt are
downgraded. The interest costs on our revolving credit agreement are based on a rating grid agreed
to in our credit agreement. Further, an increase in the level of our indebtedness and related interest
costs may increase our vulnerability to adverse general economic and industry conditions and may
affect our ability to obtain additional financing.
Risks related to our customers
We rely on sales to major customers.
We rely on sales to OEMs around the world of varying credit quality. Supply to several of these
customers requires significant investment by the Company. We base our growth projections, in part,
on commitments made by our customers. These commitments generally renew yearly during a
program life cycle. If actual production orders from our customers do not approximate such
commitments due to any of a variety of factors including non-renewal of purchase orders, the
customer's financial hardship or other unforeseen reasons, it could adversely affect our business.
Some of our sales are concentrated. Our worldwide sales in 2013 to Volkswagen and
Ford constituted approximately 16% and 14%, respectively, of our 2013 consolidated net sales.
18

We are sensitive to the effects of our major customers’ labor relations.
All three of our primary North American customers, Ford, Chrysler and General Motors, have
major union contracts with the United Automobile, Aerospace and Agricultural Implement Workers of
America. Because of domestic OEMs’ dependence on a single union, we are affected by labor
difficulties and work stoppages at OEMs’ facilities. Similarly, a majority of our global customers’
operations outside of North America are also represented by various unions. Any extended work
stoppage could have an adverse affect on our business.
Risks related to our suppliers
We could be adversely affected by supply shortages of components from our suppliers.
In an effort to manage and reduce the cost of purchased goods and services, we have been
rationalizing our supply base. As a result, we are dependent on fewer sources of supply for certain
components used in the manufacture of our products. The Company selects suppliers based on total
value (including total landed price, quality, delivery, and technology), taking into consideration their
production capacities and financial condition. We expect that they will deliver to our stated written
expectations.
However, there can be no assurance that capacity limitations, labor unrest, weather emergencies,
commercial disputes, government actions, riots, wars, sabotage, non-conforming parts, acts of
terrorism, “Acts of God,” or other problems experienced by our suppliers will not result in occasional
shortages or delays in their supply of components to us. If we were to experience a significant or
prolonged shortage of critical components from any of our suppliers and could not procure the
components from other sources, we would be unable to meet the production schedules for some of
our key products and could miss customer delivery expectations. This would adversely affect our
customer relations and business.
Suppliers’ economic distress could result in the disruption of our operations and couldadversely affect our business.
Rapidly changing industry conditions such as volatile production volumes; credit tightness;
changes in foreign currencies; raw material, commodity, transportation, and energy price escalation;
drastic changes in consumer preferences; and other factors could adversely affect our supply chain,
and sometimes with little advanced notice. These conditions could also result in increased
commercial disputes and supply interruption risks. In certain instances, it would be difficult and
expensive for us to change suppliers that are critical to our business. On occasion, we must provide
financial support to distressed suppliers or take other measures to protect our supply lines. We
cannot predict with certainty the potential adverse effects these costs might have on our business.
We are subject to possible insolvency of outsourced service providers.
The Company relies on third party service providers for administration of workers’ compensation
claims, health care benefits, pension benefits, stockholder and bondholder registration and similar
services. These service providers contribute to the efficient conduct of the Company’s business.
Insolvency of one or more of these service providers could adversely affect our business.
We are subject to possible insolvency of financial counterparties.
The Company engages in numerous financial transactions and contracts including insurance
policies, letters of credit, credit line agreements, financial derivatives, and investment management
agreements involving various counterparties. The Company is subject to the risk that one or more of
19

these counterparties may become insolvent and therefore be unable to discharge its obligations
under such contracts.
Other risks
A variety of other factors could adversely affect our business.
Any of the following could materially and adversely affect our business: the loss of or changes in
supply contracts or sourcing strategies of our major customers or suppliers; start-up expenses
associated with new vehicle programs or delays or cancellation of such programs, utilization of our
manufacturing facilities, which can be dependent on a single product line or customer; inability to
recover engineering and tooling costs; market and financial consequences of recalls that may be
required on products we supplied; delays or difficulties in new product development; the possible
introduction of similar or superior technologies by others; global excess capacity and vehicle platform
proliferation; and the impact of natural disasters.
Item 1B. Unresolved Staff Comments
The Company has received no written comments regarding its periodic or current reports from
the staff of the Securities and Exchange Commission that were issued 180 days or more preceding
the end of its 2013 fiscal year that remain unresolved.
20

Item 2. Properties
As of December 31, 2013, the Company had 56 manufacturing, assembly, and technical
locations worldwide. In addition to its 13 U.S. locations, the Company has seven locations in
Germany; six locations in each of China and South Korea; five locations in India; three locations in
each of Japan and Mexico; two locations in Hungary and one location in each of Brazil, France,
Ireland, Italy, Monaco, Poland, Portugal, Spain, Sweden, Thailand and the United Kingdom. The
Company also has several sales offices, warehouses and technical centers. The Company's
worldwide headquarters are located in a leased facility in Auburn Hills, Michigan. In general, the
Company believes its facilities to be suitable and adequate to meet its current and reasonably
anticipated needs.
The following is additional information concerning principal manufacturing, assembly, and
technical facilities operated by the Company, its subsidiaries, and affiliates.
ENGINE(a)
Americas: Europe: Asia:
Asheville, North Carolina Arcore, Italy Aoyama, Japan
Auburn Hills, Michigan Bradford, England Changwon, South Korea (b)
Cadillac, Michigan Kirchheimbolanden, Germany Chennai, India (b)
Dixon, Illinois Ludwigsburg, Germany Chonburi, Thailand (b)
El Salto Jalisco, Mexico Markdorf, Germany Chungju-City, South Korea
Fletcher, North Carolina Muggendorf, Germany Kakkalur, India
Itatiba, Brazil Oroszlany, Hungary Manesar, India (b)
Ithaca, New York Rzeszow, Poland Nabari City, Japan
Marshall, Michigan Tralee, Ireland Ningbo, China (b) (c)
Ramos, Mexico Valenca, Portugal (b) Pyongtaek, South Korea (b) (c)
Vigo, Spain
DRIVETRAIN(a)
Americas: Europe: Asia:
Addison, Illinois (b) Arnstadt, Germany Beijing, China (b)
Auburn Hills, Michigan Heidelberg, Germany Dalian, China (b)
Bellwood, Illinois Ketsch, Germany Eumsung, South Korea
Frankfort, Illinois Landskrona, Sweden (b) Fukuroi City, Japan
Irapuato, Mexico (b) Monte Carlo, Monaco Ochang, South Korea (b)
Livonia, Michigan Szentlorinchata, Hungary (b) Pune, India
Longview, Texas (b) Tulle, France Shanghai, China (b)
Seneca, South Carolina Sirsi, India
Water Valley, Mississippi
(a) The table excludes joint ventures owned less than 50% and administrative offices.
(b) Indicates leased land rights or a leased facility.
(c) City has 2 locations: a wholly owned subsidiary and a joint venture.
21

Item 3. Legal Proceedings
The Company is subject to a number of claims and judicial and administrative proceedings (some
of which involve substantial amounts) arising out of the Company’s business or relating to matters for
which the Company may have a contractual indemnity obligation. See Note 14, “Contingencies,” to
the Consolidated Financial Statements in Item 8 of this report for a discussion of environmental,
product liability and other litigation, which is incorporated herein by reference.
Item 4. Mine Safety Disclosures
Not applicable.
PART II
Item 5. Market for the Registrant's Common Equity, Related Stockholder Matters and IssuerPurchases of Equity Securities
The Company's common stock is listed for trading on the New York Stock Exchange under the
symbol BWA. As of February 7, 2014, there were 2,015 holders of record of Common Stock.
On July 24, 2013 the Company announced the reinstatement of its quarterly dividend. Cash
dividends declared and paid per share, adjusted for the stock split in December 2013, were as
follows:
2013 2012 2011 2010 2009
Dividend amount . . . . . . . . . . . . . . . . . . . . . . . . . . . . . . . . . . . . . . . . . $0.25 $— $— $— $0.06
While the Company currently expects that comparable quarterly cash dividends will continue to
be paid in the future, the dividend policy is subject to review and change at the discretion of the
Board of Directors.
High and low prices (as reported on the New York Stock Exchange composite tape)* for the
Company's common stock for each quarter in 2012 and 2013 were:
Quarter Ended High Low
March 31, 2012 . . . . . . . . . . . . . . . . . . . . . . . . . . . . . . . . . . . . . . . . . . . . . . . . $43.73 $32.14
June 30, 2012 . . . . . . . . . . . . . . . . . . . . . . . . . . . . . . . . . . . . . . . . . . . . . . . . . $43.50 $31.31
September 30, 2012 . . . . . . . . . . . . . . . . . . . . . . . . . . . . . . . . . . . . . . . . . . . . $39.09 $30.09
December 31, 2012 . . . . . . . . . . . . . . . . . . . . . . . . . . . . . . . . . . . . . . . . . . . . $37.44 $30.27
March 31, 2013 . . . . . . . . . . . . . . . . . . . . . . . . . . . . . . . . . . . . . . . . . . . . . . . . $40.05 $35.51
June 30, 2013 . . . . . . . . . . . . . . . . . . . . . . . . . . . . . . . . . . . . . . . . . . . . . . . . . $43.83 $35.22
September 30, 2013 . . . . . . . . . . . . . . . . . . . . . . . . . . . . . . . . . . . . . . . . . . . . $51.63 $42.07
December 31, 2013 . . . . . . . . . . . . . . . . . . . . . . . . . . . . . . . . . . . . . . . . . . . . $56.45 $48.13
* — All amounts have been adjusted for the two-for-one stock split that was effected through a
stock dividend on December 16, 2013.
22

The line graph below compares the cumulative total shareholder return on our Common Stock
with the cumulative total return of companies on the Standard & Poor’s (S&P’s) 500 Stock Index,
companies within our peer group (as selected by the Company) and companies within Standard
Industrial Code (“SIC”) 3714 — Motor Vehicle Parts.
COMPARISON OF 5 YEAR CUMULATIVE TOTAL RETURN*Among BorgWarner Inc., the S&P 500 Index,
SIC 3714 Motor Vehicle Parts and a Peer Group
$600BorgWarner Inc.S&P 500Peer GroupSIC Code Index
$500
$400
$300
$200
$100
$02008 2009 2010 2011 2012 2013
* $100 invested on 12/31/2008 in stock or index, including reinvestment of dividends. Fiscal year
ending December 31.
Copyright© 2014 S&P, a division of The McGraw-Hill Companies Inc. All rights reserved.
BWA, S&P 500 and Peer Group data are from Capital IQ; SIC Code Index data are from Research
Data Group
December 31,
2008 2009 2010 2011 2012 2013
BorgWarner Inc.(1) 100.00 153.61 334.60 297.74 331.18 519.66
S&P 500(2) 100.00 126.46 145.51 148.59 172.37 228.19
SIC Code Index(3) 100.00 143.71 210.59 199.56 238.84 356.63
Peer Group(4) 100.00 182.52 308.11 230.01 266.41 433.27
(1) BorgWarner Inc.
(2) S&P 500 — Standard & Poor’s 500 Total Return Index
(3) Standard Industrial Code (“SIC”) 3714-Motor Vehicle Parts
(4) Selected Peer Group Companies — Consists of the following companies:
American Axle & Manufacturing Holdings, Inc., Autoliv, Inc., Gentex Corporation, Johnson
Controls, Inc., Lear Corporation (pre-2009 bankruptcy), Magna International Inc., Meritor, Inc.,
Modine Manufacturing Company, Tenneco Inc., TRW Automotive Holdings Corp. and Visteon
Corporation (pre-2009 bankruptcy)
Repurchase of Equity Securities
The Company's Board of Directors authorized the purchase of up to 59.6 million shares of the
Company's common stock. As of December 31, 2013, the Company had repurchased 48,581,610
shares under the Common Stock Repurchase Program. All shares purchased under this authorization
have been and will continue to be repurchased in the open market at prevailing prices and at times
and in amounts to be determined by management as market conditions and the Company’s capital
position warrant. The Company may use Rule 10b5-1 plans to facilitate share repurchases.
23

Repurchased shares will be deemed common stock held in treasury and may subsequently be
reissued for general corporate purposes.
Employee transactions include restricted shares withheld to offset statutory minimum tax
withholding that occurs upon vesting of restricted shares. The BorgWarner Inc. Amended and
Restated 2004 Stock Incentive Plan provides that the withholding obligations be settled by the
Company retaining stock that is part of the Award. Withheld shares will be deemed common stock
held in treasury and may subsequently be reissued for general corporate purposes.
The following table provides information about the Company’s purchases of its equity securities
that are registered pursuant to Section 12 of the Exchange Act during the quarter ended
December 31, 2013:
ISSUER REPURCHASES OF EQUITY SECURITIES
Period
Totalnumber of
sharesrepurchased
Averageprice
per share
Total numberof shares
purchased aspart of publicly
announcedplans or programs
Maximumnumber of
shares that mayyet be purchased
Month Ended October 31, 2013
Employee transactions . . . . . . . . . . . . . . . . . . — $ — —
Month Ended November 30, 2013
Employee transactions . . . . . . . . . . . . . . . . . . 227,350 $51.24 —
Month Ended December 31, 2013
Employee transactions . . . . . . . . . . . . . . . . . . — $ — —
Equity Compensation Plan Information
As of December 31, 2013, the number of stock options and restricted common stock outstanding
under our equity compensation plans, the weighted average exercise price of outstanding stock
options and restricted common stock and the number of securities remaining available for issuance
were as follows:
Plan category
Number of securitiesto be issued upon
exercise ofoutstanding options,
restricted common stock,warrants and rights
(a)
Weighted averageexercise price of
outstanding options,restricted common stock,
warrants and rights(b)
Number of securitiesremaining available forfuture issuance underequity compensation
plans (excludingsecurities
reflected in column (a))(c)
Equity compensation plans
approved by security holders . . . . 3,407,542 $24.95 3,121,595
Equity compensation plans not
approved by security holders . . . . — $ — —
Total . . . . . . . . . . . . . . . . . . . . . . . . 3,407,542 $24.95 3,121,595
24
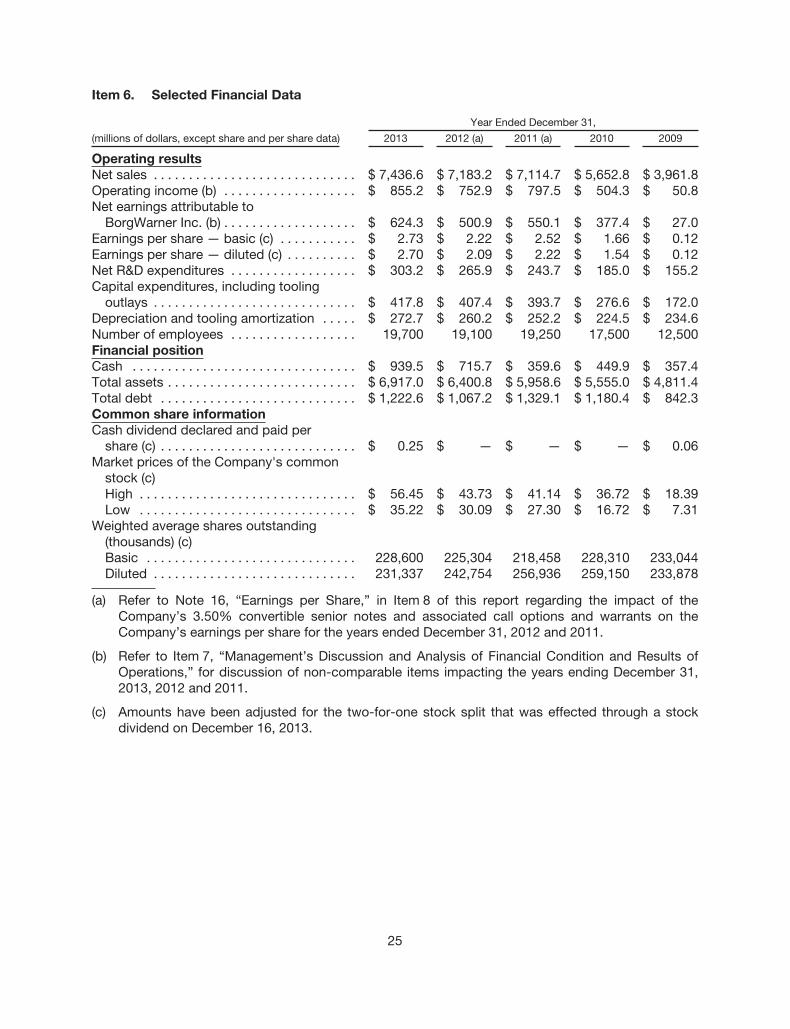
Item 6. Selected Financial Data
Year Ended December 31,
(millions of dollars, except share and per share data) 2013 2012 (a) 2011 (a) 2010 2009
Operating resultsNet sales . . . . . . . . . . . . . . . . . . . . . . . . . . . . . $ 7,436.6 $ 7,183.2 $ 7,114.7 $ 5,652.8 $ 3,961.8
Operating income (b) . . . . . . . . . . . . . . . . . . . $ 855.2 $ 752.9 $ 797.5 $ 504.3 $ 50.8
Net earnings attributable to
BorgWarner Inc. (b) . . . . . . . . . . . . . . . . . . . $ 624.3 $ 500.9 $ 550.1 $ 377.4 $ 27.0
Earnings per share — basic (c) . . . . . . . . . . . $ 2.73 $ 2.22 $ 2.52 $ 1.66 $ 0.12
Earnings per share — diluted (c) . . . . . . . . . . $ 2.70 $ 2.09 $ 2.22 $ 1.54 $ 0.12
Net R&D expenditures . . . . . . . . . . . . . . . . . . $ 303.2 $ 265.9 $ 243.7 $ 185.0 $ 155.2
Capital expenditures, including tooling
outlays . . . . . . . . . . . . . . . . . . . . . . . . . . . . . $ 417.8 $ 407.4 $ 393.7 $ 276.6 $ 172.0
Depreciation and tooling amortization . . . . . $ 272.7 $ 260.2 $ 252.2 $ 224.5 $ 234.6
Number of employees . . . . . . . . . . . . . . . . . . 19,700 19,100 19,250 17,500 12,500
Financial positionCash . . . . . . . . . . . . . . . . . . . . . . . . . . . . . . . . $ 939.5 $ 715.7 $ 359.6 $ 449.9 $ 357.4
Total assets . . . . . . . . . . . . . . . . . . . . . . . . . . . $ 6,917.0 $ 6,400.8 $ 5,958.6 $ 5,555.0 $ 4,811.4
Total debt . . . . . . . . . . . . . . . . . . . . . . . . . . . . $ 1,222.6 $ 1,067.2 $ 1,329.1 $ 1,180.4 $ 842.3
Common share informationCash dividend declared and paid per
share (c) . . . . . . . . . . . . . . . . . . . . . . . . . . . . $ 0.25 $ — $ — $ — $ 0.06
Market prices of the Company's common
stock (c)
High . . . . . . . . . . . . . . . . . . . . . . . . . . . . . . . $ 56.45 $ 43.73 $ 41.14 $ 36.72 $ 18.39
Low . . . . . . . . . . . . . . . . . . . . . . . . . . . . . . . $ 35.22 $ 30.09 $ 27.30 $ 16.72 $ 7.31
Weighted average shares outstanding
(thousands) (c)
Basic . . . . . . . . . . . . . . . . . . . . . . . . . . . . . . 228,600 225,304 218,458 228,310 233,044
Diluted . . . . . . . . . . . . . . . . . . . . . . . . . . . . . 231,337 242,754 256,936 259,150 233,878
(a) Refer to Note 16, “Earnings per Share,” in Item 8 of this report regarding the impact of the
Company’s 3.50% convertible senior notes and associated call options and warrants on the
Company’s earnings per share for the years ended December 31, 2012 and 2011.
(b) Refer to Item 7, “Management’s Discussion and Analysis of Financial Condition and Results of
Operations,” for discussion of non-comparable items impacting the years ending December 31,
2013, 2012 and 2011.
(c) Amounts have been adjusted for the two-for-one stock split that was effected through a stock
dividend on December 16, 2013.
25

Item 7. Management’s Discussion and Analysis of Financial Condition and Results ofOperations
INTRODUCTION
BorgWarner Inc. and Consolidated Subsidiaries (the “Company”) is a leading global supplier of
highly engineered automotive systems and components primarily for powertrain applications. Our
products help improve vehicle performance, fuel efficiency, stability and air quality. These products
are manufactured and sold worldwide, primarily to original equipment manufacturers (“OEMs”) of light
vehicles (passenger cars, sport-utility vehicles (“SUVs”), vans and light trucks). The Company’s
products are also sold to other OEMs of commercial vehicles (medium-duty trucks, heavy-duty trucks
and buses) and off-highway vehicles (agricultural and construction machinery and marine
applications). We also manufacture and sell our products to certain Tier One vehicle systems
suppliers and into the aftermarket for light, commercial and off-highway vehicles. The Company
operates manufacturing facilities serving customers in the Americas, Europe and Asia and is an
original equipment supplier to every major automotive OEM in the world.
The Company’s products fall into two reporting segments: Engine and Drivetrain. The Engine
segment’s products include turbochargers, timing devices and chain products, emissions systems,
thermal systems, diesel coldstart and gasoline ignition technology. The Drivetrain segment’s products
include transmission components and systems and AWD torque management systems.
Stock Split
On November 13, 2013, the Company’s Board of Directors declared a two-for-one stock split
effected in the form of a stock dividend on our common stock. To implement this stock split, shares
of common stock were issued on December 16, 2013 to stockholders of record as of of the close of
business on December 2, 2013. All prior year share and per share amounts disclosed in this
document have been restated to reflect the two-for-one stock split.
RESULTS OF OPERATIONS
A summary of our operating results for the years ended December 31, 2013, 2012 and 2011 is as
follows:
Year Ended December 31,
(millions of dollars, except per share data) 2013 2012 2011
Net sales . . . . . . . . . . . . . . . . . . . . . . . . . . . . . . . . . . . . . . . . $7,436.6 $7,183.2 $7,114.7Cost of sales . . . . . . . . . . . . . . . . . . . . . . . . . . . . . . . . . . . . 5,879.1 5,716.3 5,704.3
Gross profit . . . . . . . . . . . . . . . . . . . . . . . . . . . . . . . . . . . . 1,557.5 1,466.9 1,410.4Selling, general and administrative expenses . . . . . . . . . . 639.7 629.3 621.0Other expense (income) . . . . . . . . . . . . . . . . . . . . . . . . . . . 62.6 84.7 (8.1)
Operating income . . . . . . . . . . . . . . . . . . . . . . . . . . . . . . . 855.2 752.9 797.5Equity in affiliates’ earnings, net of tax . . . . . . . . . . . . . . . . (43.5) (42.8) (38.2)Interest income . . . . . . . . . . . . . . . . . . . . . . . . . . . . . . . . . . (4.8) (4.7) (4.8)Interest expense and finance charges . . . . . . . . . . . . . . . . 34.2 39.4 74.6
Earnings before income taxes and noncontrollinginterest . . . . . . . . . . . . . . . . . . . . . . . . . . . . . . . . . . . . . 869.3 761.0 765.9
Provision for income taxes . . . . . . . . . . . . . . . . . . . . . . . . . 218.3 238.6 195.3
Net earnings . . . . . . . . . . . . . . . . . . . . . . . . . . . . . . . . . . . 651.0 522.4 570.6Net earnings attributable to the noncontrolling interest,
net of tax . . . . . . . . . . . . . . . . . . . . . . . . . . . . . . . . . . . . . . 26.7 21.5 20.5
Net earnings attributable to BorgWarner Inc. . . . . . . . . $ 624.3 $ 500.9 $ 550.1
Earnings per share — diluted . . . . . . . . . . . . . . . . . . . . . . . $ 2.70 $ 2.09 $ 2.22
26

Non-comparable items impacting the Company's earnings per diluted share and net earnings
The Company’s earnings per diluted share were $2.70, $2.09 and $2.22 for the years ended
December 31, 2013, 2012 and 2011, respectively. The Company believes the following table is useful
in highlighting non-comparable items that impacted its earnings per diluted share:
Year Ended December 31,
2013 2012 2011
Non-comparable items:
Restructuring expense . . . . . . . . . . . . . . . . . . . . . . . . . . . . . . . . . $(0.20) $(0.08) $ —
Program termination agreement . . . . . . . . . . . . . . . . . . . . . . . . . (0.03) — —
Retirement related obligations . . . . . . . . . . . . . . . . . . . . . . . . . . . (0.02) (0.05) —
Tax adjustments . . . . . . . . . . . . . . . . . . . . . . . . . . . . . . . . . . . . . . 0.05 (0.08) 0.03
Loss from disposal activities . . . . . . . . . . . . . . . . . . . . . . . . . . . . — (0.19) (0.10)
Patent infringement settlement, net of legal costs incurred . . . — — 0.07
Total impact of non-comparable items per share — diluted: . . $(0.20) $(0.40) $ —
A summary of non-comparable items impacting the Company’s net earnings for the years ended
December 31, 2013, 2012 and 2011 is as follows:
Year ended December 31, 2013:
• The Company incurred restructuring expense of $52.3 million, primarily due to the initiation of
Drivetrain segment actions designed to improve future profitability and competitiveness. This
expense included $37.3 million of asset impairment, $10.4 million related to employee
termination benefits and $4.6 million of other expense. The Company estimates that additional
restructuring charges of approximately $90 million will be incurred over the next two years
related to the Drivetrain segment restructuring plan.
• The Company incurred $11.3 million of expense related to a program termination agreement.
• Retirement related obligations expense of $5.9 million was primarily related to a first quarter
2013 grant of restricted stock awards to certain retiring Named Executive Officers, for which
the Company waived the forfeiture provision associated with future restricted stock grants
during 2012.
• The Company recorded tax benefits of $7.1 million, $3.8 million and $2.1 million related to
restructuring expense, the program termination agreement and retirement related obligations
discussed above. The Company also recorded a net tax benefit of $11.7 million, which includes
tax benefits of $6.7 million related to the extension of the federal research and development
credit and other international tax provisions resulting from the retroactive impact of U.S.
legislation enacted in January 2013, $2.2 million related to 2012 provision to return and other
tax adjustments and $8.0 million related to the reversal of certain state deferred tax asset
valuation allowances, partially offset by a $5.2 million tax expense related to comprehensive
income and other tax adjustments.
Year ended December 31, 2012:
• The Company incurred $39.7 million of expense and $5.7 million of tax expense associated
with the loss on sale of the spark plug business, primarily related to the write-down of prior
purchase price accounting adjustments included within the disposal group. The Company also
recorded restructuring expense of $27.4 million, primarily associated with the disposal and
future requirements of BERU’s on-going business, which was partially offset by a tax benefit of
$7.7 million.
27

• Retirement related obligations of $17.3 million are comprised of a $5.7 million loss resulting
from the settlement of a portion of the Muncie Plant’s pension obligation and an $11.6 million
expense associated with the retirement of certain Named Executive Officers.These obligations
were partially offset by a $6.1 million tax benefit.
• The Company incurred $19.8 million of tax expense resulting from other tax adjustments.
These other tax adjustments primarily included tax expense resulting from the settlement of
certain tax audits, the Company’s second quarter 2012 decision to change its cash repatriation
assertion for some of its foreign subsidiaries and a correction of the income taxes payable
balance, partially offset by a tax benefit related to certain countries enacting changes to their
respective statutory income tax rates.
Year ended December 31, 2011:
• The Company incurred $21.5 million in expense associated with the loss on sale of the tire
pressure monitoring business, including costs related to the divestiture, and a write-down of a
portion of the ignitor and electronic business. In addition, the Company recorded $1.4 million
of tax benefit associated with the disposals and $4.1 million of tax expense related to an
intercompany disposal transaction.
• The Company recorded a $29.1 million patent infringement settlement gain, net of legal costs
incurred, which was partially offset by $11.0 million of tax expense.
• The Company recorded a $6.2 million benefit related to tax adjustments resulting from a
change in state corporate income tax legislation as well as an adjustment of the Company’s tax
accounts as a result of the closure of certain tax audits.
Net Sales
Net sales for the year ended December 31, 2013 totaled $7,436.6 million, a 3.5% increase from
the year ended December 31, 2012. Excluding the impact of 2012 dispositions and strengthening
foreign currencies, primarily the Euro, net sales increased approximately 4%.
Net sales for the year ended December 31, 2012 totaled $7,183.2 million, a 1.0% increase from
the year ended December 31, 2011. Excluding the impact of the first quarter 2011 acquisition of
Haldex Traction Holding AB, fourth quarter of 2011 and third quarter of 2012 dispositions and the
impact of weaker foreign currencies, primarily the Euro, net sales increased approximately 6%.
28

The following table details our results of operations as a percentage of net sales:
Year Ended December 31,
(percentage of net sales) 2013 2012 2011
Net sales . . . . . . . . . . . . . . . . . . . . . . . . . . . . . . . . . . . . . . . . . . . . . . . . . . . . . . . . . . 100.0%100.0%100.0%
Cost of sales . . . . . . . . . . . . . . . . . . . . . . . . . . . . . . . . . . . . . . . . . . . . . . . . . . . . . . . 79.1 79.6 80.2
Gross profit . . . . . . . . . . . . . . . . . . . . . . . . . . . . . . . . . . . . . . . . . . . . . . . . . . . . . . 20.9 20.4 19.8
Selling, general and administrative expenses . . . . . . . . . . . . . . . . . . . . . . . . . . . . 8.6 8.8 8.7
Other expense (income) . . . . . . . . . . . . . . . . . . . . . . . . . . . . . . . . . . . . . . . . . . . . . . 0.8 1.2 (0.1)
Operating income . . . . . . . . . . . . . . . . . . . . . . . . . . . . . . . . . . . . . . . . . . . . . . . . . 11.5 10.4 11.2
Equity in affiliates’ earnings, net of tax . . . . . . . . . . . . . . . . . . . . . . . . . . . . . . . . . . (0.6) (0.6) (0.5)
Interest income . . . . . . . . . . . . . . . . . . . . . . . . . . . . . . . . . . . . . . . . . . . . . . . . . . . . . (0.1) (0.1) (0.1)
Interest expense and finance charges . . . . . . . . . . . . . . . . . . . . . . . . . . . . . . . . . . 0.5 0.5 1.0
Earnings before income taxes and noncontrolling interest . . . . . . . . . . . . . . . . 11.7 10.6 10.8
Provision for income taxes . . . . . . . . . . . . . . . . . . . . . . . . . . . . . . . . . . . . . . . . . . . 2.9 3.3 2.8
Net earnings . . . . . . . . . . . . . . . . . . . . . . . . . . . . . . . . . . . . . . . . . . . . . . . . . . . . . 8.8 7.3 8.0
Net earnings attributable to the noncontrolling interest, net of tax . . . . . . . . . . . 0.4 0.3 0.3
Net earnings attributable to BorgWarner Inc. . . . . . . . . . . . . . . . . . . . . . . . . . . . 8.4% 7.0% 7.7%
Cost of sales as a percentage of net sales was 79.1%, 79.6% and 80.2% in the years ended
December 31, 2013, 2012 and 2011, respectively. The Company’s material cost of sales was
approximately 50% of net sales in the years ended December 31, 2013, 2012 and 2011. The
Company’s remaining cost to convert raw material to finished product, which includes direct labor
and manufacturing overhead, has continued to improve during the years ended December 31, 2013
and December 31, 2012 compared to December 31, 2011 as a result of increased net sales and
successful cost reduction actions. Gross profit as a percentage of net sales was 20.9%, 20.4% and
19.8% in the years ended December 31, 2013, 2012 and 2011, respectively.
Selling, general and administrative expenses (“SG&A”) was $639.7 million, $629.3 million and
$621.0 million or 8.6%, 8.8% and 8.7% of net sales for the years ended December 31, 2013, 2012
and 2011, respectively. SG&A remained relatively flat during the years ended December 31, 2013,
2012 and 2011 as a result of increased research and development (“R&D”) costs included in SG&A,
offset by continued cost management.
R&D costs, net of customer reimbursements, was $303.2 million, or 4.1% of net sales, in the year
ended December 31, 2013, compared to $265.9 million, or 3.7% of net sales, and $243.7 million, or
3.4% of net sales, in the years ended December 31, 2012 and 2011, respectively. We will continue to
invest in a number of cross-business R&D programs, as well as a number of other key programs, all
of which are necessary for short- and long-term growth. Our current long-term expectation for R&D
spending is approximately 4% of net sales.
Other expense (income) was $62.6 million, $84.7 million and $(8.1) million for the years ended
December 31, 2013, 2012 and 2011, respectively. This line item is primarily comprised of transactions
discussed within the subtitle “Non-comparable items impacting the Company’s earnings per diluted
share and net earnings” above.
Equity in affiliates' earnings, net of tax was $43.5 million, $42.8 million and $38.2 million in the
years ended December 31, 2013, 2012 and 2011, respectively. This line item is primarily driven by the
results of our 50%-owned Japanese joint venture, NSK-Warner, and our 32.6%-owned Indian joint
venture, Turbo Energy Limited (“TEL”). The increase in equity in affiliates’ earnings for the year ended
29

December 31, 2012 compared with the year ended December 31, 2011 was primarily due to year over
year growth in the Japanese auto market resulting in improved earnings from the Company's interest
in NSK-Warner. Refer to Note 5 to the Consolidated Financial Statements in Item 8 of this report for
further discussion of NSK-Warner.
Interest expense and finance charges were $34.2 million, $39.4 million and $74.6 million in the
years ended December 31, 2013, 2012 and 2011, respectively. The decrease in interest expense for
the year ended December 31, 2013 compared with the year ended December 31, 2012 was primarily
due to the April 2012 settlement of the Company’s convertible senior notes.The decrease in interest
expense for the year ended December 31, 2012 compared with the year ended December 31, 2011
was primarily due to the April 2012 settlement of the Company’s convertible senior notes, the
ineffectiveness of cross-currency swaps and higher capitalized interest associated with increased
long-term capital projects.
Provision for income taxes The provision for income taxes resulted in an effective tax rate of
25.1% for the year ended December 31, 2013, compared with rates of 31.4% and 25.5% for the
years ended December 31, 2012 and 2011, respectively.
The effective tax rate of 25.1% for the year ended December 31, 2013 includes tax benefits of
$7.1 million, $3.8 million and $2.1 million related to restructuring expense, the program termination
agreement and retirement related obligations discussed in the Other Expense (Income) footnote. This
rate also includes a net tax benefit of $11.7 million, which is comprised of tax benefits of $6.7 million
related to the extension of the federal research and development credit and other international tax
provisions resulting from the retroactive impact of U.S. legislation enacted in January 2013,
$2.2 million related to 2012 provision to return and other tax adjustments and $8.0 million related to
the reversal of certain state deferred tax asset valuation allowances, partially offset by a $5.2 million
tax expense related to comprehensive income and other tax adjustments. Excluding the impact of
these non-comparable items, the Company’s annual effective tax rate associated with ongoing
operations for 2013 was 25.9%.
The effective tax rate of 31.4% for the year ended December 31, 2012 includes a net tax benefit
of $2.0 million associated with the loss from disposal activities and restructuring expense. The
$2.0 million net benefit is comprised of a tax benefit of $7.7 million associated with restructuring
expense, partially offset by tax expense of $5.7 million resulting from the sale of the spark plug
business. Additionally, the provision includes a tax benefit of $6.1 million related to retirement related
obligations and additional tax expense of $19.8 million resulting from other tax adjustments. These
other tax adjustments include $5.9 million of tax expense primarily resulting from the settlement of
certain tax audits, $7.5 million of tax expense associated with the Company’s second quarter 2012
decision to change its cash repatriation assertion for some of its foreign subsidiaries, $4.7 million of
tax benefit related to certain countries enacting changes to their respective statutory income tax rates
and $11.1 million of U.S. tax expense to correct the income taxes payable balance. Excluding the
impact of these non-comparable items, the Company’s annual effective tax rate associated with
ongoing operations for 2012 was 26.8%.
The effective tax rate of 25.5% for the year ended December 31, 2011 includes $11.0 million of
tax expense associated with the Company’s patent infringement settlement, $2.7 million of tax
expense associated with the loss on disposals and a tax benefit of $6.2 million resulting from other
tax adjustments. These other tax adjustments related to a change in state corporate income tax
legislation as well as an adjustment of the Company’s tax accounts as a result of the closure of
certain tax audits. This rate differs from the U.S. statutory rate primarily due to foreign rates, which
differ from those in the U.S., the realization of certain business tax credits including foreign tax credits
and favorable permanent differences between book and tax treatment for items, including equity in
30

affiliates’ earnings. Excluding the impact of these non-comparable items, the Company’s annual
effective tax rate associated with ongoing operations for 2011 was 24.8%.
Net earnings attributable to the noncontrolling interest, net of tax of $26.7 million for the year
ended December 31, 2013 increased by $5.2 million and $6.2 million compared to 2013 for the years
ended December 31, 2012 and 2011, respectively. The increases during the years ended
December 31, 2013 and December 31, 2012 compared to the year ended December 31, 2011 are
primarily related to higher sales and earnings by the Company’s joint ventures.
Results By Reporting Segment
The Company’s business is comprised of two reporting segments: Engine and Drivetrain. These
segments are strategic business groups, which are managed separately as each represents a specific
grouping of related automotive components and systems.
The Company allocates resources to each segment based upon the projected after-tax return on
invested capital (“ROIC”) of its business initiatives. ROIC is comprised of Adjusted EBIT after
deducting notional taxes compared to the projected average capital investment required. Adjusted
EBIT is comprised of earnings before interest, income taxes and noncontrolling interest (“EBIT”)
adjusted for restructuring, goodwill impairment charges, affiliates’ earnings and other items not
reflective of ongoing operating income or loss.
Adjusted EBIT is the measure of segment income or loss used by the Company. The Company
believes Adjusted EBIT is most reflective of the operational profitability or loss of our reporting
segments.
The following tables show segment information and Adjusted EBIT for the Company’s reporting
segments.
Net Sales by Reporting Segment
Year Ended December 31,
(millions of dollars) 2013 2012 2011
Engine . . . . . . . . . . . . . . . . . . . . . . . . . . . . . . . . . . . . . . . . . . $5,022.1 $4,913.0 $5,050.6
Drivetrain . . . . . . . . . . . . . . . . . . . . . . . . . . . . . . . . . . . . . . . 2,446.5 2,298.7 2,084.5
Inter-segment eliminations . . . . . . . . . . . . . . . . . . . . . . . . . (32.0) (28.5) (20.4)
Net sales . . . . . . . . . . . . . . . . . . . . . . . . . . . . . . . . . . . . . . $7,436.6 $7,183.2 $7,114.7
31

Adjusted Earnings Before Interest, Income Taxes and Noncontrolling Interest (“Adjusted EBIT”)
Year Ended December 31,
(millions of dollars) 2013 2012 2011
Engine . . . . . . . . . . . . . . . . . . . . . . . . . . . . . . . . . . . . . . . . . . . . . $ 826.0 $786.4 $774.3
Drivetrain . . . . . . . . . . . . . . . . . . . . . . . . . . . . . . . . . . . . . . . . . . . 252.2 209.1 161.2
Adjusted EBIT . . . . . . . . . . . . . . . . . . . . . . . . . . . . . . . . . . . . . 1,078.2 995.5 935.5
Restructuring expense . . . . . . . . . . . . . . . . . . . . . . . . . . . . . . . . 52.3 27.4 —
Program termination agreement . . . . . . . . . . . . . . . . . . . . . . . . 11.3 — —
Retirement related obligations . . . . . . . . . . . . . . . . . . . . . . . . . 5.9 17.3 —
Loss from disposal activities . . . . . . . . . . . . . . . . . . . . . . . . . . . — 39.7 21.5
Patent infringement settlement, net of legal costs
incurred . . . . . . . . . . . . . . . . . . . . . . . . . . . . . . . . . . . . . . . . . . — — (29.1)
Corporate, including equity in affiliates’ earnings and stock-
based compensation . . . . . . . . . . . . . . . . . . . . . . . . . . . . . . . 110.0 115.4 107.4
Interest income . . . . . . . . . . . . . . . . . . . . . . . . . . . . . . . . . . . . . . (4.8) (4.7) (4.8)
Interest expense and finance charges . . . . . . . . . . . . . . . . . . . 34.2 39.4 74.6
Earnings before income taxes and noncontrolling
interest . . . . . . . . . . . . . . . . . . . . . . . . . . . . . . . . . . . . . . . . . 869.3 761.0 765.9
Provision for income taxes . . . . . . . . . . . . . . . . . . . . . . . . . . . . 218.3 238.6 195.3
Net earnings . . . . . . . . . . . . . . . . . . . . . . . . . . . . . . . . . . . . . . 651.0 522.4 570.6
Net earnings attributable to the noncontrolling interest, net
of tax . . . . . . . . . . . . . . . . . . . . . . . . . . . . . . . . . . . . . . . . . . . . 26.7 21.5 20.5
Net earnings attributable to BorgWarner Inc. . . . . . . . . . . . $ 624.3 $500.9 $550.1
The Engine segment’s net sales for the year ended December 31, 2013 increased $109.1 million,
or 2.2%, and segment Adjusted EBIT increased $39.6 million, or 5.0%, from the year ended
December 31, 2012. Excluding the impact of 2012 dispositions and strengthening foreign currencies,
primarily the Euro, net sales increased approximately 4% from the year ended December 31, 2012
primarily due to higher sales of turbochargers, EGR components and engine timing systems including
variable cam timing devices. The segment Adjusted EBIT margin was 16.4% for the year ended
December 31, 2013, up from 16.0% in the year ended December 31, 2012. The Adjusted EBIT margin
increase was primarily driven by continued cost management.
The Engine segment’s net sales for the year ended December 31, 2012 decreased $137.6 million,
or 2.7%, and segment Adjusted EBIT increased $12.1 million, or 1.6%, from the year ended
December 31, 2011. Excluding the impact of the fourth quarter 2011 and third quarter 2012
dispositions and weaker foreign currencies, primarily the Euro, net sales increased approximately 4%
from the year ended December 31, 2011. This increase was primarily driven by global growth in most
major product groups. The segment Adjusted EBIT margin was 16.0% for the year ended
December 31, 2012, up from 15.3% in the year ended December 31, 2011. The Adjusted EBIT margin
increase was primarily driven by continued cost management.
The Drivetrain segment’s net sales for the year ended December 31, 2013 increased $147.8
million, or 6.4%, and segment Adjusted EBIT increased $43.1 million, or 20.6%, from the year ended
December 31, 2012. Excluding the impact of strengthening foreign currencies, primarily the Euro, net
sales increased approximately 4% from the year ended December 31, 2012 primarily due to higher
sales of all-wheel drive systems and transmission components. The segment Adjusted EBIT margin
was 10.3% in the year ended December 31, 2013, up from 9.1% in the year ended December 31,
2012. The Adjusted EBIT margin increase was primarily driven by operational improvements and
continued cost management.
32

The Drivetrain segment's net sales for the year ended December 31, 2012 increased $214.2
million, or 10.3%, and segment Adjusted EBIT increased $47.9 million, or 29.7%, from the year ended
December 31, 2011. Excluding the acquisition of Haldex Traction AB and the impact of weaker
foreign currencies, primarily the Euro, net sales increased approximately 13% from the year ended
December 31, 2011. This increase was primarily driven by strong global growth in all major product
groups. The segment Adjusted EBIT margin was 9.1% in the year ended December 31, 2012, up from
7.7% in the year ended December 31, 2011. The Adjusted EBIT margin increase was primarily driven
by strong global growth in all major product groups, operational improvements and continued cost
management.
Corporate represents headquarters’ expenses not directly attributable to the individual
segments, expenses associated with divested operations and equity in affiliates’ earnings. This net
expense was $110.0 million, $115.4 million and $107.4 million for the years ended December 31,
2013, 2012 and 2011, respectively.
Outlook
Our overall outlook for 2014 is positive. The Company expects moderate global vehicle
production growth in 2014 compared with 2013. However, the Company’s sales growth is expected
to outpace global vehicle production in 2014 due to rapid adoption of BorgWarner products around
the world.
The Company maintains a positive long-term outlook for its global business and is committed to
new product development and strategic capital investments to enhance its product leadership
strategy. The trends that are driving our long-term growth are expected to continue, including the
growth of direct injection diesel and gasoline engines worldwide, the increased adoption of
automated transmissions in Europe and Asia-Pacific, and the move to variable cam and chain engine
timing systems in Europe and Asia-Pacific.
LIQUIDITY AND CAPITAL RESOURCES
The Company maintains various liquidity sources including cash and cash equivalents and the
unused portion of our multi-currency revolving credit agreement. At December 31, 2013, the
Company had $939.5 million of cash, of which $936.8 million of cash was held by our subsidiaries
outside of the United States. Cash held by these subsidiaries is used to fund foreign operational
activities and future investments, including acquisitions. The vast majority of cash held outside the
United States is available for repatriation, however, doing so could result in increased foreign and U.S.
federal, state and local income taxes. A deferred tax liability has been recorded for the portion of
these funds anticipated to be repatriated to the United States. The Company uses its U.S. liquidity for
various corporate purposes, including but not limited to, debt service, share repurchases, dividend
distributions and other corporate expenses.
The Company’s multi-currency revolving credit facility includes a feature that allows the
Company’s borrowings to be increased to $1 billion. Utilizing this feature, on April 12, 2013, the
Company increased its multi-currency revolving credit facility from $650 million to $750 million. The
credit facility provides for borrowings through June 30, 2016 and is guaranteed by the Company’s
material domestic subsidiaries. The credit facility has two key financial covenants, a debt compared
to EBITDA (“Earnings Before Interest, Taxes, Depreciation and Amortization”) test and an interest
coverage test. The Company was in compliance with all covenants at December 31, 2013 and
expects to remain compliant in future periods. At December 31, 2013 and December 31, 2012, the
Company had outstanding borrowings of $320.0 million and $140.0 million, respectively, under this
facility.
33

On October 18, 2013 and July 24, 2013, the Company’s Board of Directors declared a quarterly
cash dividend of $0.125 per share of common stock. These dividends were paid on November 15,
2013 to shareholders of record on November 1, 2013 and August 15, 2013 to shareholders of record
on August 5, 2013, respectively. Additionally, on January 22, 2014, the Company’s Board of Directors
declared a quarterly cash dividend of $0.125, payable on February 17, 2014 to shareholders of record
on February 3, 2014.
On April 9, 2009, the Company issued $373.8 million in convertible senior notes, which were
settled in April 2012 by delivering approximately 22.8 million shares of common stock held in treasury
to the note holders. The settlement resulted in a reduction in the current portion of long-term debt of
$373.8 million, a reduction in common stock held in treasury of $617.3 million and a reduction in
capital in excess of par value of $243.5 million.
In conjunction with the convertible senior note offering, the Company entered into a bond hedge
overlay, including both call options and warrants, at a net pre-tax cost of $25.2 million, effectively
raising the conversion premium to 50%, or approximately $19.31 per share. On April 16, 2012, the
Company settled the call option portion of the bond hedge overlay, receiving approximately
13.0 million shares of its common stock. The settlement resulted in an increase to common stock held
in treasury of $503.9 million offset by an increase to capital in excess of par value of $503.9 million.
During the third and fourth quarters of 2012, the Company settled the warrants included in the
bond hedge overlay, delivering approximately 9.8 million shares of its common stock held in treasury,
resulting in a reduction in common stock held in treasury of $338.5 million offset by a reduction to
capital in excess of par value of $338.5 million.
On February 11, 2014, the Company’s universal shelf registration expired and the Company
expects to renew its universal shelf registration with the Securities and Exchange Commission in the
first quarter of 2014, which will have an unlimited amount of various debt and equity instruments that
could be issued.
From a credit quality perspective, the Company has a credit rating of Baa2 from Moody’s. In April
2012, the Company’s credit rating was raised to BBB+ from BBB by both Standard & Poor’s and
Fitch Ratings. The current outlook from Moody’s, Standard & Poor’s and Fitch Ratings is stable. None
of the Company’s debt agreements require accelerated repayment in the event of a downgrade in
credit ratings.
Capitalization
December 31,
(millions of dollars) 2013 2012
Notes payable and short-term debt . . . . . . . . . . . . . . . . . . . . . . . . . . . . $ 201.6 $ 243.4
Long-term debt . . . . . . . . . . . . . . . . . . . . . . . . . . . . . . . . . . . . . . . . . . . . 1,021.0 823.8
Total debt . . . . . . . . . . . . . . . . . . . . . . . . . . . . . . . . . . . . . . . . . . . . . . . 1,222.6 1,067.2
Less: cash . . . . . . . . . . . . . . . . . . . . . . . . . . . . . . . . . . . . . . . . . . . . . . . . . 939.5 715.7
Total debt, net of cash . . . . . . . . . . . . . . . . . . . . . . . . . . . . . . . . . . . . . 283.1 351.5
Total equity . . . . . . . . . . . . . . . . . . . . . . . . . . . . . . . . . . . . . . . . . . . . . . . . 3,632.4 3,146.1
Total capitalization . . . . . . . . . . . . . . . . . . . . . . . . . . . . . . . . . . . . . . . . $3,915.5 $3,497.6
Total debt, net of cash, to capital ratio . . . . . . . . . . . . . . . . . . . . . . 7.2% 10.0%
34

Balance sheet debt increased by $155.4 million and cash increased by $223.8 million compared
with December 31, 2012. The $68.4 million decrease in balance sheet debt (net of cash) was primarily
due to net cash provided by operating activities partially offset by capital expenditures, share
repurchases and dividends paid to stockholders.
Total equity increased by $486.3 million in the year ended December 31, 2013 as follows:
(millions of dollars)
Balance, January 1, 2013 . . . . . . . . . . . . . . . . . . . . . . . . . . . . . . . . . . . . . . . . . . . . . . $3,146.1
Net earnings . . . . . . . . . . . . . . . . . . . . . . . . . . . . . . . . . . . . . . . . . . . . . . . . . . . . . 651.0
Purchase of treasury stock . . . . . . . . . . . . . . . . . . . . . . . . . . . . . . . . . . . . . . . . . (225.5)
Stock-based compensation . . . . . . . . . . . . . . . . . . . . . . . . . . . . . . . . . . . . . . . . . 28.7
Other comprehensive income . . . . . . . . . . . . . . . . . . . . . . . . . . . . . . . . . . . . . . . 109.0
Dividends declared to BorgWarner stockholders . . . . . . . . . . . . . . . . . . . . . . . . (56.8)
Dividends declared to noncontrolling stockholders . . . . . . . . . . . . . . . . . . . . . . (20.1)
Balance, December 31, 2013 . . . . . . . . . . . . . . . . . . . . . . . . . . . . . . . . . . . . . . . . . . . $3,632.4
Operating Activities
Net cash provided by operating activities was $718.8 million, $878.7 million and $708.2 million in
the years ended December 31, 2013, 2012 and 2011, respectively. The decrease for the year ended
December 31, 2013 compared with the year ended December 31, 2012 primarily reflects working
capital changes partially offset by higher net earnings. The change in working capital is primarily
driven by the $137.5 million discretionary pension contribution made to the Company’s German
pension plans and an increased accounts receivable balance. The increase in the year ended
December 31, 2012 compared to the year ended December 31, 2011 primarily reflects improved
working capital management.
Investing Activities
Net cash used in investing activities was $384.8 million, $345.2 million and $564.5 million in the
years ended December 31, 2013, 2012 and 2011, respectively. The increase in the year ended
December 31, 2013 compared with the year ended December 31, 2012 is primarily driven by cash
received in the third quarter of 2012 from the sale of the Company’s spark plug business. The
decrease in cash used in investing activities in the year ended December 31, 2012 compared to the
year ended December 31, 2011 primarily reflects the cash payment of $203.7 million made during the
first quarter of 2011 for the acquisition of Haldex Traction AB and the cash proceeds of $55.2 million
received during the third quarter of 2012 from the sale of the spark plug business, which was partially
offset by increased capital expenditures. Year over year capital spending increases of $10.4 million
and $13.7 million during the years ended December 31, 2013 and December 31, 2012, respectively,
were primarily due to higher spending levels required to meet increased program launches worldwide.
Financing Activities
Net cash used in financing activities was $135.4 million, $188.6 million and $219.7 million for the
years ended December 31, 2013, 2012 and 2011, respectively. The $53.2 million decrease in the year
ended December 31, 2013 compared with the year ended December 31, 2012 is primarily driven by
an increase in net borrowings and decreased payments for treasury stock purchases, partially offset
by increased payments for dividends and a reduction in proceeds from stock option exercises,
including the tax benefit.
35

The $31.1 million decrease during the year ended December 31, 2012 compared to the year
ended December 31, 2011 was primarily driven by decreased purchases of treasury stock partially
offset by an increase in dividends paid to noncontrolling stockholders.
The Company’s significant contractual obligation payments at December 31, 2013 are as follows:
(millions of dollars) Total 2014 2015-2016 2017-2018 After 2018
Other postretirement employee benefits,
excluding pensions(a) . . . . . . . . . . . . . . . . . . . . . $ 248.8 $ 19.5 $ 36.4 $ 33.7 $159.2
Defined benefit pension plans(b) . . . . . . . . . . . . . . 39.2 2.8 8.5 7.8 20.1
Notes payable and long-term debt . . . . . . . . . . . . 1,226.1 201.6 503.6 — 520.9
Projected interest payments(c) . . . . . . . . . . . . . . . . 299.3 39.1 74.7 60.5 125.0
Non-cancelable operating leases . . . . . . . . . . . . . . 55.2 14.5 21.9 15.4 3.4
Capital spending obligations . . . . . . . . . . . . . . . . . 62.8 62.8 — — —
Income tax payments(d) . . . . . . . . . . . . . . . . . . . . . 249.3 249.3 — — —
Total . . . . . . . . . . . . . . . . . . . . . . . . . . . . . . . . . . . $2,180.7 $589.6 $645.1 $117.4 $828.6
(a) Other postretirement employee benefits, excluding pensions, include anticipated future payments
to cover retiree medical and life insurance benefits. See Note 11 to the Consolidated Financial
Statements for disclosures related to the Company’s other postretirement employee benefits.
(b) Since the timing and amount of payments for funded defined benefit pension plans are usually
not certain for future years such potential payments are not shown in this table. Amount
contained in “After 2018” column is for unfunded plans and includes estimated payments through
2023. See Note 11 to the Consolidated Financial Statements for disclosures related to the
Company’s pension benefits.
(c) Projection is based upon actual fixed rates where appropriate, and a projected floating rate for
the variable rate portion of the total debt portfolio. The floating rate projection is based upon
current market conditions and rounded to the nearest 50th basis point (0.50%), which is 3.7% for
this purpose. Projection is also based upon debt being redeemed upon maturity.
(d) See Note 4 to the Consolidated Financial Statements for disclosures related to the Company’s
income taxes.
We believe that the combination of cash from operations, cash balances, available credit
facilities, and the anticipated shelf registration capacity will be sufficient to satisfy our cash needs for
our current level of operations and our planned operations for the foreseeable future. We will continue
to balance our needs for internal growth, external growth, debt reduction and cash conservation.
Off Balance Sheet Arrangements
The Company has certain leases that are recorded as operating leases. Types of operating leases
include leases on the headquarters facility, an airplane, vehicles and certain office equipment. The
total expected future cash outlays for non-cancelable operating lease obligations at December 31,
2013 is $55.2 million. See Note 15 to the Consolidated Financial Statements for more information on
operating leases, including future minimum payments.
Pension and Other Postretirement Employee Benefits
The Company’s policy is to fund its defined benefit pension plans in accordance with applicable
government regulations and to make additional contributions when appropriate. At December 31,
2013, all legal funding requirements had been met. The Company contributed $150.4 million, $18.0
million and $37.0 million to its defined benefit pension plans in the years ended December 31, 2013,
36

2012 and 2011, respectively. The Company expects to contribute a total of $15 million to $25 million
into its defined benefit pension plans during 2014. Of the $15 million to $25 million in projected 2014
contributions, $2.8 million are contractual obligations, while any remaining payments would be
discretionary.
The funded status of all pension plans was a net unfunded position of $157.2 million and $317.1
million at December 31, 2013 and 2012, respectively. Of these amounts, $68.6 million and $192.4
million at December 31, 2013 and 2012, respectively, were related to plans in Germany, where there is
not a tax deduction allowed under the applicable regulations to fund the plans; hence the common
practice is to make contributions as benefit payments become due. In December 2013, the Company
made a discretionary contribution of $137.5 million to its German pension plans.
Other postretirement employee benefits primarily consist of postretirement health care benefits
for certain employees and retirees of the Company’s U.S. operations. The Company funds these
benefits as retiree claims are incurred. Other postretirement employee benefits had an unfunded
status of $177.5 million and $220.5 million at December 31, 2013 and 2012, respectively.
The Company believes it will be able to fund the requirements of these plans through cash
generated from operations or other available sources of financing for the foreseeable future.
See Note 11 to the Consolidated Financial Statements for more information regarding costs and
assumptions for employee retirement benefits.
OTHER MATTERS
Contingencies
In the normal course of business, the Company is party to various commercial and legal claims,
actions and complaints, including matters involving warranty claims, intellectual property claims,
general liability and various other risks. It is not possible to predict with certainty whether or not the
Company will ultimately be successful in any of these commercial and legal matters or, if not, what
the impact might be. The Company’s environmental and product liability contingencies are discussed
separately below. The Company’s management does not expect that an adverse outcome in any of
these commercial and legal claims, actions and complaints will have a material adverse effect on the
Company’s results of operations, financial position or cash flows, although it could be material to the
results of operations in a particular quarter.
Litigation
In January 2006, BorgWarner Diversified Transmission Products Inc. (“DTP”), a subsidiary of the
Company, filed a declaratory judgment action in United States District Court, Southern District of
Indiana (Indianapolis Division) against the United Automobile, Aerospace, and Agricultural Implements
Workers of America (“UAW”) Local No. 287 and Gerald Poor, individually and as the representative of
a defendant class. DTP sought the Court’s affirmation that DTP did not violate the Labor-
Management Relations Act or the Employee Retirement Income Security Act (ERISA) by unilaterally
amending certain medical plans effective April 1, 2006 and October 1, 2006, prior to the expiration of
the then-current collective bargaining agreements. On September 10, 2008, the Court found that
DTP’s reservation of the right to make such amendments reducing the level of benefits provided to
retirees was limited by its collectively bargained health insurance agreement with the UAW, which did
not expire until April 24, 2009. Thus, the amendments were untimely. In 2008, the Company recorded
a charge of $4.0 million as a result of the Court’s decision.
DTP filed a declaratory judgment action in the United States District Court, Southern District of
Indiana (Indianapolis Division) against the UAW Local No. 287 and Jim Barrett and others, individually
37

and as representatives of a defendant class, on February 26, 2009 again seeking the Court’s
affirmation that DTP did not violate the Labor - Management Relations Act or ERISA by modifying the
level of benefits provided retirees to make them comparable to other Company retiree benefit plans
after April 24, 2009. Certain retirees, on behalf of themselves and others, filed a mirror-image action in
the United States District Court, Eastern District of Michigan (Southern Division) on March 11, 2009,
for which a class has been certified. During the last quarter of 2009, the action pending in Indiana was
dismissed, while the action in Michigan is continuing. The Company is vigorously defending against
the suit. This contingency is subject to many uncertainties, therefore based on the information
available to date, the Company cannot reasonably estimate the amount or the range of potential loss,
if any. A decision on the merits of the suit could be rendered sometime in 2014.
Environmental
The Company and certain of its current and former direct and indirect corporate predecessors,
subsidiaries and divisions have been identified by the United States Environmental Protection Agency
and certain state environmental agencies and private parties as potentially responsible parties
(“PRPs”) at various hazardous waste disposal sites under the Comprehensive Environmental
Response, Compensation and Liability Act (“Superfund”) and equivalent state laws and, as such, may
presently be liable for the cost of clean-up and other remedial activities at 32 such sites.
Responsibility for clean-up and other remedial activities at a Superfund site is typically shared among
PRPs based on an allocation formula.
The Company believes that none of these matters, individually or in the aggregate, will have a
material adverse effect on its results of operations, financial position or cash flows. Generally, this is
because either the estimates of the maximum potential liability at a site are not material or the liability
will be shared with other PRPs, although no assurance can be given with respect to the ultimate
outcome of any such matter.
Based on information available to the Company (which in most cases includes: an estimate of
allocation of liability among PRPs; the probability that other PRPs, many of whom are large, solvent
public companies, will fully pay the cost apportioned to them; currently available information from
PRPs and/or federal or state environmental agencies concerning the scope of contamination and
estimated remediation and consulting costs; and remediation alternatives), the Company has an
accrual for indicated environmental liabilities of $4.0 million and $3.9 million at December 31, 2013
and 2012, respectively. The Company expects to pay out substantially all of the amounts accrued for
environmental liability over the next five years.
In connection with the sale of Kuhlman Electric Corporation (“Kuhlman Electric”), the Company
agreed to indemnify the buyer and Kuhlman Electric for certain environmental liabilities, then unknown
to the Company, relating to certain operations of Kuhlman Electric that pre-date the Company’s 1999
acquisition of Kuhlman Electric. In 2007 and 2008, lawsuits were filed against Kuhlman Electric and
others, including the Company, on behalf of approximately 340 plaintiffs alleging personal injury
relating to alleged environmental contamination at its Crystal Springs, Mississippi plant. The
Company entered into a settlement in July 2010 regarding the personal injury claims of the plaintiffs
and those of approximately 2,700 unfiled claimants represented by those plaintiffs’ attorneys. In
exchange for, among other things, the dismissal with prejudice of these lawsuits and the release of
claims by the unfiled claimants, the Company agreed to pay up to $28 million in settlement funds,
which was expensed in the second quarter of 2010. The Company paid $13.9 million in November
2010 and made the final payment of $13.9 million in February 2011. Litigation concerning
indemnification is pending and the Company may in the future become subject to further legal
proceedings.
38

Product Liability
Like many other industrial companies who have historically operated in the U.S., the Company (or
parties the Company is obligated to indemnify) continues to be named as one of many defendants in
asbestos-related personal injury actions. We believe that the Company’s involvement is limited
because, in general, these claims relate to a few types of automotive friction products that were
manufactured many years ago and contained encapsulated asbestos. The nature of the fibers, the
encapsulation and the manner of use lead the Company to believe that these products are highly
unlikely to cause harm. As of December 31, 2013 and 2012, the Company had approximately 17,000
and 16,000 pending asbestos-related product liability claims, respectively. Of the approximately
17,000 outstanding claims at December 31, 2013, approximately half were pending in jurisdictions
that have undergone significant tort and judicial reform activities subsequent to the filing of these
claims.
The Company’s policy is to vigorously defend against these lawsuits and the Company has been
successful in obtaining dismissal of many claims without any payment. The Company expects that
the vast majority of the pending asbestos-related product liability claims where it is a defendant (or
has an obligation to indemnify a defendant) will result in no payment being made by the Company or
its insurers. In 2013, of the approximately 1,500 claims resolved, 297 (20%) resulted in payment being
made to a claimant by or on behalf of the Company. In the full year of 2012, of the approximately
2,400 claims resolved, 308 (13%) resulted in any payment being made to a claimant by or on behalf of
the Company.
Prior to June 2004, the settlement and defense costs associated with all claims were paid by the
Company’s primary layer insurance carriers under a series of funding arrangements. In addition to the
primary insurance available for asbestos-related claims, the Company has substantial excess
insurance coverage available for potential future asbestos-related product claims. In June 2004,
primary layer insurance carriers notified the Company of the alleged exhaustion of their policy limits.
A declaratory judgment action was filed in January 2004 in the Circuit Court of Cook County,
Illinois by Continental Casualty Company and related companies against the Company and certain of
its historical general liability insurers. The court has issued a number of interim rulings and discovery
is continuing. The Company has entered into settlement agreements with some of its insurance
carriers, resolving their coverage disputes by agreeing to pay specified amounts to the Company. The
Company is vigorously pursuing the litigation against the remaining insurers.
In August 2013, the Los Angeles Superior Court entered a jury verdict against the Company in an
asbestos-related personal injury action with damages of $35.0 million, $32.5 million of which was
non-compensatory and will not be recoverable through insurance if the verdict is upheld. The
Company has appealed the verdict. The Company posted a surety bond of $55.0 million related to the
appeal. The Company cannot predict the outcome of this pending litigation and therefore cannot
reasonably estimate the amount of possible loss, if any, that could result from this action.
Although it is impossible to predict the outcome of pending or future claims or the impact of tort
reform legislation that may be enacted at the state or federal levels, due to the encapsulated nature of
the products, the Company’s experience in vigorously defending and resolving claims in the past, and
the Company’s significant insurance coverage with solvent carriers as of the date of this filing,
management does not believe that asbestos-related product liability claims are likely to have a
material adverse effect on the Company’s results of operations, financial position or cash flows.
To date, the Company has paid and accrued $278.4 million in defense and indemnity in advance
of insurers’ reimbursement and has received $124.8 million in cash and notes from insurers. The net
balance of $153.6 million, is expected to be fully recovered, of which approximately $20 million is
39

expected to be recovered within one year. Timing of recovery is dependent on final resolution of the
declaratory judgment action referred to above or additional negotiated settlements. At December 31,
2012, insurers owed $111.0 million in association with these claims.
In addition to the $153.6 million net balance relating to past settlements and defense costs, the
Company has estimated a liability of $96.7 million for claims asserted, but not yet resolved and their
related defense costs at December 31, 2013. The Company also has a related asset of $96.7 million
to recognize proceeds from the insurance carriers, which is expected to be fully recovered. Receipt of
these proceeds is not expected prior to the resolution of the declaratory judgment action referred to
above, which, more-likely-than-not, will occur subsequent to December 31, 2014. At December 31,
2012, the comparable value of the accrued liability and associated insurance asset was $85.6 million.
The amounts recorded in the Consolidated Balance Sheets related to the estimated future
settlement of existing claims are as follows:
December 31,
(millions of dollars) 2013 2012
Assets:
Other non-current assets . . . . . . . . . . . . . . . . . . . . . . . . . . . . . . . . . . . . . . . . $96.7 $85.6
Total insurance assets . . . . . . . . . . . . . . . . . . . . . . . . . . . . . . . . . . . . . . . . $96.7 $85.6
Liabilities:
Accounts payable and accrued expenses . . . . . . . . . . . . . . . . . . . . . . . . . . $41.1 $36.5
Other non-current liabilities . . . . . . . . . . . . . . . . . . . . . . . . . . . . . . . . . . . . . . 55.6 49.1
Total accrued liabilities . . . . . . . . . . . . . . . . . . . . . . . . . . . . . . . . . . . . . . . . $96.7 $85.6
The 2013 increase in the accrued liability and associated insurance asset is primarily due to an
expected higher rate of claim settlement based on recent claim activity.
The Company cannot reasonably estimate possible losses, if any, in excess of those for which it
has accrued, because it cannot predict how many additional claims may be brought against the
Company (or parties the Company has an obligation to indemnify) in the future, the allegations in such
claims, the possible outcomes, or the impact of tort reform legislation that may be enacted at the
State or Federal levels.
CRITICAL ACCOUNTING POLICIES
The consolidated financial statements are prepared in conformity with accounting principles
generally accepted in the United States (“GAAP”). In preparing these financial statements,
management has made its best estimates and judgments of certain amounts included in the financial
statements, giving due consideration to materiality. Critical accounting policies are those that are
most important to the portrayal of the Company’s financial condition and results of operations. Some
of these policies require management’s most difficult, subjective or complex judgments in the
preparation of the financial statements and accompanying notes. Management makes estimates and
assumptions about the effect of matters that are inherently uncertain, relating to the reporting of
assets, liabilities, revenues, expenses and the disclosure of contingent assets and liabilities. Our most
critical accounting policies are discussed below.
Use of estimates The preparation of financial statements in conformity with GAAP requires
management to make estimates and assumptions. These estimates and assumptions affect the
reported amounts of assets and liabilities and disclosure of contingent assets and liabilities as of the
date of the financial statements and the accompanying notes, as well as, the amounts of revenues
40

and expenses reported during the periods covered by these financial statements and accompanying
notes. Actual results could differ from those estimates.
Revenue recognition The Company recognizes revenue when title and risk of loss pass to the
customer, which is usually upon shipment of product. Although the Company may enter into long-
term supply agreements with its major customers, each shipment of goods is treated as a separate
sale and the prices are not fixed over the life of the agreements.
Cost of sales The Company includes materials, direct labor and manufacturing overhead within
cost of sales. Manufacturing overhead is comprised of indirect materials, indirect labor, factory
operating costs and other such costs associated with manufacturing products for sale.
Impairment of long-lived assets, including definite-lived intangible assets The Company
reviews the carrying value of its long-lived assets, whether held for use or disposal, including other
amortizing intangible assets, when events and circumstances warrant such a review under
Accounting Standards Codification (“ASC”) Topic 360. In assessing long-lived assets for an
impairment loss, assets are grouped with other assets and liabilities at the lowest level for which
identifiable cash flows are largely independent of the cash flows of other assets and liabilities. In
assessing long-lived assets for impairment, management generally considers individual facilities the
lowest level for which identifiable cash flows are largely independent. A recoverability review is
performed using the undiscounted cash flows if there is a triggering event. If the undiscounted cash
flow test for recoverability identifies a possible impairment, management will perform a fair value
analysis. Management determines fair value under ASC Topic 820 using the appropriate valuation
technique of market, income or cost approach. If the carrying value of a long-lived asset is considered
impaired, an impairment charge is recorded for the amount by which the carrying value of the long-
lived asset exceeds its fair value.
Management believes that the estimates of future cash flows and fair value assumptions are
reasonable; however, changes in assumptions underlying these estimates could affect the valuations.
Long-lived assets held for sale are recorded at the lower of their carrying amount or fair value less
cost to sell. Significant judgments and estimates used by management when evaluating long-lived
assets for impairment include: (i) an assessment as to whether an adverse event or circumstance has
triggered the need for an impairment review; (ii) undiscounted future cash flows generated by the
asset; and (iii) fair valuation of the asset.
Goodwill and other indefinite-lived intangible assets During the fourth quarter of each year,
the Company qualitatively assesses its goodwill and indefinite-lived intangible assets assigned to
each of its reporting units. This qualitative assessment evaluates various events and circumstances,
such as macro economic conditions, industry and market conditions, cost factors, relevant events
and financial trends, that may impact a reporting unit’s fair value. Using this qualitative assessment,
the Company determines whether it is more-likely-than not the reporting unit’s fair value exceeds its
carrying value. If it is determined that it is not more-likely-than-not the reporting unit’s fair value
exceeds the carrying value, or upon a triggering event, including recent acquisition or divestiture
activity, the Company performs a quantitative, “step one,” goodwill impairment analysis.
During the fourth quarter of 2013, the Company performed a qualitative analysis on each
reporting unit and determined it was more-likely-than-not the fair value exceeded the carrying value of
these reporting units. For the reporting unit with recent restructuring activity, the Company performed
a quantitative, “step one,” goodwill impairment analysis, which requires the Company to make
significant assumptions and estimates about the extent and timing of future cash flows, discount
rates and growth rates. The basis of this goodwill impairment analysis is the Company’s annual
budget and long-range plan (“LRP”). The annual budget and LRP includes a five year projection of
41

future cash flows based on actual new products and customer commitments and assumes the last
year of the LRP data is a fair indication of the future performance. Because the LRP is estimated over
a significant future period of time, those estimates and assumptions are subject to a high degree of
uncertainty. Further, the market valuation models and other financial ratios used by the Company
require certain assumptions and estimates regarding the applicability of those models to the
Company’s facts and circumstances.
The Company believes the assumptions and estimates used to determine its estimated fair value
are reasonable. Different assumptions could materially affect the estimated fair value. The primary
assumptions affecting the Company’s December 31, 2013 goodwill quantitative, “step one,”
impairment review are as follows:
• Discount rate: The Company used a 10% weighted average cost of capital (“WACC”) as the
discount rate for future cash flows. The WACC is intended to represent a rate of return that
would be expected by a market participant.
• Operating income margin: The Company used historical and expected operating income
margins, which may vary based on the projections of the reporting unit being evaluated.
In addition to the above primary assumptions, the Company notes the following risks to volume
and operating income assumptions that could have an impact on the discounted cash flow model:
• The automotive industry is cyclical and the Company’s results of operations would be
adversely affected by industry downturns.
• The Company is dependent on market segments that use our key products and would be
affected by decreasing demand in those segments.
• The Company is subject to risks related to international operations.
Based on the assumptions outlined above, the impairment testing conducted in the fourth quarter
of 2013 indicated the Company’s goodwill assigned to the reporting unit that was quantitatively
assessed was not impaired. Additionally, a sensitivity analysis was completed indicating a 1%
increase in the discount rate or a 1% decrease in the operating margin assumptions would not result
in the carrying value exceeding the fair value of the reporting unit quantitatively assessed.
See Note 6 to the Consolidated Financial Statements for more information regarding goodwill.
Product warranties The Company provides warranties on some, but not all, of its products. The
warranty terms are typically from one to three years. Provisions for estimated expenses related to
product warranty are made at the time products are sold. These estimates are established using
historical information about the nature, frequency and average cost of warranty claim settlements as
well as product manufacturing and industry developments and recoveries from third parties.
Management actively studies trends of warranty claims and takes action to improve product quality
and minimize warranty claims. Management believes that the warranty accrual is appropriate;
however, actual claims incurred could differ from the original estimates, requiring adjustments to the
accrual. Our warranty provision over the last three years, and as a percentage of net sales, has
stabilized based on the Company’s improved quality efforts and has trended as follows:
Year Ended December 31,
(millions of dollars) 2013 2012 2011
Net sales . . . . . . . . . . . . . . . . . . . . . . . . . . . . . . . . . . . . . . . . $7,436.6 $7,183.2 $7,114.7
Warranty provision . . . . . . . . . . . . . . . . . . . . . . . . . . . . . . . . $ 43.1 $ 33.7 $ 47.5
Warranty provision as a percentage of net sales . . . . . . . 0.6% 0.5% 0.7%
42
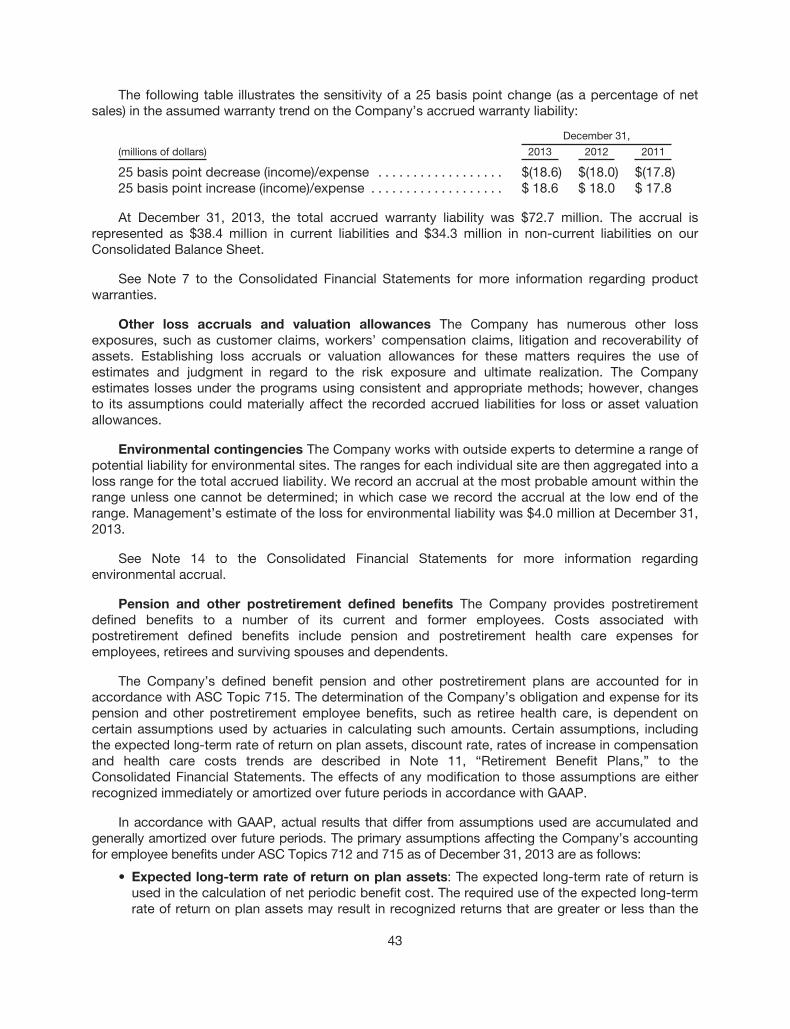
The following table illustrates the sensitivity of a 25 basis point change (as a percentage of net
sales) in the assumed warranty trend on the Company’s accrued warranty liability:
December 31,
(millions of dollars) 2013 2012 2011
25 basis point decrease (income)/expense . . . . . . . . . . . . . . . . . . $(18.6) $(18.0) $(17.8)
25 basis point increase (income)/expense . . . . . . . . . . . . . . . . . . . $ 18.6 $ 18.0 $ 17.8
At December 31, 2013, the total accrued warranty liability was $72.7 million. The accrual is
represented as $38.4 million in current liabilities and $34.3 million in non-current liabilities on our
Consolidated Balance Sheet.
See Note 7 to the Consolidated Financial Statements for more information regarding product
warranties.
Other loss accruals and valuation allowances The Company has numerous other loss
exposures, such as customer claims, workers’ compensation claims, litigation and recoverability of
assets. Establishing loss accruals or valuation allowances for these matters requires the use of
estimates and judgment in regard to the risk exposure and ultimate realization. The Company
estimates losses under the programs using consistent and appropriate methods; however, changes
to its assumptions could materially affect the recorded accrued liabilities for loss or asset valuation
allowances.
Environmental contingencies The Company works with outside experts to determine a range of
potential liability for environmental sites. The ranges for each individual site are then aggregated into a
loss range for the total accrued liability. We record an accrual at the most probable amount within the
range unless one cannot be determined; in which case we record the accrual at the low end of the
range. Management’s estimate of the loss for environmental liability was $4.0 million at December 31,
2013.
See Note 14 to the Consolidated Financial Statements for more information regarding
environmental accrual.
Pension and other postretirement defined benefits The Company provides postretirement
defined benefits to a number of its current and former employees. Costs associated with
postretirement defined benefits include pension and postretirement health care expenses for
employees, retirees and surviving spouses and dependents.
The Company’s defined benefit pension and other postretirement plans are accounted for in
accordance with ASC Topic 715. The determination of the Company’s obligation and expense for its
pension and other postretirement employee benefits, such as retiree health care, is dependent on
certain assumptions used by actuaries in calculating such amounts. Certain assumptions, including
the expected long-term rate of return on plan assets, discount rate, rates of increase in compensation
and health care costs trends are described in Note 11, “Retirement Benefit Plans,” to the
Consolidated Financial Statements. The effects of any modification to those assumptions are either
recognized immediately or amortized over future periods in accordance with GAAP.
In accordance with GAAP, actual results that differ from assumptions used are accumulated and
generally amortized over future periods. The primary assumptions affecting the Company’s accounting
for employee benefits under ASC Topics 712 and 715 as of December 31, 2013 are as follows:
• Expected long-term rate of return on plan assets: The expected long-term rate of return is
used in the calculation of net periodic benefit cost. The required use of the expected long-term
rate of return on plan assets may result in recognized returns that are greater or less than the
43
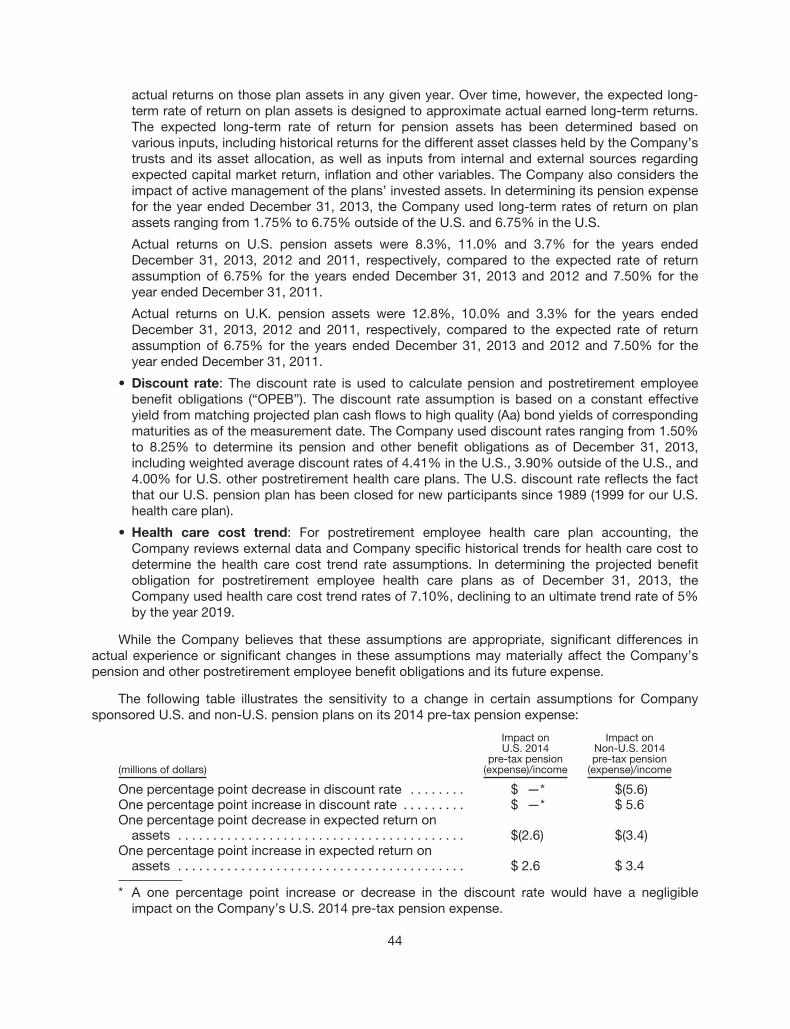
actual returns on those plan assets in any given year. Over time, however, the expected long-
term rate of return on plan assets is designed to approximate actual earned long-term returns.
The expected long-term rate of return for pension assets has been determined based on
various inputs, including historical returns for the different asset classes held by the Company’s
trusts and its asset allocation, as well as inputs from internal and external sources regarding
expected capital market return, inflation and other variables. The Company also considers the
impact of active management of the plans’ invested assets. In determining its pension expense
for the year ended December 31, 2013, the Company used long-term rates of return on plan
assets ranging from 1.75% to 6.75% outside of the U.S. and 6.75% in the U.S.
Actual returns on U.S. pension assets were 8.3%, 11.0% and 3.7% for the years ended
December 31, 2013, 2012 and 2011, respectively, compared to the expected rate of return
assumption of 6.75% for the years ended December 31, 2013 and 2012 and 7.50% for the
year ended December 31, 2011.
Actual returns on U.K. pension assets were 12.8%, 10.0% and 3.3% for the years ended
December 31, 2013, 2012 and 2011, respectively, compared to the expected rate of return
assumption of 6.75% for the years ended December 31, 2013 and 2012 and 7.50% for the
year ended December 31, 2011.
• Discount rate: The discount rate is used to calculate pension and postretirement employee
benefit obligations (“OPEB”). The discount rate assumption is based on a constant effective
yield from matching projected plan cash flows to high quality (Aa) bond yields of corresponding
maturities as of the measurement date. The Company used discount rates ranging from 1.50%
to 8.25% to determine its pension and other benefit obligations as of December 31, 2013,
including weighted average discount rates of 4.41% in the U.S., 3.90% outside of the U.S., and
4.00% for U.S. other postretirement health care plans. The U.S. discount rate reflects the fact
that our U.S. pension plan has been closed for new participants since 1989 (1999 for our U.S.
health care plan).
• Health care cost trend: For postretirement employee health care plan accounting, the
Company reviews external data and Company specific historical trends for health care cost to
determine the health care cost trend rate assumptions. In determining the projected benefit
obligation for postretirement employee health care plans as of December 31, 2013, the
Company used health care cost trend rates of 7.10%, declining to an ultimate trend rate of 5%
by the year 2019.
While the Company believes that these assumptions are appropriate, significant differences in
actual experience or significant changes in these assumptions may materially affect the Company’s
pension and other postretirement employee benefit obligations and its future expense.
The following table illustrates the sensitivity to a change in certain assumptions for Company
sponsored U.S. and non-U.S. pension plans on its 2014 pre-tax pension expense:
(millions of dollars)
Impact onU.S. 2014
pre-tax pension(expense)/income
Impact onNon-U.S. 2014pre-tax pension
(expense)/income
One percentage point decrease in discount rate . . . . . . . . $ —* $(5.6)One percentage point increase in discount rate . . . . . . . . . $ —* $ 5.6One percentage point decrease in expected return on
assets . . . . . . . . . . . . . . . . . . . . . . . . . . . . . . . . . . . . . . . . . $(2.6) $(3.4)One percentage point increase in expected return on
assets . . . . . . . . . . . . . . . . . . . . . . . . . . . . . . . . . . . . . . . . . $ 2.6 $ 3.4
* A one percentage point increase or decrease in the discount rate would have a negligible
impact on the Company’s U.S. 2014 pre-tax pension expense.
44

The following table illustrates the sensitivity to a change in the discount rate assumption related
to the Company’s U.S. OPEB interest expense:
(millions of dollars)
Impact on 2014pre-tax OPEB
interest(expense)/income
One percentage point decrease in discount rate . . . . . . . . . . . . . . . . . . . . . . . $(0.5)
One percentage point increase in discount rate . . . . . . . . . . . . . . . . . . . . . . . . $ 0.5
The sensitivity to a change in the discount rate assumption related to the Company’s total 2014
U.S. OPEB expense is expected to be negligible, as any increase in interest expense will be offset by
net actuarial gains.
The following table illustrates the sensitivity to a one-percentage point change in the assumed
health care cost trend related to the Company’s OPEB obligation and service and interest cost:
One Percentage Point
(millions of dollars) Increase Decrease
Effect on other postretirement employee benefit obligation . . . . . . . . . . . $12.6 $(10.9)
Effect on total service and interest cost components . . . . . . . . . . . . . . . . $ 0.5 $ (0.5)
See Note 11 to the Consolidated Financial Statements for more information regarding the
Company’s retirement benefit plans.
Income taxes The Company accounts for income taxes in accordance with ASC Topic 740.
Deferred tax assets and liabilities are recognized for the future tax consequences attributable to
differences between financial statement carrying amounts of existing assets and liabilities and their
respective tax bases and operating loss and tax credit carryforwards. Deferred tax assets and
liabilities are measured using enacted tax rates expected to apply to taxable income in the years in
which those temporary differences are expected to be recovered or settled.
Management judgment is required in determining the Company’s provision for income taxes,
deferred tax assets and liabilities and the valuation allowance recorded against the Company’s net
deferred tax assets. In calculating the provision for income taxes on an interim basis, the Company
uses an estimate of the annual effective tax rate based upon the facts and circumstances known at
each interim period. In determining the need for a valuation allowance, the historical and projected
financial performance of the operation recording the net deferred tax asset is considered along with
any other pertinent information. Since future financial results may differ from previous estimates,
periodic adjustments to the Company’s valuation allowance may be necessary.
The Company is subject to income taxes in the U.S. at the federal and state level and numerous
non-U.S. jurisdictions. Significant judgment is required in determining our worldwide provision for
income taxes and recording the related assets and liabilities. In the ordinary course of our business,
there are many transactions and calculations where the ultimate tax determination is less than certain.
Accruals for income tax contingencies are provided for in accordance with the requirements of ASC
Topic 605. The Company’s U.S. federal and certain state income tax returns and certain non-U.S.
income tax returns are currently under various stages of audit by applicable tax authorities. Although
the outcome of ongoing tax audits is always uncertain, management believes that it has appropriate
support for the positions taken on its tax returns and that its annual tax provisions included amounts
sufficient to pay assessments, if any, which may be proposed by the taxing authorities. At
December 31, 2013, the Company has recorded a liability for its best estimate of the more-likely-than-
not loss on certain of its tax positions, which is included in other non-current liabilities. Nonetheless,
45
the amounts ultimately paid, if any, upon resolution of the issues raised by the taxing authorities may
differ materially from the amounts accrued for each year.
See Note 4 to the Consolidated Financial Statements for more information regarding income
taxes.
New Accounting Pronouncements
In July 2013, the Financial Accounting Standards Board amended ASC Topic 740, “Income
Taxes,” requiring an unrecognized tax benefit, or a portion of an unrecognized tax benefit, to be
presented in the financial statements as a reduction to a deferred tax asset for a net operating loss
carryforward, a similar tax loss, or a tax credit carryforward. This guidance is effective prospectively
for interim and annual periods beginning after December 15, 2013. The Company anticipates the
adoption of this guidance will not have a material impact to its Consolidated Financial Statements.
QUANTITATIVE AND QUALITATIVE DISCLOSURES ABOUT MARKET RISK
The Company’s primary market risks include fluctuations in interest rates and foreign currency
exchange rates. We are also affected by changes in the prices of commodities used or consumed in
our manufacturing operations. Some of our commodity purchase price risk is covered by supply
agreements with customers and suppliers. Other commodity purchase price risk is addressed by
hedging strategies, which include forward contracts. The Company enters into derivative instruments
only with high credit quality counterparties and diversifies its positions across such counterparties in
order to reduce its exposure to credit losses. We do not engage in any derivative instruments for
purposes other than hedging specific operating risks.
We have established policies and procedures to manage sensitivity to interest rate, foreign
currency exchange rate and commodity purchase price risk, which include monitoring the level of
exposure to each market risk. For quantitative disclosures about market risk, please refer to Note 10,
"Financial Instruments,” to the Consolidated Financial Statements in Item 8 of this report for
information with respect to interest rate risk and foreign currency exchange rate risk.
Interest Rate Risk
Interest rate risk is the risk that we will incur economic losses due to adverse changes in interest
rates. The Company manages its interest rate risk by balancing its exposure to fixed and variable
rates while attempting to minimize its interest costs. The Company selectively uses interest rate
swaps to reduce market value risk associated with changes in interest rates (fair value hedges). At
December 31, 2013, the amount of debt with fixed interest rates was 39.6% of total debt, including
the impact of the interest rate swaps. Our earnings exposure related to adverse movements in interest
rates is primarily derived from outstanding floating rate debt instruments that are indexed to floating
money market rates. A 10% increase or decrease in the average cost of our variable rate debt would
result in a change in pre-tax interest expense of approximately $1.7 million, $1.6 million and
$1.8 million in the years ended December 31, 2013, 2012 and 2011, respectively.
Foreign Currency Exchange Rate Risk
Foreign currency exchange rate risk is the risk that we will incur economic losses due to adverse
changes in foreign currency exchange rates. Currently, our most significant currency exposures relate
to the British Pound, the Chinese Yuan, the Euro, the Hungarian Forint, the Japanese Yen, the
Swedish Krona and the South Korean Won. We mitigate our foreign currency exchange rate risk by
establishing local production facilities and related supply chain participants in the markets we serve,
46

by invoicing customers in the same currency as the source of the products and by funding some of
our investments in foreign markets through local currency loans and cross-currency swaps. Such
non-U.S. Dollar debt was $282.3 million and $258.3 million as of December 31, 2013 and 2012,
respectively. We also monitor our foreign currency exposure in each country and implement strategies
to respond to changing economic and political environments. In addition, the Company periodically
enters into forward currency contracts in order to reduce exposure to exchange rate risk related to
transactions denominated in currencies other than the functional currency. As of December 31, 2013,
the Company was holding foreign exchange derivatives with positive and negative fair market values
of $3.4 million and $7.4 million, respectively, of which $3.4 million in gains and $7.4 million in losses
mature in less than one year.
Commodity Price Risk
Commodity price risk is the possibility that we will incur economic losses due to adverse changes
in the cost of raw materials used in the production of our products. Commodity forward and option
contracts are executed to offset our exposure to the potential change in prices mainly for various non-
ferrous metals and natural gas consumption used in the manufacturing of vehicle components. As of
December 31, 2013, the Company had no forward and option commodity contracts outstanding.
Disclosure Regarding Forward-Looking Statements
The matters discussed in this Item 7 include forward looking statements. See “Forward Looking
Statements” at the beginning of this Annual Report on Form 10-K.
47

REPORT OF MANAGEMENT ON INTERNAL CONTROL OVER FINANCIAL REPORTINGThe information in this report is the responsibility of management. BorgWarner Inc. and
Consolidated Subsidiaries (the “Company”) has in place reporting guidelines and policies designed toensure that the statements and other information contained in this report present a fair and accuratefinancial picture of the Company. In fulfilling this management responsibility, we make informedjudgments and estimates conforming with accounting principles generally accepted in the UnitedStates of America.
The management of the Company is responsible for establishing and maintaining adequateinternal control over financial reporting.
The Company’s internal control over financial reporting is a process designed to providereasonable assurance regarding the reliability of financial reporting and the preparation of financialstatements for external purposes in accordance with generally accepted accounting principles in theUnited States of America. The internal control process includes those policies and procedures that:
• Pertain to the maintenance of records that, in reasonable detail, accurately and fairly reflectthe transactions and dispositions of the assets of the Company;
• Provide reasonable assurance that transactions are recorded as necessary to permitpreparation of financial statements in accordance with generally accepted accountingprinciples, and that receipts and expenditures of the Company are being made only inaccordance with authorizations of management and directors of the Company; and
• Provide reasonable assurance regarding prevention or timely detection of unauthorizedacquisition, use or disposition of the Company's assets that could have a material effect onthe financial statements.
Any system of internal control, no matter how well designed, has inherent limitations. Therefore,even those systems determined to be effective may not prevent or detect misstatements and canprovide only reasonable assurance with respect to financial statement preparation and presentation.Also, projections of any evaluation of effectiveness to future periods are subject to the risk thatcontrols may become inadequate because of changes in conditions, or that the degree of compliancewith the policies or procedures may deteriorate.
The Company’s management assessed the effectiveness of the Company’s internal control overfinancial reporting as of December 31, 2013. In making this assessment, the Company’s managementused the criteria set forth by the Committee of Sponsoring Organizations of the TreadwayCommission (“COSO”) in Internal Control - Integrated Framework (1992).
Based on management’s assessment and those criteria, we believe that, as of December 31,2013, the Company’s internal control over financial reporting is effective.
PricewaterhouseCoopers LLP, an independent registered public accounting firm, has audited theCompany’s consolidated financial statements and the effectiveness of internal controls over financialreporting as of December 31, 2013 as stated in their report.
The Company’s Audit Committee, composed entirely of directors of the Company who are notemployees, meets periodically with the Company’s management and independent registered publicaccounting firm to review financial results and procedures, internal financial controls and internal andexternal audit plans and recommendations. In carrying out these responsibilities, the Audit Committeeand the independent registered public accounting firm have unrestricted access to each other with orwithout the presence of management representatives.
/s/ James R. Verrier
President and Chief Executive Officer
/s/ Ronald T. Hundzinski
Vice President and Chief Financial Officer
February 13, 2014
48
Item 7A. Quantitative and Qualitative Disclosures About Market Risk
For quantitative and qualitative information regarding market risk, please refer to the discussion in
Item 7 of this report under the caption “Quantitative and Qualitative Disclosures about Market Risk.”
For information regarding interest rate risk and foreign currency exchange risk, refer to Note 10,
“Financial Instruments,” to the Consolidated Financial Statements in Item 8 of this report. For
information regarding the levels of indebtedness subject to interest rate fluctuation, refer to Note 8,
“Notes Payable and Long-Term Debt,” to the Consolidated Financial Statements in Item 8 of this
report. For information regarding the level of business outside the United States, which is subject to
foreign currency exchange rate market risk, refer to Note 18, “Reporting Segments and Related
Information,” to the Consolidated Financial Statements in Item 8 of this report.
Item 8. Financial Statements and Supplementary Data
Index to Financial Statements and Supplementary Data Page No.
Report of Independent Registered Public Accounting Firm . . . . . . . . . . . . . . . . . . . . . . . . . . . . . 50
Consolidated Balance Sheets . . . . . . . . . . . . . . . . . . . . . . . . . . . . . . . . . . . . . . . . . . . . . . . . . . . . . 51
Consolidated Statements of Operations . . . . . . . . . . . . . . . . . . . . . . . . . . . . . . . . . . . . . . . . . . . . 52
Consolidated Statements of Comprehensive Income . . . . . . . . . . . . . . . . . . . . . . . . . . . . . . . . . 53
Consolidated Statements of Cash Flows . . . . . . . . . . . . . . . . . . . . . . . . . . . . . . . . . . . . . . . . . . . 54
Consolidated Statements of Equity . . . . . . . . . . . . . . . . . . . . . . . . . . . . . . . . . . . . . . . . . . . . . . . . 55
Notes to Consolidated Financial Statements . . . . . . . . . . . . . . . . . . . . . . . . . . . . . . . . . . . . . . . . 56
49

Report of Independent Registered Public Accounting Firm
To the Board of Directors and Stockholders of BorgWarner Inc.
In our opinion, the consolidated financial statements listed in the accompanying index present
fairly, in all material respects, the financial position of BorgWarner Inc. and its subsidiaries at
December 31, 2013 and December 31, 2012, and the results of their operations and their cash flows
for each of the three years in the period ended December 31, 2013 in conformity with accounting
principles generally accepted in the United States of America. Also in our opinion, the Company
maintained, in all material respects, effective internal control over financial reporting as of
December 31, 2013, based on criteria established in Internal Control—Integrated Framework
(1992) issued by the Committee of Sponsoring Organizations of the Treadway Commission (COSO).
The Company’s management is responsible for these financial statements, for maintaining effective
internal control over financial reporting and for its assessment of the effectiveness of internal control
over financial reporting, included in Management’s Report on Internal Control over Financial Reporting
appearing under Item 9A. Our responsibility is to express opinions on these financial statements and
on the Company’s internal control over financial reporting based on our integrated audits. We
conducted our audits in accordance with the standards of the Public Company Accounting Oversight
Board (United States). Those standards require that we plan and perform the audits to obtain
reasonable assurance about whether the financial statements are free of material misstatement and
whether effective internal control over financial reporting was maintained in all material respects. Our
audits of the financial statements included examining, on a test basis, evidence supporting the
amounts and disclosures in the financial statements, assessing the accounting principles used and
significant estimates made by management, and evaluating the overall financial statement
presentation. Our audit of internal control over financial reporting included obtaining an understanding
of internal control over financial reporting, assessing the risk that a material weakness exists, and
testing and evaluating the design and operating effectiveness of internal control based on the
assessed risk. Our audits also included performing such other procedures as we considered
necessary in the circumstances. We believe that our audits provide a reasonable basis for our
opinions.
A company’s internal control over financial reporting is a process designed to provide reasonable
assurance regarding the reliability of financial reporting and the preparation of financial statements for
external purposes in accordance with generally accepted accounting principles. A company’s internal
control over financial reporting includes those policies and procedures that (i) pertain to the
maintenance of records that, in reasonable detail, accurately and fairly reflect the transactions and
dispositions of the assets of the company; (ii) provide reasonable assurance that transactions are
recorded as necessary to permit preparation of financial statements in accordance with generally
accepted accounting principles, and that receipts and expenditures of the company are being made
only in accordance with authorizations of management and directors of the company; and (iii) provide
reasonable assurance regarding prevention or timely detection of unauthorized acquisition, use, or
disposition of the company’s assets that could have a material effect on the financial statements.
Because of its inherent limitations, internal control over financial reporting may not prevent or
detect misstatements. Also, projections of any evaluation of effectiveness to future periods are
subject to the risk that controls may become inadequate because of changes in conditions, or that
the degree of compliance with the policies or procedures may deteriorate.
/s/ PricewaterhouseCoopers LLP
PricewaterhouseCoopers LLP
Detroit, Michigan
February 13, 2014
50

BORGWARNER INC. AND CONSOLIDATED SUBSIDIARIES
CONSOLIDATED BALANCE SHEETS
December 31,
(millions of dollars) 2013 2012
ASSETSCash . . . . . . . . . . . . . . . . . . . . . . . . . . . . . . . . . . . . . . . . . . . . . . . . . . . . . . . . . . . . . . . $ 939.5 $ 715.7
Receivables, net . . . . . . . . . . . . . . . . . . . . . . . . . . . . . . . . . . . . . . . . . . . . . . . . . . . . . 1,248.5 1,147.3
Inventories, net . . . . . . . . . . . . . . . . . . . . . . . . . . . . . . . . . . . . . . . . . . . . . . . . . . . . . . 458.1 447.6
Deferred income taxes . . . . . . . . . . . . . . . . . . . . . . . . . . . . . . . . . . . . . . . . . . . . . . . . 68.7 94.7
Prepayments and other current assets . . . . . . . . . . . . . . . . . . . . . . . . . . . . . . . . . . . 83.7 67.5
Total current assets . . . . . . . . . . . . . . . . . . . . . . . . . . . . . . . . . . . . . . . . . . . . . . . 2,798.5 2,472.8
Property, plant and equipment, net . . . . . . . . . . . . . . . . . . . . . . . . . . . . . . . . . . . . . . 1,939.4 1,788.0
Investments and advances . . . . . . . . . . . . . . . . . . . . . . . . . . . . . . . . . . . . . . . . . . . . . 405.1 382.7
Goodwill . . . . . . . . . . . . . . . . . . . . . . . . . . . . . . . . . . . . . . . . . . . . . . . . . . . . . . . . . . . . 1,197.0 1,181.4
Other non-current assets . . . . . . . . . . . . . . . . . . . . . . . . . . . . . . . . . . . . . . . . . . . . . . 577.0 575.9
Total assets . . . . . . . . . . . . . . . . . . . . . . . . . . . . . . . . . . . . . . . . . . . . . . . . . . . . . $6,917.0 $6,400.8
LIABILITIES AND EQUITYNotes payable and other short-term debt . . . . . . . . . . . . . . . . . . . . . . . . . . . . . . . . . $ 201.6 $ 243.4
Accounts payable and accrued expenses . . . . . . . . . . . . . . . . . . . . . . . . . . . . . . . . 1,383.8 1,287.2
Income taxes payable . . . . . . . . . . . . . . . . . . . . . . . . . . . . . . . . . . . . . . . . . . . . . . . . . 38.5 72.5
Total current liabilities . . . . . . . . . . . . . . . . . . . . . . . . . . . . . . . . . . . . . . . . . . . . . 1,623.9 1,603.1
Long-term debt . . . . . . . . . . . . . . . . . . . . . . . . . . . . . . . . . . . . . . . . . . . . . . . . . . . . . . 1,021.0 823.8
Other non-current liabilities:
Retirement-related liabilities . . . . . . . . . . . . . . . . . . . . . . . . . . . . . . . . . . . . . . . . . . 312.9 509.7
Other . . . . . . . . . . . . . . . . . . . . . . . . . . . . . . . . . . . . . . . . . . . . . . . . . . . . . . . . . . . . 326.8 318.1
Total other non-current liabilities . . . . . . . . . . . . . . . . . . . . . . . . . . . . . . . . . . . . 639.7 827.8
Capital stock:
Preferred stock, $0.01 par value; authorized shares: 5,000,000; none issued
and outstanding . . . . . . . . . . . . . . . . . . . . . . . . . . . . . . . . . . . . . . . . . . . . . . . . . . — —
Common stock, $0.01 par value; authorized shares: 390,000,000; issued
shares: (2013-246,421,893; 2012-246,046,318); outstanding shares: (2013-
227,932,856; 2012-231,145,398) . . . . . . . . . . . . . . . . . . . . . . . . . . . . . . . . . . . . 2.5 1.2
Non-voting common stock, $0.01 par value; authorized shares: 25,000,000;
none issued and outstanding . . . . . . . . . . . . . . . . . . . . . . . . . . . . . . . . . . . . . . . — —
Capital in excess of par value . . . . . . . . . . . . . . . . . . . . . . . . . . . . . . . . . . . . . . . . . . 1,121.9 1,160.7
Retained earnings . . . . . . . . . . . . . . . . . . . . . . . . . . . . . . . . . . . . . . . . . . . . . . . . . . . . 3,177.4 2,611.2
Accumulated other comprehensive loss . . . . . . . . . . . . . . . . . . . . . . . . . . . . . . . . . . (14.0) (121.3)
Common stock held in treasury, at cost: (2013-18,489,037 shares; 2012-
14,900,920 shares) . . . . . . . . . . . . . . . . . . . . . . . . . . . . . . . . . . . . . . . . . . . . . . . . . (727.2) (569.2)
Total BorgWarner Inc. stockholders’ equity . . . . . . . . . . . . . . . . . . . . . . . . . . . 3,560.6 3,082.6
Noncontrolling interest . . . . . . . . . . . . . . . . . . . . . . . . . . . . . . . . . . . . . . . . . . . . . . . . 71.8 63.5
Total equity . . . . . . . . . . . . . . . . . . . . . . . . . . . . . . . . . . . . . . . . . . . . . . . . . . . . . 3,632.4 3,146.1
Total liabilities and equity . . . . . . . . . . . . . . . . . . . . . . . . . . . . . . . . . . . . . . . . $6,917.0 $6,400.8
See Accompanying Notes to Consolidated Financial Statements.
51

BORGWARNER INC. AND CONSOLIDATED SUBSIDIARIES
CONSOLIDATED STATEMENTS OF OPERATIONS
Year Ended December 31,
(in millions, except per share amounts) 2013 2012 2011
Net sales . . . . . . . . . . . . . . . . . . . . . . . . . . . . . . . . . . . . . . . . . . . . . . . . $ 7,436.6 $ 7,183.2 $ 7,114.7
Cost of sales . . . . . . . . . . . . . . . . . . . . . . . . . . . . . . . . . . . . . . . . . . . . . 5,879.1 5,716.3 5,704.3
Gross profit . . . . . . . . . . . . . . . . . . . . . . . . . . . . . . . . . . . . . . . . . . . . 1,557.5 1,466.9 1,410.4
Selling, general and administrative expenses . . . . . . . . . . . . . . . . . . . 639.7 629.3 621.0
Other expense (income) . . . . . . . . . . . . . . . . . . . . . . . . . . . . . . . . . . . . 62.6 84.7 (8.1)
Operating income . . . . . . . . . . . . . . . . . . . . . . . . . . . . . . . . . . . . . . . 855.2 752.9 797.5
Equity in affiliates’ earnings, net of tax . . . . . . . . . . . . . . . . . . . . . . . . (43.5) (42.8) (38.2)
Interest income . . . . . . . . . . . . . . . . . . . . . . . . . . . . . . . . . . . . . . . . . . . (4.8) (4.7) (4.8)
Interest expense and finance charges . . . . . . . . . . . . . . . . . . . . . . . . . 34.2 39.4 74.6
Earnings before income taxes and noncontrolling interest . . . . . . 869.3 761.0 765.9
Provision for income taxes . . . . . . . . . . . . . . . . . . . . . . . . . . . . . . . . . . 218.3 238.6 195.3
Net earnings . . . . . . . . . . . . . . . . . . . . . . . . . . . . . . . . . . . . . . . . . . . . 651.0 522.4 570.6
Net earnings attributable to the noncontrolling interest, net of
tax . . . . . . . . . . . . . . . . . . . . . . . . . . . . . . . . . . . . . . . . . . . . . . . . . . . . 26.7 21.5 20.5
Net earnings attributable to BorgWarner Inc. . . . . . . . . . . . . . . . . . $ 624.3 $ 500.9 $ 550.1
Earnings per share — basic . . . . . . . . . . . . . . . . . . . . . . . . . . . . . . . . . $ 2.73 $ 2.22 $ 2.52
Earnings per share — diluted* . . . . . . . . . . . . . . . . . . . . . . . . . . . . . . . $ 2.70 $ 2.09 $ 2.22
Weighted average shares outstanding:
Basic . . . . . . . . . . . . . . . . . . . . . . . . . . . . . . . . . . . . . . . . . . . . . . . . . . 228.600 225.304 218.458
Diluted . . . . . . . . . . . . . . . . . . . . . . . . . . . . . . . . . . . . . . . . . . . . . . . . 231.337 242.754 256.936
Dividends declared per share . . . . . . . . . . . . . . . . . . . . . . . . . . . . . . . . $ 0.25 $ — $ —
* The Company’s diluted earnings per share for the years ended December 31, 2012 and 2011
includes the impact of the Company’s 3.50% convertible senior notes and associated warrants.
Refer to Note 16, “Earnings Per Share,” for further information on the diluted earnings per share
calculation.
See Accompanying Notes to Consolidated Financial Statements.
52

BORGWARNER INC. AND CONSOLIDATED SUBSIDIARIES
CONSOLIDATED STATEMENTS OF COMPREHENSIVE INCOME
Year Ended December 31,
(millions of dollars) 2013 2012 2011
Net earnings attributable to BorgWarner Inc. . . . . . . . . . . . . . . . . . . . . . . . . . $624.3 $500.9 $550.1
Other comprehensive income (loss)
Foreign currency translation adjustments . . . . . . . . . . . . . . . . . . . . . . . . . . 40.3 55.0 (62.2)
Hedge instruments . . . . . . . . . . . . . . . . . . . . . . . . . . . . . . . . . . . . . . . . . . . . . 21.2 13.3 (5.7)
Defined benefit postretirement plans . . . . . . . . . . . . . . . . . . . . . . . . . . . . . . 44.3 (38.6) (29.1)
Other . . . . . . . . . . . . . . . . . . . . . . . . . . . . . . . . . . . . . . . . . . . . . . . . . . . . . . . . 1.5 (0.2) (0.1)
Total other comprehensive income (loss) attributable to
BorgWarner Inc. . . . . . . . . . . . . . . . . . . . . . . . . . . . . . . . . . . . . . . . . . . . 107.3 29.5 (97.1)
Comprehensive income attributable to BorgWarner Inc. . . . . . . . . . . . . . . . . 731.6 530.4 453.0
Comprehensive income (loss) attributable to the noncontrolling interest . . . 1.7 2.8 (1.3)
Comprehensive income . . . . . . . . . . . . . . . . . . . . . . . . . . . . . . . . . . . . . . . . . $733.3 $533.2 $451.7
See Accompanying Notes to Consolidated Financial Statements.
53

BORGWARNER INC. AND CONSOLIDATED SUBSIDIARIES
CONSOLIDATED STATEMENTS OF CASH FLOWS
Year Ended December 31,
(millions of dollars) 2013 2012 2011
OPERATINGNet earnings . . . . . . . . . . . . . . . . . . . . . . . . . . . . . . . . . . . . . . . . . . . . . . . . . . . . . . . . . . . . $ 651.0 $ 522.4 $ 570.6Adjustments to reconcile net earnings to net cash flows from operations:Non-cash charges (credits) to operations:
Depreciation and tooling amortization . . . . . . . . . . . . . . . . . . . . . . . . . . . . . . . . . . . . . 272.7 260.2 252.2Amortization of intangible assets and other . . . . . . . . . . . . . . . . . . . . . . . . . . . . . . . . 26.7 28.4 30.8Loss from disposal activities, net of cash paid . . . . . . . . . . . . . . . . . . . . . . . . . . . . . . — 31.7 21.5Restructuring expense, net of cash paid . . . . . . . . . . . . . . . . . . . . . . . . . . . . . . . . . . . 48.5 23.3 —Stock-based compensation expense . . . . . . . . . . . . . . . . . . . . . . . . . . . . . . . . . . . . . 36.6 56.7 21.8Deferred income tax benefit . . . . . . . . . . . . . . . . . . . . . . . . . . . . . . . . . . . . . . . . . . . . . (22.9) (10.7) (1.1)Bond amortization . . . . . . . . . . . . . . . . . . . . . . . . . . . . . . . . . . . . . . . . . . . . . . . . . . . . . — 5.3 20.3Equity in affiliates’ earnings, net of dividends received, and other . . . . . . . . . . . . . . (21.3) (13.0) (7.8)
Net earnings adjusted for non-cash charges to operations . . . . . . . . . . . . . . . . . . 991.3 904.3 908.3Changes in assets and liabilities:
Receivables . . . . . . . . . . . . . . . . . . . . . . . . . . . . . . . . . . . . . . . . . . . . . . . . . . . . . . . . . . (91.7) 43.8 (150.6)Inventories . . . . . . . . . . . . . . . . . . . . . . . . . . . . . . . . . . . . . . . . . . . . . . . . . . . . . . . . . . . (14.8) (5.3) (38.6)Prepayments and other current assets . . . . . . . . . . . . . . . . . . . . . . . . . . . . . . . . . . . . (14.2) (15.4) (2.4)Accounts payable and accrued expenses . . . . . . . . . . . . . . . . . . . . . . . . . . . . . . . . . 33.1 (27.1) 53.0Income taxes payable . . . . . . . . . . . . . . . . . . . . . . . . . . . . . . . . . . . . . . . . . . . . . . . . . . (30.0) 44.9 (15.4)Other non-current assets and liabilities . . . . . . . . . . . . . . . . . . . . . . . . . . . . . . . . . . . . (154.9) (66.5) (46.1)
Net cash provided by operating activities . . . . . . . . . . . . . . . . . . . . . . . . . . . . . . . . 718.8 878.7 708.2INVESTINGCapital expenditures, including tooling outlays . . . . . . . . . . . . . . . . . . . . . . . . . . . . . . . (417.8) (407.4) (393.7)Net proceeds from asset disposals . . . . . . . . . . . . . . . . . . . . . . . . . . . . . . . . . . . . . . . . . 23.9 5.4 7.9Payments for businesses acquired, net of cash acquired . . . . . . . . . . . . . . . . . . . . . . . — — (203.7)Net proceeds from sale of businesses . . . . . . . . . . . . . . . . . . . . . . . . . . . . . . . . . . . . . . 9.1 56.8 25.0
Net cash used in investing activities . . . . . . . . . . . . . . . . . . . . . . . . . . . . . . . . . . . . (384.8) (345.2) (564.5)FINANCINGNet (decrease) increase in notes payable . . . . . . . . . . . . . . . . . . . . . . . . . . . . . . . . . . . . (44.4) 12.8 67.6Additions to long-term debt, net of debt issuance costs . . . . . . . . . . . . . . . . . . . . . . . . 289.5 313.9 364.6Repayments of long-term debt, including current portion . . . . . . . . . . . . . . . . . . . . . . . (77.0) (246.4) (309.1)Proceeds from accounts receivable securitization facility . . . . . . . . . . . . . . . . . . . . . . . — 30.0 —Payments for purchase of treasury stock . . . . . . . . . . . . . . . . . . . . . . . . . . . . . . . . . . . . (225.5) (295.9) (357.6)Proceeds from stock options exercised, including the tax benefit . . . . . . . . . . . . . . . . 33.0 52.0 53.0Taxes paid on employees’ restricted stock award vestings . . . . . . . . . . . . . . . . . . . . . (40.9) (18.1) (14.4)Purchase of noncontrolling interest . . . . . . . . . . . . . . . . . . . . . . . . . . . . . . . . . . . . . . . . . — (15.0) (29.4)Capital contribution from noncontrolling interest . . . . . . . . . . . . . . . . . . . . . . . . . . . . . . — — 19.5Dividends paid to BorgWarner stockholders . . . . . . . . . . . . . . . . . . . . . . . . . . . . . . . . . (56.8) — —Dividends paid to noncontrolling stockholders . . . . . . . . . . . . . . . . . . . . . . . . . . . . . . . (13.3) (21.9) (13.9)
Net cash used in financing activities . . . . . . . . . . . . . . . . . . . . . . . . . . . . . . . . . . . . (135.4) (188.6) (219.7)Effect of exchange rate changes on cash . . . . . . . . . . . . . . . . . . . . . . . . . . . . . . . . . . . . 25.2 11.2 (14.3)
Net increase (decrease) in cash . . . . . . . . . . . . . . . . . . . . . . . . . . . . . . . . . . . . . . . . 223.8 356.1 (90.3)Cash at beginning of year . . . . . . . . . . . . . . . . . . . . . . . . . . . . . . . . . . . . . . . . . . . . . . . . . 715.7 359.6 449.9
Cash at end of year . . . . . . . . . . . . . . . . . . . . . . . . . . . . . . . . . . . . . . . . . . . . . . . . . . . . . . $ 939.5 $ 715.7 $ 359.6
SUPPLEMENTAL CASH FLOW INFORMATIONNet cash paid during the year for:
Interest . . . . . . . . . . . . . . . . . . . . . . . . . . . . . . . . . . . . . . . . . . . . . . . . . . . . . . . . . . . . $ 50.4 $ 57.0 $ 68.5Income taxes . . . . . . . . . . . . . . . . . . . . . . . . . . . . . . . . . . . . . . . . . . . . . . . . . . . . . . . $ 252.9 $ 158.9 $ 175.5
See Accompanying Notes to Consolidated Financial Statements.
54

BORGWARNER INC. AND CONSOLIDATED SUBSIDIARIES
CONSOLIDATED STATEMENTS OF EQUITY
Number of shares BorgWarner Inc. stockholder’s equity
(millions of dollars, except share data)
Issuedcommon
stock
Commonstock heldin treasury
Issuedcommon
stock
Capital inexcess ofpar value
Treasurystock
Retainedearnings
Accumulatedother
comprehensiveincome (loss)
Noncontrollinginterests
Balance, January 1, 2011 . . . . . . . . . 240,172,412 (15,539,524) $1.2 $1,100.4 $(349.5) $1,560.2 $ (53.7) $ 51.2
Dividends declared . . . . . . . . . . . . . — — — — — — — (22.0)
Stock incentive plans . . . . . . . . . . . 2,040,750 — — 38.7 — — — —
Executive stock plan . . . . . . . . . . . 208,410 — — 6.8 — — — —
Net issuance of restricted stock . . 209,838 — — 15.0 — — — —
Purchase of treasury stock . . . . . . — (10,062,962) — — (357.6) — — —
Net earnings . . . . . . . . . . . . . . . . . . — — — — — 550.1 — 20.5
Other comprehensive income . . . . — — — — — — (97.1) (1.3)
Capital contribution from
noncontrolling interest . . . . . . . . — — — — — — — 19.5
BorgWarner Vikas Emissions India
Private Limited acquisition . . . . . — — — (26.6) — — — (2.8)
Balance, December 31, 2011 . . . . . . 242,631,410 (25,602,486) $1.2 $1,134.3 $(707.1) $2,110.3 $(150.8) $ 65.1
Dividends declared . . . . . . . . . . . . . — — — — — — — (18.9)
Stock incentive plans . . . . . . . . . . . 1,555,850 — — 52.0 — — — —
Executive stock plan . . . . . . . . . . . 1,076,360 — — 39.3 — — — —
Net issuance of restricted stock . . 782,698 (482,500) — 21.2 (18.1) — — —
Purchase of treasury stock . . . . . . — (8,311,388) — — (295.9) — — —
Convertible bond settlement . . . . . — 22,765,542 — (243.5) 617.3 — — —
Convertible bond—hedge
settlement . . . . . . . . . . . . . . . . . . — (12,979,396) — 503.9 (503.9) — — —
Convertible bond—warrant
settlement . . . . . . . . . . . . . . . . . . — 9,709,308 — (338.5) 338.5 — — —
Net earnings . . . . . . . . . . . . . . . . . . — — — — — 500.9 — 21.5
Other comprehensive income . . . . — — — — — — 29.5 2.8
BorgWarner BERU Systems Korea
Co., Ltd. acquisition . . . . . . . . . . — — — (8.0) — — — (7.0)
Balance, December 31, 2012 . . . . . . 246,046,318 (14,900,920) $1.2 $1,160.7 $(569.2) $2,611.2 $(121.3) $ 63.5
Dividends declared . . . . . . . . . . . . . — — — — — (56.8) — (20.1)
Stock incentive plans . . . . . . . . . . . 8,200 861,866 — 33.0 — — — —
Net issuance for executive stock
plan . . . . . . . . . . . . . . . . . . . . . . . . — 644,638 — 10.8 — — — —
Net issuance of restricted stock . . 367,375 148,485 — (82.6) 67.5 — — —
Purchase of treasury stock . . . . . . — (5,243,106) — — (225.5) — — —
Stock split . . . . . . . . . . . . . . . . . . . . — — 1.3 — — (1.3) — —
Net earnings . . . . . . . . . . . . . . . . . . — — — — — 624.3 — 26.7
Other comprehensive income . . . . — — — — — — 107.3 1.7
Balance, December 31, 2013 . . . . . . 246,421,893 (18,489,037) $2.5 $1,121.9 $(727.2) $3,177.4 $ (14.0) $ 71.8
See Accompanying Notes to Consolidated Financial Statements.
55

NOTES TO CONSOLIDATED FINANCIAL STATEMENTS
INTRODUCTION
BorgWarner Inc. and Consolidated Subsidiaries (the “Company”) is a leading global supplier of
highly engineered automotive systems and components primarily for powertrain applications. Our
products help improve vehicle performance, fuel efficiency, stability and air quality. These products
are manufactured and sold worldwide, primarily to original equipment manufacturers (“OEMs”) of light
vehicles (passenger cars, sport-utility vehicles (“SUVs”), vans and light trucks). The Company's
products are also sold to other OEMs of commercial vehicles (medium-duty trucks, heavy-duty trucks
and buses) and off-highway vehicles (agricultural and construction machinery and marine
applications). We also manufacture and sell our products to certain Tier One vehicle systems
suppliers and into the aftermarket for light, commercial and off-highway vehicles. The Company
operates manufacturing facilities serving customers in the Americas, Europe and Asia and is an
original equipment supplier to every major automotive OEM in the world. The Company's products fall
into two reporting segments: Engine and Drivetrain.
NOTE 1 SUMMARY OF SIGNIFICANT ACCOUNTING POLICIES
The following paragraphs briefly describe the Company's significant accounting policies.
Basis of presentation In 2012, the Company retrospectively adopted the amendment to
Accounting Standards Codification (“ASC”) Topic 220, “Comprehensive Income,” which requires
companies to separately disclose reclassifications from other comprehensive income into net income
on the face of the financial statements. Prior year balances within the Consolidated Statements of
Comprehensive Income conform to this requirement. Certain prior period amounts have been
reclassified to conform to current period presentation.
On November 13, 2013, the Company's Board of Directors declared a two-for-one stock split
effected in the form of a stock dividend on its common stock. To implement this stock split, shares of
common stock were issued on December 16, 2013 to stockholders of record as of the close of
business on December 2, 2013. All prior year share and per share amounts disclosed in this
document have been restated to reflect the two-for-one stock split.
Use of estimates The preparation of financial statements in conformity with accounting
principles generally accepted in the United States of America (“GAAP”) requires management to make
estimates and assumptions. These estimates and assumptions affect the reported amounts of assets
and liabilities and disclosure of contingent assets and liabilities as of the date of the financial
statements and the accompanying notes, as well as, the amounts of revenues and expenses reported
during the periods covered by these financial statements and accompanying notes. Actual results
could differ from those estimates.
Concentrations of risk Cash is maintained with several financial institutions. Deposits held with
banks may exceed the amount of insurance provided on such deposits. Generally, these deposits
may be redeemed upon demand and are maintained with financial institutions of reputable credit and
therefore bear minimal risk.
The Company performs ongoing credit evaluations of its suppliers and customers and, with the
exception of certain financing transactions, does not require collateral from its OEM customers. Some
automotive parts suppliers continue to experience commodity cost pressures and the effects of
industry overcapacity. These factors have increased pressure on the industry's supply base, as
suppliers cope with higher commodity costs, lower production volumes and other challenges. The
Company receives certain of its raw materials from sole suppliers or a limited number of suppliers.
56

NOTES TO CONSOLIDATED FINANCIAL STATEMENTS — (Continued)
The inability of a supplier to fulfill supply requirements of the Company could materially affect future
operating results.
Principles of consolidation The Consolidated Financial Statements include all majority-owned
subsidiaries with a controlling financial interest. All inter-company accounts and transactions have
been eliminated in consolidation. Investments in 20% to 50% owned affiliates are accounted for
under the equity method when the Company does not have a controlling financial interest.
Revenue recognition The Company recognizes revenue when title and risk of loss pass to the
customer, which is usually upon shipment of product. Although the Company may enter into long-
term supply agreements with its major customers, each shipment of goods is treated as a separate
sale and the prices are not fixed over the life of the agreements.
Cost of sales The Company includes materials, direct labor and manufacturing overhead within
cost of sales. Manufacturing overhead is comprised of indirect materials, indirect labor, factory
operating costs and other such costs associated with manufacturing products for sale.
Cash Cash is valued at fair market value. It is the Company’s policy to classify all highly liquid
investments with original maturities of three months or less as cash.
Receivables, net The Company securitizes certain receivables through third party financial
institutions without recourse and continues to administer the collection of these receivables on behalf
of the third party. The amount can vary each month based on the amount of underlying receivables.
On December 21, 2009, the Company entered into a $50 million accounts receivable securitization
facility, which was amended on September 8, 2010 to increase the facility to $80 million and then
again on November 1, 2012 to increase the facility to $110 million. The amended facility matures on
October 31, 2014.
Inventories, net Inventories are valued at the lower of cost or market. Cost of U.S. inventories is
determined using the last-in, first-out (“LIFO”) method, while the foreign operations use the first-in,
first-out (“FIFO”) or average-cost methods. Inventory held by U.S. operations was $109.3 million and
$102.1 million at December 31, 2013 and 2012, respectively. Such inventories, if valued at current
cost instead of LIFO, would have been greater by $16.0 million at December 31, 2013 and 2012.
See Note 5 to the Consolidated Financial Statements for more information on inventories, net.
Pre-production costs related to long-term supply arrangements Engineering, research and
development and other design and development costs for products sold on long-term supply
arrangements are expensed as incurred unless the Company has a contractual guarantee for
reimbursement from the customer. Costs for molds, dies and other tools used to make products sold
on long-term supply arrangements for which the Company either has title to the assets or has the
non-cancelable right to use the assets during the term of the supply arrangement are capitalized in
property, plant and equipment and amortized to cost of sales over the shorter of the term of the
arrangement or over the estimated useful lives of the assets, typically three to five years. Costs for
molds, dies and other tools used to make products sold on long-term supply arrangements for which
the Company has a contractual guarantee for lump sum reimbursement from the customer are
capitalized in prepayments and other current assets.
Property, plant and equipment, net Property, plant and equipment is valued at cost less
accumulated depreciation. Expenditures for maintenance, repairs and renewals of relatively minor
items are generally charged to expense as incurred. Renewals of significant items are capitalized.
57

NOTES TO CONSOLIDATED FINANCIAL STATEMENTS — (Continued)
Depreciation is generally computed on a straight-line basis over the estimated useful lives of the
assets. Useful lives for buildings range from 15 to 40 years and useful lives for machinery and
equipment range from three to 12 years. For income tax purposes, accelerated methods of
depreciation are generally used.
See Note 5 to the Consolidated Financial Statements for more information on property, plant and
equipment, net.
Impairment of long-lived assets, including definite-lived intangible assets The Company
reviews the carrying value of its long-lived assets, whether held for use or disposal, including other
amortizing intangible assets, when events and circumstances warrant such a review under
Accounting Standards Codification (“ASC”) Topic 360. In assessing long-lived assets for an
impairment loss, assets are grouped with other assets and liabilities at the lowest level for which
identifiable cash flows are largely independent of the cash flows of other assets and liabilities. In
assessing long-lived assets for impairment, management generally considers individual facilities the
lowest level for which identifiable cash flows are largely independent. A recoverability review is
performed using the undiscounted cash flows if there is a triggering event. If the undiscounted cash
flow test for recoverability identifies a possible impairment, management will perform a fair value
analysis. Management determines fair value under ASC Topic 820 using the appropriate valuation
technique of market, income or cost approach. If the carrying value of a long-lived asset is considered
impaired, an impairment charge is recorded for the amount by which the carrying value of the long-
lived asset exceeds its fair value.
Management believes that the estimates of future cash flows and fair value assumptions are
reasonable; however, changes in assumptions underlying these estimates could affect the valuations.
Long-lived assets held for sale are recorded at the lower of their carrying amount or fair value less
cost to sell. Significant judgments and estimates used by management when evaluating long-lived
assets for impairment include: (i) an assessment as to whether an adverse event or circumstance has
triggered the need for an impairment review; (ii) undiscounted future cash flows generated by the
asset; and (iii) fair valuation of the asset.
Goodwill and other indefinite-lived intangible assets During the fourth quarter of each year,
the Company qualitatively assesses its goodwill and indefinite-lived intangible assets assigned to
each of its reporting units. This qualitative assessment evaluates various events and circumstances,
such as macro economic conditions, industry and market conditions, cost factors, relevant events
and financial trends, that may impact a reporting unit’s fair value. Using this qualitative assessment,
the Company determines whether it is more-likely-than not the reporting unit’s fair value exceeds its
carrying value. If it is determined that it is not more-likely-than-not the reporting unit's fair value
exceeds the carrying value, or upon a triggering event, including recent acquisition or divestiture
activity, the Company performs a quantitative, “step one,” goodwill impairment analysis.
See Note 6 to the Consolidated Financial Statements for more information on goodwill and other
indefinite-lived intangible assets.
Product warranties The Company provides warranties on some, but not all, of its products. The
warranty terms are typically from one to three years. Provisions for estimated expenses related to
product warranty are made at the time products are sold. These estimates are established using
historical information about the nature, frequency and average cost of warranty claim settlements as
well as product manufacturing and industry developments and recoveries from third parties.
Management actively studies trends of warranty claims and takes action to improve product quality
58
NOTES TO CONSOLIDATED FINANCIAL STATEMENTS — (Continued)
and minimize warranty claims. Management believes that the warranty accrual is appropriate;
however, actual claims incurred could differ from the original estimates, requiring adjustments to the
accrual. The product warranty accrual is allocated to current and non-current liabilities in the
Consolidated Balance Sheets.
See Note 7 to the Consolidated Financial Statements for more information on product warranties.
Other loss accruals and valuation allowances The Company has numerous other loss
exposures, such as customer claims, workers’ compensation claims, litigation and recoverability of
assets. Establishing loss accruals or valuation allowances for these matters requires the use of
estimates and judgment in regard to the risk exposure and ultimate realization. The Company
estimates losses under the programs using consistent and appropriate methods, however, changes
to its assumptions could materially affect the recorded accrued liabilities for loss or asset valuation
allowances.
Derivative financial instruments The Company recognizes that certain normal business
transactions generate risk. Examples of risks include exposure to exchange rate risk related to
transactions denominated in currencies other than the functional currency, changes in commodity
costs and interest rates. It is the objective and responsibility of the Company to assess the impact of
these transaction risks and offer protection from selected risks through various methods, including
financial derivatives. Virtually all derivative instruments held by the Company are designated as
hedges, have high correlation with the underlying exposure and are highly effective in offsetting
underlying price movements. Accordingly, gains and losses from changes in qualifying hedge fair
values are matched with the underlying transactions. All hedge instruments are carried at their fair
value based on quoted market prices for contracts with similar maturities. The Company does not
engage in any derivative transactions for purposes other than hedging specific risks.
See Note 10 to the Consolidated Financial Statements for more information on derivative financial
instruments.
Foreign currency The financial statements of foreign subsidiaries are translated to U.S. dollars
using the period-end exchange rate for assets and liabilities and an average exchange rate for each
period for revenues, expenses and capital expenditures. The local currency is the functional currency
for substantially all of the Company’s foreign subsidiaries. Translation adjustments for foreign
subsidiaries are recorded as a component of accumulated other comprehensive income (loss) in
equity. The Company recognizes transaction gains and losses arising from fluctuations in currency
exchange rates on transactions denominated in currencies other than the functional currency in
earnings as incurred.
See Note 13 to the Consolidated Financial Statements for more information on accumulated
other comprehensive income (loss).
Environmental contingencies The Company accounts for environmental costs in accordance
with ASC Topic 450. Costs related to environmental assessments and remediation efforts at operating
facilities are accrued when it is probable that a liability has been incurred and the amount of that
liability can be reasonably estimated. Estimated costs are recorded at undiscounted amounts, based
on experience and assessments and are regularly evaluated. The liabilities are recorded in accounts
payable and accrued expenses and other non-current liabilities in the Company’s Consolidated
Balance Sheets.
59

NOTES TO CONSOLIDATED FINANCIAL STATEMENTS — (Continued)
See Note 14 to the Consolidated Financial Statements for more information regarding
environmental contingencies.
Pensions and other postretirement employee defined benefits The Company’s defined
benefit pension and other postretirement employee benefit plans are accounted for in accordance
with ASC Topic 715. Disability, early retirement and other postretirement employee benefits are
accounted for in accordance with ASC Topic 712.
Pensions and other postretirement employee benefit costs and related liabilities and assets are
dependent upon assumptions used in calculating such amounts. These assumptions include discount
rates, expected returns on plan assets, health care cost trends, compensation and other factors. In
accordance with GAAP, actual results that differ from the assumptions used are accumulated and
amortized over future periods, and accordingly, generally affect recognized expense in future periods.
See Note 11 to the Consolidated Financial Statements for more information regarding the
Company's pension and other postretirement employee defined benefit plans.
Income taxes In accordance with ASC Topic 740, the Company’s income tax expense is
calculated based on expected income and statutory tax rates in the various jurisdictions in which the
Company operates and requires the use of management’s estimates and judgments.
See Note 4 to the Consolidated Financial Statements for more information regarding income taxes.
New Accounting Pronouncements
In July 2013, the Financial Accounting Standards Board amended ASC Topic 740, “Income
Taxes,” requiring an unrecognized tax benefit, or a portion of an unrecognized tax benefit, to be
presented in the financial statements as a reduction to a deferred tax asset for a net operating loss
carryforward, a similar tax loss, or a tax credit carryforward. This guidance is effective prospectively
for interim and annual periods beginning after December 15, 2013. The Company anticipates the
adoption of this guidance will not have a material impact to its Consolidated Financial Statements.
NOTE 2 RESEARCH AND DEVELOPMENT COSTS
The Company’s net Research & Development (“R&D”) expenditures are included in selling,
general and administrative expenses of the Consolidated Statements of Operations. Customer
reimbursements are netted against gross R&D expenditures as they are considered a recovery of
cost. Customer reimbursements for prototypes are recorded net of prototype costs based on
customer contracts, typically either when the prototype is shipped or when it is accepted by the
customer. Customer reimbursements for engineering services are recorded when performance
obligations are satisfied in accordance with the contract and accepted by the customer. Financial
risks and rewards transfer upon shipment, acceptance of a prototype component by the customer or
upon completion of the performance obligation as stated in the respective customer agreement.
The following table presents the Company’s gross and net expenditures on R&D activities:
Year Ended December 31,
(millions of dollars) 2013 2012 2011
Gross R&D expenditures . . . . . . . . . . . . . . . . . . . . . . . . . . . . . . . $350.4 $309.3 $294.7
Customer reimbursements . . . . . . . . . . . . . . . . . . . . . . . . . . . . . . (47.2) (43.4) (51.0)
Net R&D expenditures . . . . . . . . . . . . . . . . . . . . . . . . . . . . . . . . $303.2 $265.9 $243.7
60

NOTES TO CONSOLIDATED FINANCIAL STATEMENTS — (Continued)
Net R&D expenditures as a percentage of net sales were 4.1%, 3.7% and 3.4% in the years
ended December 31, 2013, 2012 and 2011, respectively. The Company has contracts with several
customers at the Company’s various R&D locations. No such contract exceeded 5% of net R&D
expenditures in any of the years presented.
NOTE 3 OTHER EXPENSE (INCOME)
The following table presents items included in other expense (income):
Year Ended December 31,
(millions of dollars) 2013 2012 2011
Restructuring expense . . . . . . . . . . . . . . . . . . . . . . . . . . . . . . . . . . . . $52.3 $27.4 $ —
Program termination agreement . . . . . . . . . . . . . . . . . . . . . . . . . . . . 11.3 — —
Retirement related obligations . . . . . . . . . . . . . . . . . . . . . . . . . . . . . . 5.9 17.3 —
Loss from disposal activities . . . . . . . . . . . . . . . . . . . . . . . . . . . . . . . — 39.7 21.5
Patent infringement settlement, net of legal costs incurred . . . . . . — — (29.1)
Other . . . . . . . . . . . . . . . . . . . . . . . . . . . . . . . . . . . . . . . . . . . . . . . . . . (6.9) 0.3 (0.5)
Other expense (income) . . . . . . . . . . . . . . . . . . . . . . . . . . . . . . . . . $62.6 $84.7 $ (8.1)
During the fourth quarter of 2013, the Company recorded restructuring expense of $52.3 million
primarily related to the initiation of Drivetrain segment actions designed to improve future profitability
and competitiveness. Included in this restructuring expense are asset impairment expenses of $37.3
million, employee termination benefits of $10.4 million and $4.6 million of other expense. Asset
impairment charges recorded in 2013 primarily relate to the write-down of machinery and equipment
and intangible assets associated with the announced closure of certain European facilities within the
Company’s Drivetrain segment. The employee termination costs relate to approximately 300
employees primarily in Europe. It is expected the liability for these benefits will be paid out by the
middle of 2015.
During the first quarter of 2013, the Company recorded an $11.3 million expense related to a
program termination agreement, which was paid in the second and third quarters of 2013.
During the fourth quarter of 2012, the Company waived the forfeiture provision associated with
future restricted stock grants made to certain retiring Named Executive Officers (“NEOs”). The
Company recorded a $5.9 million retirement related obligation primarily related to a first quarter 2013
grant of restricted stock awards to these NEOs.
During the fourth quarter of 2012, the Company recorded retirement related obligations of $17.3
million comprised of a $5.7 million loss resulting from the settlement of a portion of the Muncie Plant’s
pension obligation and an $11.6 million expense associated with the retirement of certain NEOs. Refer
to Notes 11 and 12 to the Consolidated Financial Statements for further information regarding the
Muncie Plant’s settlement loss and the Company’s decision to waive the forfeiture provisions of
existing restricted stock and performance share grants made to certain retiring NEOs.
During the second and third quarters of 2012, the Company incurred $39.7 million in expense
associated with the loss on sale of the spark plug business, primarily related to the to write-down of
prior purchase price accounting adjustments included within the disposal group. These purchase
price accounting adjustments were originally reported in the Engine segment and related to the BERU
acquisition. The Company also recorded restructuring expense of $27.4 million in the third quarter of
2012 primarily associated with the disposal and future requirements of BERU's on-going business,
61

NOTES TO CONSOLIDATED FINANCIAL STATEMENTS — (Continued)
which included $9.0 million of employee termination benefits, $6.3 million of contract cancellation
costs and $12.1 million of other charges, primarily related to the write-down of certain assets.
On May 16, 2011, BorgWarner and Honeywell settled a lawsuit resolving BorgWarner’s patent
infringement claims. As a result of the settlement, Honeywell paid $32.5 million for a paid up license to
use the asserted BorgWarner patents. During 2011, the Company incurred $3.4 million in legal costs
related to this lawsuit and after deducting these costs, the Company recorded a net gain of
$29.1 million.
See Note 17 to the Consolidated Financial Statements for information regarding the Company’s
2011 loss from disposal activities.
NOTE 4 INCOME TAXES
Earnings before income taxes and the provision for income taxes are presented in the following
table.
Year Ended December 31,
(millions of dollars) 2013 2012 2011
Earnings before income taxes:
U.S. . . . . . . . . . . . . . . . . . . . . . . . . . . . . . . . . . . . . . . . . . . . . . . . . . . . . . . . . . . . $136.2 $132.3 $119.2
Non-U.S. . . . . . . . . . . . . . . . . . . . . . . . . . . . . . . . . . . . . . . . . . . . . . . . . . . . . . . . 733.1 628.7 646.7
Total . . . . . . . . . . . . . . . . . . . . . . . . . . . . . . . . . . . . . . . . . . . . . . . . . . . . . . . . . $869.3 $761.0 $765.9
Provision for income taxes:
Current:
Federal . . . . . . . . . . . . . . . . . . . . . . . . . . . . . . . . . . . . . . . . . . . . . . . . . . . . . . $ 27.7 $ 59.8 $ 31.8
State . . . . . . . . . . . . . . . . . . . . . . . . . . . . . . . . . . . . . . . . . . . . . . . . . . . . . . . . 2.6 3.4 1.7
Foreign . . . . . . . . . . . . . . . . . . . . . . . . . . . . . . . . . . . . . . . . . . . . . . . . . . . . . . 211.1 186.1 162.9
Total current . . . . . . . . . . . . . . . . . . . . . . . . . . . . . . . . . . . . . . . . . . . . . . . . 241.4 249.3 196.4
Deferred:
Federal . . . . . . . . . . . . . . . . . . . . . . . . . . . . . . . . . . . . . . . . . . . . . . . . . . . . . . (2.3) 19.6 17.3
State . . . . . . . . . . . . . . . . . . . . . . . . . . . . . . . . . . . . . . . . . . . . . . . . . . . . . . . . (7.3) (0.1) 0.1
Foreign . . . . . . . . . . . . . . . . . . . . . . . . . . . . . . . . . . . . . . . . . . . . . . . . . . . . . . (13.5) (30.2) (18.5)
Total deferred . . . . . . . . . . . . . . . . . . . . . . . . . . . . . . . . . . . . . . . . . . . . . . . (23.1) (10.7) (1.1)
Total provision for income taxes . . . . . . . . . . . . . . . . . . . . . . . . . . . . . . . . . . . . $218.3 $238.6 $195.3
62

NOTES TO CONSOLIDATED FINANCIAL STATEMENTS — (Continued)
The provision for income taxes resulted in an effective tax rate of 25.1%, 31.4% and 25.5% for
the years ended December 31, 2013, 2012 and 2011, respectively. An analysis of the differences
between the effective tax rate and the U.S. statutory rate for the years ended December 31, 2013,
2012 and 2011 is presented below.
Year Ended December 31,(millions of dollars) 2013 2012 2011
Income taxes at U.S. statutory rate of 35% . . . . . . . . . . . . . . . . $304.3 $266.4 $268.1
Increases (decreases) resulting from:
State taxes, net of federal benefit . . . . . . . . . . . . . . . . . . . . . . 2.3 2.2 1.1
U.S. tax on non-U.S. earnings . . . . . . . . . . . . . . . . . . . . . . . . . (2.8) 22.3 9.4
Affiliates’ earnings . . . . . . . . . . . . . . . . . . . . . . . . . . . . . . . . . . . (15.6) (15.0) (13.4)
Foreign rate differential . . . . . . . . . . . . . . . . . . . . . . . . . . . . . . . (73.4) (57.9) (60.0)
Tax holidays . . . . . . . . . . . . . . . . . . . . . . . . . . . . . . . . . . . . . . . . (15.6) (27.0) (21.3)
Withholding taxes . . . . . . . . . . . . . . . . . . . . . . . . . . . . . . . . . . . 15.4 12.3 10.9
Impairments and write-offs . . . . . . . . . . . . . . . . . . . . . . . . . . . . 5.2 15.9 6.4
Tax credits . . . . . . . . . . . . . . . . . . . . . . . . . . . . . . . . . . . . . . . . . (6.9) (2.3) (4.0)
Reserve adjustments, settlements and claims . . . . . . . . . . . . 0.5 12.9 (1.0)
Valuation allowance adjustments . . . . . . . . . . . . . . . . . . . . . . . (1.4) 9.7 (5.3)
Other . . . . . . . . . . . . . . . . . . . . . . . . . . . . . . . . . . . . . . . . . . . . . . 6.3 (0.9) 4.4
Provision for income taxes, as reported . . . . . . . . . . . . . . . . . . . $218.3 $238.6 $195.3
The Company’s provision for income taxes for the year ended December 31, 2013, includes tax
benefits of $7.1 million, $3.8 million and $2.1 million related to restructuring expense, program
termination agreement and retirement related obligations discussed in Note 3. This rate also includes
a net tax benefit of $11.7 million, which is comprised of tax benefits of $6.7 million related to the
extension of the federal research and development credit and other international tax provisions
resulting from the retroactive impact of U.S. legislation enacted in January 2013, $2.2 million related
to 2012 provision to return and other tax adjustments and $8.0 million related to the reversal of certain
state deferred tax asset valuation allowances, partially offset by a $5.2 million tax expense related to
comprehensive income and other tax adjustments.
The Company’s provision for income taxes for the year ended December 31, 2012 includes a net
tax benefit of $2.0 million associated with the loss from disposal activities and restructuring expense.
The $2.0 million net benefit is comprised of a tax benefit of $7.7 million associated with restructuring
expense, partially offset by tax expense of $5.7 million resulting from the sale of the spark plug
business. The provision also includes additional tax expense of $19.8 million resulting from other tax
adjustments. These other tax adjustments include $5.9 million of tax expense primarily resulting from
the settlement of certain tax audits, $7.5 million of tax expense associated with the Company’s
second quarter 2012 decision to change its cash repatriation assertion for some of its foreign
subsidiaries, $4.7 million of tax benefit related to certain countries enacting changes to their
respective statutory income tax rates and $11.1 million of U.S. tax expense to correct the income
taxes payable balance. The Company concluded this item was not material to the current or prior
period financial statements.
The Company’s provision for income taxes for the year ended December 31, 2011 includes $11.0
million of tax expense associated with the Company’s patent infringement settlement, $2.7 million of
tax expense associated with the loss from disposal activities and a tax benefit of $6.2 million resulting
from other tax adjustments. These other tax adjustments related to a change in state corporate
income tax legislation as well as an adjustment of the Company’s tax accounts as a result of the
63

NOTES TO CONSOLIDATED FINANCIAL STATEMENTS — (Continued)
closure of certain tax audits. During 2011, several countries enacted changes to their respective
statutory income tax rates. None of these changes had a material impact on the Company’s effective
tax rate.
A roll forward of the Company’s total gross unrecognized tax benefits for the years ended
December 31, 2013 and 2012, respectively, is presented below. Of the total $22.9 million of
unrecognized tax benefits as of December 31, 2013, approximately $15.7 million of the total
represents the amount, if recognized, would affect the Company’s effective income tax rate in future
periods. This amount differs from the gross unrecognized tax benefits presented in the table due to
the decrease in the U.S. federal income taxes which would occur upon recognition of the state tax
benefits included therein.
(millions of dollars) 2013 2012
Balance, January 1 . . . . . . . . . . . . . . . . . . . . . . . . . . . . . . . . . . . . . . . . . . . . . . $ 25.8 $ 26.2
Additions based on tax positions related to current year . . . . . . . . . . . . . 1.7 2.0
Additions for tax positions of prior years . . . . . . . . . . . . . . . . . . . . . . . . . . 12.5 13.4
Reductions for closure of tax audits and settlements . . . . . . . . . . . . . . . . (17.7) (14.6)
Reductions for lapse in statute of limitations . . . . . . . . . . . . . . . . . . . . . . . (0.2) (1.7)
Translation adjustment . . . . . . . . . . . . . . . . . . . . . . . . . . . . . . . . . . . . . . . . . 0.8 0.5
Balance, December 31 . . . . . . . . . . . . . . . . . . . . . . . . . . . . . . . . . . . . . . . . . . . $ 22.9 $ 25.8
The Company recognizes interest and penalties related to unrecognized tax benefits in income
tax expense. The amount recognized in income tax expense for 2013 and 2012 is $1.0 million and
$0.5 million, respectively. The Company has an accrual of approximately $8.4 million and $8.3 million
for the payment of interest and penalties at December 31, 2013 and 2012, respectively. During the
year ended December 31, 2013 the Company paid $14.9 million for the settlement of audits and
resulting amended returns in certain foreign jurisdictions. Possible changes within the next 12 months
related to other examinations cannot be reasonably estimated at this time.
The Company and/or one of its subsidiaries files income tax returns in the U.S. federal, various
state jurisdictions and various foreign jurisdictions. In certain tax jurisdictions, the Company may have
more than one taxpayer. The Company is no longer subject to income tax examinations by tax
authorities in its major tax jurisdictions as follows:
Tax jurisdictionYears no longersubject to audit
U.S. Federal . . . . . . . . . . . . . . . . . . . . . . . . . . . . . . 2010 and prior
China . . . . . . . . . . . . . . . . . . . . . . . . . . . . . . . . . . . 2007 and prior
France . . . . . . . . . . . . . . . . . . . . . . . . . . . . . . . . . . 2007 and prior
Germany . . . . . . . . . . . . . . . . . . . . . . . . . . . . . . . . . 2007 and prior
Hungary . . . . . . . . . . . . . . . . . . . . . . . . . . . . . . . . . 2008 and prior
Japan . . . . . . . . . . . . . . . . . . . . . . . . . . . . . . . . . . . 2011 and prior
South Korea . . . . . . . . . . . . . . . . . . . . . . . . . . . . . . 2007 and prior
Sweden . . . . . . . . . . . . . . . . . . . . . . . . . . . . . . . . . 2007 and prior
64

NOTES TO CONSOLIDATED FINANCIAL STATEMENTS — (Continued)
The gross components of deferred tax assets and liabilities as of December 31, 2013 and 2012
consist of the following:
December 31,
(millions of dollars) 2013 2012
Deferred tax assets:Foreign tax credits . . . . . . . . . . . . . . . . . . . . . . . . . . . . . . . . . . . . . . . . . . . . . . . . . . . . $ 145.9 $ 146.0
Employee compensation . . . . . . . . . . . . . . . . . . . . . . . . . . . . . . . . . . . . . . . . . . . . . . . 40.6 53.1
Other comprehensive income . . . . . . . . . . . . . . . . . . . . . . . . . . . . . . . . . . . . . . . . . . . 79.3 113.7
Research and development capitalization . . . . . . . . . . . . . . . . . . . . . . . . . . . . . . . . . 132.4 102.5
Net operating loss and capital loss carryforwards . . . . . . . . . . . . . . . . . . . . . . . . . . 46.4 44.3
Pension and other postretirement benefits . . . . . . . . . . . . . . . . . . . . . . . . . . . . . . . . 36.5 37.7
Other . . . . . . . . . . . . . . . . . . . . . . . . . . . . . . . . . . . . . . . . . . . . . . . . . . . . . . . . . . . . . . . 75.8 44.1
Total deferred tax assets . . . . . . . . . . . . . . . . . . . . . . . . . . . . . . . . . . . . . . . . . . . . . . . . $ 556.9 $ 541.4
Valuation allowance . . . . . . . . . . . . . . . . . . . . . . . . . . . . . . . . . . . . . . . . . . . . . . . . . . . . . (34.2) (35.0)
Net deferred tax asset . . . . . . . . . . . . . . . . . . . . . . . . . . . . . . . . . . . . . . . . . . . . . . . . . $ 522.7 $ 506.4
Deferred tax liabilities:Goodwill and intangible assets . . . . . . . . . . . . . . . . . . . . . . . . . . . . . . . . . . . . . . . . . . (139.5) (130.9)
Fixed assets . . . . . . . . . . . . . . . . . . . . . . . . . . . . . . . . . . . . . . . . . . . . . . . . . . . . . . . . . (105.4) (101.9)
Other . . . . . . . . . . . . . . . . . . . . . . . . . . . . . . . . . . . . . . . . . . . . . . . . . . . . . . . . . . . . . . . (36.7) (25.6)
Total deferred tax liabilities . . . . . . . . . . . . . . . . . . . . . . . . . . . . . . . . . . . . . . . . . . . . . . . $(281.6) $(258.4)
Net deferred taxes . . . . . . . . . . . . . . . . . . . . . . . . . . . . . . . . . . . . . . . . . . . . . . . . . . . . $ 241.1 $ 248.0
At December 31, 2013, certain non-U.S. subsidiaries have net operating loss carryforwards
totaling $58.0 million available to offset future taxable income. Of the total $58.0 million, $48.4 million
expire at various dates from 2014 through 2033 and the remaining $9.6 million have no expiration
date. The Company has a valuation allowance of $1.5 million recorded on $4.9 million of non-U.S. net
operating loss carryforwards. Certain U.S. subsidiaries have state net operating loss carryforwards
totaling $501.4 million which are partially offset by a valuation allowance of $300.8 million. Certain
non-U.S. subsidiaries located in China, Korea and Poland had tax exemptions or tax holidays, which
reduced tax expense approximately $15.6 million and $26.7 million in 2013 and 2012, respectively.
The tax holiday in Poland expired at the end of 2013. The U.S. has foreign tax credit carryforwards of
$145.9 million, which expire at various dates from 2017 through 2020.
The Company is not required to provide U.S. federal or state income taxes on cumulative
undistributed earnings of foreign subsidiaries when such earnings are considered permanently
reinvested. The Company’s policy is to evaluate this assertion on a quarterly basis. During the second
quarter of 2012, the Company changed the assertion for some of its foreign subsidiaries to provide
management additional financial flexibility. At December 31, 2013, the Company’s deferred tax liability
associated with unremitted foreign earnings was $18.7 million.
The Company has not recorded deferred income taxes on the difference between the book and
tax basis of investments in foreign subsidiaries or foreign equity affiliates totaling approximately $2.3
billion in 2013, as these amounts are essentially permanent in nature. The difference will become
taxable upon repatriation of assets, sale or liquidation of the investment. Due to fluctuation in tax laws
around the world and fluctuations in foreign exchange rates, it is not practicable to determine the
unrecognized deferred tax liability on this difference because the actual tax liability, if any, is
dependent on circumstances existing when the repatriation occurs.
65

NOTES TO CONSOLIDATED FINANCIAL STATEMENTS — (Continued)
NOTE 5 BALANCE SHEET INFORMATION
Detailed balance sheet data is as follows:
December 31,
(millions of dollars) 2013 2012
Receivables, net:Customers . . . . . . . . . . . . . . . . . . . . . . . . . . . . . . . . . . . . . . . . . . . . . . $ 1,067.5 $ 1,014.6Other . . . . . . . . . . . . . . . . . . . . . . . . . . . . . . . . . . . . . . . . . . . . . . . . . . 183.1 134.8
Gross receivables . . . . . . . . . . . . . . . . . . . . . . . . . . . . . . . . . . . . . . 1,250.6 1,149.4Bad debt allowance(a) . . . . . . . . . . . . . . . . . . . . . . . . . . . . . . . . . . . . (2.1) (2.1)
Total receivables, net . . . . . . . . . . . . . . . . . . . . . . . . . . . . . . . . . . . $ 1,248.5 $ 1,147.3
Inventories, net:Raw material and supplies . . . . . . . . . . . . . . . . . . . . . . . . . . . . . . . . . $ 279.8 $ 264.0Work in progress . . . . . . . . . . . . . . . . . . . . . . . . . . . . . . . . . . . . . . . . 78.0 82.0Finished goods . . . . . . . . . . . . . . . . . . . . . . . . . . . . . . . . . . . . . . . . . . 116.3 117.6
FIFO inventories . . . . . . . . . . . . . . . . . . . . . . . . . . . . . . . . . . . . . . . . . 474.1 463.6LIFO reserve . . . . . . . . . . . . . . . . . . . . . . . . . . . . . . . . . . . . . . . . . . . . (16.0) (16.0)
Total inventories, net . . . . . . . . . . . . . . . . . . . . . . . . . . . . . . . . . . . $ 458.1 $ 447.6
Prepayments and other current assets:Prepaid tooling . . . . . . . . . . . . . . . . . . . . . . . . . . . . . . . . . . . . . . . . . . $ 37.1 $ 39.1Prepaid taxes . . . . . . . . . . . . . . . . . . . . . . . . . . . . . . . . . . . . . . . . . . . 12.3 0.7Derivatives . . . . . . . . . . . . . . . . . . . . . . . . . . . . . . . . . . . . . . . . . . . . . . 3.4 5.7Other . . . . . . . . . . . . . . . . . . . . . . . . . . . . . . . . . . . . . . . . . . . . . . . . . . 30.9 22.0
Total prepayments and other current assets . . . . . . . . . . . . . . . . $ 83.7 $ 67.5
Property, plant and equipment, net:Land and land use rights . . . . . . . . . . . . . . . . . . . . . . . . . . . . . . . . . . $ 87.2 $ 76.4Buildings . . . . . . . . . . . . . . . . . . . . . . . . . . . . . . . . . . . . . . . . . . . . . . . 666.7 640.8Machinery and equipment . . . . . . . . . . . . . . . . . . . . . . . . . . . . . . . . . 1,897.5 2,282.4Capital leases . . . . . . . . . . . . . . . . . . . . . . . . . . . . . . . . . . . . . . . . . . . 2.4 2.3Construction in progress . . . . . . . . . . . . . . . . . . . . . . . . . . . . . . . . . . 272.3 243.7
Property, plant and equipment, gross . . . . . . . . . . . . . . . . . . . . . 2,926.1 3,245.6Accumulated depreciation . . . . . . . . . . . . . . . . . . . . . . . . . . . . . . . . . (1,099.3) (1,567.0)
Property, plant & equipment, net, excluding tooling . . . . . . 1,826.8 1,678.6Tooling, net of amortization . . . . . . . . . . . . . . . . . . . . . . . . . . . . . . 112.6 109.4
Property, plant & equipment, net . . . . . . . . . . . . . . . . . . . . . . . . . . . $ 1,939.4 $ 1,788.0
Investments and advances:Investment in equity affiliates . . . . . . . . . . . . . . . . . . . . . . . . . . . . . . $ 201.5 $ 217.7Other investments and advances . . . . . . . . . . . . . . . . . . . . . . . . . . . 203.6 165.0
Total investments and advances . . . . . . . . . . . . . . . . . . . . . . . . . . $ 405.1 $ 382.7
Other non-current assets:Deferred income taxes . . . . . . . . . . . . . . . . . . . . . . . . . . . . . . . . . . . . $ 257.6 $ 244.1Other intangible assets . . . . . . . . . . . . . . . . . . . . . . . . . . . . . . . . . . . 169.5 206.3Product liability insurance asset . . . . . . . . . . . . . . . . . . . . . . . . . . . . 96.7 85.6Other . . . . . . . . . . . . . . . . . . . . . . . . . . . . . . . . . . . . . . . . . . . . . . . . . . 53.2 39.9
Total other non-current assets . . . . . . . . . . . . . . . . . . . . . . . . . . . $ 577.0 $ 575.9
66
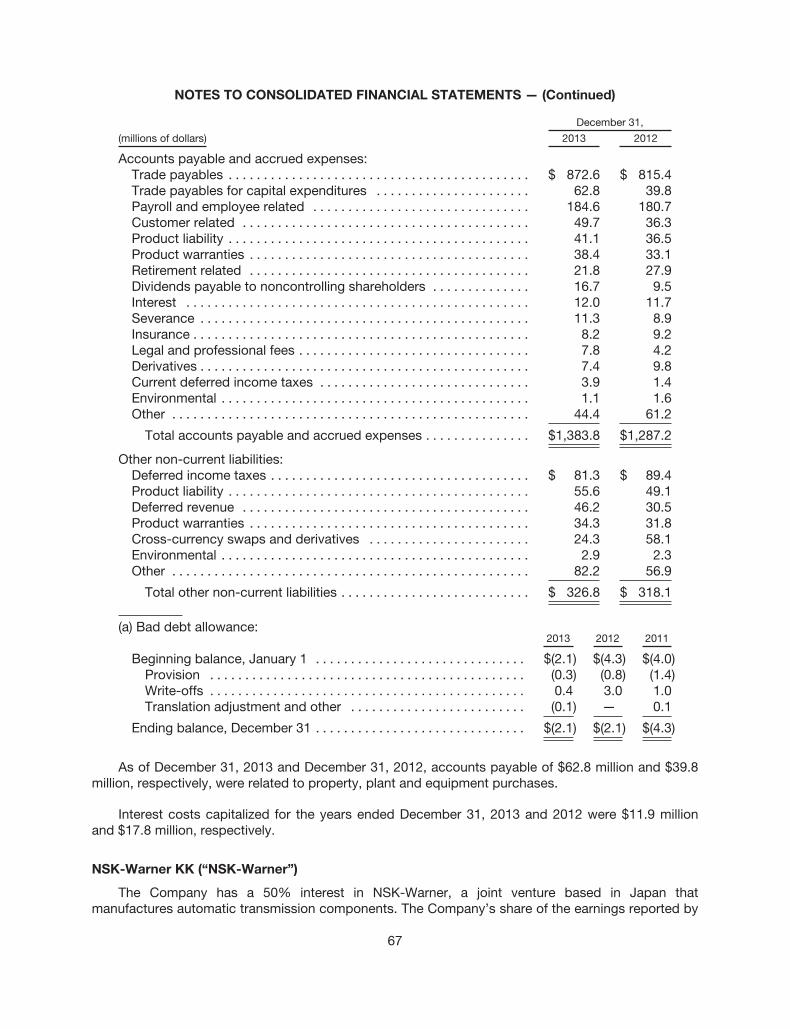
NOTES TO CONSOLIDATED FINANCIAL STATEMENTS — (Continued)
December 31,
(millions of dollars) 2013 2012
Accounts payable and accrued expenses:
Trade payables . . . . . . . . . . . . . . . . . . . . . . . . . . . . . . . . . . . . . . . . . . . $ 872.6 $ 815.4
Trade payables for capital expenditures . . . . . . . . . . . . . . . . . . . . . . 62.8 39.8
Payroll and employee related . . . . . . . . . . . . . . . . . . . . . . . . . . . . . . . 184.6 180.7
Customer related . . . . . . . . . . . . . . . . . . . . . . . . . . . . . . . . . . . . . . . . . 49.7 36.3
Product liability . . . . . . . . . . . . . . . . . . . . . . . . . . . . . . . . . . . . . . . . . . . 41.1 36.5
Product warranties . . . . . . . . . . . . . . . . . . . . . . . . . . . . . . . . . . . . . . . . 38.4 33.1
Retirement related . . . . . . . . . . . . . . . . . . . . . . . . . . . . . . . . . . . . . . . . 21.8 27.9
Dividends payable to noncontrolling shareholders . . . . . . . . . . . . . . 16.7 9.5
Interest . . . . . . . . . . . . . . . . . . . . . . . . . . . . . . . . . . . . . . . . . . . . . . . . . 12.0 11.7
Severance . . . . . . . . . . . . . . . . . . . . . . . . . . . . . . . . . . . . . . . . . . . . . . . 11.3 8.9
Insurance . . . . . . . . . . . . . . . . . . . . . . . . . . . . . . . . . . . . . . . . . . . . . . . . 8.2 9.2
Legal and professional fees . . . . . . . . . . . . . . . . . . . . . . . . . . . . . . . . . 7.8 4.2
Derivatives . . . . . . . . . . . . . . . . . . . . . . . . . . . . . . . . . . . . . . . . . . . . . . . 7.4 9.8
Current deferred income taxes . . . . . . . . . . . . . . . . . . . . . . . . . . . . . . 3.9 1.4
Environmental . . . . . . . . . . . . . . . . . . . . . . . . . . . . . . . . . . . . . . . . . . . . 1.1 1.6
Other . . . . . . . . . . . . . . . . . . . . . . . . . . . . . . . . . . . . . . . . . . . . . . . . . . . 44.4 61.2
Total accounts payable and accrued expenses . . . . . . . . . . . . . . . $1,383.8 $1,287.2
Other non-current liabilities:
Deferred income taxes . . . . . . . . . . . . . . . . . . . . . . . . . . . . . . . . . . . . . $ 81.3 $ 89.4
Product liability . . . . . . . . . . . . . . . . . . . . . . . . . . . . . . . . . . . . . . . . . . . 55.6 49.1
Deferred revenue . . . . . . . . . . . . . . . . . . . . . . . . . . . . . . . . . . . . . . . . . 46.2 30.5
Product warranties . . . . . . . . . . . . . . . . . . . . . . . . . . . . . . . . . . . . . . . . 34.3 31.8
Cross-currency swaps and derivatives . . . . . . . . . . . . . . . . . . . . . . . 24.3 58.1
Environmental . . . . . . . . . . . . . . . . . . . . . . . . . . . . . . . . . . . . . . . . . . . . 2.9 2.3
Other . . . . . . . . . . . . . . . . . . . . . . . . . . . . . . . . . . . . . . . . . . . . . . . . . . . 82.2 56.9
Total other non-current liabilities . . . . . . . . . . . . . . . . . . . . . . . . . . . $ 326.8 $ 318.1
(a) Bad debt allowance:2013 2012 2011
Beginning balance, January 1 . . . . . . . . . . . . . . . . . . . . . . . . . . . . . . $(2.1) $(4.3) $(4.0)
Provision . . . . . . . . . . . . . . . . . . . . . . . . . . . . . . . . . . . . . . . . . . . . . (0.3) (0.8) (1.4)
Write-offs . . . . . . . . . . . . . . . . . . . . . . . . . . . . . . . . . . . . . . . . . . . . . 0.4 3.0 1.0
Translation adjustment and other . . . . . . . . . . . . . . . . . . . . . . . . . (0.1) — 0.1
Ending balance, December 31 . . . . . . . . . . . . . . . . . . . . . . . . . . . . . . $(2.1) $(2.1) $(4.3)
As of December 31, 2013 and December 31, 2012, accounts payable of $62.8 million and $39.8
million, respectively, were related to property, plant and equipment purchases.
Interest costs capitalized for the years ended December 31, 2013 and 2012 were $11.9 million
and $17.8 million, respectively.
NSK-Warner KK (“NSK-Warner”)
The Company has a 50% interest in NSK-Warner, a joint venture based in Japan that
manufactures automatic transmission components. The Company’s share of the earnings reported by
67

NOTES TO CONSOLIDATED FINANCIAL STATEMENTS — (Continued)
NSK-Warner is accounted for using the equity method of accounting. NSK-Warner is the joint venture
partner with a 40% interest in the Drivetrain Group’s South Korean subsidiary, BorgWarner
Transmission Systems Korea Inc. Dividends from NSK-Warner were $31.0 million, $28.1 million and
$33.4 million in calendar years ended December 31, 2013, 2012 and 2011, respectively.
NSK-Warner has a fiscal year-end of March 31. The Company’s equity in the earnings of NSK-
Warner consists of the 12 months ended November 30. Following is summarized financial data for
NSK-Warner, translated using the ending or periodic rates, as of and for the years ended
November 30, 2013, 2012 and 2011 (unaudited):
November 30,
(millions of dollars) 2013 2012
Balance sheets:
Cash and securities . . . . . . . . . . . . . . . . . . . . . . . . . . . . . . . . . . . . . . . . . . . . . . . . . . . . $118.3 $123.3
Current assets, including cash and securities . . . . . . . . . . . . . . . . . . . . . . . . . . . . . . . 313.6 320.0
Non-current assets . . . . . . . . . . . . . . . . . . . . . . . . . . . . . . . . . . . . . . . . . . . . . . . . . . . . 156.1 175.3
Current liabilities . . . . . . . . . . . . . . . . . . . . . . . . . . . . . . . . . . . . . . . . . . . . . . . . . . . . . . 166.8 147.4
Non-current liabilities . . . . . . . . . . . . . . . . . . . . . . . . . . . . . . . . . . . . . . . . . . . . . . . . . . 40.7 50.2
Total equity . . . . . . . . . . . . . . . . . . . . . . . . . . . . . . . . . . . . . . . . . . . . . . . . . . . . . . . . . . . 262.2 297.7
Year Ended November 30,
(millions of dollars) 2013 2012 2011
Statements of operations:
Net sales . . . . . . . . . . . . . . . . . . . . . . . . . . . . . . . . . . . . . . . . . . . . . . . . . . . . . $604.0 $696.7 $655.2
Gross profit . . . . . . . . . . . . . . . . . . . . . . . . . . . . . . . . . . . . . . . . . . . . . . . . . . . 126.6 138.2 128.5
Net earnings . . . . . . . . . . . . . . . . . . . . . . . . . . . . . . . . . . . . . . . . . . . . . . . . . . 68.3 68.5 61.6
NSK-Warner had no debt outstanding as of November 30, 2013 and 2012. Purchases by the
Company from NSK-Warner were $22.8 million, $22.8 million and $16.6 million for the years ended
December 31, 2013, 2012 and 2011, respectively.
NOTE 6 GOODWILL AND OTHER INTANGIBLES
During the fourth quarter of each year, the Company qualitatively assesses its goodwill and
indefinite-lived intangible assets assigned to each of its reporting units. This qualitative assessment
evaluates various events and circumstances, such as macro economic conditions, industry and
market conditions, cost factors, relevant events and financial trends, that may impact a reporting
unit's fair value. Using this qualitative assessment, the Company determines whether it is more-likely-
than not the reporting unit’s fair value exceeds its carrying value. If it is determined that it is not more-
likely-than-not the reporting unit's fair value exceeds the carrying value, or upon a triggering event,
including recent acquisition or divestiture activity, the Company performs a quantitative, “step one,”
goodwill impairment analysis.
During the fourth quarter of 2013, the Company performed a qualitative analysis on each
reporting unit and determined it was more-likely-than-not the fair value exceeded the carrying value of
these reporting units. For the reporting unit with recent restructuring activity, the Company performed
a quantitative, “step one,” goodwill impairment analysis, which requires the Company to make
significant assumptions and estimates about the extent and timing of future cash flows, discount
rates and growth rates. The basis of this goodwill impairment analysis is the Company’s annual
budget and long-range plan (“LRP”). The annual budget and LRP includes a five year projection of
68

NOTES TO CONSOLIDATED FINANCIAL STATEMENTS — (Continued)
future cash flows based on actual new products and customer commitments and assumes the last
year of the LRP data is a fair indication of the future performance. Because the LRP is estimated over
a significant future period of time, those estimates and assumptions are subject to a high degree of
uncertainty. Further, the market valuation models and other financial ratios used by the Company
require certain assumptions and estimates regarding the applicability of those models to the
Company’s facts and circumstances.
The Company believes the assumptions and estimates used to determine its estimated fair value
are reasonable. Different assumptions could materially affect the estimated fair value. The primary
assumptions affecting the Company’s December 31, 2013 goodwill quantitative, “step one,”
impairment review are as follows:
• Discount rate: The Company used a 10% weighted average cost of capital (“WACC”) as the
discount rate for future cash flows. The WACC is intended to represent a rate of return that
would be expected by a market participant.
• Operating income margin: The Company used historical and expected operating income
margins, which may vary based on the projections of the reporting unit being evaluated.
In addition to the above primary assumptions, the Company notes the following risks to volume
and operating income assumptions that could have an impact on the discounted cash flow model:
• The automotive industry is cyclical and the Company's results of operations would be
adversely affected by industry downturns.
• The Company is dependent on market segments that use our key products and would be
affected by decreasing demand in those segments.
• The Company is subject to risks related to international operations.
Based on the assumptions outlined above, the impairment testing conducted in the fourth quarter
of 2013 indicated the Company's goodwill assigned to the reporting unit quantitatively assessed was
not impaired. Additionally, a sensitivity analysis was completed indicating a 1% increase in the
discount rate or a 1% decrease in the operating margin assumptions would not result in the carrying
value exceeding the fair value of the reporting unit quantitatively assessed.
The changes in the carrying amount of goodwill for the years ended December 31, 2013 and
2012 are as follows:
2013 2012
(millions of dollars) Engine Drivetrain Engine Drivetrain
Gross goodwill balance, January 1 . . . . . . . . . . $1,324.1 $359.3 $1,334.7 $353.5
Accumulated impairment losses, January 1 . . . (501.8) (0.2) (501.8) (0.2)
Net goodwill balance, January 1 . . . . . . . . $ 822.3 $359.1 $ 832.9 $353.3
Goodwill during the year:
Divestitures* . . . . . . . . . . . . . . . . . . . . . . . . . . . . . (4.6) — (16.9) —
Translation adjustment and other . . . . . . . . . . . 12.4 7.8 6.3 5.8
Ending balance, December 31 . . . . . . . . . . $ 830.1 $366.9 $ 822.3 $359.1
* Goodwill divested relates to the Company’s 2012 sale of the spark plug business.
69

NOTES TO CONSOLIDATED FINANCIAL STATEMENTS — (Continued)
The Company’s other intangible assets, primarily from acquisitions, consist of the following:
December 31, 2013 December 31, 2012
(millions of dollars)
Grosscarryingamount
Accumulatedamortization
Netcarryingamount
Grosscarryingamount
Accumulatedamortization
Netcarryingamount
Amortized intangible assets:Patented and unpatented
technology . . . . . . . . . . . . . . . . . . $ 85.9 $ 36.5 $ 49.4 $ 80.0 $ 26.2 $ 53.8Customer relationships . . . . . . . . . . 201.8 111.4 90.4 216.3 100.0 116.3Miscellaneous . . . . . . . . . . . . . . . . . . 2.9 2.9 — 2.9 2.9 —
Total amortized intangible assets . . . . . . 290.6 150.8 139.8 299.2 129.1 170.1In-process R&D . . . . . . . . . . . . . . . . 10.8 — 10.8 10.8 — 10.8Unamortized trade names . . . . . . . . 18.9 — 18.9 25.4 — 25.4
Total other intangible assets . . . . . . . . . . $320.3 $150.8 $169.5 $335.4 $129.1 $206.3
Amortization of other intangible assets was $26.7 million, $28.4 million and $30.8 million for theyears ended December 31, 2013, 2012 and 2011, respectively. The estimated useful lives of theCompany’s amortized intangible assets range from three to 15 years. The Company utilizes thestraight line method of amortization recognized over the estimated useful lives of the assets. Theestimated future annual amortization expense, primarily for acquired intangible assets, is as follows:$25.4 million in 2014, $16.4 million in 2015, $16.3 million in 2016, $14.9 million in 2017 and $13.3million in 2018.
A roll forward of the gross carrying amounts of the Company’s other intangible assets ispresented below:
(millions of dollars) 2013 2012
Beginning balance, January 1 . . . . . . . . . . . . . . . . . . . . . . . . . . . . . . . . . . . . $335.4 $341.7Impairment* . . . . . . . . . . . . . . . . . . . . . . . . . . . . . . . . . . . . . . . . . . . . . . . . . (26.4) —Divestitures** . . . . . . . . . . . . . . . . . . . . . . . . . . . . . . . . . . . . . . . . . . . . . . . . (1.1) (15.7)Translation adjustment . . . . . . . . . . . . . . . . . . . . . . . . . . . . . . . . . . . . . . . . 12.4 9.4
Ending balance, December 31 . . . . . . . . . . . . . . . . . . . . . . . . . . . . . . . . . . . $320.3 $335.4
* Impairment relates to Drivetrain customer relationships and Engine unamortized trade names.The impairment charges are recorded in restructuring expense in Other expense (income).
** Divestitures relate to the Company’s 2012 sale of the spark plug business.
A roll forward of the accumulated amortization associated with the Company’s other intangibleassets is presented below:
(millions of dollars) 2013 2012
Beginning balance, January 1 . . . . . . . . . . . . . . . . . . . . . . . . . . . . . . . . . . . . $129.1 $ 98.4Amortization . . . . . . . . . . . . . . . . . . . . . . . . . . . . . . . . . . . . . . . . . . . . . . . . 26.7 28.4Impairment* . . . . . . . . . . . . . . . . . . . . . . . . . . . . . . . . . . . . . . . . . . . . . . . . . (13.9) —Divestitures** . . . . . . . . . . . . . . . . . . . . . . . . . . . . . . . . . . . . . . . . . . . . . . . . (0.4) (0.6)Translation adjustment . . . . . . . . . . . . . . . . . . . . . . . . . . . . . . . . . . . . . . . . 9.3 2.9
Ending balance, December 31 . . . . . . . . . . . . . . . . . . . . . . . . . . . . . . . . . . . $150.8 $129.1
* Impairment relates to Drivetrain customer relationships and Engine unamortized trade names.The impairment charges are recorded in restructuring expense in Other expense (income).
** Divestitures relate to the Company’s 2012 sale of the spark plug business.
70

NOTES TO CONSOLIDATED FINANCIAL STATEMENTS — (Continued)
NOTE 7 PRODUCT WARRANTY
The changes in the carrying amount of the Company’s total product warranty liability for the years
ended December 31, 2013 and 2012 were as follows:
(millions of dollars) 2013 2012
Beginning balance, January 1 . . . . . . . . . . . . . . . . . . . . . . . . . . . . . . . . . . . . . $ 64.9 $ 72.7
Provisions . . . . . . . . . . . . . . . . . . . . . . . . . . . . . . . . . . . . . . . . . . . . . . . . . 43.1 33.7
Payments . . . . . . . . . . . . . . . . . . . . . . . . . . . . . . . . . . . . . . . . . . . . . . . . . . (36.7) (42.8)
Translation adjustment . . . . . . . . . . . . . . . . . . . . . . . . . . . . . . . . . . . . . . . 1.4 1.3
Ending balance, December 31 . . . . . . . . . . . . . . . . . . . . . . . . . . . . . . . . . . . . $ 72.7 $ 64.9
The product warranty liability is classified in the Consolidated Balance Sheets as follows:
December 31,
(millions of dollars) 2013 2012
Accounts payable and accrued expenses . . . . . . . . . . . . . . . . . . . . . . . . . . . . $38.4 $33.1
Other non-current liabilities . . . . . . . . . . . . . . . . . . . . . . . . . . . . . . . . . . . . . . . . 34.3 31.8
Total product warranty liability . . . . . . . . . . . . . . . . . . . . . . . . . . . . . . . . . . $72.7 $64.9
NOTE 8 NOTES PAYABLE AND LONG-TERM DEBT
As of December 31, 2013 and 2012, the Company had short-term and long-term debt
outstanding as follows:
December 31,
(millions of dollars) 2013 2012
Short-term debt
Short-term borrowings . . . . . . . . . . . . . . . . . . . . . . . . . . . . . . . . . . . . . . . . $ 84.8 $129.1
Receivables securitization . . . . . . . . . . . . . . . . . . . . . . . . . . . . . . . . . . . . . 110.0 110.0
Total short-term debt . . . . . . . . . . . . . . . . . . . . . . . . . . . . . . . . . . . . . . . $ 194.8 $239.1
Long-term debt
5.75% Senior notes due 11/01/16 ($150 million par value) . . . . . . . . . . . $ 149.7 $149.6
8.00% Senior notes due 10/01/19 ($134 million par value) . . . . . . . . . . . 133.9 133.9
4.625% Senior notes due 09/15/20 ($250 million par value) . . . . . . . . . . 248.2 247.9
7.125% Senior notes due 02/15/29 ($121 million par value) . . . . . . . . . . 119.4 119.4
Multi-currency revolving credit facility . . . . . . . . . . . . . . . . . . . . . . . . . . . . 320.0 140.0
Term loan facilities and other . . . . . . . . . . . . . . . . . . . . . . . . . . . . . . . . . . . 40.4 17.1
Unamortized portion of debt derivatives . . . . . . . . . . . . . . . . . . . . . . . . . . 16.2 20.2
Total long-term debt . . . . . . . . . . . . . . . . . . . . . . . . . . . . . . . . . . . . . . . . $1,027.8 $828.1
Less: current portion . . . . . . . . . . . . . . . . . . . . . . . . . . . . . . . . . . . . . . . . . . 6.8 4.3
Long-term debt, net of current portion . . . . . . . . . . . . . . . . . . . . . . . . . $1,021.0 $823.8
The weighted average interest rate on all borrowings outstanding as of December 31, 2013 and
2012 was 3.7% and 4.0%, respectively.
71

NOTES TO CONSOLIDATED FINANCIAL STATEMENTS — (Continued)
Annual principal payments required as of December 31, 2013 are as follows:
(millions of dollars)
2014 . . . . . . . . . . . . . . . . . . . . . . . . . . . . . . . . . . . . . . . . . . . . . . . . . . . . . . . . . . . . . . . . $ 201.6
2015 . . . . . . . . . . . . . . . . . . . . . . . . . . . . . . . . . . . . . . . . . . . . . . . . . . . . . . . . . . . . . . . . 25.1
2016 . . . . . . . . . . . . . . . . . . . . . . . . . . . . . . . . . . . . . . . . . . . . . . . . . . . . . . . . . . . . . . . . 478.5
2017 . . . . . . . . . . . . . . . . . . . . . . . . . . . . . . . . . . . . . . . . . . . . . . . . . . . . . . . . . . . . . . . . —
2018 . . . . . . . . . . . . . . . . . . . . . . . . . . . . . . . . . . . . . . . . . . . . . . . . . . . . . . . . . . . . . . . . —
After 2018 . . . . . . . . . . . . . . . . . . . . . . . . . . . . . . . . . . . . . . . . . . . . . . . . . . . . . . . . . . . 520.9
Total payments . . . . . . . . . . . . . . . . . . . . . . . . . . . . . . . . . . . . . . . . . . . . . . . . . . . . . $1,226.1
Less: unamortized discounts . . . . . . . . . . . . . . . . . . . . . . . . . . . . . . . . . . . . . . . . . . . . 3.5
Total . . . . . . . . . . . . . . . . . . . . . . . . . . . . . . . . . . . . . . . . . . . . . . . . . . . . . . . . . . . . . . $1,222.6
The Company’s long-term debt includes various financial covenants, none of which are expected
to restrict future operations.
The Company’s multi-currency revolving credit facility includes a feature that allows the
Company’s borrowings to be increased to $1 billion. Utilizing this feature, on April 12, 2013, the
Company increased its multi-currency revolving credit facility from $650 million to $750 million. The
credit facility provides for borrowings through June 30, 2016 and is guaranteed by the Company’s
material domestic subsidiaries. The Company has two key financial covenants, a debt compared to
EBITDA (“Earnings Before Interest, Taxes, Depreciation and Amortization”) test and an interest
coverage test. The Company was in compliance with all covenants at December 31, 2013 and
expects to remain compliant in future periods. At December 31, 2013 and 2012, the Company had
outstanding borrowings of $320.0 million and $140.0 million, respectively, under this facility.
On April 9, 2009, the Company issued $373.8 million in convertible senior notes, which were
settled in April 2012 by delivering approximately 22.8 million shares of common stock held in treasury
to the note holders. The settlement resulted in a reduction in the current portion of long-term debt of
$373.8 million, a reduction in common stock held in treasury of $617.3 million and a reduction in
capital in excess of par value of $243.5 million. Prior to the settlement, the Company accreted the
discounted carrying value of the convertible notes to their face value over the term of the notes.
The total interest expense related to the convertible senior notes in the Company’s Consolidated
Statements of Operations for the years ended December 31, 2013, 2012 and 2011 was as follows:
Year EndedDecember 31,
(millions of dollars) 2013 2012 2011
Interest expense . . . . . . . . . . . . . . . . . . . . . . . . . . . . . . . . . . . . . . . . . . . . . $— $9.0 33.1
Non-cash portion . . . . . . . . . . . . . . . . . . . . . . . . . . . . . . . . . . . . . . . . . . . . — 5.3 20.0
In conjunction with the convertible senior note offering, the Company entered into a bond hedge
overlay, including both call options and warrants, at a net pre-tax cost of $25.2 million, effectively
raising the conversion premium to 50%, or approximately $19.31 per share. On April 16, 2012, the
Company settled the call option portion of the bond hedge overlay, receiving approximately
13.0 million shares of its common stock. The settlement resulted in an increase to common stock held
in treasury of $503.9 million offset by an increase to capital in excess of par value of $503.9 million.
72

NOTES TO CONSOLIDATED FINANCIAL STATEMENTS — (Continued)
During the third and fourth quarters of 2012, the Company settled the warrants included in the
bond hedge overlay, delivering approximately 9.8 million shares of its common stock held in treasury,
resulting in a decrease to common stock held in treasury of $338.5 million offset by a decrease to
capital in excess of par value of $338.5 million.
As of December 31, 2013 and 2012, the estimated fair values of the Company’s senior unsecured
notes totaled $729.7 million and $770.3 million, respectively. The estimated fair values were
$78.5 million and $119.5 million higher than their carrying value at December 31, 2013 and 2012,
respectively. Fair market values of the senior unsecured notes are developed using observable values
for similar debt instruments, which are considered Level 2 inputs as defined by ASC Topic 820. The
carrying value of the Company’s multi-currency revolving credit facility is equal to its fair value. The
fair value estimates do not necessarily reflect the values the Company could realize in the current
markets.
The Company had outstanding letters of credit of $27.8 million and $59.1 million at December 31,
2013 and 2012, respectively. The letters of credit typically act as guarantees of payment to certain
third parties in accordance with specified terms and conditions.
NOTE 9 FAIR VALUE MEASUREMENTS
ASC Topic 820 emphasizes that fair value is a market-based measurement, not an entity specific
measurement. Therefore, a fair value measurement should be determined based on assumptions that
market participants would use in pricing an asset or liability. As a basis for considering market
participant assumptions in fair value measurements, ASC Topic 820 establishes a fair value hierarchy,
which prioritizes the inputs used in measuring fair values as follows:
Level 1: Observable inputs such as quoted prices for identical assets or liabilities in active
markets;
Level 2: Inputs, other than quoted prices in active markets, that are observable either
directly or indirectly; and
Level 3: Unobservable inputs in which there is little or no market data, which require the
reporting entity to develop its own assumptions.
Assets and liabilities measured at fair value are based on one or more of the following three
valuation techniques noted in ASC Topic 820:
A. Market approach: Prices and other relevant information generated by market
transactions involving identical or comparable assets, liabilities or a group of assets or
liabilities, such as a business.
B. Cost approach: Amount that would be required to replace the service capacity of an
asset (replacement cost).
C. Income approach: Techniques to convert future amounts to a single present amount
based upon market expectations (including present value techniques, option-pricing and
excess earnings models).
73

NOTES TO CONSOLIDATED FINANCIAL STATEMENTS — (Continued)
The following tables classify assets and liabilities measured at fair value on a recurring basis as of
December 31, 2013 and 2012:
Basis of fair value measurements
(millions of dollars)
Balance atDecember 31,
2013
Quotedprices in
activemarkets for
identicalitems
(Level 1)
Significantother
observableinputs
(Level 2)
Significantunobservable
inputs(Level 3)
Valuationtechnique
Assets:
Foreign currency contracts . . . . . . . . . . . . . $ 3.4 $— $ 3.4 $— A
Other non-current assets (insurance
settlement agreement note
receivable) . . . . . . . . . . . . . . . . . . . . . . . . . $35.6 $— $35.6 $— C
Liabilities:
Foreign currency contracts . . . . . . . . . . . . . $ 7.4 $— $ 7.4 $— A
Net investment hedge contracts . . . . . . . . . $24.3 $— $24.3 $— A
Basis of fair value measurements
(millions of dollars)
Balance atDecember 31,
2012
Quotedprices in
activemarkets for
identicalitems
(Level 1)
Significantother
observableinputs
(Level 2)
Significantunobservable
inputs(Level 3)
Valuationtechnique
Assets:
Foreign currency contracts . . . . . . . . . . . . . $ 5.9 $— $ 5.9 $— A
Other non-current assets (insurance
settlement agreement note
receivable) . . . . . . . . . . . . . . . . . . . . . . . . . $41.0 $— $41.0 $— C
Liabilities:
Foreign currency contracts . . . . . . . . . . . . . $ 9.8 $— $ 9.8 $— A
Net investment hedge contracts . . . . . . . . . $58.1 $— $58.1 $— A
74

NOTES TO CONSOLIDATED FINANCIAL STATEMENTS — (Continued)
The following tables classify the Company’s defined benefit plan assets measured at fair value on
a recurring basis as of December 31, 2013 and 2012:
Basis of fair value measurements
(millions of dollars)
Balance atDecember 31,
2013
Quotedprices in
activemarkets for
identicalitems
(Level 1)
Significantother
observableinputs
(Level 2)
Significantunobservable
inputs(Level 3)
Valuationtechnique
U.S. Plans:
Fixed income securities . . . . $147.2 $ — $147.2 $— A
Equity securities . . . . . . . . . . 100.9 50.5 50.4 — A
Real estate and other . . . . . 26.0 — 26.0 — A
$274.1 $50.5 $223.6 $—
Non-U.S. Plans:
Fixed income securities . . . . $143.7 $ — $143.7 $— A
Equity securities . . . . . . . . . . 188.2 70.5 117.7 — A
Real estate and other . . . . . 13.1 — 13.1 — A
$345.0 $70.5 $274.5 $—
Basis of fair value measurements
(millions of dollars)
Balance atDecember 31,
2012
Quotedprices in
activemarkets for
identicalitems
(Level 1)
Significantother
observableinputs
(Level 2)
Significantunobservable
inputs(Level 3)
Valuationtechnique
U.S. Plans:
Fixed income securities . . . . $157.4 $ — $157.4 $— A
Equity securities . . . . . . . . . . 100.0 48.9 51.1 — A
Real estate and other . . . . . 25.3 — 25.3 — A
$282.7 $48.9 $233.8 $—
Non-U.S. Plans:
Fixed income securities . . . . $ 67.3 $ — $ 67.3 $— A
Equity securities . . . . . . . . . . 99.0 — 99.0 — A
Real estate and other . . . . . 11.6 — 11.6 — A
$177.9 $ — $177.9 $—
Refer to Note 11 to the Consolidated Financial Statements for more detail surrounding the
defined plan’s asset investment policies and strategies, target allocation percentages and expected
return on plan asset assumptions.
NOTE 10 FINANCIAL INSTRUMENTS
The Company’s financial instruments include cash and marketable securities. Due to the short-
term nature of these instruments, their book value approximates their fair value. The Company’s
financial instruments also include long-term debt, interest rate and cross-currency swaps, commodity
derivative contracts and foreign currency derivatives. All derivative contracts are placed with
counterparties that have an S&P, or equivalent, investment grade credit rating at the time of the
75

NOTES TO CONSOLIDATED FINANCIAL STATEMENTS — (Continued)
contracts’ placement. At December 31, 2013 and 2012, the Company had no derivative contracts that
contained credit risk related contingent features.
The Company selectively uses cross-currency swaps to hedge the foreign currency exposure
associated with our net investment in certain foreign operations (net investment hedges). At
December 31, 2013 and 2012, the following cross-currency swaps were outstanding:
Cross-currency swaps
(millions of dollars)Notionalin USD
Notional inlocal
currency Duration
Floating $ to Floating € . . . . . . . . . . . . . . . . . . . . . . . . . . . . . $ 75.0 € 58.5 Oct - 19
Floating $ to Floating ¥ . . . . . . . . . . . . . . . . . . . . . . . . . . . . . $150.0 ¥17,581.5 Nov - 16
The Company uses certain commodity derivative contracts to protect against commodity price
changes related to forecasted raw material and supplies purchases. The Company primarily utilizes
forward and option contracts, which are designated as cash flow hedges. The Company did not have
any commodity derivative contracts outstanding at December 31, 2013 and 2012.
The Company uses foreign currency forward and option contracts to protect against exchange
rate movements for forecasted cash flows, including capital expenditures, purchases, operating
expenses or sales transactions designated in currencies other than the functional currency of the
operating unit. Foreign currency derivative contracts require the Company, at a future date, to either
buy or sell foreign currency in exchange for the operating units’ local currency.
At December 31, 2013 and 2012, the following foreign currency derivative contracts were
outstanding:
Foreign currency derivatives (in millions)
Functionalcurrency
Tradedcurrency
Notional intraded currency
December 31, 2013
Notional intraded currency
December 31, 2012 Duration
Brazilian real . . . . . . . US dollar 19.3 — Dec - 14British pound . . . . . . . Euro — 28.8 Dec - 13Chinese yuan . . . . . . . Japanese yen 215.0 — Feb - 14Chinese yuan . . . . . . . US dollar 12.3 — Dec - 14Euro . . . . . . . . . . . . . . British pound 3.0 4.7 Dec - 14Euro . . . . . . . . . . . . . . Hungarian forint 6,430.5 9,300.0 Dec - 14Euro . . . . . . . . . . . . . . Japanese yen 5,830.7 6,760.0 Dec - 14Euro . . . . . . . . . . . . . . Korean won 663.1 — Jul - 14Euro . . . . . . . . . . . . . . Polish zloty 96.0 87.4 Dec - 14Euro . . . . . . . . . . . . . . US dollar 29.4 15.2 Dec - 14Hungarian forint . . . . Euro 6.6 — Dec - 14Japanese yen . . . . . . Chinese yuan 84.0 — Dec - 14Japanese yen . . . . . . Korean Won 5,715.5 — Dec - 14Japanese yen . . . . . . US dollar 4.2 9.5 Dec - 14Korean won . . . . . . . . Euro 23.6 32.4 Dec - 14Korean won . . . . . . . . Japanese yen 380.5 — Aug - 14Korean won . . . . . . . . US dollar — 17.5 Dec - 13Mexican peso . . . . . . US dollar — 20.9 Dec - 13Swedish krona . . . . . Euro 33.7 — Dec - 14US dollar . . . . . . . . . . Indian rupee — 111.1 Oct - 13US dollar . . . . . . . . . . Japanese yen 3,209.3 3,000.0 Sept - 14
76

NOTES TO CONSOLIDATED FINANCIAL STATEMENTS — (Continued)
At December 31, 2013 and 2012, the following amounts were recorded in the Consolidated
Balance Sheets as being payable to or receivable from counterparties under ASC Topic 815:
Assets Liabilities
(millions of dollars) LocationDecember 31,
2013December 31,
2012 LocationDecember 31,
2013December 31,
2012
Foreign currency . . . . . . Prepayments andother current assets $3.4 $5.7
Accounts payable andaccrued expenses $7.4 $9.8
Other non-currentassets $— $0.2
Other non-currentliabilities $— $—
Net investmenthedges . . . . . . . . . . . .
Other non-currentassets $— $—
Other non-currentliabilities $24.3 $58.1
Effectiveness for cash flow and net investment hedges is assessed at the inception of the
hedging relationship and quarterly, thereafter. To the extent that derivative instruments are deemed to
be effective, gains and losses arising from these contracts are deferred into accumulated other
comprehensive income (loss) (“AOCI”) and reclassified into income as the underlying operating
transactions are recognized. These realized gains or losses offset the hedged transaction and are
recorded on the same line in the statement of operations. To the extent that derivative instruments are
deemed to be ineffective, gains or losses are recognized into income.
The table below shows deferred gains (losses) reported in AOCI as well as the amount expected
to be reclassified to income in one year or less. The amount expected to be reclassified to income in
one year or less assumes no change in the current relationship of the hedged item at December 31,
2013 market rates.
Deferred gain (loss) in AOCI atGain (loss) expected to
be reclassified to incomein one year or less(millions of dollars) December 31, 2013 December 31, 2012
Foreign currency . . . . . . . . . . . . $ (3.7) $ (3.5) $(3.7)
Net investment hedges . . . . . . . (22.1) (54.5) —
Total . . . . . . . . . . . . . . . . . . $(25.8) $(58.0) $(3.7)
Derivative instruments designated as hedging instruments as defined by ASC Topic 815 held
during the period resulted in the following gains and losses recorded in income:
Gain (loss) reclassifiedfrom AOCI to income
(effective portion)
Gain (loss)recognized in income(ineffective portion)
Year Ended December 31, Year Ended December 31,
(millions of dollars) Location 2013 2012 Location 2013 2012
Foreign currency . . . . . . . . Sales $ 1.7 $5.3 SG&A expense $ 0.2 $ —
Foreign currency . . . . . . . . Cost of goods sold $(13.9) $3.5 SG&A expense $(1.5) $0.1
Foreign currency . . . . . . . . SG&A expense $ (0.4) $ — SG&A expense $ — $ —
Net investment hedges . . N/A Interest expense $ 1.3 $2.3
At December 31, 2013, derivative instruments that were not designated as hedging instruments
as defined by ASC Topic 815 were immaterial.
NOTE 11 RETIREMENT BENEFIT PLANS
The Company sponsors various defined contribution savings plans, primarily in the U.S., that
allow employees to contribute a portion of their pre-tax and/or after-tax income in accordance with
77

NOTES TO CONSOLIDATED FINANCIAL STATEMENTS — (Continued)
plan specified guidelines. Under specified conditions, the Company will make contributions to the
plans and/or match a percentage of the employee contributions up to certain limits. Total expense
related to the defined contribution plans was $24.9 million, $24.8 million and $18.9 million in the years
ended December 31, 2013, 2012 and 2011, respectively.
The Company has a number of defined benefit pension plans and other postretirement employee
benefit plans covering eligible salaried and hourly employees and their dependents. The defined
pension benefits provided are primarily based on (i) years of service and (ii) average compensation or
a monthly retirement benefit amount. The Company provides defined benefit pension plans in France,
Germany, Ireland, Italy, Japan, Mexico, Monaco, South Korea, Sweden, U.K. and the U.S. The other
postretirement employee benefit plans, which provide medical and life insurance benefits, are
unfunded plans. All pension and other postretirement employee benefit plans in the U.S. have been
closed to new employees since 1999. The measurement date for all plans is December 31.
On February 26, 2009, the Company’s subsidiary BorgWarner Diversified Transmission Products
Inc. (“DTP”), entered into a Plant Shutdown Agreement with the United Auto Workers (“UAW”) for its
Muncie, Indiana automotive component plant (the “Muncie Plant”). Management subsequently
wound-down production activity at the plant, with operations effectively ceased as of March 31, 2009.
The Plant Shutdown Agreement included terms allowing for lump sum payment of the pension
obligation for certain participants if funding of the plan exceeded a defined level. In accordance with
these terms, in December 2012, the Company settled a portion of the pension obligation resulting in a
non-cash loss of $5.7 million, which was recorded in other expense (income) within the Consolidated
Statement of Operations.
On March 24, 2010, the Company finalized its settlement agreement regarding the closure of the
Muncie Plant with the Pension Benefit Guaranty Corporation (“PBGC”) in which the Company agreed
to make certain payments directly to the Muncie Plant’s defined benefit pension plan (the “Plan”). In
accordance with the settlement agreement, the Company made an initial cash contribution of $23
million for the 2009 Plan year and a cash contribution of $15 million in the year ended December 31,
2011. During the fourth quarter of 2012, the Company received notification from the PBGC that the
terms of the settlement have been suspended pending review of the Company’s financial strength
under the PBGC’s revised enforcement policy pilot program announced on November 2, 2012. The
evaluation was confirmed in January 2013 and as a result the Company currently does not have any
obligations as described in the original agreement.
The following table summarizes the expenses for the Company’s defined contribution and
defined benefit pension plans and the other postretirement defined employee benefit plans.
Year Ended December 31,
(millions of dollars) 2013 2012 2011
Defined contribution expense . . . . . . . . . . . . . . . . . . . . . . . . . . . . . . . $24.9 $24.8 $18.9
Defined benefit pension expense . . . . . . . . . . . . . . . . . . . . . . . . . . . . 24.3 27.3 17.5
Other postretirement employee benefit expense . . . . . . . . . . . . . . . 5.7 11.1 13.5
Total . . . . . . . . . . . . . . . . . . . . . . . . . . . . . . . . . . . . . . . . . . . . . . . . . $54.9 $63.2 $49.9
78

NOTES TO CONSOLIDATED FINANCIAL STATEMENTS — (Continued)
The following provides a roll forward of the plans’ benefit obligations, plan assets, funded status
and recognition in the Consolidated Balance Sheets.
Pension benefitsOther postretirementemployee benefitsYear Ended December 31,
2013 2012 Year Ended December 31,
(millions of dollars) US Non-US US Non-US 2013 2012
Change in projected benefit obligation:Projected benefit obligation, January 1 . . . $330.1 $ 447.6 $337.4 $ 344.3 $ 220.5 $ 251.0Service cost . . . . . . . . . . . . . . . . . . . . . . . . . — 12.4 — 9.1 0.4 0.5Interest cost . . . . . . . . . . . . . . . . . . . . . . . . . 11.6 16.6 14.3 17.2 6.8 10.1Plan participants’ contributions . . . . . . . . . — 0.4 — 0.5 — —Plan amendments . . . . . . . . . . . . . . . . . . . . — 0.6 — — — (0.3)Actuarial (gain) loss . . . . . . . . . . . . . . . . . . . (18.7) 11.8 15.5 84.1 (29.7) (20.7)Currency translation . . . . . . . . . . . . . . . . . . — 10.6 — 11.3 — —Other . . . . . . . . . . . . . . . . . . . . . . . . . . . . . . . — (2.7) — (4.5) — —Benefits paid . . . . . . . . . . . . . . . . . . . . . . . . (29.4) (14.6) (37.1) (14.4) (20.5) (20.1)
Projected benefit obligation,December 31 . . . . . . . . . . . . . . . . . . . . . . $293.6 $ 482.7 $330.1 $ 447.6 $ 177.5 $ 220.5
Change in plan assets:Fair value of plan assets, January 1 . . . . . . $282.7 $ 177.9 $290.4 $ 154.9Actual return on plan assets . . . . . . . . . . . . 20.8 23.6 29.4 15.0Employer contribution . . . . . . . . . . . . . . . . . — 150.4 — 18.0Plan participants’ contribution . . . . . . . . . . — 0.4 — 0.5Currency translation . . . . . . . . . . . . . . . . . . — 7.7 — 6.0Other . . . . . . . . . . . . . . . . . . . . . . . . . . . . . . . — (0.4) — (2.1)Benefits paid . . . . . . . . . . . . . . . . . . . . . . . . (29.4) (14.6) (37.1) (14.4)
Fair value of plan assets, December 31 . . $274.1 $ 345.0 $282.7 $ 177.9
Funded status . . . . . . . . . . . . . . . . . . . . . . $ (19.5) $(137.7) $ (47.4) $(269.7) $(177.5) $(220.5)
Amounts in the Consolidated BalanceSheets consist of:
Current liabilities . . . . . . . . . . . . . . . . . . . . . $ (0.1) $ (2.6) $ (0.1) $ (7.0) $ (19.1) $ (20.8)Non-current liabilities . . . . . . . . . . . . . . . . . (19.4) (135.1) (47.3) (262.7) (158.4) (199.7)
Net amount . . . . . . . . . . . . . . . . . . . . . . . . . $ (19.5) $(137.7) $ (47.4) $(269.7) $(177.5) $(220.5)
Amounts in accumulated othercomprehensive loss consist of:
Net actuarial loss . . . . . . . . . . . . . . . . . . . . . $115.0 $ 130.6 $163.8 $ 135.1 $ 44.0 $ 78.7Net prior service cost (credit) . . . . . . . . . . . 9.7 1.1 (10.5) 0.5 (36.1) (42.6)
Net amount* . . . . . . . . . . . . . . . . . . . . . . . . . $124.7 $ 131.7 $153.3 $ 135.6 $ 7.9 $ 36.1
Total accumulated benefit obligationfor all plans . . . . . . . . . . . . . . . . . . . . . . . $293.6 $ 464.8 $330.1 $ 430.2
* AOCI shown above does not include our equity investee, NSK-Warner. NSK-Warner had an AOCIloss of $4.9 million and $7.9 million at December 31, 2013 and 2012, respectively.
79

NOTES TO CONSOLIDATED FINANCIAL STATEMENTS — (Continued)
The funded status of pension plans with accumulated benefit obligations in excess of plan assets
at December 31 is as follows:
December 31,
(millions of dollars) 2013 2012
Accumulated benefit obligation . . . . . . . . . . . . . . . . . . . . . . . . . . . . . . . . . . $(752.0) $(757.7)
Plan assets . . . . . . . . . . . . . . . . . . . . . . . . . . . . . . . . . . . . . . . . . . . . . . . . . . 612.7 458.0
Deficiency . . . . . . . . . . . . . . . . . . . . . . . . . . . . . . . . . . . . . . . . . . . . . . . $(139.3) $(299.7)
Pension deficiency by country:
United States . . . . . . . . . . . . . . . . . . . . . . . . . . . . . . . . . . . . . . . . . . . . . . $ (19.5) $ (47.4)
United Kingdom . . . . . . . . . . . . . . . . . . . . . . . . . . . . . . . . . . . . . . . . . . . . (15.3) (22.4)
Germany . . . . . . . . . . . . . . . . . . . . . . . . . . . . . . . . . . . . . . . . . . . . . . . . . . (68.6) (192.4)
Other . . . . . . . . . . . . . . . . . . . . . . . . . . . . . . . . . . . . . . . . . . . . . . . . . . . . . (35.9) (37.5)
Total pension deficiency . . . . . . . . . . . . . . . . . . . . . . . . . . . . . . . . . . . . $(139.3) $(299.7)
The weighted average asset allocations of the Company’s funded pension plans and target
allocations by asset category are as follows:
December 31,Target
Allocation2013 2012
U.S. Plans:
Real estate and other . . . . . . . . . . . . . . . . . . . . . . . . . . . . . . . 9% 9% 5%-15%
Fixed income securities . . . . . . . . . . . . . . . . . . . . . . . . . . . . . 54% 56% 45%-65%
Equity securities . . . . . . . . . . . . . . . . . . . . . . . . . . . . . . . . . . . 37% 35% 25%-45%
100% 100%
Non-U.S. Plans:
Real estate and other . . . . . . . . . . . . . . . . . . . . . . . . . . . . . . . 4% 6% 0% - 7%
Fixed income securities . . . . . . . . . . . . . . . . . . . . . . . . . . . . . 42% 38% 37% -47%
Equity securities . . . . . . . . . . . . . . . . . . . . . . . . . . . . . . . . . . . 54% 56% 51% -61%
100% 100%
The Company’s investment strategy is to maintain actual asset weightings within a preset range
of target allocations. The Company believes these ranges represent an appropriate risk profile for the
planned benefit payments of the plans based on the timing of the estimated benefit payments. In each
asset category, separate portfolios are maintained for additional diversification. Investment managers
are retained in each asset category to manage each portfolio against its benchmark. Each investment
manager has appropriate investment guidelines. In addition, the entire portfolio is evaluated against a
relevant peer group. The defined benefit pension plans did not hold any Company securities as
investments as of December 31, 2013 and 2012. A portion of pension assets is invested in common
and comingled trusts.
In December 2013, the Company made a discretionary contribution of $137.5 million to its
German pension plans. The Company expects to contribute a total of $15 million to $25 million into its
defined benefit pension plans during 2014. Of the $15 million to $25 million in projected 2014
contributions, $2.8 million are contractually obligated, while any remaining payments would be
discretionary.
80

NOTES TO CONSOLIDATED FINANCIAL STATEMENTS — (Continued)
Refer to Note 9, “Fair Value Measurements,” for more detail surrounding the fair value of each
major category of plan assets as well as the inputs and valuation techniques used to develop the fair
value measurements of the plans' assets at December 31, 2013 and 2012.
See the table below for a breakout of net periodic benefit cost between U.S. and non-U.S.
pension plans:
Pension benefitsOther postretirementemployee benefitsYear Ended December 31,
2013 2012 2011 Year Ended December 31,
(millions of dollars) US Non-US US Non-US US Non-US 2013 2012 2011
Service cost . . . . . . . . . . . . . $ — $ 12.4 $ — $ 9.1 $ — $ 9.1 $ 0.4 $ 0.5 $ 0.7
Interest cost . . . . . . . . . . . . 11.6 16.6 14.3 17.2 16.1 17.8 6.8 10.1 11.8
Expected return on plan
assets . . . . . . . . . . . . . . . . (18.2) (11.0) (18.8) (9.3) (20.8) (11.2) — — —
Settlements, curtailments
and other . . . . . . . . . . . . . — 0.2 5.7 0.5 — (0.1) — — —
Amortization of
unrecognized prior
service benefit . . . . . . . . . (0.8) — (0.7) — (0.7) — (6.4) (6.4) (6.9)
Amortization of
unrecognized loss . . . . . . 8.2 5.3 8.1 1.2 6.5 0.8 4.9 6.9 7.9
Net periodic benefit cost . . $ 0.8 $ 23.5 $ 8.6 $18.7 $ 1.1 $ 16.4 $ 5.7 $11.1 $13.5
The estimated net loss for the defined benefit pension plans that will be amortized from
accumulated other comprehensive income (loss) into net periodic benefit cost over the next fiscal year
is $11.3 million. The estimated net loss and prior service credit for the other postretirement plans that
will be amortized from accumulated other comprehensive income (loss) into net periodic benefit cost
over the next fiscal year are $2.7 million and $(6.4) million, respectively.
The Company’s weighted-average assumptions used to determine the benefit obligations for its
defined benefit pension and other postretirement employee benefit plans as of December 31, 2013
and 2012 were as follows:
December 31,
(percent) 2013 2012
U.S. pension plans:
Discount rate . . . . . . . . . . . . . . . . . . . . . . . . . . . . . . . . . . . . . . . . . . . . . . . . . 4.41 3.67
Rate of compensation increase . . . . . . . . . . . . . . . . . . . . . . . . . . . . . . . . . . . N/A N/A
U.S. other postretirement employee benefit plans:
Discount rate . . . . . . . . . . . . . . . . . . . . . . . . . . . . . . . . . . . . . . . . . . . . . . . . . 4.00 3.25
Rate of compensation increase . . . . . . . . . . . . . . . . . . . . . . . . . . . . . . . . . . . N/A N/A
Non-U.S. pension plans:
Discount rate . . . . . . . . . . . . . . . . . . . . . . . . . . . . . . . . . . . . . . . . . . . . . . . . . 3.90 3.86
Rate of compensation increase . . . . . . . . . . . . . . . . . . . . . . . . . . . . . . . . . . . 2.77 2.72
81

NOTES TO CONSOLIDATED FINANCIAL STATEMENTS — (Continued)
The Company’s weighted-average assumptions used to determine the net periodic benefit cost
for its defined benefit pension and other postretirement employee benefit plans for the years ended
December 31, 2013, 2012 and 2011 were as follows:
Year Ended December 31,
(percent) 2013 2012 2011
U.S. pension plans:
Discount rate . . . . . . . . . . . . . . . . . . . . . . . . . . . . . . . . . . . . . . . . . . 3.67 4.42 5.17
Rate of compensation increase . . . . . . . . . . . . . . . . . . . . . . . . . . . N/A N/A N/A
Expected return on plan assets . . . . . . . . . . . . . . . . . . . . . . . . . . . 6.75 6.75 7.50
U.S. other postretirement plans:
Discount rate . . . . . . . . . . . . . . . . . . . . . . . . . . . . . . . . . . . . . . . . . . 3.25 4.25 4.75
Rate of compensation increase . . . . . . . . . . . . . . . . . . . . . . . . . . . N/A N/A N/A
Expected return on plan assets . . . . . . . . . . . . . . . . . . . . . . . . . . . N/A N/A N/A
Non-U.S. pension plans:
Discount rate . . . . . . . . . . . . . . . . . . . . . . . . . . . . . . . . . . . . . . . . . . 3.86 5.13 5.37
Rate of compensation increase . . . . . . . . . . . . . . . . . . . . . . . . . . . 2.72 2.78 2.80
Expected return on plan assets . . . . . . . . . . . . . . . . . . . . . . . . . . . 6.42 6.49 7.07
The Company’s approach to establishing the discount rate is based upon the market yields of
high-quality corporate bonds, with appropriate consideration of each plan’s defined benefit payment
terms and duration of the liabilities.
The Company determines its expected return on plan asset assumptions by evaluating estimates
of future market returns and the plans’ asset allocation. The Company also considers the impact of
active management of the plans’ invested assets.
The estimated future benefit payments for the pension and other postretirement employee
benefits are as follows:
Pension benefitsOther postretirement employee
benefits
(millions of dollars)Year
w/o MedicarePart D
reimbursements
with MedicarePart D
reimbursementsU.S. Non-U.S.
2014 . . . . . . . . . . . . . . . . . . . . . . . . . . . . . $ 24.0 $ 17.4 $19.5 $19.5
2015 . . . . . . . . . . . . . . . . . . . . . . . . . . . . . 23.1 20.7 18.7 18.7
2016 . . . . . . . . . . . . . . . . . . . . . . . . . . . . . 23.0 19.3 17.7 17.7
2017 . . . . . . . . . . . . . . . . . . . . . . . . . . . . . 22.2 20.6 17.1 17.1
2018 . . . . . . . . . . . . . . . . . . . . . . . . . . . . . 22.4 21.8 16.6 16.6
2019-2023 . . . . . . . . . . . . . . . . . . . . . . . . 103.2 118.4 65.6 65.6
The weighted-average rate of increase in the per capita cost of covered health care benefits is
projected to be 7.10% in 2014 for pre-65 and post-65 participants, decreasing to 5.0% by the year
2019. A one-percentage point change in the assumed health care cost trend would have the following
effects:
One Percentage Point
(millions of dollars) Increase Decrease
Effect on other postretirement employee benefit obligation . . . . . . . . . . . $12.6 $(10.9)
Effect on total service and interest cost components . . . . . . . . . . . . . . . . $ 0.5 $ (0.5)
82

NOTES TO CONSOLIDATED FINANCIAL STATEMENTS — (Continued)
NOTE 12 STOCK INCENTIVE PLANS
Under the Company’s 1993 Stock Incentive Plan (“1993 Plan”), the Company granted options to
purchase shares of the Company’s common stock at the fair market value on the date of grant. The
options vested over periods up to three years and had a term of 10 years from date of grant. As of
December 31, 2003, there were no options available for future grants under the 1993 Plan and all
options granted under the 1993 Plan were previously exercised, forfeited or expired as of
December 31, 2013. The 1993 Plan expired at the end of 2003 and was replaced by the Company’s
2004 Stock Incentive Plan. Under this plan, 25.0 million shares were authorized for grant, of which
approximately 3.1 million shares remained available for future issuance as of December 31, 2013.
Stock Options A summary of the plans’ shares under option at December 31, 2013, 2012 and
2011 is as follows:
Shares(thousands)
Weightedaverageexercise
price
Weightedaverage
remainingcontractuallife (in years)
Aggregateintrinsicvalue
(in millions)
Outstanding at January 1, 2011 . . . . . . . . . . 6,506 $14.32 4.9 $142.2
Exercised . . . . . . . . . . . . . . . . . . . . . . . . . . (2,066) $13.58 $ 48.4
Outstanding at December 31, 2011 . . . . . . . 4,440 $14.68 4.1 $ 76.3
Exercised . . . . . . . . . . . . . . . . . . . . . . . . . . (1,568) $13.43 $ 40.1
Outstanding at December 31, 2012 . . . . . . . 2,872 $15.33 3.4 $ 58.8
Exercised . . . . . . . . . . . . . . . . . . . . . . . . . . (870) $14.17 $ 25.5
Forfeited . . . . . . . . . . . . . . . . . . . . . . . . . . . (5) $17.48
Outstanding at December 31, 2013 . . . . . . . 1,997 $15.82 2.6 $ 80.0
Options exercisable at December 31,
2013 . . . . . . . . . . . . . . . . . . . . . . . . . . . . . . 1,997 $15.82 2.6 $ 80.0
Proceeds from stock option exercises for the years ended December 31, 2013, 2012 and 2011
were as follows:
Year Ended December 31,
(millions of dollars) 2013 2012 2011
Proceeds from stock options exercised — gross . . . . . . . . . . . . . . . $12.3 $20.9 $28.6
Tax benefit . . . . . . . . . . . . . . . . . . . . . . . . . . . . . . . . . . . . . . . . . . . . . . 20.7 31.1 24.4
Proceeds from stock options exercised, net of tax . . . . . . . . . . . . . $33.0 $52.0 $53.0
Restricted Stock At its November 2007 meeting, the Company’s Compensation Committee
decided that restricted common stock awards and stock units (“restricted stock”) would be awarded
in place of stock options for long-term incentive award grants to employees. Restricted stock granted
to employees vests 50% after two years and the remainder after three years from the date of grant.
Restricted stock granted to non-employee directors generally vests on the anniversary date of the
grant.
The value of restricted stock is determined by the market value of the Company’s common stock
at the date of grant. In 2013, restricted stock in the amount of 746,394 and 28,280 shares was
granted to employees and non-employee directors, respectively, under the 2004 Stock Incentive
83

NOTES TO CONSOLIDATED FINANCIAL STATEMENTS — (Continued)
Plan.The value of the awards is recorded as unearned compensation within capital in excess of par
value in equity and is amortized as compensation expense over the restriction periods.
Restricted stock compensation expense recorded in the Consolidated Statements of Operations
is as follows:
Year Ended December 31,
(millions of dollars, except per share data) 2013 2012 2011
Restricted stock compensation expense . . . . . . . . . . . . . . . . . . . . . $25.8 $21.2 $15.1
Restricted stock compensation expense, net of tax . . . . . . . . . . . . $18.8 $15.5 $11.4
A summary of the status of the Company’s nonvested restricted stock for employees and non-
employee directors at December 31, 2013, 2012 and 2011 is as follows:
Sharessubject torestriction
(thousands)
Weightedaverage
price
Nonvested at January 1, 2011 . . . . . . . . . . . . . . . . . . . . . . . . . . . . . . . . . 3,742 $15.28
Granted . . . . . . . . . . . . . . . . . . . . . . . . . . . . . . . . . . . . . . . . . . . . . . . . . 548 $35.28
Vested . . . . . . . . . . . . . . . . . . . . . . . . . . . . . . . . . . . . . . . . . . . . . . . . . . (1,218) $13.70
Forfeited . . . . . . . . . . . . . . . . . . . . . . . . . . . . . . . . . . . . . . . . . . . . . . . . . (212) $19.02
Nonvested at December 31, 2011 . . . . . . . . . . . . . . . . . . . . . . . . . . . . . . 2,860 $19.51
Granted . . . . . . . . . . . . . . . . . . . . . . . . . . . . . . . . . . . . . . . . . . . . . . . . . 676 $39.21
Vested . . . . . . . . . . . . . . . . . . . . . . . . . . . . . . . . . . . . . . . . . . . . . . . . . . (1,350) $13.72
Forfeited . . . . . . . . . . . . . . . . . . . . . . . . . . . . . . . . . . . . . . . . . . . . . . . . . (122) $27.18
Nonvested at December 31, 2012 . . . . . . . . . . . . . . . . . . . . . . . . . . . . . . 2,064 $29.39
Granted . . . . . . . . . . . . . . . . . . . . . . . . . . . . . . . . . . . . . . . . . . . . . . . . . 782 $37.82
Vested . . . . . . . . . . . . . . . . . . . . . . . . . . . . . . . . . . . . . . . . . . . . . . . . . . (1,322) $24.36
Forfeited . . . . . . . . . . . . . . . . . . . . . . . . . . . . . . . . . . . . . . . . . . . . . . . . . (113) $36.59
Nonvested at December 31, 2013 . . . . . . . . . . . . . . . . . . . . . . . . . . . . . . 1,411 $37.86
Performance Share Plans The 2004 Stock Incentive Plan provides for awarding of performance
shares to members of senior management at the end of successive three-year periods based on the
Company’s performance in terms of total shareholder return relative to a peer group of automotive
companies. In the first quarter of 2012, the Company modified all outstanding Performance Share
Award Agreements to allow for the payment of these awards entirely in the Company’s common
stock, rather than 40% in cash and 60% in the Company’s common stock. Using the lattice model
(Monte Carlo simulation) at the date of modification, the Company determined the first quarter 2012
compensation expense associated with the modification to be negligible. Within the Consolidated
Statement of Cash Flows for the year ended December 31, 2011, the Company’s $19.6 million of
expense associated with the 40% cash portion of the award was included in the changes in accounts
payable and accrued expenses and other non-current assets and liabilities line items.
The Company recognizes compensation expense relating to its performance share plans ratably
over the performance period. Prior to the modification, compensation expense for the 60% stock
component was based on the performance share’s fair value at the date of grant using a lattice model
(Monte Carlo simulation) and the 40% cash component was based on quarterly mark to market of the
cash liability on a quarterly basis. After the first quarter 2012 modification, 100% of compensation
84

NOTES TO CONSOLIDATED FINANCIAL STATEMENTS — (Continued)
expense associated with the performance share plans is calculated using a lattice model (Monte Carlo
simulation). The amounts expensed under the plan and the share issuances for the three-year
measurement periods ended December 31, 2013, 2012 and 2011 were as follows:
Year Ended December 31,
(millions of dollars, except share data) 2013 2012 2011
Expense . . . . . . . . . . . . . . . . . . . . . . . . . . . . . . . . . . . . $ 10.8 $ 35.5 $ 26.3
Number of shares* . . . . . . . . . . . . . . . . . . . . . . . . . . . 545,375 1,116,000 1,076,360
* Shares are issued in February of the following year.
The restricted stock and performance share compensation expense disclosed above includes
$5.5 million and $7.0 million of expense for the years ended December 31, 2013 and 2012,
respectively, related to the Company’s fourth quarter 2012 decision to waive the forfeiture provisions
of existing restricted stock and performance share grants made to certain retiring NEOs. The
Company recorded this expense within other expense (income) in the Consolidated Statements of
Operations.
85

NOTES TO CONSOLIDATED FINANCIAL STATEMENTS — (Continued)
NOTE 13 ACCUMULATED OTHER COMPREHENSIVE INCOME (LOSS)
The following table summarizes the activity within accumulated other comprehensive income
(loss) during the years ended December 31, 2013, 2012 and 2011:
(millions of dollars)
Foreigncurrency
translationadjustments
Hedgeinstruments
Defined benefitpostretirement
plans Other Total
Beginning Balance, January 1, 2011 . . . . . . . . . $148.0 $(44.8) $(158.1) $ 1.2 $ (53.7)
Comprehensive (loss) income before
reclassifications . . . . . . . . . . . . . . . . . . . . . . (62.2) (9.2) (47.3) (0.1) (118.8)
Income taxes associated with
comprehensive (loss) income before
reclassifications . . . . . . . . . . . . . . . . . . . . . . — 3.0 13.3 — 16.3
Reclassification from accumulated other
comprehensive (loss) income . . . . . . . . . . . — 1.5 7.6 — 9.1
Income taxes reclassified into net
earnings . . . . . . . . . . . . . . . . . . . . . . . . . . . . — (1.0) (2.7) — (3.7)
Ending Balance December 31, 2011 . . . . . . . . . $ 85.8 $(50.5) $(187.2) $ 1.1 $(150.8)
Comprehensive (loss) income before
reclassifications . . . . . . . . . . . . . . . . . . . . . . 38.2 30.3 (60.8) (0.2) 7.5
Income taxes associated with
comprehensive (loss) income before
reclassifications . . . . . . . . . . . . . . . . . . . . . . — (10.4) 16.2 — 5.8
Reclassification from accumulated other
comprehensive (loss) income . . . . . . . . . . . 16.8 (8.8) 9.1 — 17.1
Income taxes reclassified into net
earnings . . . . . . . . . . . . . . . . . . . . . . . . . . . . — 2.2 (3.1) — (0.9)
Ending Balance December 31, 2012 . . . . . . . . . $140.8 $(37.2) $(225.8) $ 0.9 $(121.3)
Comprehensive (loss) income before
reclassifications . . . . . . . . . . . . . . . . . . . . . . 40.3 19.6 52.5 1.5 113.9
Income taxes associated with
comprehensive (loss) income before
reclassifications . . . . . . . . . . . . . . . . . . . . . . — (8.1) (15.8) — (23.9)
Reclassification from accumulated other
comprehensive (loss) income . . . . . . . . . . . — 12.6 11.2 — 23.8
Income taxes reclassified into net
earnings . . . . . . . . . . . . . . . . . . . . . . . . . . . . — (2.9) (3.6) — (6.5)
Ending Balance December 31, 2013 . . . . . . . . . $181.1 $(16.0) $(181.5) $ 2.4 $ (14.0)
NOTE 14 CONTINGENCIES
In the normal course of business, the Company is party to various commercial and legal claims,
actions and complaints, including matters involving warranty claims, intellectual property claims,
general liability and various other risks. It is not possible to predict with certainty whether or not the
Company will ultimately be successful in any of these commercial and legal matters or, if not, what
the impact might be. The Company’s environmental and product liability contingencies are discussed
separately below. The Company’s management does not expect that an adverse outcome in any of
these commercial and legal claims, actions and complaints will have a material adverse effect on the
86
NOTES TO CONSOLIDATED FINANCIAL STATEMENTS — (Continued)
Company’s results of operations, financial position or cash flows, although it could be material to the
results of operations in a particular quarter.
Litigation
In January 2006, BorgWarner Diversified Transmission Products Inc. (“DTP”), a subsidiary of the
Company, filed a declaratory judgment action in United States District Court, Southern District of
Indiana (Indianapolis Division) against the United Automobile, Aerospace, and Agricultural Implements
Workers of America (“UAW”) Local No. 287 and Gerald Poor, individually and as the representative of
a defendant class. DTP sought the Court’s affirmation that DTP did not violate the Labor-
Management Relations Act or the Employee Retirement Income Security Act (ERISA) by unilaterally
amending certain medical plans effective April 1, 2006 and October 1, 2006, prior to the expiration of
the then-current collective bargaining agreements. On September 10, 2008, the Court found that
DTP’s reservation of the right to make such amendments reducing the level of benefits provided to
retirees was limited by its collectively bargained health insurance agreement with the UAW, which did
not expire until April 24, 2009. Thus, the amendments were untimely. In 2008, the Company recorded
a charge of $4.0 million as a result of the Court’s decision.
DTP filed a declaratory judgment action in the United States District Court, Southern District of
Indiana (Indianapolis Division) against the UAW Local No. 287 and Jim Barrett and others, individually
and as representatives of a defendant class, on February 26, 2009 again seeking the Court’s
affirmation that DTP did not violate the Labor - Management Relations Act or ERISA by modifying the
level of benefits provided retirees to make them comparable to other Company retiree benefit plans
after April 24, 2009. Certain retirees, on behalf of themselves and others, filed a mirror-image action in
the United States District Court, Eastern District of Michigan (Southern Division) on March 11, 2009,
for which a class has been certified. During the last quarter of 2009, the action pending in Indiana was
dismissed, while the action in Michigan is continuing. The Company is vigorously defending against
the suit. This contingency is subject to many uncertainties, therefore based on the information
available to date, the Company cannot reasonably estimate the amount or the range of potential loss,
if any. A decision on the merits of the suit could be rendered sometime in 2014.
Environmental
The Company and certain of its current and former direct and indirect corporate predecessors,
subsidiaries and divisions have been identified by the United States Environmental Protection Agency
and certain state environmental agencies and private parties as potentially responsible parties
(“PRPs”) at various hazardous waste disposal sites under the Comprehensive Environmental
Response, Compensation and Liability Act (“Superfund”) and equivalent state laws and, as such, may
presently be liable for the cost of clean-up and other remedial activities at 32 such sites.
Responsibility for clean-up and other remedial activities at a Superfund site is typically shared among
PRPs based on an allocation formula.
The Company believes that none of these matters, individually or in the aggregate, will have a
material adverse effect on its results of operations, financial position or cash flows. Generally, this is
because either the estimates of the maximum potential liability at a site are not material or the liability
will be shared with other PRPs, although no assurance can be given with respect to the ultimate
outcome of any such matter.
Based on information available to the Company (which in most cases includes: an estimate of
allocation of liability among PRPs; the probability that other PRPs, many of whom are large, solvent
public companies, will fully pay the cost apportioned to them; currently available information from
87

NOTES TO CONSOLIDATED FINANCIAL STATEMENTS — (Continued)
PRPs and/or federal or state environmental agencies concerning the scope of contamination and
estimated remediation and consulting costs; and remediation alternatives), the Company has an
accrual for indicated environmental liabilities of $4.0 million and $3.9 million at December 31, 2013
and 2012, respectively. The Company expects to pay out substantially all of the amounts accrued for
environmental liability over the next five years.
In connection with the sale of Kuhlman Electric Corporation (“Kuhlman Electric”), the Company
agreed to indemnify the buyer and Kuhlman Electric for certain environmental liabilities, then unknown
to the Company, relating to certain operations of Kuhlman Electric that pre-date the Company’s 1999
acquisition of Kuhlman Electric. In 2007 and 2008, lawsuits were filed against Kuhlman Electric and
others, including the Company, on behalf of approximately 340 plaintiffs alleging personal injury
relating to alleged environmental contamination at its Crystal Springs, Mississippi plant. The
Company entered into a settlement in July 2010 regarding the personal injury claims of the plaintiffs
and those of approximately 2,700 unfiled claimants represented by those plaintiffs’ attorneys. In
exchange for, among other things, the dismissal with prejudice of these lawsuits and the release of
claims by the unfiled claimants, the Company agreed to pay up to $28 million in settlement funds,
which was expensed in the second quarter of 2010. The Company paid $13.9 million in November
2010 and made the final payment of $13.9 million in February 2011. Litigation concerning
indemnification is pending and the Company may in the future become subject to further legal
proceedings.
Product Liability
Like many other industrial companies who have historically operated in the U.S., the Company (or
parties the Company is obligated to indemnify) continues to be named as one of many defendants in
asbestos-related personal injury actions. We believe that the Company’s involvement is limited
because, in general, these claims relate to a few types of automotive friction products that were
manufactured many years ago and contained encapsulated asbestos. The nature of the fibers, the
encapsulation and the manner of use lead the Company to believe that these products are highly
unlikely to cause harm. As of December 31, 2013 and 2012, the Company had approximately 17,000
and 16,000 pending asbestos-related product liability claims, respectively. Of the approximately
17,000 outstanding claims at December 31, 2013, approximately half were pending in jurisdictions
that have undergone significant tort and judicial reform activities subsequent to the filing of these
claims.
The Company’s policy is to vigorously defend against these lawsuits and the Company has been
successful in obtaining dismissal of many claims without any payment. The Company expects that
the vast majority of the pending asbestos-related product liability claims where it is a defendant (or
has an obligation to indemnify a defendant) will result in no payment being made by the Company or
its insurers. In 2013, of the approximately 1,500 claims resolved, 297 (20%) resulted in payment being
made to a claimant by or on behalf of the Company. In the full year of 2012, of the approximately
2,400 claims resolved, 308 (13%) resulted in any payment being made to a claimant by or on behalf of
the Company.
Prior to June 2004, the settlement and defense costs associated with all claims were paid by the
Company's primary layer insurance carriers under a series of funding arrangements. In addition to the
primary insurance available for asbestos-related claims, the Company has substantial excess
insurance coverage available for potential future asbestos-related product claims. In June 2004,
primary layer insurance carriers notified the Company of the alleged exhaustion of their policy limits.
88

NOTES TO CONSOLIDATED FINANCIAL STATEMENTS — (Continued)
A declaratory judgment action was filed in January 2004 in the Circuit Court of Cook County,
Illinois by Continental Casualty Company and related companies against the Company and certain of
its historical general liability insurers. The court has issued a number of interim rulings and discovery
is continuing. The Company has entered into settlement agreements with some of its insurance
carriers, resolving their coverage disputes by agreeing to pay specified amounts to the Company. The
Company is vigorously pursuing the litigation against the remaining insurers.
In August 2013, the Los Angeles Superior Court entered a jury verdict against the Company in an
asbestos-related personal injury action with damages of $35.0 million, $32.5 million of which was
non-compensatory and will not be recoverable through insurance if the verdict is upheld. The
Company has appealed the verdict. The Company posted a surety bond of $55.0 million related to the
appeal. The Company cannot predict the outcome of this pending litigation and therefore cannot
reasonably estimate the amount of possible loss, if any, that could result from this action.
Although it is impossible to predict the outcome of pending or future claims or the impact of tort
reform legislation that may be enacted at the state or federal levels, due to the encapsulated nature of
the products, the Company’s experience in vigorously defending and resolving claims in the past, and
the Company’s significant insurance coverage with solvent carriers as of the date of this filing,
management does not believe that asbestos-related product liability claims are likely to have a
material adverse effect on the Company’s results of operations, financial position or cash flows.
To date, the Company has paid and accrued $278.4 million in defense and indemnity in advance
of insurers’ reimbursement and has received $124.8 million in cash and notes from insurers. The net
balance of $153.6 million, is expected to be fully recovered, of which approximately $20 million is
expected to be recovered within one year. Timing of recovery is dependent on final resolution of the
declaratory judgment action referred to above or additional negotiated settlements. At December 31,
2012, insurers owed $111.0 million in association with these claims.
In addition to the $153.6 million net balance relating to past settlements and defense costs, the
Company has estimated a liability of $96.7 million for claims asserted, but not yet resolved and their
related defense costs at December 31, 2013. The Company also has a related asset of $96.7 million
to recognize proceeds from the insurance carriers, which is expected to be fully recovered. Receipt of
these proceeds is not expected prior to the resolution of the declaratory judgment action referred to
above, which, more-likely-than-not, will occur subsequent to December 31, 2014. At December 31,
2012, the comparable value of the accrued liability and associated insurance asset was $85.6 million.
The amounts recorded in the Consolidated Balance Sheets related to the estimated future
settlement of existing claims are as follows:
December 31,
(millions of dollars) 2013 2012
Assets:
Other non-current assets . . . . . . . . . . . . . . . . . . . . . . . . . . . . . . . . . . . . . . $96.7 $85.6
Total insurance assets . . . . . . . . . . . . . . . . . . . . . . . . . . . . . . . . . . . . . $96.7 $85.6
Liabilities:
Accounts payable and accrued expenses . . . . . . . . . . . . . . . . . . . . . . . . $41.1 $36.5
Other non-current liabilities . . . . . . . . . . . . . . . . . . . . . . . . . . . . . . . . . . . . 55.6 49.1
Total accrued liabilities . . . . . . . . . . . . . . . . . . . . . . . . . . . . . . . . . . . . $96.7 $85.6
89
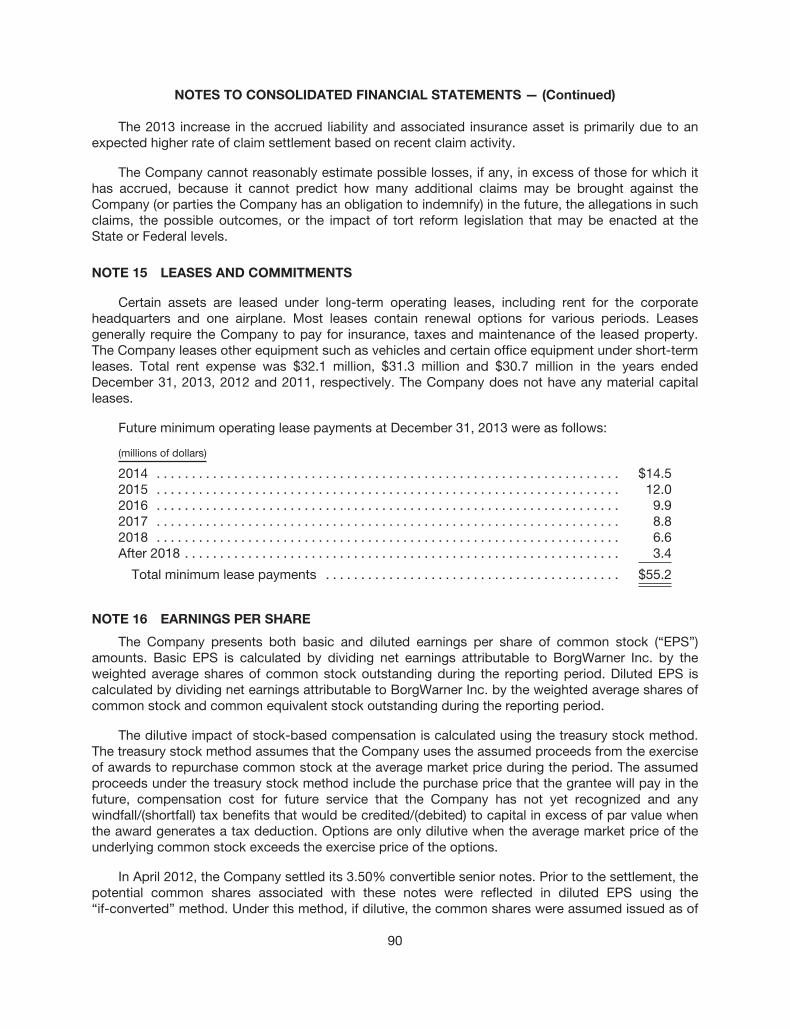
NOTES TO CONSOLIDATED FINANCIAL STATEMENTS — (Continued)
The 2013 increase in the accrued liability and associated insurance asset is primarily due to an
expected higher rate of claim settlement based on recent claim activity.
The Company cannot reasonably estimate possible losses, if any, in excess of those for which it
has accrued, because it cannot predict how many additional claims may be brought against the
Company (or parties the Company has an obligation to indemnify) in the future, the allegations in such
claims, the possible outcomes, or the impact of tort reform legislation that may be enacted at the
State or Federal levels.
NOTE 15 LEASES AND COMMITMENTS
Certain assets are leased under long-term operating leases, including rent for the corporate
headquarters and one airplane. Most leases contain renewal options for various periods. Leases
generally require the Company to pay for insurance, taxes and maintenance of the leased property.
The Company leases other equipment such as vehicles and certain office equipment under short-term
leases. Total rent expense was $32.1 million, $31.3 million and $30.7 million in the years ended
December 31, 2013, 2012 and 2011, respectively. The Company does not have any material capital
leases.
Future minimum operating lease payments at December 31, 2013 were as follows:
(millions of dollars)
2014 . . . . . . . . . . . . . . . . . . . . . . . . . . . . . . . . . . . . . . . . . . . . . . . . . . . . . . . . . . . . . . . . . . $14.5
2015 . . . . . . . . . . . . . . . . . . . . . . . . . . . . . . . . . . . . . . . . . . . . . . . . . . . . . . . . . . . . . . . . . . 12.0
2016 . . . . . . . . . . . . . . . . . . . . . . . . . . . . . . . . . . . . . . . . . . . . . . . . . . . . . . . . . . . . . . . . . . 9.9
2017 . . . . . . . . . . . . . . . . . . . . . . . . . . . . . . . . . . . . . . . . . . . . . . . . . . . . . . . . . . . . . . . . . . 8.8
2018 . . . . . . . . . . . . . . . . . . . . . . . . . . . . . . . . . . . . . . . . . . . . . . . . . . . . . . . . . . . . . . . . . . 6.6
After 2018 . . . . . . . . . . . . . . . . . . . . . . . . . . . . . . . . . . . . . . . . . . . . . . . . . . . . . . . . . . . . . . 3.4
Total minimum lease payments . . . . . . . . . . . . . . . . . . . . . . . . . . . . . . . . . . . . . . . . . . $55.2
NOTE 16 EARNINGS PER SHARE
The Company presents both basic and diluted earnings per share of common stock (“EPS”)
amounts. Basic EPS is calculated by dividing net earnings attributable to BorgWarner Inc. by the
weighted average shares of common stock outstanding during the reporting period. Diluted EPS is
calculated by dividing net earnings attributable to BorgWarner Inc. by the weighted average shares of
common stock and common equivalent stock outstanding during the reporting period.
The dilutive impact of stock-based compensation is calculated using the treasury stock method.
The treasury stock method assumes that the Company uses the assumed proceeds from the exercise
of awards to repurchase common stock at the average market price during the period. The assumed
proceeds under the treasury stock method include the purchase price that the grantee will pay in the
future, compensation cost for future service that the Company has not yet recognized and any
windfall/(shortfall) tax benefits that would be credited/(debited) to capital in excess of par value when
the award generates a tax deduction. Options are only dilutive when the average market price of the
underlying common stock exceeds the exercise price of the options.
In April 2012, the Company settled its 3.50% convertible senior notes. Prior to the settlement, the
potential common shares associated with these notes were reflected in diluted EPS using the
“if-converted” method. Under this method, if dilutive, the common shares were assumed issued as of
90

NOTES TO CONSOLIDATED FINANCIAL STATEMENTS — (Continued)
the beginning of the reporting period and included in calculating diluted EPS. In addition, if dilutive,
interest expense, net of tax, related to the convertible senior notes was added back to the numerator
in calculating diluted EPS.
In conjunction with the convertible senior note offering, the Company entered into a bond hedge
overlay, including both call options and warrants. On April 16, 2012, the Company settled the call
option portion of the bond hedge overlay, receiving approximately 13.0 million shares, which reduced
the weighted average basic and dilutive shares outstanding. Prior to the settlement, if the Company’s
weighted average share price exceeded $16.41 per share, the call options were anti-dilutive. During
the third and fourth quarters of 2012, the Company settled the warrant portion of the bond hedge
overlay, delivering approximately 9.8 million shares. Prior to settlement, if the Company’s weighted-
average share price exceeded $19.31 per share, the warrants were dilutive to the Company’s
earnings.
The following table reconciles the numerators and denominators used to calculate basic and
diluted earnings per share of common stock:
Year Ended December 31,
(in millions except per share amounts) 2013 2012 2011
Basic earnings per share:
Net earnings attributable to BorgWarner Inc. . . . . . . . $ 624.3 $ 500.9 $ 550.1
Weighted average shares of common stock
outstanding . . . . . . . . . . . . . . . . . . . . . . . . . . . . . . . . 228.600 225.304 218.458
Basic earnings per share of common stock . . . . . . . . $ 2.73 $ 2.22 $ 2.52
Diluted earnings per share:
Net earnings attributable to BorgWarner Inc. . . . . . . . $ 624.3 $ 500.9 $ 550.1
Adjusted for net interest expense on convertible
notes . . . . . . . . . . . . . . . . . . . . . . . . . . . . . . . . . . . . . — 5.8 21.5
Diluted net earnings attributable to BorgWarner
Inc. . . . . . . . . . . . . . . . . . . . . . . . . . . . . . . . . . . . . . . . $ 624.3 $ 506.7 $ 571.6
Weighted average shares of common stock
outstanding . . . . . . . . . . . . . . . . . . . . . . . . . . . . . . . . 228.600 225.304 218.458
Effect of 3.50% convertible senior notes . . . . . . . . — 6.644 22.778
Effect of warrant . . . . . . . . . . . . . . . . . . . . . . . . . . . . — 6.800 10.430
Effect of stock-based compensation . . . . . . . . . . . . 2.737 4.006 5.270
Total dilutive effect on weighted average shares of
common stock outstanding . . . . . . . . . . . . . . . . . . . 2.737 17.450 38.478
Weighted average shares of common stock
outstanding including dilutive shares . . . . . . . . . . . 231.337 242.754 256.936
Diluted earnings per share of common stock . . . . . . . $ 2.70 $ 2.09 $ 2.22
Total anti-dilutive shares:
Call options . . . . . . . . . . . . . . . . . . . . . . . . . . . . . . . . — 3.878 12.282
91

NOTES TO CONSOLIDATED FINANCIAL STATEMENTS — (Continued)
NOTE 17 RECENT TRANSACTIONS
Gustav Wahler GmbH u. Co KG
In December 2013, the Company announced that it had signed an agreement to acquire Gustav
Wahler GmbH u. Co. KG and its general partner (“Wahler”). The deal is expected to close in the first
quarter of 2014 subject to standard regulatory approvals. Wahler is a producer of exhaust gas
recirculation (“EGR”) valves, EGR tubes and thermostats and has operations in Germany, Brazil, the
U.S., China and Slovakia. Wahler’s sales for 2013 are expected to be approximately $350 million and
this acquisition strengthens the Company’s strategic position as a producer of complete EGR
systems and creates additional market opportunities in both passenger and commercial vehicle
applications.
BorgWarner BERU Systems Korea Co., Ltd.
During the third and fourth quarters of 2012, the Company completed the purchase of the
remaining 49% of BorgWarner BERU Systems Korea Co., Ltd. for $15.0 million in cash, which has
been classified as a financing activity within the Consolidated Statement of Cash Flows. In
accordance with ASC Topic 810, “Consolidation,” the Company reduced its noncontrolling interest
balance by $7.0 million and reduced capital in excess of par value by $8.0 million. As a result of these
transactions, the Company now owns 100% of BorgWarner BERU Systems Korea Co., Ltd.
Spark plug business
During the second and third quarters of 2012, the Company incurred $39.7 million in expense
associated with the loss on sale of the spark plug business to Federal-Mogul Corporation primarily
related to the write-down of prior purchase price accounting adjustments. These purchase price
accounting adjustments were originally reported in the Engine segment and related to the BERU
acquisition. As a result of the sale, the Company received $55.2 million in cash, which is classified as
an investing activity within the Consolidated Statement of Cash Flows. The sale will allow the
Company to continue to focus on expanding BERU Systems’ core products of glow plugs, diesel cold
start systems and other gasoline ignition technologies.
Tire pressure monitoring business
During the fourth quarter of 2011, the Company incurred $21.5 million in expense associated with
the loss on sale of the tire pressure monitoring business, including the write-down of prior purchase
price accounting adjustments related to the BERU acquisition, costs related to the divestiture, and a
write-down of a portion of the ignitor and electronic business. The Company received $22.9 million in
cash, classified as an investing activity within the Consolidated Statement of Cash Flows, from the
sale of its tire pressure monitoring business to Huf Electronics GmbH. The sale will allow the
Company to continue to focus on expanding BERU Systems’ core products of glow plugs, diesel cold
start systems and other gasoline ignition technologies.
BorgWarner Vikas Emissions Systems India Private Limited
On August 2, 2011, the Company purchased the noncontrolling interest’s 40% share of
BorgWarner Vikas Emissions Systems India Private Limited for $29.4 million in cash, which has been
classified as a financing activity within the Consolidated Statement of Cash Flows. In accordance with
ASC Topic 810, the Company reduced its noncontrolling interest balance by $2.8 million and reduced
capital in excess of par value by $26.6 million. As a result of this transaction, the Company owns
100% of BorgWarner Vikas Emissions Systems India Private Limited.
92

NOTES TO CONSOLIDATED FINANCIAL STATEMENTS — (Continued)
Traction Systems division of Haldex Group
On January 31, 2011, the Company acquired 100% of the stock of Haldex Traction Holding AB
(“Haldex Traction Systems”). Haldex Traction Systems has operations in Sweden, Hungary and
Mexico. The consideration for the acquisition, net of cash acquired, was $214.9 million (1.38 billion
Swedish Krona).
The acquisition has accelerated the Company’s growth in the global all-wheel drive (“AWD”)
market as it continues to shift toward front-wheel drive (“FWD”) based vehicles. The acquisition will
add industry leading FWD/AWD technologies, with a strong European customer base, to the
Company’s existing portfolio of front- and rear-wheel drive based products. This enables the
Company to provide global customers a broader range of AWD solutions to meet their vehicle needs.
The operating results are reported within the Company’s Drivetrain reporting segment as of the
date of acquisition. The Company paid $203.7 million, which is recorded as an investing activity in the
Consolidated Statement of Cash Flows. Additionally, the Company assumed retirement-related
liabilities of $5.3 million and assumed debt of $5.9 million, which are considered non-cash
transactions in the Consolidated Statement of Cash Flows.
NOTE 18 REPORTING SEGMENTS AND RELATED INFORMATION
The Company’s business is comprised of two reporting segments: Engine and Drivetrain. These
segments are strategic business groups, which are managed separately as each represents a specific
grouping of related automotive components and systems.
The Company allocates resources to each segment based upon the projected after-tax return on
invested capital (“ROIC”) of its business initiatives. ROIC is comprised of Adjusted EBIT after
deducting notional taxes compared to the projected average capital investment required. Adjusted
EBIT is comprised of earnings before interest, income taxes and noncontrolling interest (“EBIT”)
adjusted for restructuring, goodwill impairment charges, affiliates’ earnings and other items not
reflective of on-going operating income or loss.
Adjusted EBIT is the measure of segment income or loss used by the Company. The Company
believes Adjusted EBIT is most reflective of the operational profitability or loss of our reporting
segments. The following tables show segment information and Adjusted EBIT for the Company’s
reporting segments.
2013 Segment information
Net sales Long-lived
(millions of dollars) CustomersInter-
segment NetYear-end
assetsDepreciation/amortization
assetexpenditures (b)
Engine . . . . . . . . . . . . . . . . . . . . . $4,990.1 $ 32.0 $5,022.1 $3,519.1 $189.1 $277.5
Drivetrain . . . . . . . . . . . . . . . . . . . 2,446.5 — 2,446.5 1,786.6 90.5 122.9
Inter-segment eliminations . . . . . — (32.0) (32.0) — — —
Total . . . . . . . . . . . . . . . . . . . . . 7,436.6 — 7,436.6 5,305.7 279.6 400.4
Corporate (a) . . . . . . . . . . . . . . . . — — — 1,611.3 19.8 17.4
Consolidated . . . . . . . . . . . . . . $7,436.6 $ — $7,436.6 $6,917.0 $299.4 $417.8
93

NOTES TO CONSOLIDATED FINANCIAL STATEMENTS — (Continued)
2012 Segment information
Net sales Long-lived
(millions of dollars) CustomersInter-
segment NetYear-end
assetsDepreciation/amortization
assetexpenditures (b)
Engine . . . . . . . . . . . . . . . . . . . . . $4,884.5 $ 28.5 $4,913.0 $3,299.2 $177.8 $269.9
Drivetrain . . . . . . . . . . . . . . . . . . . 2,298.7 — 2,298.7 1,652.2 91.3 125.6
Inter-segment eliminations . . . . . — (28.5) (28.5) — — —
Total . . . . . . . . . . . . . . . . . . . . . 7,183.2 — 7,183.2 4,951.4 269.1 395.5
Corporate (a) . . . . . . . . . . . . . . . . — — — 1,449.4 19.5 11.9
Consolidated . . . . . . . . . . . . . . $7,183.2 $ — $7,183.2 $6,400.8 $288.6 $407.4
2011 Segment information
Net sales Long-lived
(millions of dollars) CustomersInter-
segment NetYear-end
assetsDepreciation/amortization
assetexpenditures (b)
Engine . . . . . . . . . . . . . . . . . . . . . $5,030.2 $ 20.4 $5,050.6 $3,329.0 $188.6 $264.3
Drivetrain . . . . . . . . . . . . . . . . . . 2,084.5 — 2,084.5 1,562.8 80.0 115.9
Inter-segment eliminations . . . . — (20.4) (20.4) — — —
Total . . . . . . . . . . . . . . . . . . . . 7,114.7 — 7,114.7 4,891.8 268.6 380.2
Corporate (a) . . . . . . . . . . . . . . . — — — 1,066.8 14.4 13.5
Consolidated . . . . . . . . . . . . . $7,114.7 $ — $7,114.7 $5,958.6 $283.0 $393.7
(a) Corporate assets include investments and advances and deferred income taxes.
(b) Long-lived asset expenditures include capital expenditures and tooling outlays.
94

NOTES TO CONSOLIDATED FINANCIAL STATEMENTS — (Continued)
Adjusted earnings before interest, income taxes and noncontrolling interest (“Adjusted EBIT”)
Year Ended December 31,
(millions of dollars) 2013 2012 2011
Engine . . . . . . . . . . . . . . . . . . . . . . . . . . . . . . . . . . . . . . . . . . . . . . . . . . . . . . . $ 826.0 $786.4 $774.3
Drivetrain . . . . . . . . . . . . . . . . . . . . . . . . . . . . . . . . . . . . . . . . . . . . . . . . . . . . . 252.2 209.1 161.2
Adjusted EBIT . . . . . . . . . . . . . . . . . . . . . . . . . . . . . . . . . . . . . . . . . . . . . . . 1,078.2 995.5 935.5
Restructuring expense . . . . . . . . . . . . . . . . . . . . . . . . . . . . . . . . . . . . . . . . . . 52.3 27.4 —
Program termination agreement . . . . . . . . . . . . . . . . . . . . . . . . . . . . . . . . . . 11.3 — —
Retirement related obligations . . . . . . . . . . . . . . . . . . . . . . . . . . . . . . . . . . . . 5.9 17.3 —
Loss from disposal activities . . . . . . . . . . . . . . . . . . . . . . . . . . . . . . . . . . . . . — 39.7 21.5
Patent infringement settlement, net of legal costs incurred . . . . . . . . . . . . — — (29.1)
Corporate, including equity in affiliates’ earnings and stock-based
compensation . . . . . . . . . . . . . . . . . . . . . . . . . . . . . . . . . . . . . . . . . . . . . . . 110.0 115.4 107.4
Interest income . . . . . . . . . . . . . . . . . . . . . . . . . . . . . . . . . . . . . . . . . . . . . . . . (4.8) (4.7) (4.8)
Interest expense and finance charges . . . . . . . . . . . . . . . . . . . . . . . . . . . . . 34.2 39.4 74.6
Earnings before income taxes and noncontrolling interest . . . . . . . . . . . 869.3 761.0 765.9
Provision for income taxes . . . . . . . . . . . . . . . . . . . . . . . . . . . . . . . . . . . . . . . 218.3 238.6 195.3
Net earnings . . . . . . . . . . . . . . . . . . . . . . . . . . . . . . . . . . . . . . . . . . . . . . . . 651.0 522.4 570.6
Net earnings attributable to the noncontrolling interest, net of tax . . . . . . . 26.7 21.5 20.5
Net earnings attributable to BorgWarner Inc. . . . . . . . . . . . . . . . . . . . . . . $ 624.3 $500.9 $550.1
Geographic Information
Outside the U.S., only China, Germany, Hungary and South Korea exceeded 5% of consolidated
net sales during the year ended December 31, 2013, attributing sales to the location of production
rather than the location of the customer. Also, the Company’s 50% equity investment in NSK-Warner
(see Note 5) of $168.0 million, $184.4 million and $189.2 million at December 31, 2013, 2012 and
2011, respectively, is excluded from the definition of long-lived assets, as are goodwill and certain
other non-current assets.
Net sales Long-lived assets
(millions of dollars) 2013 2012 2011 2013 2012 2011
United States . . . . . . . . . . . . . . . . . . . $1,939.7 $1,857.2 $1,674.0 $ 531.7 $ 508.1 $ 492.6
Europe:
Germany . . . . . . . . . . . . . . . . . . . . . 1,760.1 1,871.3 2,200.0 430.0 432.2 420.4
Hungary . . . . . . . . . . . . . . . . . . . . . 451.5 448.9 503.2 66.9 64.3 56.9
France . . . . . . . . . . . . . . . . . . . . . . . 327.6 335.2 363.0 44.4 45.9 63.2
Other Europe . . . . . . . . . . . . . . . . . 1,132.5 1,015.1 917.8 257.6 225.8 194.6
Total Europe . . . . . . . . . . . . . . . . . . . 3,671.7 3,670.5 3,984.0 798.9 768.2 735.1
South Korea . . . . . . . . . . . . . . . . . . . . 563.5 505.6 471.7 165.2 140.4 124.5
China . . . . . . . . . . . . . . . . . . . . . . . . . 636.3 499.1 416.6 238.5 184.3 148.0
Other foreign . . . . . . . . . . . . . . . . . . . 625.4 650.8 568.4 205.1 187.0 164.1
Total . . . . . . . . . . . . . . . . . . . . . . . . $7,436.6 $7,183.2 $7,114.7 $1,939.4 $1,788.0 $1,664.3
95

NOTES TO CONSOLIDATED FINANCIAL STATEMENTS — (Continued)
Sales to Major Customers
Consolidated net sales to Volkswagen (including its subsidiaries) were approximately 16%, 17%
and 19% for the years ended December 31, 2013, 2012 and 2011, respectively; and to Ford (including
its subsidiaries) were approximately 14%, 13%, and 12% for the years ended December 31, 2013,
2012 and 2011, respectively. Both of the Company’s reporting segments had significant sales to
Volkswagen and Ford in 2013, 2012 and 2011. Accounts receivable from these customers at
December 31, 2013 comprised approximately 24% ($248.4 million) of total accounts receivable. Such
sales consisted of a variety of products to a variety of customer locations and regions. No other single
customer accounted for more than 10% of consolidated net sales in any of the years presented.
Sales by Product Line
Sales of turbochargers for light vehicles represented approximately 26% of total net sales for the
years ended December 31, 2013, 2012 and 2011. The Company currently supplies light vehicle
turbochargers to many OEMs including BMW, Daimler, Fiat, Ford, General Motors, Hyundai, PSA,
Renault and Volkswagen. No other single product line accounted for more than 10% of consolidated
net sales in any of the years presented.
Interim Financial Information (Unaudited)
(millions of dollars, except per share amounts)2013 2012
Quarter ended Mar-31 Jun-30 Sep-30 Dec-31 Year Mar-31 Jun-30 Sep-30 Dec-31 Year
Net sales . . . . . . . . . . . . . . . . . . . $1,851.1 $1,893.9 $1,806.2 $1,885.4 $7,436.6 $1,912.5 $1,856.4 $1,695.2 $1,719.1 $7,183.2
Cost of sales . . . . . . . . . . . . . . . . 1,476.4 1,497.3 1,426.6 1,478.8 5,879.1 1,516.7 1,473.2 1,351.5 1,374.9 5,716.3
Gross profit . . . . . . . . . . . . . . . 374.7 396.6 379.6 406.6 1,557.5 395.8 383.2 343.7 344.2 1,466.9
Selling, general and
administrative expenses . . . . 159.3 155.6 157.7 167.1 639.7 169.0 153.1 151.0 156.2 629.3
Other expense (income) . . . . . . . 16.9 (2.4) (3.7) 51.8 62.6 1.1 36.6 29.7 17.3 84.7
Operating income . . . . . . . . . . 198.5 243.4 225.6 187.7 855.2 225.7 193.5 163.0 170.7 752.9
Equity in affiliates’ earnings, net
of tax . . . . . . . . . . . . . . . . . . . . (9.7) (11.1) (10.4) (12.3) (43.5) (9.2) (12.5) (11.1) (10.0) (42.8)
Interest income . . . . . . . . . . . . . . (1.0) (1.0) (1.3) (1.5) (4.8) (1.4) (1.3) (1.0) (1.0) (4.7)
Interest expense and finance
charges . . . . . . . . . . . . . . . . . . 9.7 8.8 8.1 7.6 34.2 15.1 12.6 5.0 6.7 39.4
Earnings before income taxes
and noncontrolling
interest . . . . . . . . . . . . . . . . . 199.5 246.7 229.2 193.9 869.3 221.2 194.7 170.1 175.0 761.0
Provision for income taxes . . . . 50.9 66.6 56.3 44.5 218.3 57.5 68.5 64.2 48.4 238.6
Net earnings . . . . . . . . . . . . . . 148.6 180.1 172.9 149.4 651.0 163.7 126.2 105.9 126.6 522.4
Net earnings attributable to the
noncontrolling interest, net of
tax . . . . . . . . . . . . . . . . . . . . . . 6.6 6.0 6.1 8.0 26.7 5.7 5.6 4.8 5.4 21.5
Net earnings attributable to
BorgWarner Inc. (a) . . . . . . . $ 142.0 $ 174.1 $ 166.8 $ 141.4 $ 624.3 $ 158.0 $ 120.6 $ 101.1 $ 121.2 $ 500.9
Earnings per share — basic . . . $ 0.62 $ 0.76 $ 0.73 $ 0.62 $ 2.73 $ 0.73 $ 0.54 $ 0.44 $ 0.52 $ 2.22
Earnings per share — diluted . . $ 0.61 $ 0.75 $ 0.72 $ 0.62 $ 2.70 $ 0.64 $ 0.50 $ 0.43 $ 0.51 $ 2.09
(a) The Company’s results were impacted by the following:
• Quarter ended December 31, 2013: The Company incurred restructuring expense of $52.3 million, related to the
initiation of Drivetrain segment actions designed to improve future profitability and competitiveness. The Company
recorded tax benefits of $7.1 million in connection with the restructuring expense. Additionally, the Company recorded
a net tax benefit of $4.4 million related to the reversal of certain state deferred tax asset valuation allowances and
other tax adjustments.
96

NOTES TO CONSOLIDATED FINANCIAL STATEMENTS — (Continued)
• Quarter ended September 30, 2013: The Company incurred a net tax benefit of $5.6 million, which was comprised of
tax benefits of $3.1 million related to 2012 provision to return adjustments and $2.5 million related to the reversal of
certain state deferred tax asset valuation allowances.
• Quarter ended March 31, 2013: The Company incurred $11.3 million of expense related to a program termination
agreement. Retirement related obligations expense of $5.9 million was primarily related to a first quarter 2013 grant of
restricted stock awards to certain retiring NEOs as to which the Company waived the forfeiture provisions. The
Company recorded tax benefits of $3.8 million and $2.1 million related to the program termination agreement and
retirement related obligations. Additionally, the Company recorded a net tax benefit of $1.7 million, which was
comprised of a $6.6 million tax benefit related to the extension of the federal research and development credit and
other international tax provisions resulting from the retroactive impact of U.S. legislation enacted in January 2013,
partially offset by a $4.9 million tax expense related to a comprehensive income adjustment.
• Quarter ended December 31, 2012: Retirement related obligations of $17.3 million are comprised of a $5.7 million
loss resulting from the settlement of a portion of the Muncie Plant’s pension obligation and an $11.6 million expense
associated with the retirement of certain NEOs. These obligations were partially offset by a $6.1 million tax benefit. The
Company incurred tax expense of $3.9 million which included $11.1 million of U.S. tax expense to correct the income
taxes payable balance, partially offset by tax benefits resulting from changes to the statutory income tax rate in certain
countries and the settlement of certain tax audits.
• Quarter ended September 30, 2012: The Company incurred $1.8 million of expense and $11.2 million of tax expense
associated with the completion of the sale of its spark plug business. The Company also recorded restructuring
expense of $27.4 million primarily associated with the disposal and future requirements of BERU’s on-going business,
which was partially offset by a tax benefit of $7.7 million. Additionally, the Company incurred tax expense of $6.9
million primarily resulting from the settlement of certain tax audits.
• Quarter ended June 30, 2012: The Company recorded expense of $37.9 million primarily due to the write-down of
prior purchase price accounting adjustments included within the disposal group as a result of signing a Master
Purchase Agreement to sell the spark plug business to Federal-Mogul Corporation, which was partially offset by a tax
benefit of $5.5 million resulting from the write-down. Additionally, the Company recorded tax expense of $9.0 million
related to its decision to change its cash repatriation assertion for some of its foreign subsidiaries.
97

Item 9. Changes in and Disagreements With Accountants on Accounting and FinancialDisclosure
Not applicable.
Item 9A. Controls and Procedures
Disclosure Controls and Procedures
A control system, no matter how well conceived and operated, can provide only reasonable, not
absolute, assurance that the objectives of the control system are met. Further, the design of a control
system must reflect the fact that there are resource constraints and the benefits of controls must be
considered relative to costs. Because of the inherent limitations in all control systems, no evaluation
of controls can provide absolute assurance that all control issues and instances of fraud, if any, within
the company have been detected. Because of the inherent limitations in a cost-effective control
system, misstatements due to error or fraud may occur and not be detected. However, our disclosure
controls and procedures are designed to provide reasonable assurance of achieving their objectives.
The Company has adopted and maintains disclosure controls and procedures that are designed
to provide reasonable assurance that information required to be disclosed in the reports filed or
submitted under the Exchange Act, such as this Form 10-K, is collected, recorded, processed,
summarized and reported within the time periods specified in the rules and forms of the Securities
and Exchange Commission. The Company’s disclosure controls and procedures are also designed to
ensure that such information is accumulated and communicated to management to allow timely
decisions regarding required disclosure. As required under Exchange Act Rule 13a-15, the
Company’s management, including the Chief Executive Officer and Chief Financial Officer, has
conducted an evaluation of the effectiveness of disclosure controls and procedures as of the end of
the period covered by this report. Based on that evaluation, the Chief Executive Officer and Chief
Financial Officer concluded that the disclosure controls and procedures are effective.
Management’s Report on Internal Control Over Financial Reporting
The Company’s management is responsible for establishing and maintaining adequate internal
control over financial reporting, as defined in Exchange Act Rule 13a-15(f). Management conducted
an assessment of the Company’s internal control over financial reporting based on the framework and
criteria established by the Committee of Sponsoring Organizations of the Treadway Commission in
Internal Control - Integrated Framework (1992). Based on the assessment, management concluded
that, as of December 31, 2013, the Company’s internal control over financial reporting is effective
based on those criteria. Refer to Item 7 of this report for “Report of Management on Internal Control
Over Financial Reporting.”
PricewaterhouseCoopers LLP, an independent registered public accounting firm, has audited the
Company’s consolidated financial statements and the effectiveness of internal controls over financial
reporting as of December 31, 2013 as stated in their report included herein.
Changes in Internal Control
There have been no changes in internal controls over the financial reporting that occurred during
the most recent fiscal quarter that have materially affected, or are reasonably likely to materially affect
our internal controls over financial reporting.
Item 9B. Other Information
Not applicable.
98

PART III
Item 10. Directors, Executive Officers and Corporate Governance
Information with respect to directors, executive officers and corporate governance that appears
in the Company’s proxy statement for its 2014 Annual Meeting of Stockholders under the captions
“Election of Directors,” “Information on Nominees for Directors and Continuing Directors,” “Board of
Directors and Its Committees,” “Section 16(a) Beneficial Ownership Reporting Compliance,” “Code of
Ethics,” and “Compensation Committee Report” is incorporated herein by this reference and made a
part of this report.
Item 11. Executive Compensation
Information with respect to director and executive compensation that appears in the Company’s
proxy statement for its 2014 Annual Meeting of Stockholders under the captions “Director
Compensation,” “Compensation Committee Interlocks and Insider Participation,” “Executive
Compensation,” “Compensation Discussion and Analysis,” “Restricted Stock and Stock Units,” “Long
Term Incentives,” and “Change of Control Employment Agreements” is incorporated herein by this
reference and made a part of this report.
Item 12. Security Ownership of Certain Beneficial Owners and Management and RelatedStockholder Matters
Information with respect to security ownership and certain beneficial owners and management
and related stockholders matters that appears in the Company’s proxy statement for its 2014 Annual
Meeting of Stockholders under the caption “Security Ownership of Certain Beneficial Owners and
Management” is incorporated herein by this reference and made a part of this report.
For information regarding the Company’s equity compensation plans, see Item 5 “Market for the
Registrant’s Common Equity, Related Stockholder Matters and Issuer Purchases of Equity Securities”
in this Annual Report on Form 10-K.
Item 13. Certain Relationships and Related Transactions and Director Independence
Information with respect to certain relationships and related transactions and director
independence that appears in the Company’s proxy statement for its 2014 Annual Meeting of
Stockholders under the caption “Board of Directors and Its Committees” is incorporated herein by
this reference and made a part of this report.
Item 14. Principal Accountant Fees and Services
Information with respect to principal accountant fees and services that appears in the Company’s
proxy statement for its 2014 Annual Meeting of Stockholders under the caption “Independent
Registered Public Accounting Firm Fees and Services” is incorporated herein by this reference and
made a part of this report.
PART IV
Item 15. Exhibits and Financial Statement Schedules
The information required by this Section (a)(3) of Item 15 is set forth on the Exhibit Index that follows
the Signatures page of this Form 10-K. The information required by this Section (a)(1) of Item 15 is set
forth above in Item 8, Financial Statements and Supplementary Data. All financial statement schedules
have been omitted, since the required information is not applicable or is not present in amounts
sufficient to require submission of the schedule, or because the information required is included in the
consolidated financial statements and notes thereto included in this Form 10-K.
99

SIGNATURES
Pursuant to the requirements of Section 13 or 15(d) of the Securities Exchange Act of 1934, the
registrant has duly caused this report to be signed on its behalf by the undersigned, thereunto duly
authorized.
BORGWARNER INC.
By: /S/ JAMES R. VERRIER
James R. Verrier
President and Chief Executive Officer
Date: February 13, 2014
Pursuant to the requirements of the Securities Exchange Act of 1934, this report has been signed
below by the following persons on behalf of the registrant and in the capacities indicated on the
13th day of February, 2014.
Signature Title
/S/ JAMES R. VERRIER
James R. Verrier
President and Chief Executive Officer(Principal Executive Officer) and Director
/S/ RONALD T. HUNDZINSKI
Ronald T. Hundzinski
Vice President and Chief Financial Officer(Principal Financial Officer)
/S/ STEVEN G. CARLSON
Steven G. Carlson
Vice President and Controller(Principal Accounting Officer)
/S/ PHYLLIS O. BONANNO
Phyllis O. Bonanno
Director
/S/ DAVID T. BROWN
David T. Brown
Director
/S/ JAN CARLSON
Jan Carlson
Director
/S/ DENNIS C. CUNEO
Dennis C. Cuneo
Director
/S/ JERE A. DRUMMOND
Jere A. Drummond
Director
/S/ JOHN R. MCKERNAN, JR.
John R. McKernan, Jr.
Director
/S/ ALEXIS P. MICHAS
Alexis P. Michas
Director and Non-Executive Chairman
/S/ ERNEST J. NOVAK, JR.
Ernest J. Novak, Jr.
Director
/S/ RICHARD O. SCHAUM
Richard O. Schaum
Director
/S/ THOMAS T. STALLKAMP
Thomas T. Stallkamp
Director
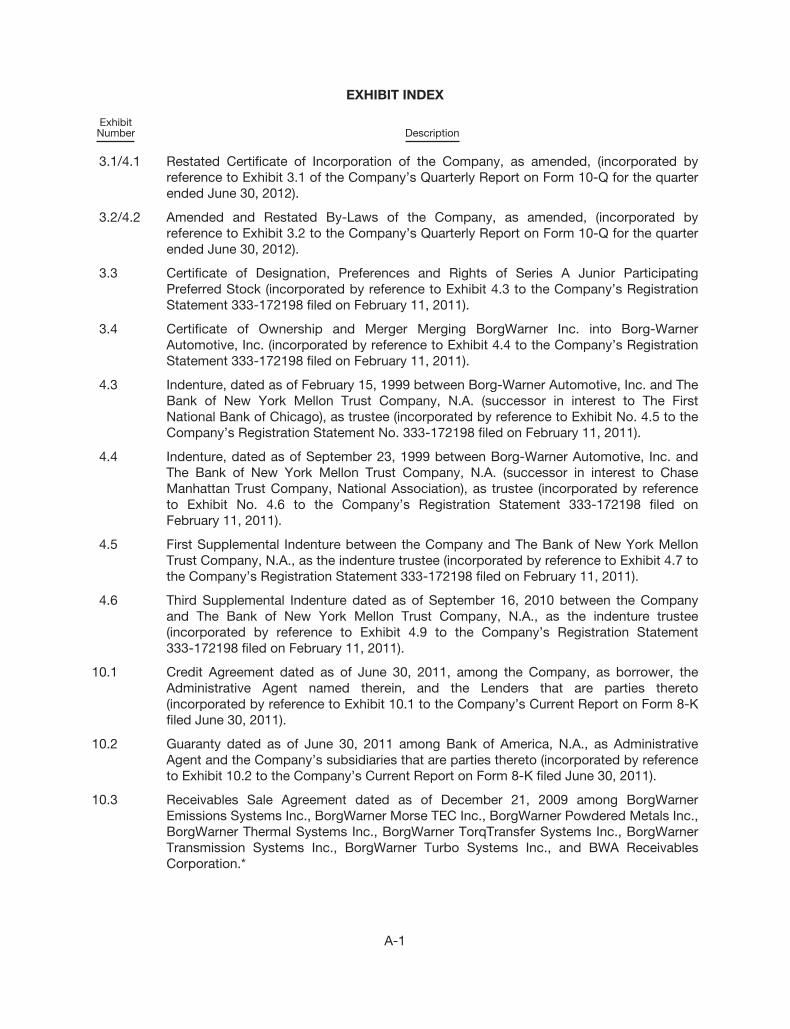
EXHIBIT INDEX
ExhibitNumber Description
3.1/4.1 Restated Certificate of Incorporation of the Company, as amended, (incorporated by
reference to Exhibit 3.1 of the Company’s Quarterly Report on Form 10-Q for the quarter
ended June 30, 2012).
3.2/4.2 Amended and Restated By-Laws of the Company, as amended, (incorporated by
reference to Exhibit 3.2 to the Company’s Quarterly Report on Form 10-Q for the quarter
ended June 30, 2012).
3.3 Certificate of Designation, Preferences and Rights of Series A Junior Participating
Preferred Stock (incorporated by reference to Exhibit 4.3 to the Company’s Registration
Statement 333-172198 filed on February 11, 2011).
3.4 Certificate of Ownership and Merger Merging BorgWarner Inc. into Borg-Warner
Automotive, Inc. (incorporated by reference to Exhibit 4.4 to the Company’s Registration
Statement 333-172198 filed on February 11, 2011).
4.3 Indenture, dated as of February 15, 1999 between Borg-Warner Automotive, Inc. and The
Bank of New York Mellon Trust Company, N.A. (successor in interest to The First
National Bank of Chicago), as trustee (incorporated by reference to Exhibit No. 4.5 to the
Company’s Registration Statement No. 333-172198 filed on February 11, 2011).
4.4 Indenture, dated as of September 23, 1999 between Borg-Warner Automotive, Inc. and
The Bank of New York Mellon Trust Company, N.A. (successor in interest to Chase
Manhattan Trust Company, National Association), as trustee (incorporated by reference
to Exhibit No. 4.6 to the Company’s Registration Statement 333-172198 filed on
February 11, 2011).
4.5 First Supplemental Indenture between the Company and The Bank of New York Mellon
Trust Company, N.A., as the indenture trustee (incorporated by reference to Exhibit 4.7 to
the Company’s Registration Statement 333-172198 filed on February 11, 2011).
4.6 Third Supplemental Indenture dated as of September 16, 2010 between the Company
and The Bank of New York Mellon Trust Company, N.A., as the indenture trustee
(incorporated by reference to Exhibit 4.9 to the Company’s Registration Statement
333-172198 filed on February 11, 2011).
10.1 Credit Agreement dated as of June 30, 2011, among the Company, as borrower, the
Administrative Agent named therein, and the Lenders that are parties thereto
(incorporated by reference to Exhibit 10.1 to the Company’s Current Report on Form 8-K
filed June 30, 2011).
10.2 Guaranty dated as of June 30, 2011 among Bank of America, N.A., as Administrative
Agent and the Company’s subsidiaries that are parties thereto (incorporated by reference
to Exhibit 10.2 to the Company’s Current Report on Form 8-K filed June 30, 2011).
10.3 Receivables Sale Agreement dated as of December 21, 2009 among BorgWarner
Emissions Systems Inc., BorgWarner Morse TEC Inc., BorgWarner Powdered Metals Inc.,
BorgWarner Thermal Systems Inc., BorgWarner TorqTransfer Systems Inc., BorgWarner
Transmission Systems Inc., BorgWarner Turbo Systems Inc., and BWA Receivables
Corporation.*
A-1

ExhibitNumber Description
10.4 Receivables Purchase Agreement dated as of December 21, 2009 among BWA
Receivables Corporation, as seller, the Company, as the collection agent, the purchasers
from time to time party thereto, and Wachovia Bank, National Association, as
administrative agent.*
10.5 Amendment No. 1 Receivables Purchase Agreement dated as of September 8, 2010,
among BWA Receivables Corporation, as seller, the Company., as the collection agent
and Wells Fargo Bank, N.A. (successor by merger to Wachovia Bank, National
Association), as administrative agent.*
10.6 Amendment No. 2 Receivables Purchase Agreement dated as of November 1, 2012,
among BWA Receivables Corporation, as seller, the Company, as the collection agent
and Wells Fargo Bank, N.A. (successor by merger to Wachovia Bank, National
Association), as administrative agent (incorporated by reference to Exhibit 10.1 to the
Company’s Current Report Form 8-K filed November 7, 2012).
†10.7 BorgWarner Inc. Amended and Restated 2004 Stock Incentive Plan.*
†10.8 First Amendment to the BorgWarner Inc. Amended and Restated 2004 Stock Incentive
Plan (as amended and restated effective April 29, 2009).*
†10.9 Second Amendment dated as of July 26, 2011, to the BorgWarner Inc. Amended and
Restated 2004 Stock Incentive Plan (incorporated by reference to Exhibit 10.2 to the
Company’s Quarterly Report on Form 10-Q for the quarter ended September 30, 2011).
†10.10 Form of BorgWarner Inc. Amended and Restated 2004 Stock Incentive Plan Amended
Performance Share Award Agreement (incorporated by reference to Exhibit 10.1 of the
Company’s Quarterly Report on Form 10-Q for the quarter ended June 30, 2013).
†10.11 Form of BorgWarner Inc. Amended and Restated 2004 Stock Incentive Plan Performance
Units Award Agreement.*
†10.12 Form of BorgWarner Inc. Amended and Restated 2004 Stock Incentive Plan Restricted
Stock Agreement for Employees (incorporated by reference to Exhibit 10.15 to the
Company’s Annual Report on Form 10-K for the year ended December 31, 2012).
†10.13 Form of BorgWarner Inc. Amended and Restated 2004 Stock Incentive Plan Stock Units
Award Agreement Non-U.S. Employees (incorporated by reference to Exhibit 10.2 of the
Company’s Quarterly Report on Form 10-Q for the quarter ended June 30, 2013).
†10.14 Form of BorgWarner Inc. 2004 Stock Incentive Plan Non-Qualified Stock Option Award
Agreement (incorporated by reference to Exhibit 10.15 to the Company’s Annual Report
on Form 10-K for the year ended December 31, 2012).
†10.15 Borg-Warner Automotive, Inc. Executive Stock Performance Plan, Revised and Re-
approved February 2, 2000 (incorporated by reference to Exhibit 10.16 to the Company’s
Annual Report on Form 10-K for the year ended December 31, 2012).
†10.16 BorgWarner Inc. 2005 Executive Incentive Plan (as amended and restated).*
†10.17 First Amendment dated as of July 27, 2011, to BorgWarner Inc. 2005 Executive Incentive
Plan as amended and restated effective January 1, 2009 (incorporated by reference to
Exhibit 10.1 to the Company’s Quarterly Report on Form 10-Q for the quarter ended
September 30, 2011).
A-2

ExhibitNumber Description
†10.18 Borg-Warner Automotive, Inc. Management Incentive Bonus Plan dated January 1, 1994
(as amended and restated).*
†10.19 Borg-Warner Automotive Inc. Retirement Savings Excess Benefit Plan dated January 27,
1993 (as amended and restated).*
†10.20 Form of Amendment dated December 10, 2012 to the Borg-Warner Automotive Inc.
Retirement Savings Excess Benefit Plan (incorporated by reference to Exhibit 10.21 to
the Company’s Annual Report on Form 10-K for the year ended December 31, 2012).
†10.21 BorgWarner Inc. Board of Directors Deferred Compensation Plan dated April 18, 1995 (as
amended and restated).*
†10.22 First Amendment dated as of January 1, 2011 to BorgWarner Inc. Board of Directors
Deferred Compensation Plan.*
†10.23 Form of Amended and Restated Change of Control Employment Agreement for Executive
Officers.*
†10.24 Form of Amended and Restated Change of Control Employment Agreement for Executive
Officers (effective 2009).*
†10.25 BorgWarner Inc. 2004 Deferred Compensation Plan (as amended and restated).*
10.26 Distribution and Indemnity Agreement dated January 27, 1993 between Borg-Warner
Automotive, Inc. and Borg-Warner Security Corporation (incorporated by reference to
Exhibit 10.27 to the Company’s Annual Report on Form 10-K for the year ended
December 31, 2012).
10.27 Assignment of Trademarks and License Agreement (incorporated by reference to
Exhibit 10.28 to the Company’s Annual Report on Form 10-K for the year ended
December 31, 2012).
10.28 Amendment to Assignment of Trademarks and License Agreement (incorporated by
reference to Exhibit 10.29 to the Company’s Annual Report on Form 10-K for the year
ended December 31, 2012).
21.1 Subsidiaries of the Company.*
23.1 Independent Registered Public Accounting Firm’s Consent.*
31.1 Rule 13a-14(a)/15d-14(a) Certification by Principal Executive Officer.*
31.2 Rule 13a-14(a)/15d-14(a) Certification by Principal Financial Officer.*
32.1 Section 1350 Certifications.*
101.INS XBRL Instance Document.*
101.SCH XBRL Taxonomy Extension Schema Document.*
101.CAL XBRL Taxonomy Extension Calculation Linkbase Document.*
101.LAB XBRL Taxonomy Extension Label Linkbase Document.*
101.PRE XBRL Taxonomy Extension Presentation Linkbase Document.*
101.DEF XBRL Taxonomy Extension Definition Linkbase Document.*
* Filed herewith.
† Indicates a management contract or compensatory plan or arrangement.
A-3

[THIS PAGE INTENTIONALLY LEFT BLANK]

[THIS PAGE INTENTIONALLY LEFT BLANK]

[THIS PAGE INTENTIONALLY LEFT BLANK]


borgwarner.com
BorgWarner Inc.
World Headquarters
3850 Hamlin Road
Auburn Hills, MI 48326


![BorgWarner Turbo & Emissions Systems: · BorgWarner Turbo & Emissions Systems: Documentation of the Admin Area [di] digitale informationssysteme gmbh, Mannheim](https://static.fdocuments.us/doc/165x107/5be6f3f309d3f2ea1a8dfca4/borgwarner-turbo-emissions-systems-borgwarner-turbo-emissions-systems.jpg)