ANNUAL REPORT 1999 - BorgWarner
48
DRIVING GROWTH DRIVING GROWTH 1999 ANNUAL REPORT
Transcript of ANNUAL REPORT 1999 - BorgWarner

D R I V I N G G R O W T HD R I V I N G G R O W T H
19
99
AN
NU
AL
RE
PO
RT

BorgWarner Inc. and Consolidated Subsidiaries
F I N A N C I A L H I G H L I G H T S
1 9 9 9 1 9 9 8
Net sales $2,458.6 $1,836.8
Net earnings 132.3 94.7
Net earnings per share – basic 5.10 4.03
Net earnings per share – diluted 5.07 4.00
Average number of shares
outstanding – basic {millions} 25.9 23.5
Average number of shares
outstanding – diluted {millions} 26.1 23.7
Number of employees 14,400 10,100
130130
1 9 9 0 1 9 9 3 1 9 9 6 1 9 9 9
NA Auto Industry
BorgWarner 247247
Growth Leader in Cyclical Industry
BorgWarner Outpaces Industry SalesOur sales have grown five times faster than North American
vehicle sales when indexed to 1989 (1989 equals 100).
millions of dollars, except per share data
Letter to Shareholders 2
Business Profile 4
Engines 6
Power Transfer 12
Financial Review 17
Corporate Information 44
Inside Back Cover Board of Directors and Officers
BorgWarner, driven by its pursuit of powertrain leadership and the passion of its
people, is harnessing the momentum of worldwide technology changes in cars and trucks to
propel profitable growth. Our expertise in engines and power transfer translates into cleaner
air and improved performance for vehicles that are also fun to drive, secure and affordable.

John F. Fiedler, Chairman and Chief Executive Officer
“Our commitment to growth through
powertrain product leadership is a
reaffirmation of the potential of our heritage.”

68%
Americas18%
EuropeGrowth By Market Combined Worldwide Sale s••
3
TO OUR SHAREHOLDERS The past year has been one of
our most ambitious and successful. Earnings rose 27% per
share; sales climbed 34%. A number of factors drove our
record results:
• Increased BorgWarner content in new engine and auto-
matic transmission programs that improve fuel economy
and emissions
• Strong global auto production
• The continued popularity of sport-utility vehicles and
light trucks
• Strong internal growth boosted by acquisitions
As a result, we entered 2000 with a
solid base in powertrain technol-
ogy that should fuel profitable
growth, but with a frus-
tration that our share price does not reflect our
earnings potential. Our accomplishments in
1999 track our growth plan illustrated here:
• Strong internal growth accounted for over one-
third of our sales increase in 1999. Each of our
businesses delivered solid results. Of our 15%
annual sales growth since 1994, 64% has come
from existing operations.
• Our engine management technology was
expanded with the strategic acquisitions of turbo-
charger and cooling systems businesses.
Integration of these operations is underway,
with gains in market shares and operating mar-
gins anticipated. Two major acquisitions in one
year were challenging, but they complete a
significant part of our plan.
• Four new cross-business project teams are developing leading-
edge powertrain products. These projects range from
automating manual transmissions and providing electronic
front-wheel drive based four-wheel drive solutions to elimi-
nating turbo lag and creating on-demand pump technology.
Some of these projects are highlighted in this report.
• Our anticipated new business over the next three years is
significantly higher than past levels, demonstrating the value
of our commitment to research and development. Over this
period, engine-related sales comprise about 70% of the new
business, including major European turbocharger programs
and the largest global engine program ever launched.
• Moving our people toward a culture of product leadership
includes linking employee interests more closely with those
of shareholders. The connection has been strengthened
between employee compensation at all levels and creating
value through better returns on our investments. An additional
element of executive compensation is directly tied to total
shareholder returns.
We stated in 1998 that, given the opportunities we had
identified within our powertrain focus, we could double the
size of the company by 2004 while delivering propor-
tional earnings and returns. This is not growth for
growth’s sake but achieving our full potential and
positioning us for the future.
Throughout our history we have been
expert at capitalizing on tech-
nology changes — catching
technology waves. The
sport-utility vehicle wave created double-digit
growth through 1997. As that wave crested, we
moved aggressively to catch the wave of oppor-
tunity in engines. About half of our revenues in
2000 is expected to come from engine manage-
ment components and systems. Beyond engines,
we are creating new waves with leading-edge
concepts in transmissions and in passenger-car-
based four-wheel drive systems. This versatility
is nothing new. BorgWarner has been innovating
since 1928.
During 1999, we delivered record earnings and
rewarded employees for economic value creation.
Our stock price, however, was down almost 20%.
I could cite the negative performance of the entire
auto sector and indeed most manufacturing stocks,
but it would not change the deep disappointment
which all shareholders, including me, have felt.While I believe
that the value of our earnings growth will ultimately be
recognized in the marketplace, we continue to explore addi-
tional ways to reward shareholders that take advantage of our
earnings power. Because I believe in our strategy and our
people, I maintain my strong conviction that if you wish to
own only one auto stock, that stock should be BorgWarner.
Sincerely,
John F. FiedlerChairman and Chief Execut ive Of f icer
2004
1998
Acquisitions
BORGWARNER GROWTH STRATEGY
CURRENTBUSINESS
EXISTING BUSINESSES
TECHNOLOGYOPPORTUNITIES
Internal GrowthCROSS
BUSINESS
EX
TE
RN
AL
14%
Asia•
IN
TE
RN
AL

B U S I N E S S D E S C R I P T I O N
Global leader in the design and manufacture of automotive chain systems and components for enginetiming, automatic transmission andfour-wheel drive applications.
G R OW T H O P P O R T U N I T I E S
• Timing chain systems for direct injected diesel engines
• Engine timing systems moving from belts to chains in Japan and Europe
• Growth of overhead cam engines
• Systems integration; alternative technologies
• Chain belts and HY-VO pump drives for continuously variable transmissions
• MORSE GEMINI chain systems fornoise reduction
PLANTS AND TECHNICAL CENTERS
HEADQUARTERS: Ithaca, New York
Arcore, ItalyGuadalajara, MexicoIthaca, New YorkNabari City, JapanSimcoe, Ontario, CanadaTainan Shien, Taiwan
1 9 9 9 H I G H L I G H T S
Sales are up 9%, reflecting the continuedpopularity of light trucks and sport-utilityvehicles. Four-wheel drive system sales toFord light trucks and sport-utility vehiclesand the Mercedes M-Class All-ActivityVehicle are strong. Exports of four-wheeldrive (4WD) transfer cases to Korearecover. Development work intensifies onnew all-wheel drive (AWD) systems forpassenger cars and cross-over vehicles,attracting new customer interest.
B U S I N E S S D E S C R I P T I O N
Leading independent global designerand producer of transfer cases andsystems for four-wheel and all-wheeldrive vehicles for the sport-utility, lighttruck and cross-over vehicle markets.Systems enhance driver safety, security,driveability and ease of use.
G R OW T H O P P O R T U N I T I E S
• Continued popularity of 4WD in anestablished market segment
• Growing popularity of 4WD/AWDpassenger cars and cross-over vehicles
• European and emerging markets
• Application of electronically controlledtorque management expertise inalternative technologies
PLANTS AND TECHNICAL CENTERS
HEADQUARTERS:Sterling Heights, Michigan
Beijing, China (49% JV)Cary, North CarolinaLivonia, MichiganLongview, TexasMargam, WalesMuncie, IndianaPune, India (60% JV)Seneca, South CarolinaSirsi, India (60% JV)
B U S I N E S S D E S C R I P T I O N
Leading designer and manufacturer of turbochargers for the passenger car and commercial vehicle markets.
G R OW T H O P P O R T U N I T I E S
• Direct injected diesel engines
• Emissions/ fuel economy needs
• Emerging applications on light trucksand sport-utility vehicles
• New technologies such as variablegeometry
PLANTS AND TECHNICAL CENTERS
HEADQUARTERS: Indianapolis, Indiana
Asheville, North CarolinaBradford, EnglandCampinas, BrazilKirchheimbolanden, Germany
Kysor/WestranByron, Illinois
1 9 9 9 H I G H L I G H T S
Sales rise 60%. Strong demand for Morse TEC chain products and systems for engines,automatic transmissions and four-wheel drive boosts sales of these products. Acceleratingdemand for European passenger car turbochargers continues to fuel Turbo Systems’ results.To better serve the growing market for turbochargers, Kuhlman Corporation is acquired in March. Facilities in Germany and Japan are expanded to accommodate new business.
M O R S E T E C T U R B O S Y S T E M S
S A L E S
99999898979796969595 405.5
476.8613.6
518.8563.3
millions of dollarsS A L E S
9998979695 257.6
276.6349.0
536.2856.0
millions of dollars
4
MORSE TEC | TURBO SYSTEMS TORQTRANSFER SYSTEMS

AIR/FLUID SYSTEMS TRANSMISS ION SYSTEMS COOLING SYSTEMS
1 9 9 9 H I G H L I G H T S
Sales are up 40%. Demand for emissionreduction products and transmissioncontrol modules drives growth, along withthe inclusion of an acquired fuel systemsbusiness from Kuhlman Corporation.Electronic and electromechanicalexpertise supports new cross-businesssystems growth opportunities.
B U S I N E S S D E S C R I P T I O N
Full service supplier of air inductionand fluid control systems and electro-mechanical components, for enhancedengine and transmission performance,reduced emissions, fuel vapor recovery,and increased vehicle safety.
G R OW T H O P P O R T U N I T I E S
• Market consolidation of suppliers instrong strategic product segments
• Phase-in of new emission regulationsin Europe and North America
• Direct injected gasoline and diesel engines
• Increased use of electronics andelectromechanical actuation forunderhood applications
PLANTS AND TECHNICAL CENTERS
HEADQUARTERS: Warren, Michigan
Blytheville, ArkansasBuffalo, New YorkCharlotte, North CarolinaChester, South CarolinaDixon, IllinoisGrand Rapids, MichiganRothbury, MichiganSallisaw, OklahomaSpringfield, OhioSpring Lake, MichiganTulle, FranceWater Valley, MississippiWhite Pigeon, Michigan
S A L E S
1 9 9 9 H I G H L I G H T S
Sales are up 16%, excluding soldproduct lines. The group sees growth in revenues from increased Europeanautomatic transmission production, forboth home and export markets. Demandremains strong in North America, drivenby record light vehicle production andnumerous new transmission programs.Business conditions have stabilized inJapan while a strong recovery is under-way in Korea. Development of new sys-tems to automate manual transmissionsprogresses into prototype and testingphases with European customers.
B U S I N E S S D E S C R I P T I O N
Supplies “shift quality” componentsand systems including one-way clutches,transmission bands, friction plates,and clutch pack assemblies to virtuallyevery automatic transmission makerin the world.
G R OW T H O P P O R T U N I T I E S
• Move from four- to five- to six-speedtransmissions
• Shift from components to sub-systems strategy
• Development of subsystems forcontinuously variable transmissions (CVT)
• Automation of manual transmissions
• Substitution of modular wet startingclutches for torque converters
PLANTS AND TECHNICAL CENTERS
HEADQUARTERS: Lombard, Illinois
Bellwood, IllinoisColdwater, MichiganEumsung, Korea (80% JV)Frankfort, IllinoisFukuroi City, Japan (50% JV)Heidelberg, GermanyKetsch, GermanyLombard, Illinois (Aftermarket)Margam, WalesSterling Heights, Michigan
1 9 9 9 H I G H L I G H T S
Group is created from the 1999 acquisitions of the Fluid Power Divisionof Eaton Corporation and the coolingbusiness of Kuhlman Corporation.The moves create the world leader inhighly engineered engine cooling systemsolutions for improved engine temperaturemanagement. Worldwide operationspresent opportunities for marketpenetration and market share gains.
B U S I N E S S D E S C R I P T I O N
Global leader in the design and supplyof cooling system fan clutches and fansprimarily for the sport-utility, light truckand commercial vehicle markets.
G R OW T H O P P O R T U N I T I E S
• Continued popularity of light truck and SUVs
• Consolidation of supplier base in commercial vehicles
• European, South American and Asian market expansion
• Module development agreements with other key suppliers
• Emission regulations related to diesels
PLANTS AND TECHNICAL CENTERS
HEADQUARTERS: Marshall, Michigan
Bradford, EnglandCadillac, MichiganChangwon, South KoreaFletcher, North CarolinaGainesville, GeorgiaHengoed, WalesIndianapolis, IndianaMarkdorf, GermanyNingbo, China (70% JV)São José dos Campos, Brazil
5
9998979695 97.8
242.7342.4351.4
491.5
millions of dollars S A L E S
99999898979796969595 378.1
392.2369.4
355.0413.4
millions of dollars S A L E S
99 142.8
millions of dollars

F U E L E C O N O M Y
A I R Q UA L I T Y
TIMING AND COOLING SYSTEMS
T U R B O C H A R G E R S &A I R M A N AG E M E N T
EnginesEngines
T R E N D S T E C H N O L O G Y
R E S U L T S
EnginesMore power, less waste. We add value as a partner
in the development of new engines. Our technology
makes them quieter, better performing, cleaner
burning and more fuel-efficient and durable.
More power, less waste. We add value as a partner
in the development of new engines. Our technology
makes them quieter, better performing, cleaner
burning and more fuel-efficient and durable.
6

➜
➜
➜
➜
Timing Chain/Systems Chain types include inverted tooth silent, small pitchsilent and roller chain; crankshaft and cam shaftsprockets; tensioners and snubbers; engine accessoryand balance shaft drive components, variable valvetiming systems
TurbochargersTurbochargers with water-cooled bearing housings;integrated boost pressure control valves and waste-gates; variable sliding ring turbines; exhaust manifoldswith integrated turbine housings; compressor housingswith integrated recirculation valves; two-stage turbo-charging systems
Air Management/Emission SystemsProgram management and software and system design;air induction and secondary air systems; throttle bodies,electric vacuum regulators, exhaust gas recirculationvalves, solenoids, control valves, oil pumps
Cooling Systems Integrated cooling modules; electronically and mechan-ically controlled air sensing and coolant sensing fanclutch products; nylon and metal engine cooling fans
➜
➜
➜
➜
D I E S E LD I E S E L
G A S O L I N EG A S O L I N E
7
Timing Chain/SystemsChain types include inverted tooth silent, MORSEGEMINI, small pitch silent and roller chain; sprockets,tensioners and snubbers; torsional absorbing shaftdrives; engine accessory components
TurbochargersSingle, twin entry and water-cooled turbine housings;integrated boost pressure control valves and wastegates;variable geometry and variable sliding ring turbines;exhaust manifolds with integrated turbine housings;two-stage turbocharging and turbocompound systems
Air Management/Emission Systems Program management, device software and systemdesign; variable turbine geometry control; electronicthrottle control; air induction systems; throttle bodies,electric vacuum regulators, exhaust gas recirculationvalves, solenoids, control valves
Cooling SystemsIntegrated cooling modules; electronically and mechan-ically controlled air sensing and coolant sensing fanclutch products; nylon and metal engine cooling fans

The demand for turbochargers is exploding, especially in Europe, where direct injected diesel engines are
powering more and more passenger cars. For both diesel and gas-powered vehicles, turbochargers lower fuelconsumption, allow smaller engines to provide the power of larger ones, and reduce emissions. That’s because
turbochargers use exhaust gases to boost engine power by delivering more air to the engine for a cleaner,leaner burn. To meet demand, we are expanding capacity and improving manufacturing efficiencies.
K I R C H H E I M B O L A N D E N , G E R M A N Y
1998 UNITS 2004 UNITS
TURBOCHARGER GROWTH
T U R B O C H A R G E R S
From left to right:
Klaus-Peter Dörle, Edeltraut Wahl, Günter Krämer
BorgWarner Turbo Systems
The worldwide market for passenger car turbo-chargers is expected to grow 72% by 2004.
Europe 3,250,000 +23% 6,000,000
Japan 650,000 +85% 800,000
Europe 485,000 +106% 1,000,000
Japan 775,000 +85% 800,000 Gas
olin
e
D
iese
l

Driven by higher-torque, more efficient gas and diesel engines, the move is on from simple chain or belt-driven
engine components to more durable, quiet and smaller chain systems. In North America, the development of
overhead cam engines is creating demand. In Europe, the growth driver is direct injected diesel engines.
In Japan, carmakers are developing new generation engines with chain drives for sales worldwide. Production
for the first program is underway, with rollout expected across five vehicle platforms.
C H A I N D R I V E S Y S T E M S
Engine Chain Potential
98 03
Chain Engines
100%
90%
80%
70%
60%
50%
40%
30%
20%
10%
0
Belt Engines
Western Europe33% Growth
Japan115% Growth
North America7% Growth
98 03 98 03
9
➞
J AP A N

With our new entry in engine management, we are a leading supplier of highly engineered cooling
systems. Our products can improve fuel economy and enhance emission reductions in SUVs, light trucks and
commercial vehicles. Growth will come from market expansion and share gains, and from the move to integrated
cooling modules. Modules will combine electronics, aerodynamics and materials science for lighter weight,
greater efficiency and precise fan control, to ultimately improve fuel economy and maximize cooling potential.
C O O L I N G S Y S T E M S F O R D F - 1 5 0 S E R I E S
IN
TE
GR
AT
ED
MO
DU
LE
SW
IL
LD
RI
VE
GR
OW
TH

Innovation in air and fluid management is expanding as concern for air quality grows. We are developing
integrated solutions that improve performance and reduce emissions. These include active air inductionsystems for all types of engines; electronic valves and controls for more precise engine control; more responsive
electronic throttle control systems for gasoline engines; and specialized oil pumps that facilitate higher
powertrain efficiency. The move to higher-volt electrical systems also creates opportunities for on-demandsystems that run only when needed.
A I R Q U A L I T Y
Catching Technology Waves
15% Engines
40% 4WD
45% AT
50% Engines
22% 4WD
28% AT
➞
➞
➞
As technology change creates opportunity,engine components and systems are ournew growth catalyst.
Trucks and SUVs will need to meet the same emission standardsas cars by 2004. Carmakers must deliver fuel economy across their
fleet of vehicles. Air particulates (smog: NOx) are main concern.
Strict emission requirements are being phased in by 2005. Carbonemissions that have been linked to global warming are main focus.
Lower cost diesel fuel burns cleaner in new turbocharged engines.
Congestion in cities brings increasing
focus on government regulations. High
fuel prices. Smog and global warming are
issues, balanced against basic trans-portation and infrastructure needs.
11
E U R O P E
U S A
J A P A N / A S I A
➞
2000 Sales1997 Sales

Power Transfer
RWD
FWD
4WD MARKET D IRECTION
Electronically controlled, dr iveable power —
We’re experts at how to take raw engine output and
transfer it through the drivetrain. From smooth
shifts to four-wheel drive control, our proprietary
expertise moves the world’s cars and trucks.
Korea
North America
Europe
Japan
12
AUTOMATIC TRANSMISS ION PRODUCTION
VEHICLEBASE
0
5
10
15
20
25
30
2003200220012000199919981997
MIL
LIO
NS
OF
UN
ITS
0
1
2
3
4
5
6
2009200820072006200520042003200220012000
MIL
LIO
NS
OF
VE
HIC
LE
S
WO R L DW I D E

➜
➜
Traditional AutomaticsShift quality components and systems including trans-mission bands, friction plates, clutchpack modules,one-way and bi-directional clutches and clutch sys-tems; torque converter lockup clutches; solenoids andcontrol modules; HY-VO chain and sprocket systems;transmission pumps
Continuously VariableWet starting clutches, forward/reverse shifting compo-nents and systems; CVT chain belts, HY-VO pumpdrives; electro-hydraulic control devices and systems
Automated ManualsWet clutch modules; electro-hydraulic control modules
AUTOMATEDTRANSMISSIONAUTOMATED
TRANSMISSION
TORQUEMANAGEMENT
TORQUEMANAGEMENT
13
Rear-Wheel Drive Four-Wheel Drive(SUVs and light trucks)
Part-time, full-time and on-demand transfer cases;automatic locking hubs; synchronizers; electronic con-trol units; sensors and actuators; 4WD chain; clutchsystems; pumps; electronic controls
Front-Wheel Drive AWD/4WD(passenger cars and cross-over vehicles)
Torque management systems and devices

A U T O M A T I C / M A N U A L
A new transmission concept that is as fuel efficient and fun to drive as a manual but feels like an automatic,
is exciting automakers throughout Europe. That’s good news for drivers in congested cities using cellulartelephones and for carmakers with manual transmission production facilities. We are the first to marry
wet clutch technology with controls expertise to provide both a smooth automatic shift and a manual option.
A cross-business project, it creates a $1 billion new market opportunity.
European Transmission Market
K E T S C H , G E R M A N YFrom left to right:
Eric Sandstrom, Katharina Skop-Cardarella
Automated Manual Cross-Business Team
TraditionalAutomatic
Manual AutomatedManual
Continuously Variable
1 9 9 8 2 0 0 8
Automatic transmissions, both auto manualsand traditional automatics, are expected togrow from 18% to 55%.
�

I N F I N I T Y
50%
456
SP
EE
DS
PE
ED
SP
EE
D
15
R E INVENT ING TRANSMIS S IONSThe automatic transmission will continue to be the shift mode of choice in North America, Japan, Korea, and
a growing portion of Europe. Along with developing alternative technologies, we are also reinventing traditionaltransmissions for improved fuel efficiency and shift quality. Five-speed transmissions are emerging in Europe
and Japan. On the horizon are six-speed transmissions, more outsourcing of subsystems by automakers, the
continued development of advanced friction materials, and “smart” transmissions where a computerized
“brain” function is built right into a transmission.
Au
tom
atic
transmissions shift ab
ou
t
of
vehicles produced each
yea
r.

T O R Q U E M A N A G E M E N T
Imagine the security of electronic four-wheel drive, like that in large sport-utility vehicles, but in small, affordable
systems for passenger cars and small SUVs. That’s our next great idea in four-wheel drive. Beyond the
passive systems of today’s small SUVs, we’ve patented technology to integrate torque management in front-wheel drive cars and trucks, creating one of the most responsive four-wheel/all-wheel drive systems yet. Watch
for it in mini-vans, station wagons and cross-over vehicles, the first of which roll off production lines in 2001.
FWD 4X4 GROWTH BY REGION
Active AWD: fast response maintains control
Passive AWD: slower response limits control
{
}
VE
HIC
LE
S (
MIL
LIO
NS
)
North America
D E T R O I T , M I C H I G A N , U S AFrom left to right:
Chris Kowalsky, Robert Meilinger, Chris Blair
Integrated Torque Management Cross-Business Team
VEHICLE DYNAMICS
WesternEurope
Japan
0
.2
.4
.6
.8
1.0
1.2
1.4
2004200220001998

Management’s Discussion andAnalysis of Financial Conditionand Results of Operations 18
Management’s Responsibility for Consolidated FinancialStatements 25
Independent Auditors’ Report 25
Consolidated Statements 26
Notes to Consolidated Financial Statements 30
Selected Financial Data 43
Corporate Information 44
S O L I D S A L E S G ROW T H
3000
2500
2000
1500
1000
500
01992 1993 1994 1995 1996 1997 1998 1999
S A L E S D I S T R I B U T I O N B Y M A R K E T
2%Renault/Nissan
4% VW-Audi6% Toyota
12% GM
31% All Others
17%
DaimlerChrysler
28% Ford
1993 1994 1995 1996 1997 1998 1999
150
120
90
60
30
0
R I S I N G N E T I N C O M E
1 9 9 9
millions of dollars
Combined Worldwide Sales
millions of dollars
CombinedWorldwide
Sales
ConsolidatedWorldwide
Sales
17

MANAGEMENT’S DISCUSSION AND ANALYSIS OF FINANCIAL CONDITION AND RESULTS OF OPERATIONS
B O R G W A R N E R
result of the acquisitions described above. TorqTransfer Systems was
previously named Powertrain Systems and Transmission Systems
was previously known as Automatic Transmission Systems. The name
changes were made to recognize the expanded growth opportunities
for each of these businesses. The segments are profiled on pages 4
and 5. The following tables detail sales and earnings before interest
and taxes (“EBIT”) by segment for each of the last three years.
Net Salesmil l ions o f do l lar s
Y E A R E N D E D D E C E M B E R 3 1 , 1999 1998 1997
Air/Fluid Systems $ 491.5 $ 351.4 $ 342.4
Cooling Systems 142.8 — —
Morse TEC 856.0 536.2 349.0
TorqTransfer Systems 563.3 518.8 613.6
Transmission Systems 413.4 355.0 369.4
Divested operations 41.3 121.1 150.2
Intersegment eliminations (49.7) (45.7) (57.6)
Net sales $2,458.6 $1,836.8 $1,767.0
Earnings Before Interest and Taxesmil l ions o f do l lar s
Y E A R E N D E D D E C E M B E R 3 1 , 1999 1998 1997
Air/Fluid Systems $ 44.9 $ 25.1 $ 15.1
Cooling Systems 18.2 — —
Morse TEC 112.9 78.5 64.7
TorqTransfer Systems 41.2 28.4 46.4
Transmission Systems 54.1 42.7 56.4
Divested operations (5.0) 2.0 (3.2)
Earnings before interest and taxes $266.3 $176.7 $179.4
Air/Fluid Systems experienced increases in sales and EBIT of $140.1
million and $19.8 million, or 39.9% and 78.9%, respectively, compared
to the prior year. Net of the effects of the Kuhlman Acquisition, sales
and EBIT increased by $42.5 million, or 12.1%, and $10.3 million, or
41.0%, respectively. The increases were largely attributable to increased
demand for emission reduction products and transmission solenoids.
The increase in 1998 sales to $351.4 million was due largely to changes
in transmission solenoid production for a new Chrysler transmission and
increased demand for air induction modules on Chrysler LH vehicles.
Air/Fluid Systems remains a substantial opportunity for growth because
of the increased worldwide emphasis on improved operating efficiency
and reduced emissions, both of which can be realized through improved
engine air and fuel management. Other opportunities in the coming
I N T RO D U C T I O NBorgWarner Inc. (formerly Borg-Warner Automotive, Inc.) (the
“Company”) is a leading global supplier of highly engineered systems
and components for powertrain applications. Its products are manu-
factured and sold worldwide, primarily to original equipment manu-
facturers (“OEMs”) of passenger cars, sport-utility vehicles, trucks,
commercial transportation products and industrial equipment. The
following significant acquisitions and divestitures have strengthened
the product leadership focus of the Company in recent years.
In March 1999, the Company acquired Kuhlman Corporation
(“Kuhlman Acquisition”), a manufacturer of vehicle and electrical prod-
ucts. The electrical products businesses did not fit the Company’s
strategic direction and were sold later in 1999 as planned. The remain-
ing businesses, formerly known as the Schwitzer Group (“Schwitzer”)
and Kysor, primarily manufacture turbochargers, fuel systems, fans
and fan drives and HVAC. These businesses have been integrated into
the following operating segments: Air/Fluid Systems, Cooling Systems
and Morse TEC.
In October 1999, the Company acquired the Fluid Power Division of
Eaton Corporation (“Fluid Power Acquisition”), a leader in manufacturing
powertrain cooling solutions, and combined them with the Schwitzer
cooling businesses to form a new operating segment, Cooling Systems.
In October 1997, the Company acquired a majority interest in a
German turbocharger and turbomachinery manufacturer, AG Kühnle,
Kopp & Kausch (“AG Kühnle”). Since the turbomachinery business
does not fit the strategic direction of the Company, its results have
been excluded from the consolidated financial statements and it has
been reported as an investment held for sale. In October 1998, the
Company purchased 100% of AG Kühnle’s turbocharger business,
which is reported as part of the Morse TEC operating segment.
The divestiture of three businesses in recent years, historically included
in the Transmission Systems operating segment, also affect year-over-
year comparisons. In 1999, the Company sold its forged powder metal
race business. The sales of the forged powder metal connecting rod
business and the torque converter business were completed in 1998.
These acquisitions and divestitures are discussed in more detail later in
this analysis.
R E S U LT S O F O P E R AT I O N S
Results by Operating Segment
The Company’s products fall into five reportable operating segments:
Air/Fluid Systems, Cooling Systems, Morse TEC, TorqTransfer Systems
and Transmission Systems. Cooling Systems was added in 1999 as a
18

MANAGEMENT ’S DISCUSSION AND ANALYSIS OF FINANCIAL CONDITION AND RESULTS OF OPERATIONS
stabilization or reversal of certain factors which had deflated 1998
results, including reductions in four-wheel drive (“4WD”) transfer case
shipments for the Ford F-150 truck and declines in 4WD transfer case
shipments to Ssangyong in Korea due to the sluggish Asian economy.
Significantly higher 4x4 installation rates on Ford V8 and small pick-up
trucks in 1999 and the continued popularity of SUVs and light trucks
also enhanced results.
TorqTransfer Systems 1998 sales trailed exceptional 1997 results by
$94.8 million. Strong 4x4 installation rates on the Ford Ranger and a
full year of sales on the Mercedes-Benz M-Class All-Activity Vehicle
launched in 1997 were only partially able to offset the negative impact
of the 1998 factors discussed above.
While sales are expected to remain strong, the revenue growth for
TorqTransfer Systems is not expected to return to 1997 levels. Sales
are expected to be fairly level over the next few years and efforts will
be made to keep cost reductions in line with selling price concessions
given to customers. Market expansion into 4WD for front-wheel drive
passenger cars, currently under development, is expected to stimulate
growth longer-term.
Transmission Systems, net of the businesses divested in 1999 and
1998, showed increases in sales and EBIT of $58.4 million and $11.4
million, or 16.5% and 26.7%, respectively, versus the prior year. Of the
Company’s operating segments, Transmission Systems benefited most
from the strong worldwide automotive production in 1999 because of
the segment’s global diversification and application to passenger cars,
SUVs and light trucks. Comparisons are also enhanced by the absence
of the 1998 North American GM strike and the stabilization of the Asian
economy in 1999.
The segment experienced a 3.9% decrease in sales in 1998 from 1997.
Strong sales in Europe did not offset the negative impact of the North
American GM strike and the weakness of the Asian economy. Customer
product mix issues also heavily impacted this segment, particularly the
industry-wide shift in emphasis from passenger cars to trucks.
Transmission Systems expects strong results in the coming years based
on industry trends and opportunities to develop and provide entire sub-
systems for future generations of automatic transmissions and system
solutions for alternative drivetrain configurations, including continuously
variable transmissions and automated manual transmissions. Increased
penetration of automatic transmissions and increased content as auto-
matic transmissions trend from four- to five-speed and from five- to six-
speed transmissions should also provide opportunities.
years include control devices for automated manual transmissions, and
because of the fragmented nature of the supplier base in this segment,
system solutions for fuel economy and emission requirements.
Cooling Systems, formed as a combination of the Fluid Power
Division acquired from Eaton Corporation and the commercial cooling
businesses acquired in the Kuhlman Acquisition, represents a new
growth platform for the Company. Sales of viscous fan clutches, on-
off fan drives and fans providing better fuel economy and improved
emissions in a full range of sport-utility vehicles (“SUV”), light trucks
and commercial vehicles are expected to provide strong growth in the
coming years. For the abbreviated portion of 1999 that these businesses
were owned by the Company, they contributed sales of $142.8 million
and EBIT of $18.2 million.
The Morse TEC business segment experienced continued growth
in 1999 as sales and EBIT increased by $319.8 million and $34.4 mil-
lion, respectively. Net of the effect of the Kuhlman Acquisition, sales
increased by $129.7 million, or 24.2%, and EBIT improved by $26.3
million, or 33.5%. Year over year comparisons benefit from elevated
worldwide demand for engine timing systems, and the increased
proportion of direct-injection diesel engines with turbochargers in
European passenger cars. The Company expanded its European
turbocharger capacity during 1999, and will continue to expand in the
future, in an effort to capitalize on this trend.
Morse TEC sales revenue increased $187.2 million in 1998 from 1997,
and, net of the turbocharger business acquired in 1997, sales increased
by $29.2 million, or 9.0%. Strong North American demand more than
offset weakness in Asia and the impact of the 1998 General Motors
(“GM”) strike.
The strong growth trend at Morse TEC is expected to continue in the
coming years as turbocharger capacity is increased to meet ramped-
up demand on direct-injection diesel passenger cars and as new
generations of variable geometry turbochargers for commercial diesel
applications are introduced. These factors are expected to translate
into double-digit growth rates for this segment. The introduction of
additional new products, including timing systems for Chrysler over-
head cam engines, other timing systems, transmission applications,
and drive chain for the new Toyota hybrid engine and other Japanese
applications are expected in the coming years. This segment is also
expected to benefit from the conversion of engine timing systems from
belts to chains in both Europe and Japan.
TorqTransfer Systems’ sales and EBIT rebounded from 1998,
increasing by $44.5 million and $12.8 million, or 8.6% and 45.1%,
respectively. The improvements over 1998 were largely related to the
19

MANAGEMENT ’S DISCUSSION AND ANALYSIS OF FINANCIAL CONDITION AND RESULTS OF OPERATIONS
B O R G W A R N E R
by 4.2%, including increases of 9.5% and 1.0% in North America and
Japan, respectively, while Western European production was essentially
flat. The Schwitzer and Kysor businesses which were owned for ten
months in 1999 contributed $381.3 million to sales and the Fluid Power
businesses, which were owned for the last three months of 1999 con-
tributed $46.8 million to sales.
Net earnings for 1999 of $132.3 million, or $5.07 per diluted share,
were 39.7% above 1998 earnings of $94.7 million, or $4.00 per diluted
share. The primary growth drivers, as discussed above, were strong
global automotive markets, growth in engine timing systems applica-
tions and strong demand for turbochargers, especially in European
passenger cars, increased content on new generations of transmis-
sions, improvements in 4x4 installation rates on light trucks and acqui-
sitions. Improvements over 1998 also reflect the absence of the 1998
GM strike and the improved condition of the Asian economy in 1999.
Gross margin for 1999 was 23.2%, an improvement from 1998 and
1997 margins of 21.0% and 22.2%, respectively. While the increase is
partly attributable to higher margin businesses acquired during the year,
the Company’s core businesses also showed gross margin improve-
ment, despite price reductions to customers of approximately $35
million in 1999, as compared to $23 million and $18 million in 1998
and 1997, respectively. To offset the impact of price reductions, the
Company actively pursues offsetting reductions from its suppliers and
changes in product design to remove cost and/or improve manufactura-
bility. The Company was nearly able to offset price concessions with
cost reduction and productivity improvement programs. The relatively
high level of worldwide automobile and light truck production also
contributed to the margin improvement through economies of scale.
Consolidated EBIT increased by $88.6 million. For the businesses held
for all periods, the increase was $58.8 million. Although depreciation
as a percentage of sales decreased somewhat in 1999, depreciation
expense increased by $16.5 million as a result of the additional busi-
nesses acquired in 1999 as well as the relatively higher levels of capital
spending in recent years. The acquisitions also increased amortization
expense in 1999 by $15.3 million over the prior year. Together, depreci-
ation and amortization expense remained at 5% of sales. Selling, gen-
eral and administrative expenses (“SG&A”) as a percentage of sales
increased to 8.3% from 7.4%. The increase resulted from the acquisi-
tion of businesses with higher SG&A spending levels, as well as the
Company’s continued commitment to research and development
(“R&D”) in order to capitalize on growth opportunities. R&D spending
increased to $91.6 million, or 3.7% of sales, in 1999, as compared with
Divested operations includes three divested Transmission Systems
businesses; the forged powder metal race business sold in 1999, and
the torque converter and connecting rod businesses sold separately in
1998. These businesses did not fit the strategic goals of the Company
and management believed the Company’s resources were better spent
on its core technologies in highly engineered components and sys-
tems. The sales of these businesses did not result in a significant gain
or loss in any of the years presented. Together, these businesses con-
tributed sales of $41.3 million, $121.1 million and $150.2 million and
EBIT of $(5.0) million, $2.0 million and $(3.2) million in 1999, 1998 and
1997, respectively.
The Company’s top ten customers accounted for approximately 75%
of consolidated sales compared to 81% in 1998 and 84% in 1997.
The decline in the overall percentage of sales to the top ten customers
resulted from new customers gained through acquisitions. Ford con-
tinues to be the Company’s largest customer with 31% of consolidated
sales in 1999, compared to 36% and 43% in 1998 and 1997, respec-
tively. DaimlerChrysler, the Company’s second largest customer, repre-
sented 19%, 19% and 14% of consolidated sales in 1999, 1998 and
1997, respectively, and GM accounted for 13%, 16%, and 20%, respec-
tively. No other customer accounted for more than 10% of sales in any
of the periods presented.
OT H E R FAC TO R S A F F E C T I N G R E S U LT S O F O P E R AT I O N SThe following table details the Company’s results of operations as a
percentage of sales:mil l ions o f do l lar s
Y E A R E N D E D D E C E M B E R 3 1 , 1999 1998 1997
Net sales 100.0% 100.0% 100.0%
Cost of sales 76.8 79.0 77.8
Depreciation 3.7 4.1 4.0
Selling, general and
administrative expenses 8.3 7.4 7.5
Goodwill amortization 1.3 0.9 1.0
Minority interest, affiliate earnings
and other income, net (0.5) (0.5) (0.6)
Earnings before interest and taxes 10.4% 9.1% 10.3%
1999 compared with 1998
Overall, the Company realized a 33.9% sales growth in 1999 versus
1998. While much of the increase was related to acquisitions, internal
growth from businesses held for both periods amounted to 14.7%. As a
comparison, worldwide automobile and light truck production increased
20

MANAGEMENT ’S DISCUSSION AND ANALYSIS OF FINANCIAL CONDITION AND RESULTS OF OPERATIONS
In particular, the weakness of the Asian economy impacted earnings
by approximately $.60 per share, while the GM strike cost the Company
approximately $.30 per share in earnings. The effects of the Asian down-
turn were most damaging to the Transmission Systems and Morse TEC
business segments, as well as to affiliate earnings; the other segments
were less affected by Asia. The GM strike affected each of the business
segments, most significantly Transmission Systems and Morse TEC.
The Company experienced a decline in consolidated EBIT of 8.2% to
$167.6 million for 1998. For businesses held throughout both years,
the decrease was 14.9%. Depreciation continued to increase in 1998
due mainly to a full year of results from the turbocharger business and
increases in capital spending in recent years. SG&A as a percentage
of sales declined slightly to 7.4% from 7.5% as the Company continued
its commitment to keeping spending down in this area, apart from R&D.
The Company views spending on R&D as a key corporate strategy
necessary in order to develop proprietary new products and enhance-
ments to existing products. In 1998, R&D spending represented 3.5%
of sales versus 3.3% in 1997. In order to support its commitment to
product leadership, the Company plans to increase R&D spending in
the future.
Equity in affiliate earnings and other income was down $2.9 million
from 1997, including an $8.5 million decline in equity in affiliate earn-
ings. The decrease in equity in affiliate earnings is largely attributable
to the weakness of the Asian economy in 1998. As a result, the
Company’s equity in the earnings of NSK-Warner declined to $7.6
million in 1998 from $13.7 million in 1997. Partially offsetting the reduc-
tions in affiliate earnings were certain transactions of a non-recurring
or non-operating nature. The Company recorded a $3.3 million gain
on the sale of its 50% share of Warner-Ishi in 1998 and recorded a
$4.3 million charge in 1997 to reduce the carrying value of certain joint
venture investments in China and Korea.
Interest expense and finance charges increased by $2.3 million versus
1997. The Company incurred interest on its additional borrowings to pur-
chase the turbocharger business in October 1998 and also needed to
maintain slightly higher debt levels to finance operations because cash
flow from operations trailed prior year levels throughout much of 1998.
The effective tax rate for 1998 was 32.7% compared with a rate of 34.6%
for 1997. The tax rates for both years were below the standard federal
and state rates due to the realization of R&D and foreign tax credits.
$65.1 million, or 3.5% of sales in 1998. A number of cross-segment
R&D programs were initiated during 1999, which are expected to result
in increased revenues within a few years. The Company anticipates
R&D approaching 4.0% of sales in the coming years in order to support
its commitment to product leadership. At the same time, the Company
plans to concentrate on controlling non-R&D SG&A costs in order to
maintain SG&A levels near 8.0% of sales.
Equity in affiliate earnings and other income increased $3.8 million from
1998, mainly due to the improved results of the Company’s 50% owned
Japanese joint venture, NSK-Warner. The Company’s equity in NSK-
Warner’s earnings of $12.9 million was $5.3 million higher than the
prior year. Approximately two-thirds of the increase was attributable to
improved operating performance, with the remaining one-third due to
the stabilization of the yen in 1999.
The $22.3 million increase in interest expense and finance charges
is consistent with higher debt levels required to finance the two major
acquisitions in 1999 and rising interest rates in the U.S.
The effective tax rate for 1999 was 36.1% compared with a rate of
32.7% for 1998. The increase is largely due to the non-deductibility
of the goodwill associated with the Kuhlman Acquisition, as well as
increased income in higher tax jurisdictions.
1998 compared with 1997
The Company realized 4.0% sales growth in 1998 versus 1997 against
a backdrop of essentially flat worldwide automobile and light truck pro-
duction, with North American and Japanese production decreasing
1.4% and 8.5%, respectively, and European production increasing
6.5%. However, for businesses held throughout both years, the
Company’s sales declined 3.7%. The German turbocharger business,
AG Kühnle, contributed $182.9 million to 1998 sales, an increase of
$158.1 million over the two months the business was owned in 1997.
Two product lines sold during 1998, as discussed above, contributed
$73.5 million to 1998 sales, a decrease of $27.9 million from the prior
year. Factors cutting across each of the business segments that nega-
tively impacted the Company’s 1998 sales included the GM strike in
June and July of 1998 and the weakness of the Asian economy. These
external events deflated sales by approximately $25 million and $33
million, respectively.
Net earnings for 1998 totaling $94.7 million, or $4.00 per diluted share,
were 8.2% below 1997 earnings of $103.2 million, or $4.31 per diluted
share. The factors discussed above are responsible for the changes.
21

MANAGEMENT ’S DISCUSSION AND ANALYSIS OF FINANCIAL CONDITION AND RESULTS OF OPERATIONS
B O R G W A R N E R
Capital spending totaling $143.4 million in 1999 was $21.2 million
greater than in 1998. Approximately 55% of the 1999 spending was
related to expansion, as opposed to renewal and replacement, cost
reduction and other. Capital spending increased in all geographic
regions, including Europe and Asia, particularly in support of double-
digit sales growth for turbochargers and timing systems. Major capital
projects included the expansion of the Company’s facility in Japan
and its turbocharger operations in Germany. The Company anticipates
maintaining higher capital spending levels in 2000 to drive expansion.
Stockholders’ equity increased by $280.2 million in 1999. In addition
to the $149.8 million of common stock issued to partially finance the
Kuhlman Acquisition, net income of $132.3 million was partially offset
by dividends of $15.5 million. In relation to the dollar, the currencies in
foreign countries where the Company conducts business strengthened,
causing the currency translation component of other comprehensive
income to increase by $11.9 million in 1999.
The Company believes that the combination of cash from its operations
and available credit facilities will be sufficient to satisfy cash needs for
its current level of operations and planned operations for the foresee-
able future.
OT H E R M AT T E R S
Acquisition of Kuhlman Corporation
On March 1, 1999, the Company acquired all the outstanding shares
of common stock of Kuhlman Corporation (“Kuhlman”), for a purchase
price of $693.0 million. The Company also assumed $131.6 million of
Kuhlman’s existing indebtedness, which it subsequently refinanced.
The Company funded the transaction by issuing 3,287,127 shares
of BorgWarner Inc. common stock with a value of $149.8 million and
by borrowing approximately $543.2 million.
Kuhlman was a diversified industrial manufacturing company that
operated in two product segments: vehicle and electrical products. In
vehicle products, Kuhlman’s Schwitzer and Kysor units were leading
worldwide manufacturers of proprietary engine components, including
turbochargers, fans and fan drives, fuel tanks, instrumentation, heating/
ventilation/air conditioning systems, and other products for commercial
transportation and industrial equipment. The Company is in the process
of integrating the former Schwitzer and Kysor units and has included
their results since the date of the acquisition in the consolidated finan-
cial statements.
The electrical products businesses acquired from Kuhlman consisted
of Kuhlman Electric Corporation (“Kuhlman Electric”) and Coleman
Cable Systems, Inc. (“Coleman Cable”). These businesses manufactured
F I NA N C I A L C O N D I T I O N A N D L I QU I D I T YThe Company’s cash and cash equivalents decreased $22.3 million
at December 31, 1999 compared with December 31, 1998. The $542.4
million net cash paid for the Kuhlman Acquisition and the $313.1 million
net cash paid for the Fluid Power Acquisition were partly funded by
proceeds from long-term debt issuances and the excess of cash gen-
erated from operating activities over capital expenditures. In addition
to the cash paid, the Kuhlman Acquisition was funded by additional
consideration, including the issuance of $149.8 million of the Company’s
common stock, the increase in receivables sold by $25.0 million and
the assumption, and subsequent refinancing, of $131.6 million of debt.
On February 22, 1999, the Company issued $200 million of 6.5%
senior unsecured notes maturing in February 2009 and $200 million of
7.125% unsecured notes maturing in February 2029 to partially fund
the Kuhlman Acquisition. On September 28, 1999, the Company issued
$150 million of 8% senior unsecured notes maturing September 2019
to partially fund the Fluid Power Acquisition.
During 1999, the Company received a $30.3 million dividend and other
amounts from AG Kühnle. The dividend had no effect on cash flow
since the $30.3 million of AG Kühnle cash had been recorded on the
December 31, 1998 Consolidated Balance Sheet. Cash proceeds from
the sales of Kuhlman Electric, the forged powder metal race business
and the land and building remaining from the 1998 divestiture of the
torque converter business, amounting to $105.1 million, $45.5 million
and $11.5 million, respectively, were primarily used to lower the
Company’s long-term debt.
Operating cash flow of $344.5 million for 1999 exceeded 1998 operat-
ing cash flow by $211.9 million, and consists of $132.3 million of net
earnings, non-cash charges of $105.3 million and a $106.9 million
decrease in net operating assets and liabilities, net of the effects of
acquisitions and divestitures. Non-cash charges are primarily com-
prised of $91.3 million in depreciation and $32.1 million of goodwill
amortization, both of which increased compared to 1998. Depreciation
expense increased by $16.5 million due to the additional businesses
acquired in 1999 as well as the relatively higher levels of capital spend-
ing in recent years. The increase in goodwill amortization is attributable
to the Kuhlman and Fluid Power Acquisitions. The decreased investment
in net operating assets reflected in the December 31, 1999 balance
sheet is mainly due to decreased receivables and increased payables
and accrued expenses. The cash flow effect from a decrease in receiv-
ables was $41.1 million in 1999 due mainly to a major customer defer-
ring $33 million in payments at the end of 1998. This represented a
one-time reversing cash flow item as the payment was received in early
January 1999. Accounts payable and accrued expenses increased by
$57.9 million due to higher business levels.
22

MANAGEMENT ’S DISCUSSION AND ANALYSIS OF FINANCIAL CONDITION AND RESULTS OF OPERATIONS
Litigation
The Company and certain of its current and former direct and indirect
corporate predecessors, subsidiaries and divisions have been identified
by the United States Environmental Protection Agency and certain state
environmental agencies and private parties as potentially responsible
parties (“PRPs”) at various hazardous waste disposal sites under the
Comprehensive Environmental Response, Compensation and Liability
Act (“Superfund”) and equivalent state laws and, as such, may presently
be liable for the cost of clean-up and other remedial activities at 40
such sites. Responsibility for clean-up and other remedial activities at
a Superfund site is typically shared among PRPs based on an allo-
cation formula.
Based on information available to the Company, which in most cases,
includes: an estimate of allocation of liability among PRPs; the proba-
bility that other PRPs, many of whom are large, solvent public compa-
nies, will fully pay the cost apportioned to them; currently available
information from PRPs and/or federal or state environmental agencies
concerning the scope of contamination and estimated remediation
costs; remediation alternatives; estimated legal fees; and other factors,
the Company has established a reserve for indicated environmental
liabilities with a balance at December 31, 1999 of approximately $17.8
million. The Company expects this amount to be expended over the
next three to five years.
The Company believes that none of these matters, individually or in the
aggregate, will have a material adverse effect on its financial position
or future operating results, generally either because estimates of the
maximum potential liability at a site are not large or because liability
will be shared with other PRPs, although no assurance can be given
with respect to the ultimate outcome of any such matter.
Year 2000 Issues
Throughout 1998 and 1999, the Company was engaged in programs to
upgrade certain aspects of its operations to ensure that business systems
would continue to function effectively when year 2000 arrived or when
other potentially triggering dates were reached. These programs encom-
passed business operating systems, manufacturing operations, operat-
ing infrastructure, customers and suppliers. The Company used these
programs as an opportunity to upgrade and enhance many of its busi-
ness systems as well as to deal with year 2000 non-compliant items.
These efforts identified a few non-compliant items, substantially all
of which were dealt with on a timely basis. Items not corrected were
deemed to be non-critical or not having a failure mode. Corrections
were implemented throughout 1999, with most completed in accor-
dance with the timelines established by the Automotive Industries
Action Group (“AIAG”).
transformers for the utility industry and wire and cable for utilities and
other industries. These products did not fit the Company’s strategic
direction and, at the time of the Kuhlman Acquisition, the Company
announced that it intended to sell the businesses by the end of the
year. These businesses were accounted for as businesses held for
sale during 1999, and as such, no sales or income between the date
of acquisition and their dates of sale was included in the consolidated
results of the Company.
As of December 31, 1999, the Company has completed the sales of
both Kuhlman Electric and Coleman Cable. Kuhlman Electric was sold
to Carlyle Group, L.L.C. for a net sale price of $120.1 million, including
debt securities with a face value of $15.0 million. The sale of Coleman
Cable for a net sales price of $137.3 million to a group of equity
investors, closed into escrow as of December 30 and cleared escrow on
January 4, 2000. Proceeds included debt securities with a face value of
$15.3 million. Proceeds from the sales were used to repay indebtedness.
In the December 31, 1999 Consolidated Balance Sheet, the Company’s
net investment in Coleman Cable, is reflected as an asset held for sale
in current assets. The investment includes a portion of the goodwill
related to the merger. The amount of goodwill was allocated based on
the relative historical performance of the electrical products business
compared with the total Kuhlman business.
Acquisition of Eaton Corporation’s Fluid Power Division
Effective October 1, 1999, the Company acquired Eaton Corporation’s
Fluid Power Division, one of the world’s leading manufacturers of pow-
ertrain cooling solutions for the global automotive industry, at a total
cost of $321.7 million. To partially finance the acquisition, the Company
issued $150 million of 8% senior unsecured notes maturing September
2019. Cash from operations funded the remainder of the acquisition
price. The Fluid Power Division designs and produces a variety of vis-
cous fan drive cooling systems primarily for passenger vehicles such
as light trucks, sport-utility vehicles and vans. Along with the commer-
cial cooling systems business acquired from Kuhlman in March, 1999,
this acquisition positions the Company to globalize modular cooling
systems integration opportunities across a full range of vehicle types.
Sale of Forged Powder Metal Race Business
In October 1999, the Company sold its one-way clutch forged powder
metal race business in Gallipolis, Ohio to GKN Sinter Metals, Inc., a
subsidiary of UK-based GKN plc. GKN initially paid the Company $45.5
million in the fourth quarter, subject to a post-closing adjustment. No
significant gain or loss was recorded on this sale. The forged powder
metal business was originally acquired as part of the Company’s pur-
chase of the Precision Forged Products Division of Federal-Mogul
Corporation in 1995.
23

MANAGEMENT ’S DISCUSSION AND ANALYSIS OF FINANCIAL CONDITION AND RESULTS OF OPERATIONS
B O R G W A R N E R
value of all of its interest rate sensitive assets and liabilities would be
impacted by selected hypothetical changes in market interest rates.
Fair value is estimated using a discounted cash flow analysis.
Assuming a hypothetical, instantaneous 10% change in interest rates
as of December 31, 1999, the net fair value of these instruments would
decrease by approximately $45.2 million if interest rates decreased,
and would increase by approximately $40.3 million if interest rates
increased. The Company’s interest rate sensitivity analysis assumes
a parallel shift in interest rate yield curves. The model, therefore, does
not reflect the potential impact of changes in the relationship between
short-term and long-term interest rates.
Foreign currency risk is the risk that the Company will incur economic
losses due to adverse changes in foreign currency exchange rates.
The Company mitigates its foreign currency exchange rate risk princi-
pally by establishing local production facilities in markets it serves,
by invoicing customers in the same currency as the source of the
products and by funding some of its investments in foreign markets
through local currency loans. The Company also monitors its foreign
currency exposure in each country and implements strategies to
respond to changing economic and political environments. In the
aggregate, the Company’s exposure related to such transactions is
not material to the Company’s financial position, results of operations
or cash flows.
D I S C L O S U R E R E G A R D I N G F O RWA R D - L O O K I N G S TAT E M E N T SStatements contained in this Management’s Discussion and Analysis
of Financial Condition and Results of Operations may contain forward-
looking statements as contemplated by the 1995 Private Securities
Litigation Reform Act that are based on management’s current expec-
tations, estimates and projections. Words such as “expects,” “antici-
pates,” “intends,” “plans,” “believes,” “estimates,” variations of such words
and similar expression are intended to identify such forward-looking
statements. Forward-looking statements are subject to risks and uncer-
tainties, which could cause actual results to differ materially from those
projected or implied in the forward-looking statements. Such risks and
uncertainties include: fluctuations in domestic or foreign automotive
production, the continued use of outside suppliers by vehicle manufac-
turers, fluctuations in demand for vehicles containing the Company’s
products, general economic conditions, as well as other risks detailed
in the Company’s filings with the Securities and Exchange Commission,
including the Cautionary Statements filed as Exhibit 99.1 to the Form
10-K for the fiscal year ended December 31, 1999.
On January 1, 2000, the Company ran all its systems utilizing the new
year 2000 date. Some minor failures were experienced, but immediately
remedied. Since January 1, no significant failures have occurred. In
addition, the Company has not experienced any significant year 2000
related problems with its customers, vendors or suppliers.
Total spending related to these programs was $14.4 million through
December 31, 1999, of which approximately $10.4 million was capital-
ized and $4.0 million was expensed. The bulk of such spending was
for system improvements and enhancements, and not to correct year
2000 non-compliance.
New Accounting Pronouncements
In June 1998, the Financial Accounting Standard Board (“FASB”) issued
Statement of Financial Accounting Standards No. 133, “Accounting for
Derivative Instruments and Hedging Activities” (“SFAS 133”), to estab-
lish accounting and reporting requirements for derivative instruments.
This standard requires recognition of all derivative instruments in the
statement of financial condition as either assets or liabilities, measured
at fair value. This statement additionally requires changes in the fair
value of derivatives to be recorded each period in current earnings or
comprehensive income depending on the intended use of the deriva-
tives. The Company is currently assessing the impact of this statement
on the Company’s results of operations, financial condition and cash
flows. In June 1999, the FASB issued Statement of Financial Accounting
Standards No. 137, “Accounting for Derivative Instruments and Hedging
activities – Deferral of the Effective Date of FASB Statement No. 133,”
which amends SFAS 133 by deferring for one year, the effective date
of SFAS 133, to those fiscal years beginning after June 15, 2000.
Market Risk Disclosure
The Company’s primary market risks include fluctuations in interest
rates and foreign currency exchange rates. The Company is also
exposed to changes in the prices of commodities used in its manufac-
turing operations. However, commodity price risk is not considered
to be material. The Company does not hold any market risk sensitive
instruments for trading purposes.
The Company has established policies and procedures to manage
sensitivity to interest rate and foreign currency exchange rate market
risk, which include monitoring of the Company’s level of exposure to
each market risk.
Interest rate risk is the risk that the Company will incur economic
losses due to adverse changes in interest rates. The Company meas-
ures its interest rate risk by estimating the net amount by which the fair
24

MANAGEMENT ’S RESPONSIBILITY FORCONSOLIDATED FINANCIAL STATEMENTS INDEPENDENT AUDITORS ’ REPORT
The information in this report is the responsibility of management.
BorgWarner Inc. (the “Company”) has in place reporting guidelines and
policies designed to ensure that the statements and other information
contained in this report present a fair and accurate financial picture of
the Company. In fulfilling this management responsibility, we make
informed judgments and estimates conforming with generally accepted
accounting principles.
The accompanying consolidated financial statements have been audited
by Deloitte & Touche LLP, independent auditors. Management has made
available all the Company’s financial records and related information
deemed necessary by Deloitte & Touche LLP. Furthermore, manage-
ment believes that all representations made by it to Deloitte & Touche
LLP during its audit were valid and appropriate.
Management is responsible for maintaining a comprehensive system of
internal control through its operations that provides reasonable assur-
ance that assets are protected from improper use, that material errors
are prevented or detected within a timely period and that records are
sufficient to produce reliable financial reports. The system of internal
control is supported by written policies and procedures that are updated
by management as necessary. The system is reviewed and evaluated
regularly by the Company’s internal auditors as well as by the independ-
ent auditors in connection with their annual audit of the financial state-
ments. The independent auditors conduct their evaluation in accordance
with generally accepted auditing standards and perform such tests of
transactions and balances as they deem necessary. Management con-
siders the recommendations of its internal auditors and independent
auditors concerning the Company’s system of internal control and takes
the necessary actions that are cost-effective in the circumstances.
Management believes that, as of December 31, 1999, the Company’s
system of internal control was adequate to accomplish the objectives
set forth in the first sentence of this paragraph.
The Company’s Finance and Audit Committee, composed entirely of
directors of the Company who are not employees, meets periodically
with the Company’s management and independent auditors to review
financial results and procedures, internal financial controls and internal
and external audit plans and recommendations. To guarantee independ-
ence, the Finance and Audit Committee and the independent auditors
have unrestricted access to each other with or without the presence of
management representatives.
John F. Fiedler Lawrence B. SkatoffChairman and Executive Vice PresidentChief Executive Officer and Chief Financial Officer
February 2, 2000
The Board of Directors and Stockholders of BorgWarner Inc.
We have audited the consolidated balance sheets of BorgWarner Inc.
and subsidiaries (formerly Borg-Warner Automotive, Inc.) as of
December 31, 1999 and 1998, and the related consolidated statements
of operations, cash flows, and stockholders’ equity for each of the three
years in the period ended December 31, 1999. These financial state-
ments are the responsibility of the Company’s management. Our
responsibility is to express an opinion on these financial statements
based on our audits.
We conducted our audits in accordance with generally accepted audit-
ing standards. Those standards require that we plan and perform the
audit to obtain reasonable assurance about whether the financial state-
ments are free of material misstatement. An audit includes examining,
on a test basis, evidence supporting the amounts and disclosures in the
financial statements. An audit also includes assessing the accounting
principles used and significant estimates made by management, as well
as evaluating the overall financial statement presentation. We believe
that our audits provide a reasonable basis for our opinion.
In our opinion, such consolidated financial statements present fairly,
in all material respects, the financial position of BorgWarner Inc. and
subsidiaries at December 31, 1999 and 1998, and the results of their
operations and their cash flows for each of the three years in the period
ended December 31, 1999 in conformity with generally accepted
accounting principles.
DELOITTE & TOUCHE LLP
Chicago, Illinois
February 2, 2000
25

CONSOLIDATED STATEMENTS OF OPERATIONS
B O R G W A R N E R
mil l ions o f do l lar s except per share amount s
F O R T H E Y E A R E N D E D D E C E M B E R 3 1 , 1999 1998 1997
Net sales $2,458.6 $1,836.8 $1,767.0
Cost of sales 1,888.5 1,450.7 1,375.4
Depreciation 91.3 74.8 70.4
Selling, general and administrative expenses 203.3 135.1 132.0
Minority interest 1.3 2.1 3.2
Goodwill amortization 32.1 16.8 16.7
Equity in affiliate earnings and other income (14.1) (10.3) (13.2)
Earnings before interest expense, finance charges and income taxes 256.2 167.6 182.5
Interest expense and finance charges 49.2 26.9 24.6
Earnings before income taxes 207.0 140.7 157.9
Provision for income taxes 74.7 46.0 54.7
Net earnings $ 132.3 $ 94.7 $ 103.2
Net earnings per share
Basic $ 5.10 $ 4.03 $ 4.35
Diluted $ 5.07 $ 4.00 $ 4.31
Average shares outstanding (thousands)
Basic 25,948 23,479 23,683
Diluted 26,078 23,676 23,934
S E E AC C O M PA N Y I N G N OT E S TO C O N S O L I DAT E D F I N A N C I A L S TAT E M E N T S .
26

CONSOLIDATED BALANCE SHEETS
mil l ions o f do l lar s
D E C E M B E R 3 1 , 1999 1998
AssetsCash $ 11.1 $ 37.8
Short-term securities 10.6 6.2
Receivables 216.2 185.4
Inventories 164.4 115.7
Deferred income taxes 2.8 4.7
Prepayments and other current assets 153.2 26.3
Total current assets 558.3 376.1
Land 32.5 24.0
Buildings 239.0 199.7
Machinery and equipment 834.1 692.6
Capital leases 5.3 5.7
Construction in progress 93.2 82.9
1,204.1 1,004.9
Less accumulated depreciation 408.1 370.4
Net property, plant and equipment 796.0 634.5
Investments and advances 160.3 141.9
Goodwill 1,284.7 560.4
Deferred income taxes 18.8 7.7
Other noncurrent assets 152.6 125.5
Total other assets 1,616.4 835.5
$2,970.7 $1,846.1
Liabilities and Stockholders’ EquityNotes payable $ 134.0 $ 145.0
Accounts payable and accrued expenses 433.7 276.9
Income taxes payable 92.1 32.2
Total current liabilities 659.8 454.1
Long-term debt 846.3 248.5
Long-term liabilities:
Retirement-related liabilities 343.9 318.6
Other 54.4 39.1
Total long-term liabilities 398.3 357.7
Minority interest in consolidated subsidiaries 8.8 8.5
Commitments and contingencies — —
Capital stock:
Preferred stock, $.01 par value; authorized shares: 5,000,000; none issued — —
Common stock, $.01 par value; authorized shares: 50,000,000; issued shares: 1999, 27,040,492;
1998, 23,753,365; outstanding shares: 1999, 26,724,192; 1998, 23,387,173 0.3 0.2
Non-voting common stock, $.01 par value; authorized shares: 25,000,000; none issued
and outstanding — —
Capital in excess of par value 715.7 566.0
Retained earnings 346.4 230.2
Management shareholder note (2.0) (2.0)
Accumulated other comprehensive income 12.3 0.5
Common stock held in treasury, at cost: 1999, 316,300 shares; 1998, 366,192 shares (15.2) (17.6)
Total stockholders’ equity 1,057.5 777.3
Total Liabilities and Stockholders’ Equity $2,970.7 $1,846.1
S E E AC C O M PA N Y I N G N OT E S TO C O N S O L I DAT E D F I N A N C I A L S TAT E M E N T S .
27

CONSOLIDATED STATEMENTS OF CASH FLOWS
B O R G W A R N E R
mil l ions o f do l lar s
F O R T H E Y E A R E N D E D D E C E M B E R 3 1 , 1999 1998 1997
OperatingNet earnings $ 132.3 $ 94.7 $ 103.2
Adjustments to reconcile net earnings to net cash flows from operations:
Non-cash charges (credits) to operations:
Depreciation 91.3 74.8 70.4
Goodwill amortization 32.1 16.8 16.7
Deferred income tax provision (4.0) 16.7 24.1
Other, principally equity in affiliate earnings (14.1) (11.4) (11.8)
Changes in assets and liabilities, net of effects of acquisitions and divestitures:
(Increase) decrease in receivables 41.1 (29.3) (13.6)
Increase in inventories (19.0) (9.1) (8.9)
(Increase) decrease in prepayments and deferred income taxes 0.2 (7.6) (1.3)
Increase (decrease) in accounts payable and accrued expenses 57.9 3.0 (3.9)
Increase (decrease) in income taxes payable 18.9 (22.3) 23.9
Net change in other long-term assets and liabilities 7.8 6.3 (31.4)
Net cash provided by operating activities 344.5 132.6 167.4
InvestingCapital expenditures (143.4) (122.2) (135.1)
Investment in affiliates 5.5 (5.7) (0.1)
Payments for businesses acquired, net of cash acquired (855.5) (65.4) (42.4)
Proceeds from sales of businesses 177.9 51.8 5.8
Proceeds from other assets 4.8 13.9 2.7
Net cash used in investing activities (810.7) (127.6) (169.1)
FinancingNet increase (decrease) in notes payable (10.3) 73.3 31.8
Additions to long-term debt 621.8 2.4 37.6
Reductions in long-term debt (150.0) (26.1) (42.5)
Payments for purchase of treasury stock — (13.0) (10.2)
Proceeds from stock options exercised 0.7 0.7 2.1
Dividends paid (15.5) (14.1) (14.3)
Net cash provided by financing activities 446.7 23.2 4.5
Effect of exchange rate changes on cash and cash equivalents (2.8) 2.4 (0.9)
Net increase (decrease) in cash and cash equivalents (22.3) 30.6 1.9
Cash and cash equivalents at beginning of year 44.0 13.4 11.5
Cash and cash equivalents at end of year $ 21.7 $ 44.0 $ 13.4
Supplemental Cash Flow InformationNet cash paid during the year for:
Interest $ 51.1 $ 30.3 $ 27.1
Income taxes 59.1 36.8 28.9
Non-cash financing transactions:
Issuance of common stock for acquisition $ 149.8 $ — $ —
Issuance of common stock for management notes — 2.0 —
Issuance of common stock for Executive Stock Performance Plan 1.1 1.8 —
S E E AC C O M PA N Y I N G N OT E S TO C O N S O L I DAT E D F I N A N C I A L S TAT E M E N T S .
28

CONSOLIDATED STATEMENTS OF STOCKHOLDERS ’ EQUITY
mil l ions o f do l lar s
Number of Shares Stockholders’ Equity Comprehensive
Accumulated
Income
Issued Common Issued Capital in Management othercommon stock in common excess of Treasury shareholder Retained comprehensive
stock treasury stock par value stock note earnings income
Balance, January 1, 1997 23,644,840 — $ 0.2 $563.9 $ — $ — $ 61.8 $ 2.9
Purchase of treasury stock — (212,100) — — (10.2) — — —
Dividends declared — — — — — — (14.3) —
Shares issued under stock
option plans 110,025 1,500 — 2.1 — — — —
Net income — — — — — — 103.2 — $103.2
Adjustment for minimum
pension liability — — — — — — — 5.7 5.7
Currency translation adjustment — — — — — — — (21.6) (21.6)
Balance, December 31, 1997 23,754,865 (210,600) $ 0.2 $566.0 $(10.2) $ — $150.7 $(13.0) $ 87.3
Purchase of treasury stock — (273,200) — — (13.0) — — —
Dividends declared — — — — — — (14.1) —
Shares issued for management
shareholder note — 36,930 — 0.3 1.7 (2.0) — —
Shares issued under stock
option plans — 43,614 — (0.3) 2.1 — (1.1) —
Shares issued under executive
stock plan — 35,564 — — 1.8 — — —
Non-voting common stock converted
to voting common stock (1,500) 1,500 — — — — — —
Net income — — — — — — 94.7 — $ 94.7
Adjustment for minimum
pension liability — — — — — — — 1.7 1.7
Currency translation adjustment — — — — — — — 11.8 11.8
Balance, December 31, 1998 23,753,365 (366,192) $ 0.2 $566.0 $(17.6) $(2.0) $230.2 $ 0.5 $108.2
Dividends declared — — — — — — (15.5) —
Shares issued for
Kuhlman Acquisition 3,287,127 — 0.1 149.7 — — — —
Shares issued under stock
option plans — 28,000 — — 1.3 — (0.6) —
Shares issued under executive
stock plan — 21,892 — — 1.1 — — —
Net income — — — — — — 132.3 — $132.3
Adjustment for minimum
pension liability — — — — — — — (0.1) (0.1)
Currency translation adjustment — — — — — — — 11.9 11.9
Balance, December 31, 1999 27,040,492 (316,300) $ 0.3 $715.7 $(15.2) $(2.0) $346.4 $ 12.3 $144.1
S E E AC C O M PA N Y I N G N OT E S TO C O N S O L I DAT E D F I N A N C I A L S TAT E M E N T S .
29

NOTES TO CONSOLIDATED FINANCIAL STATEMENTS
B O R G W A R N E R
Inventory held by U.S. operations was $96.2 million in 1999 and $66.3
million in 1998. Such inventories, if valued at current cost instead of
LIFO, would have been greater by $6.3 million in both 1999 and 1998.
Property, plant and equipment and depreciation Property,
plant and equipment are valued at cost less accumulated depreciation.
Expenditures for maintenance, repairs and renewals of relatively minor
items are generally charged to expense as incurred. Renewals of signifi-
cant items are capitalized. Depreciation is computed generally on a
straight-line basis over the estimated useful lives of related assets rang-
ing from 3 to 30 years. For income tax purposes, accelerated methods
of depreciation are generally used.
Goodwill Goodwill is being amortized on a straight-line basis over
periods not exceeding 40 years. The Company periodically evaluates
the carrying value of goodwill to determine if adjustments to the amorti-
zation period or to the unamortized balance is warranted.
Revenue recognition The Company recognizes revenue upon
shipment of product. Although the Company may enter into long-term
supply agreements with its major customers, each shipment of goods
is treated as a separate sale and the price is not fixed over the life of
the agreements.
Financial instruments Financial instruments consist primarily of
investments in cash, short-term securities, receivables and debt securi-
ties and obligations under accounts payable and accrued expenses and
debt instruments. The Company believes that the fair value of the finan-
cial instruments approximates the carrying value, except as noted in
Footnote SIX and in the following paragraph.
The Company received corporate bonds with a face value of $30.3
million as partial consideration for the sales of Kuhlman Electric and
Coleman Cable in 1999. These bonds have been recorded at their fair
market value of $12.9 million using valuation techniques that considered
cash flows discounted at current market rates and management’s best
estimates of credit quality. They have been classified as investments
available-for-sale in the other current assets section of the December 31,
1999 Consolidated Balance Sheet. The contractual maturities of these
bonds are beyond five years.
Foreign currency The financial statements of foreign subsidiaries are
translated to U.S. dollars using the period-end exchange rate for assets
and liabilities and an average exchange rate for each period for rev-
enues and expenses. The local currency is the functional currency for
all of the Company’s foreign subsidiaries, except for subsidiaries located
I N T RO D U C T I O NBorgWarner Inc. (formerly Borg-Warner Automotive, Inc.) (the
“Company”) and Consolidated Subsidiaries is a leading global supplier
of highly engineered systems and components primarily for automo-
tive powertrain applications. These products are manufactured and
sold worldwide, primarily to original equipment manufacturers of pas-
senger cars, sport-utility vehicles, trucks, commercial transportation
products and industrial equipment. Its products fall into five operating
segments: Air/Fluid Systems, Cooling Systems, Morse TEC,
TorqTransfer Systems and Transmission Systems.
O N E Summary of Significant Accounting Policies
The following paragraphs briefly describe significant accounting policies.
Estimates The preparation of financial statements in conformity with
generally accepted accounting principles requires management to make
estimates and assumptions. These estimates and assumptions affect
the reported amounts of assets and liabilities and disclosure of contin-
gent assets and liabilities at the date of the financial statements and
the reported amounts of revenues and expenses during the reporting
period. Actual results could differ from those estimates.
Principles of consolidation The consolidated financial statements
include all significant majority-owned subsidiaries. All significant inter-
company accounts and transactions have been eliminated in consolida-
tion. Certain prior year amounts have been reclassified to conform to
the current year presentation.
Short-term securities Short-term securities are valued at cost, which
approximates market. It is the Company’s policy to classify investments
with original maturities of three months or less as cash equivalents for
purposes of preparing the Consolidated Statements of Cash Flows.
All short-term securities meet this criterion.
Accounts receivable In 1999, an agreement with a financial institution
to sell, without recourse, eligible receivables was amended from $127.5
million to $153.0 million. Under this agreement, the Company has sold
$150.0 million of accounts receivable as of December 31, 1999 and
$125.0 million as of December 31, 1998. The gains or losses on sales
were not material in 1999 or 1998. The agreement extends through
December 2000.
Inventories Inventories are valued at the lower of cost or market. Cost
of U.S. inventories is determined by the last-in, first-out (LIFO) method,
while the foreign operations use the first-in, first-out (FIFO) method.
30

NOTES TO CONSOLIDATED FINANCIAL STATEMENTS
mil l ions o f do l lar s
1999 1998 1997
U.S. Non-U.S. Total U.S. Non-U.S. Total U.S. Non-U.S. Total
Income before taxes $121.6 $85.4 $207.0 $99.3 $41.4 $140.7 $115.7 $42.2 $157.9
Income taxes:
Current :
Federal/foreign $ 50.0 $21.2 $ 71.2 $ 6.4 $18.5 $ 24.9 $ 19.8 $ 7.2 $ 27.0
State 7.5 — 7.5 4.4 — 4.4 3.6 — 3.6
57.5 21.2 78.7 10.8 18.5 29.3 23.4 7.2 30.6
Deferred (9.5) 5.5 (4.0) 14.8 1.9 16.7 19.0 5.1 24.1
Total income taxes $ 48.0 $26.7 $ 74.7 $25.6 $20.4 $ 46.0 $ 42.4 $12.3 $ 54.7
in Brazil. Translation adjustments for foreign subsidiaries are recorded
as a component of accumulated other comprehensive income in stock-
holders’ equity.
New accounting pronouncements In June 1998, the Financial
Accounting Standards Board (“FASB”) issued Statement of Financial
Accounting Standards No. 133, “Accounting for Derivative Instruments
and Hedging Activities” (“SFAS 133”), to establish accounting and
reporting requirements for derivative instruments. This standard requires
recognition of all derivative instruments in the statement of financial
condition as either assets or liabilities, measured at fair value. This state-
ment additionally requires changes in the fair value of derivatives to
be recorded each period in current earnings or comprehensive income
depending on the intended use of the derivatives. The Company is
currently assessing the impact of this statement on the Company’s
results of operations, financial condition and cash flows. In June 1999,
the FASB issued Statement of Financial Accounting Standards No. 137,
“Accounting for Derivative Instruments and Hedging Activities – Deferral
of the Effective Date of FASB Statement No. 133,” which amends SFAS
133 by deferring for one year, the effective date of SFAS 133, to those
fiscal years beginning after June 15, 2000.
T WO Research and Development Costs
The Company spent approximately $91.6 million, $65.1 million and
$59.0 million in 1999, 1998 and 1997, respectively, on research and
development activities. Not included in these amounts were customer-
sponsored R&D activities of approximately $9.4 million, $8.4 million
and $8.0 million in 1999, 1998 and 1997, respectively.
T H R E E Equity in Affiliate Earnings and Other Income
Items included in equity in affiliate earnings and other income consist of:
mil l ions o f do l lar s
D E C E M B E R 3 1 , 1999 1998 1997
Equity in affiliate earnings $11.7 $ 5.5 $14.0
Gain on sale of affiliate — 3.3 —
Interest income 1.1 0.4 0.4
Gain (loss) on asset disposals, net 0.3 (0.1) (3.7)
Other 1.0 1.2 2.5
$14.1 $10.3 $13.2
F O U R Income Taxes
Income before taxes and provision for taxes consist of:
31

NOTES TO CONSOLIDATED FINANCIAL STATEMENTS
B O R G W A R N E R
F I V E Balance Sheet Information
Detailed balance sheet data are as follows:
mil l ions o f do l lar s
D E C E M B E R 3 1 , 1999 1998
Receivables:
Customers $182.6 $147.5
Other 38.4 40.6
221.0 188.1
Less allowance for losses 4.8 2.7
Net receivables $216.2 $185.4
Inventories:
Raw material $ 76.4 $ 57.3
Work in progress 39.1 32.7
Finished goods 48.9 25.7
Total inventories $164.4 $115.7
Prepayments and other current assets:
Investment in business held for disposition $129.0 $ 16.8
Other 24.2 9.5
Total prepayments and other current assets $153.2 $ 26.3
Investments and advances:
NSK-Warner $154.1 $133.6
Other 6.2 8.3
Total investments and advances $160.3 $141.9
Other noncurrent assets:
Deferred pension assets $ 65.1 $ 54.1
Deferred tooling 62.3 53.1
Other 25.2 18.3
Total other noncurrent assets $152.6 $125.5
Accounts payable and accrued expenses:
Trade payables $222.9 $164.3
Payroll and related 60.4 34.2
Insurance 32.1 18.4
Accrued costs related to divested operations 11.7 13.9
Warranties and claims 20.0 11.1
Other 86.6 35.0
Total accounts payable and accrued expenses $433.7 $276.9
Other long-term liabilities:
Environmental reserves $ 17.8 $ 7.9
Other 36.6 31.2
Total other long-term liabilities $ 54.4 $ 39.1
The analysis of the variance of income taxes as reported from income
taxes computed at the U.S. statutory rate for consolidated operations is
as follows:
mil l ions o f do l lar s
D E C E M B E R 3 1 , 1999 1998 1997
Income taxes at U.S. statutory
rate of 35% $72.5 $49.2 $55.3
Increases (decreases) resulting from:
Income from non-U.S. sources (5.4) 6.7 1.7
State taxes, net of federal benefit 4.9 2.9 2.3
Business tax credits, net (8.4) (8.5) (2.5)
Affiliate earnings (4.1) (1.9) (4.9)
Nontemporary differences and other 15.2 (2.4) 2.8
Income taxes as reported $74.7 $46.0 $54.7
Following are the gross components of deferred tax assets and liabilities
as of December 31, 1999 and 1998:
mil l ions o f do l lar s
D E C E M B E R 3 1 , 1999 1998
Deferred tax assets - current:
Accrued costs related to divested operations $ 2.8 $ 4.7
Deferred tax assets - noncurrent:
Postretirement benefits $113.2 $104.2
Pension 1.5 4.5
Other long-term liabilities and reserves 45.8 18.9
Foreign tax credits 11.2 9.2
Valuation allowance (11.2) (9.2)
Other 40.3 12.6
200.8 140.2
Deferred tax liabilities - noncurrent:
Fixed assets 72.8 77.1
Pension 23.8 20.6
Other 85.4 34.8
182.0 132.5
Net deferred tax asset - noncurrent $ 18.8 $ 7.7
No deferred income taxes have been provided on undistributed earnings
of foreign subsidiaries as the amounts are essentially permanent in
nature. A valuation allowance has been provided for those foreign tax
credits which are estimated to expire before they are utilized.
32

NOTES TO CONSOLIDATED FINANCIAL STATEMENTS
S I X Notes Payable and Long-Term Debt
Following is a summary of notes payable and long-term debt. The
weighted average interest rate on all borrowings for 1999 and 1998
was 6.5% and 6.3%, respectively.
mil l ions o f do l lar s
1999 1998D E C E M B E R 3 1 , Current Long-Term Current Long-Term
Bank borrowings $131.1 $142.0 $144.4 $69.5
Bank term loans due through
2003 (at an average rate
of 5.3% in 1999 and 5.3%
in 1998; and 7.7% at
December 31, 1999) 2.2 6.1 0.2 25.5
7% Senior Notes due 2006,
net of unamortized discount — 149.7 — 149.7
6.5% Senior Notes due 2009,
net of unamortized discount — 198.3 — —
8% Senior Notes due 2019,
net of unamortized discount — 149.9 — —
7.125% Senior Notes due 2029,
net of unamortized discount — 197.2 — —
Capital lease liabilities (at an
average rate of 6.8% in 1999
and 7.2% in 1998) 0.7 3.1 0.4 3.8
Total notes payable and
long-term debt $134.0 $846.3 $145.0 $248.5
Annual principal payments required as of December 31, 1999 are as
follows (in millions of dollars):
2000 $134.0
2001 149.1
2002 1.1
2003 0.3
2004 0.1
after 2004 695.7
The Company has a revolving credit facility which provides for borrow-
ings up to $350 million through September, 2001. At December 31,
1999, $66.0 million of borrowings under the facility were outstanding;
at December 31, 1998, the facility was unused. The credit agreement
contains numerous financial and operating covenants including, among
others, covenants requiring the Company to maintain certain financial
ratios and restricting its ability to incur additional foreign indebtedness.
Dividends and other payments received from affiliates accounted for
under the equity method totaled $5.5 million in 1999, $3.9 million in
1998 and $4.8 million in 1997.
Accumulated amortization of goodwill amounted to $148.7 million in
1999 and $117.8 million in 1998.
The Company has a 50% interest in NSK-Warner, a joint venture based
in Japan that manufactures automatic transmission components. The
Company’s share of the earnings or losses reported by NSK-Warner is
accounted for using the equity method of accounting. NSK-Warner has
a fiscal year-end of March 31. The Company’s equity in the earnings of
NSK-Warner consists of the 12 months ended November 30 so as to
reflect earnings on as current a basis as is reasonably feasible.
Following are summarized financial data for NSK-Warner, translated
using the ending or periodic rates as of and for the years ended
March 31, 1999, 1998 and 1997:
mil l ions o f do l lar s
M A R C H 3 1 , 1999 1998 1997
Balance sheets:
Current assets $143.8 $139.0 $145.7
Noncurrent assets 137.4 119.4 124.7
Current liabilities 69.9 68.0 74.1
Noncurrent liabilities 6.9 7.0 8.1
Statements of operations:
Net sales $235.9 $264.1 $296.5
Gross profit 52.6 64.7 82.6
Net income 16.9 21.5 29.0
33

NOTES TO CONSOLIDATED FINANCIAL STATEMENTS
B O R G W A R N E R
mil l ions o f do l lar s
Pension Postretirement Benefits Benefits
D E C E M B E R 3 1 , 1999 1998 1999 1998
Change in benefit obligation:
Benefit obligation at
beginning of year $345.8 $330.1 $ 296.8 $ 271.2
Service cost 6.2 5.4 4.8 4.6
Interest cost 22.6 21.7 21.1 18.7
Plan participants’ contributions 0.2 0.3 — —
Amendments — 0.3 (0.5) (0.1)
Net actuarial (gain) loss (32.1) 13.2 (26.6) 28.6
Acquisitions/divestitures 43.7 — 29.4 —
Currency translation (8.6) 2.8 — —
Curtailments (0.3) (3.8) — (6.8)
Settlements (17.3) (3.5) (0.5) (2.7)
Special termination benefits — 1.8 — 0.9
Benefits paid (26.2) (22.5) (24.4) (17.6)
Benefit obligation at end of year $334.0 $345.8 $300.1 $296.8
Change in plan assets:
Fair value of plan assets at
beginning of year $378.7 $328.2
Actual return on plan assets 50.5 63.7
Acquisitions/divestitures 45.6 —
Employer contributions 4.0 12.5
Plan participants’ contributions 0.2 0.3
Currency translation (3.7) 0.6
Settlements (18.1) (4.1)
Benefits paid (26.2) (22.5)
Fair value of plan assets at
end of year $431.0 $378.7
Reconciliation of funded status:
Funded status $97.0 $32.9 $(300.1) $(296.8)
Unrecognized net actuarial
(gain) loss (71.1) (23.0) (3.2) 23.1
Unrecognized transition asset (0.8) (0.9)
Unrecognized prior service cost 6.7 7.6 (0.7) (0.3)
Net amount recognized $ 31.8 $ 16.6 $(304.0) $(274.0)
Amounts recognized in the
consolidated balance sheets:
Prepaid benefit cost $ 65.1 $ 54.1 $ — $ —
Accrued benefit liability (33.5) (37.5) (304.0) (274.0)
Accumulated other
comprehensive income 0.2 — — —
Net amount recognized $ 31.8 $ 16.6 $(304.0) $(274.0)
On February 22, 1999, the Company issued $200 million of 6.5% senior
unsecured notes maturing in February 2009 and $200 million of 7.125%
unsecured notes maturing in February 2029 to partially fund the acquisi-
tion of Kuhlman Corporation (“Kuhlman”). Interest is payable semiannu-
ally on February 15 and August 15.
On September 28, 1999, the Company issued $150 million of 8%
senior unsecured notes maturing in September 2019 to partially fund
the acquisition of the Fluid Power Division of Eaton Corporation
(“Eaton”). Interest is payable semiannually on April 1 and October 1.
The indenture on the senior unsecured notes contains certain
covenants including, among others, covenants limiting liens, sale/
leaseback transactions, mergers and the sale of substantially all of
the Company’s assets.
Bank term loans of $8.3 million outstanding at December 31, 1999 are
subject to annual reductions of $2.2 million in 2000, $4.9 million in 2001,
$1.0 million in 2002, and $0.2 million in 2003.
As of December 31, 1999 and 1998, the estimated fair values of the
Company’s senior unsecured notes totaled $651.6 million and $154.0
million, respectively. The estimated fair values were $43.5 million higher
in 1999, and $4.3 million lower in 1998, than their respective carrying
values. The fair value of all other debt instruments is estimated to
approximate their recorded value, as their applicable interest rates
approximate current market rates for borrowings with similar terms and
maturities. Fair market values are estimated by the use of estimates
obtained from brokers and other appropriate valuation techniques
based on information available as of year-end. The fair-value estimates
do not necessarily reflect the values the Company could realize in the
current markets.
S E V E N Retirement Benefit Plans
The Company has a number of defined benefit pension plans and
other postretirement benefit plans covering eligible salaried and hourly
employees. The other postretirement benefit plans, which provide
medical and life insurance benefits, are unfunded plans. The following
provides a reconciliation of the plans’ benefit obligations, plan assets,
funded status and recognition in the Consolidated Balance Sheets.
34

NOTES TO CONSOLIDATED FINANCIAL STATEMENTS
mil l ions o f do l lar s
Pension Benefits Other Postretirement Benefits F O R T H E Y E A R E N D E D D E C E M B E R 3 1 , 1999 1998 1997 1999 1998 1997
Components of net periodic benefit cost:
Service cost $ 6.2 $ 5.4 $ 4.5 $ 4.8 $ 4.6 $ 4.1
Interest cost 22.6 21.7 21.8 21.1 18.7 19.0
Expected return on plan assets (34.7) (28.6) (24.6)
Amortization of unrecognized transition asset (0.2) (0.2) (0.2)
Amortization of unrecognized prior service cost 1.2 1.5 1.5
Amortization of unrecognized loss — — 0.5
Settlement loss 0.8 — —
Curtailment gain (0.3) (0.8) —
Net periodic benefit cost (income) $ (4.4) $ (1.0) $ 3.5 $25.9 $23.3 $23.1
The Company’s weighted-average assumptions used as of December 31
in determining the pension costs and pension liabilities shown above
were as follows:percent
Pension Benefits Other Postretirement Benefits F O R T H E Y E A R E N D E D D E C E M B E R 3 1 , 1999 1998 1997 1999 1998 1997
U.S. plans:
Discount rate 8.0 6.75 7.0 8.0 6.75 7.0
Rate of salary progression 4.5 4.5 4.5
Expected return on plan assets 9.5 9.5 9.5
Foreign plans:
Discount rate 5.5-6.0 5.0-6.0 6.0-6.75
Rate of compensation increase 2.5-4.0 2.5-4.5 2.5-5.5
Expected return on plan assets 6.0 6.0 6.0-7.0
Certain plans which had been underfunded in 1998 became overfunded
in 1999. The funded status of pension plans included above with accu-
mulated benefit obligations in excess of plan assets at December 31 is
as follows:
mil l ions o f do l lar s
D E C E M B E R 3 1 , 1999 1998
Accumulated benefit obligation $30.6 $52.0
Plan assets — 26.4
Deficiency $30.6 $25.6
The weighted-average rate of increase in the per capita cost of covered
health care benefits is projected to be 5.25% in 2000 and for each
future year. A one-percentage point change in the assumed health care
cost trend would have the following effects:
mil l ions o f do l lar s
D E C E M B E R 3 1 , One Percentage PointDecrease Increase
Effect on postretirement benefit obligation $39.9 $(31.8)
Effect on total service and interest cost components $ 4.9 $ (3.9)
35

NOTES TO CONSOLIDATED FINANCIAL STATEMENTS
B O R G W A R N E R
options outstanding at December 31, 1999 that were granted under a
predecessor plan.
The Company accounts for stock options in accordance with Accounting
Principles Board Opinion No. 25, under which no compensation cost
has been recognized for stock options grants.
A summary of the two plans’ shares under option at December 31,
1999, 1998 and 1997 follows:
E I G H T Stock Incentive Plans
Stock option plans Under the Company’s 1993 Stock Incentive Plan,
the Company may grant options to purchase up to 1,500,000 shares
of the Company’s common stock at the fair market value on the date
of grant. The options vest over periods up to three years and have a
term of ten years from date of grant. There are 778,975 outstanding
options at December 31, 1999. There are also 82,300 fully vested
36
1999 1998 1997
Weighted- Weighted- Weighted-Shares average Shares average Shares average
(thousands) exercise price (thousands) exercise price (thousands) exercise price
Outstanding at beginning of year 654 $38.85 471 $30.72 461 $21.57
Granted 266 53.25 242 51.76 130 53.48
Exercised (28) 22.35 (44) 17.44 (111) 19.14
Forfeited (31) 52.03 (15) 53.42 (9) 35.34
Outstanding at end of year 861 $43.37 654 $38.85 471 $30.72
Options exercisable at year-end 328 294 323
Options available for future grants 511
The following table summarizes information about the options out-
standing at December 31, 1999:
Options Out s tanding Options Exerc i sab le
Weighted-Number average Weighted- Number Weighted-
Range of outstanding remaining average exercisable averageexercise prices (thousands) contractual life exercise price (thousands) exercise price
$16.56 – 18.83 82 1.5 $17.85 82 $17.85
$22.50 – 44.19 214 4.5 27.14 196 25.91
$50.91 – 53.44 237 8.4 51.82 1 51.41
$53.88 – 57.31 328 9.0 54.22 49 55.05
$16.56 – 57.31 861 7.0 $43.37 328 $28.32

NOTES TO CONSOLIDATED FINANCIAL STATEMENTS
ended December 31, 1999 and 1998, the amounts earned under the
plan and accrued over the three-year periods were $2.0 million and
$4.3 million, respectively. Under this plan, 21,892 shares and 35,564
shares were issued in 1999 and 1998, respectively. Estimated shares
issuable under the plan are included in the computation of diluted earn-
ings per share as earned.
Earnings per share In calculating earnings per share, earnings are
the same for the basic and diluted calculations. Shares increased for
diluted earnings per share by 130,000, 197,000 and 251,000 for 1999,
1998 and 1997, respectively, due to the effects of stock options and
shares issuable under the executive stock performance plan.
N I N E Other Comprehensive Income
The tax effects of the components of other comprehensive income in
the Consolidated Statements of Stockholders’ Equity are as follows:
mil l ions o f do l lar s
F O R T H E Y E A R E N D E D D E C E M B E R 3 1 , 1999 1998 1997
Foreign currency translation adjustment $18.6 $17.6 $(33.0)
Income taxes (6.7) (5.8) 11.4
Net foreign currency translation adjustment 11.9 11.8 (21.6)
Minimum pension liability adjustment (0.2) 2.5 8.7
Income taxes 0.1 (0.8) (3.0)
Net minimum pension liability adjustment (0.1) 1.7 5.7
Other comprehensive income (loss) $11.8 $13.5 $(15.9)
The components of accumulated other comprehensive income (net of tax) in
the Consolidated Balance Sheets are as follows:
mil l ions o f do l lar s
D E C E M B E R 3 1 , 1999 1998
Foreign currency translation adjustment $12.4 $0.5
Minimum pension liability adjustment (0.1) —
Accumulated other comprehensive income $12.3 $0.5
Pro forma information regarding net income and earnings per share
is required by Statement of Financial Accounting Standards No. 123,
and has been determined as if the Company had accounted for its
employee stock options under the fair value method of that Statement.
The fair value for these options was estimated at the date of grant using
a Black-Scholes options pricing model with the following weighted aver-
age assumptions:mil l ions o f do l lar s
D E C E M B E R 3 1 , 1999 1998 1997
Risk-free interest rate 5.43% 5.57% 6.35%
Dividend yield 1.49% 1.16% 1.67%
Volatility factor 31.88% 31.37% 27.64%
Weighted-average expected life 6.5 years 6.5 years 7 years
For purposes of pro forma disclosures, the estimated fair value of the
options is amortized to expense over the options’ vesting period. The
Company’s pro forma net earnings and earnings per share, adjusted to
include pro forma expense related to options, are as follows:
mil l ions o f do l lar sexcept per share and opt ion amount s
D E C E M B E R 3 1 , 1999 1998 1997
Net earnings – as reported $132.3 $94.7 $103.2
Net earnings – pro forma 130.7 93.1 102.9
Earnings per share – as reported (basic) 5.10 4.03 4.35
Earnings per share – as reported (diluted) 5.07 4.00 4.31
Earnings per share – pro forma (basic) 5.04 3.96 4.34
Earnings per share – pro forma (diluted) 5.01 3.93 4.30
Weighted-average fair value of options
granted during the year 19.45 18.52 19.60
Executive stock performance plan The Company has an executive
stock performance plan which provides payouts at the end of succes-
sive three-year periods based on the Company’s performance in terms
of total stockholder return relative to a peer group of automotive
companies. Payouts earned are payable 40% in cash and 60% in the
Company’s common stock. For the three-year measurement periods
37

NOTES TO CONSOLIDATED FINANCIAL STATEMENTS
B O R G W A R N E R
E L E V E N Acquisitions and Divestitures
AC QU I S I T I O N S
Kuhlman Corporation
On March 1, 1999, the Company acquired all the outstanding shares of
common stock of Kuhlman for a purchase price of $693.0 million in a
merger transaction (the “merger”). The Company funded the transaction
by issuing 3,287,127 shares of the Company’s common stock valued
at $149.8 million and borrowing $543.2 million in cash. Subject to the
provisions of the Agreement and Plan of Merger among the Company,
BWA Merger Corp., and Kuhlman, dated as of December 17, 1998,
each outstanding share of Kuhlman common stock was converted into
the right to receive (1) $39.00 in cash, without interest, or (2) $39.00
worth of shares of BorgWarner Inc. common stock. In addition, the
Company assumed additional indebtedness for the settlement of cer-
tain long-term incentive programs and severance programs, which
amounted to approximately $14 million, net of tax benefits. Substan-
tially all of such payments were made prior to closing, excluding the tax
benefit, and are included in Kuhlman’s debt balance at the date of the
merger. Subsequent to the merger, the Company refinanced Kuhlman’s
existing indebtedness assumed of $131.6 million.
The electrical products businesses acquired from Kuhlman consisted of
Kuhlman Electric and Coleman Cable. These businesses manufactured
transformers for the utility industry and wire and cable for utilities and
other industries. These products did not fit the Company’s strategic
direction and, at the time of the merger, the Company announced that it
intended to sell the businesses by the end of the year. These businesses
were accounted for as businesses held for sale during 1999, and as
such, no sales or income between the date of acquisition and their
dates of sale was included in the consolidated results of the Company.
As of December 31, 1999, the Company has completed the sales of
both Kuhlman Electric and Coleman Cable. Kuhlman Electric was sold
to Carlyle Group, L.L.C. for a net sale price of $120.1 million, including
debt securities with a face value of $15.0 million. The sale of Coleman
Cable for a net sales price of $137.3 million to a group of equity
investors, closed into escrow as of December 30 and cleared escrow
on January 4, 2000. Proceeds included debt securities with a face value
T E N Contingent Liabilities
The Company and certain of its current and former direct and indirect
corporate predecessors, subsidiaries and divisions have been identified
by the United States Environmental Protection Agency and certain
state environmental agencies and private parties as potentially respon-
sible parties (“PRPs”) at various hazardous waste disposal sites under
the Comprehensive Environmental Response, Compensation and
Liability Act (“Superfund”) and equivalent state laws and, as such, may
presently be liable for the cost of clean-up and other remedial activities
at 40 such sites. Responsibility for clean-up and other remedial activi-
ties at a Superfund site is typically shared among PRPs based on an
allocation formula.
Based on information available to the Company, which in most cases,
includes: an estimate of allocation of liability among PRPs; the probabil-
ity that other PRPs, many of whom are large, solvent public companies,
will fully pay the cost apportioned to them; currently available informa-
tion from PRPs and/or federal or state environmental agencies concern-
ing the scope of contamination and estimated remediation costs;
remediation alternatives; estimated legal fees; and other factors, the
Company has established a reserve for indicated environmental liabilities
with a balance at December 31, 1999 of approximately $17.8 million.
The Company expects this amount to be expended over the next three
to five years.
The Company believes that none of these matters, individually or in the
aggregate, will have a material adverse effect on its financial position
or future operating results, generally either because estimates of the
maximum potential liability at a site are not large or because liability will
be shared with other PRPs, although no assurance can be given with
respect to the ultimate outcome of any such matter.
38

NOTES TO CONSOLIDATED FINANCIAL STATEMENTS
mil l ions o f do l lar s
Cash paid $310.0
Estimated future payments due to Eaton Corporation 8.1
Transaction costs 0,000.0 3.6
Total purchase price 0,000.0 $321.7
The acquisition was accounted for using the purchase method of
accounting. Accordingly, the Consolidated Statements of Operations
include Eaton Fluid Power’s results since the date of acquisition. The
purchase price was allocated to the identifiable tangible and intangible
assets acquired and liabilities assumed based upon their estimated fair
values. The excess of the purchase price over the estimated fair value of
assets acquired and liabilities assumed has been accounted for as good-
will and is being amortized over 20 years using the straight-line method.
The purchase price has been allocated as follows:
mil l ions o f do l lar s
Fair value of assets acquired $ 91.1
Goodwill 255.1
Liabilities assumed (24.5)
$321.7
The following unaudited pro forma information has been prepared
assuming that both the Kuhlman merger and the Fluid Power Acquisition
had occurred at the beginning of 1998, and includes adjustments for
estimated amounts of goodwill amortization, increased interest expense
on borrowings incurred to finance the transactions, elimination of
expenses related to Kuhlman’s corporate headquarters which has been
closed, exclusion of revenues, costs and expenses for Kuhlman’s electri-
cal products businesses, including an allocation of goodwill amortization
and interest expense, and the tax effects of all the preceding adjust-
ments. Sales from divested operations of $41.3 million in 1999 and
$121.1 million in 1998 are included in the pro forma sales amounts.
mil l ions o f do l lar sexcept per share amount s
Y E A R E N D E D D E C E M B E R 3 1 , 1999 1998
Net sales $2,684.4 $2,482.4
Net earnings 134.8 105.7
Net earnings per share
Basic 5.04 3.95
Diluted 5.03 3.92
of $15.3 million. See Note ONE for the carrying value of debt securities
related to the sales. Proceeds from the sales were used to repay indebt-
edness. In the December 31, 1999 Consolidated Balance Sheet, the
Company’s net investment in Coleman Cable, is reflected as an asset
held for sale in current assets. The investment includes a portion of the
goodwill related to the merger. The amount of goodwill was allocated
based on the relative historical performance of the electrical products
business compared with the total Kuhlman business.
The Company has accounted for the merger as a purchase for finan-
cial reporting purposes. Accordingly, the Consolidated Statements of
Operations include Kuhlman’s results since the date of acquisition.
The purchase price of Kuhlman is calculated as the sum of the value
of the equity issued, the net cash paid, and the Company’s transaction
costs. An allocation of the purchase price has been performed with the
excess of the purchase price over the fair value of the identifiable tangi-
ble and intangible assets acquired, less the liabilities assumed and
incurred, recorded as goodwill to be amortized over a period of 40
years using the straight-line method. The calculation of the purchase
price is as follows:mil l ions o f do l lar s
Cash paid $536.4
BorgWarner Inc. common stock ussued 149.8
Transaction costs 0,000.0 6.8
Total purchase price 0,000.0 $693.0
The purchase price has been allocated as follows:
mil l ions o f do l lar s
Fair value of assets acquired $ 242.3
Estimated proceeds from disposition of businesses, net of tax 205.6
Goodwill 497.7
Liabilities assumed 0,000.0 (252.6)
0,000.0 $ 693.0
Eaton Corporation’s Fluid Power Division
On October 1, 1999, the Company acquired Eaton Corporation’s Fluid
Power Division (“Fluid Power Acquisition”), one of the world’s leading
manufacturers of powertrain cooling solutions for the global automotive
industry. The calculation of the purchase price is as follows:
39

NOTES TO CONSOLIDATED FINANCIAL STATEMENTS
B O R G W A R N E R
The unaudited pro forma financial information is presented for informa-
tional purposes only and is not necessarily indicative of the results of
operations that would have occurred had the transactions been consum-
mated at the beginning of 1998, nor is it necessarily indicative of the
results of operations that may occur in the future.
AG Kühnle, Kopp & Kausch
On October 31, 1997, the Company acquired 63% of the capital stock
of AG Kühnle, Kopp & Kausch (“AG Kühnle”), a German manufacturer
of turbochargers and turbomachinery, for $42.4 million. The Company
accounted for the acquisition of the turbocharger business as a pur-
chase and began consolidating it in October 1997. Because AG Kühnle’s
turbomachinery business did not fit the Company’s strategic plan, the
turbomachinery business was not consolidated and the net carrying
value was included in prepayments and other current assets as a busi-
ness to be disposed.
On October 31, 1998, the Company purchased 100% of the net
assets of the turbocharger business from AG Kühnle for $95.7 million,
renaming it 3K-Warner Turbosystems. Included in 1998 results of
operations are sales of $182.9 million and net earnings of $3.3 million
(net of minority interest of $1.1 million that existed prior to November 1,
1998). During 1999, the Company received a dividend payment of
$30.3 million and other amounts from AG Kühnle which were slightly
in excess of the Company’s remaining carrying value in AG Kühnle.
The Company intends to realize its remaining ownership of AG Kühnle
as soon as is practicable.
D I V E S T I T U R E S
Forged Powder Metal Race Business
In October 1999, the Company sold its one-way clutch forged powder
metal race business in Gallipolis, Ohio to GKN Sinter Metals, Inc., a
subsidiary of UK-based GKN plc. GKN initially paid the Company $45.5
million in the fourth quarter, subject to a post-closing adjustment. No
significant gain or loss was recorded on this sale. The forged powder
metal business was originally acquired as part of the Company’s pur-
chase of the Precision Forged Products Division of Federal-Mogul
Corporation in 1995.
T W E LV E Operating Segments and Related Information
The Company’s business comprises five operating segments: Air/Fluid
Systems, Cooling Systems, Morse TEC, TorqTransfer Systems and
Transmission Systems. These reportable segments are strategic busi-
ness units which are managed separately because each represents
a specific grouping of automotive components and systems. The
Company evaluates performance based on earnings before interest
and taxes, which emphasizes realization of a satisfactory return on the
total capital invested in each operating unit. Intersegment sales, which
are not significant, are recorded at market prices.
40

NOTES TO CONSOLIDATED FINANCIAL STATEMENTS
Operating Segmentsmil l ions o f do l lar s
Sales EarningsBefore Long-Lived
Inter- Interest Year End Depreciation/ AssetsCustomers segment Net and Taxes Assets Amortization Expendituresd
1999
Air/Fluid Systems $ 484.4 $ 7.1 $ 491.5 $ 44.9 $ 457.1 $ 20.7 $ 15.6
Cooling Systemsb 140.2 2.6 142.8 18.2 560.8 11.4 7.7
Morse TEC 829.9 26.1 856.0 112.9 1,081.6 46.1 89.7
TorqTransfer Systems 560.9 2.4 563.3 41.2 261.3 18.5 31.0
Transmission Systems 405.2 8.2 413.4 54.1 356.0 22.7 21.1
Divested operationsa 38.0 3.3 41.3 (5.0) — 2.4 3.7
Intersegment eliminations — (49.7) (49.7) — — — —
Total 2,458.6 — 2,458.6 266.3 2,716.8 121.8 168.8
Corporate, including equity in affiliates — — — (10.1) 260.4c 1.6 —
Consolidated $2,458.6 $ — $2,458.6 $256.2 $2,977.2 $123.4 $168.8
1998
Air/Fluid Systems $ 343.9 $ 7.5 $ 351.4 $ 25.1 $ 380.0 $ 17.2 $ 21.0
Morse TEC 511.4 24.8 536.2 78.5 649.0 29.0 60.3
TorqTransfer Systems 516.4 2.4 518.8 28.4 288.1 17.7 13.4
Transmission Systems 346.4 8.6 355.0 42.7 386.6 21.1 22.7
Divested operationsa 118.7 2.4 121.1 2.0 62.1 5.0 15.9
Intersegment eliminations — (45.7) (45.7) — (4.9) —
Total 1,836.8 — 1,836.8 176.7 1,760.9 90.0 133.3
Corporate, including equity in affiliates — — — (9.1) 85.2c 1.6 3.7
Consolidated $1,836.8 $ — $1,836.8 $167.6 $1,846.1 $ 91.6 $137.0
1997
Air/Fluid Systems $ 330.0 $ 12.4 $ 342.4 $ 15.1 $ 383.6 $ 16.2 $ 20.0
Morse TEC 318.3 30.7 349.0 64.7 488.8 24.8 47.8
TorqTransfer Systems 610.8 2.8 613.6 46.4 270.3 17.5 41.7
Transmission Systems 359.2 10.2 369.4 56.4 377.1 21.5 26.8
Divested operationsa 148.7 1.5 150.2 (3.2) 105.6 5.2 30.1
Intersegment eliminations — (57.6) (57.6) — (5.3) — —
Total 1,767.0 — 1,767.0 179.4 1,620.1 85.2 166.4
Corporate, including equity in affiliates — — — 3.1 116.2c 1.9 —
Consolidated $1,767.0 $ — $1,767.0 $182.5 $1,736.3 $ 87.1 $166.4
(a) The forged powder metal race business was sold in 1999. The torque converter and connecting rod businesses were sold in 1998.(b) Cooling Systems was added in 1999.(c) Corporate assets, including equity in affiliates, are net of trade receivables sold to third parties, and include cash, marketable securities, deferred taxes and investments
and advances.(d) Long-lived asset expenditures includes capital spending and additions to non-perishable tooling, net of customer reimbursements.
41

NOTES TO CONSOLIDATED FINANCIAL STATEMENTS
B O R G W A R N E R
The following table reconciles segments’ earnings before interest and
income taxes to consolidated earnings before income taxes.
mil l ions o f do l lar s
F O R T H E Y E A R S E N D E D D E C E M B E R 3 1 , 1999 1998 1997
Earnings before interest and
income taxes $256.2 $167.6 $182.5
Interest expense and finance charges (49.2) (26.9) (24.6)
Earnings before income taxes $207.0 $140.7 $157.9
Geographic information No country outside the U.S., other than
Germany, accounts for as much as 5% of consolidated net sales,
attributing sales to the sources of the product rather than the location of
the customer. For this purpose, the Company’s 50% equity investment in
NSK Warner (Note FIVE) amounting to $154.1 million at December 31,
1999 is excluded from the definition of long-lived assets, as are goodwill
and certain other noncurrent assets.
mil l ions o f do l lar s
Net Sales Long-Lived Assets
1999 1998 1997 1999 1998 1997
United States $1,848.4 $1,410.0 $1,485.2 $574.1 $494.9 $508.7
Europe:
Germany 325.6 264.2 98.9 128.9 91.7 76.1
Other Europe 165.6 93.6 89.6 67.1 55.5 51.6
Total Europe 491.2 357.8 188.5 196.0 147.2 127.7
Other Foreign 119.0 69.0 93.3 89.2 56.3 43.2
Total $2,458.6 $1,836.8 $1,767.0 $859.3 $698.4 $679.6
Sales to major customers Consolidated sales included sales to
Ford Motor Company of approximately 31%, 36% and 43%; to Daimler-
Chrysler of approximately 19%, 19% and 14%; and to General Motors
Corporation of approximately 13%, 16% and 20% for the years ended
December 31, 1999, 1998 and 1997, respectively. No other single cus-
tomer accounted for 10% or more of consolidated sales in any year
between 1997 and 1999. Such sales consisted of a variety of products
to a variety of customer locations worldwide. Each of the five operating
segments had significant sales to all three of the customers listed above.
Interim Financial Information (Unaudited)The following information includes all adjustments, as well as normal recurring items, that the Company considers necessary for a fair presentation of
1999 and 1998 interim results of operations. Certain 1999 and 1998 quarterly amounts have been reclassified to conform to the annual presentation.
mil l ions o f do l lar s except per share amount s
1999 1998
Q UA RT E R E N D E D, March 31 June 30 Sept. 30 Dec. 31 Year 1999 March 31 June 30 Sept. 30 Dec. 31 Year 1998
Net sales $551.3 $640.8 $589.7 $676.8 $2,458.6 $464.7 $451.3 $431.6 $489.2 $1,836.8
Cost of sales 424.4 491.7 458.6 513.8 1,888.5 365.7 359.4 340.4 385.2 1,450.7
Depreciation 20.5 22.8 22.6 25.4 91.3 19.3 19.3 18.9 17.3 74.8
Selling, general and administrative
expenses 42.4 53.5 51.0 56.4 203.3 37.2 34.5 34.1 29.3 135.1
Minority interest 0.4 0.4 0.4 0.1 1.3 0.7 0.8 0.9 (0.3) 2.1
Goodwill amortization 5.7 7.7 7.7 11.0 32.1 4.2 4.2 4.3 4.1 16.8
Equity in affiliate earnings and
other income (2.5) (4.6) (3.9) (3.1) (14.1) (5.5) (2.9) (0.5) (1.4) (10.3)
Earnings before interest
expense, finance charges
and income taxes 60.4 69.3 53.3 73.2 256.2 43.1 36.0 33.5 55.0 167.6
Interest expense and
finance charges 8.6 12.6 10.5 17.5 49.2 6.0 7.0 7.6 6.3 26.9
Earnings before income taxes 51.8 56.7 42.8 55.7 207.0 37.1 29.0 25.9 48.7 140.7
Provision for income taxes 19.7 20.4 15.4 19.2 74.7 11.1 9.4 8.6 16.9 46.0
Net earnings $ 32.1 $ 36.3 $ 27.4 $ 36.5 $ 132.3 $ 26.0 $ 19.6 $ 17.3 $ 31.8 $ 94.7
Net earnings per share – basic $ 1.33 $ 1.36 $ 1.03 $ 1.36 $ 5.10 $ 1.10 $ 0.84 $ 0.74 $ 1.35 $ 4.03
Net earnings per share – diluted $ 1.32 $ 1.35 $ 1.02 $ 1.36 $ 5.07 $ 1.09 $ 0.83 $ 0.73 $ 1.35 $ 4.00
42
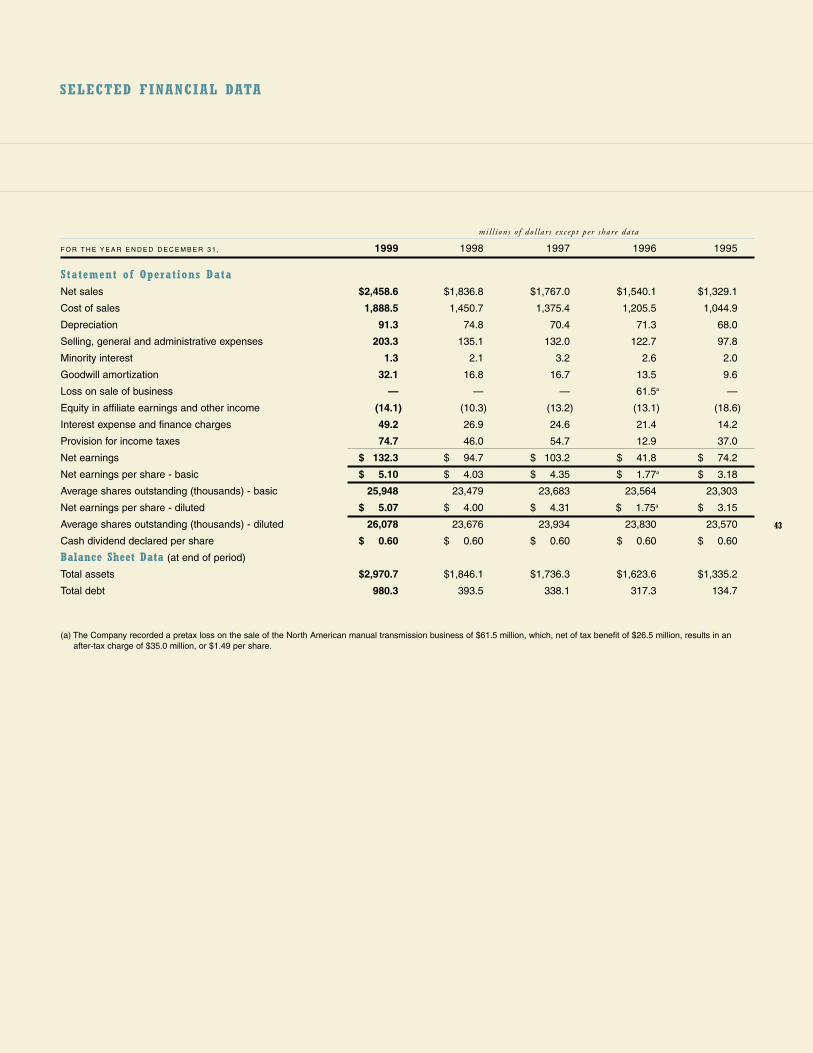
SELECTED FINANCIAL DATA
mil l ions o f do l lar s except per share data
F O R T H E Y E A R E N D E D D E C E M B E R 3 1 , 1999 1998 1997 1996 1995
Statement of Operations DataNet sales $2,458.6 $1,836.8 $1,767.0 $1,540.1 $1,329.1
Cost of sales 1,888.5 1,450.7 1,375.4 1,205.5 1,044.9
Depreciation 91.3 74.8 70.4 71.3 68.0
Selling, general and administrative expenses 203.3 135.1 132.0 122.7 97.8
Minority interest 1.3 2.1 3.2 2.6 2.0
Goodwill amortization 32.1 16.8 16.7 13.5 9.6
Loss on sale of business — — — 61.5a —
Equity in affiliate earnings and other income (14.1) (10.3) (13.2) (13.1) (18.6)
Interest expense and finance charges 49.2 26.9 24.6 21.4 14.2
Provision for income taxes 74.7 46.0 54.7 12.9 37.0
Net earnings $ 132.3 $ 94.7 $ 103.2 $ 41.8 $ 74.2
Net earnings per share - basic $ 5.10 $ 4.03 $ 4.35 $ 1.77a $ 3.18
Average shares outstanding (thousands) - basic 25,948 23,479 23,683 23,564 23,303
Net earnings per share - diluted $ 5.07 $ 4.00 $ 4.31 $ 1.75a $ 3.15
Average shares outstanding (thousands) - diluted 26,078 23,676 23,934 23,830 23,570
Cash dividend declared per share $ 0.60 $ 0.60 $ 0.60 $ 0.60 $ 0.60
Balance Sheet Data (at end of period)
Total assets $2,970.7 $1,846.1 $1,736.3 $1,623.6 $1,335.2
Total debt 980.3 393.5 338.1 317.3 134.7
(a) The Company recorded a pretax loss on the sale of the North American manual transmission business of $61.5 million, which, net of tax benefit of $26.5 million, results in an after-tax charge of $35.0 million, or $1.49 per share.
43

CORPORATE INFORMATION
B O R G W A R N E R
Company InformationBorgWarner Inc.
200 South Michigan Avenue
Chicago, IL 60604
312-322-8500
Stock ListingShares are listed and traded on the New York Stock Exchange.
Ticker symbol: BWA.
H i g h L o w
Fourth Quarter 1999 $ 433⁄8 $ 363⁄4
Third Quarter 1999 577⁄8 407⁄8
Second Quarter 1999 60 463⁄8
First Quarter 1999 56 427⁄16
H i g h L o w
Fourth Quarter 1998 $ 5513⁄16 $ 335⁄16
Third Quarter 1998 519⁄16 371⁄16
Second Quarter 1998 681⁄8 4311⁄16
First Quarter 1998 641⁄2 495⁄8
DividendsThe current dividend practice established by the directors is to declare
regular quarterly dividends. The last such dividend of 15 cents per
share of common stock was declared on January 20, 2000, payable
February 15, 2000, to stockholders of record on February 1, 2000.
The current practice is subject to review and change at the discretion
of the Board of Directors.
StockholdersAs of December 31, 1999, there were 3,304 holders of record and an
estimated 10,000 beneficial holders.
Annual Meeting of StockholdersThe 2000 annual meeting of stockholders will be held on Wednesday,
April 26, 2000, beginning at 11:00 a.m. on the 19th floor of the
Company’s headquarters at 200 South Michigan Avenue in Chicago.
Securities InformationChaseMellon Shareholder Services is the transfer agent, registrar and
dividend dispersing agent for BorgWarner common stock. Communica-
tions concerning stock transfer, change of address, lost stock certifi-
cates or proxy statements for the annual meeting should be directed to:
ChaseMellon Shareholder Services for BorgWarner
450 West 33rd Street, 15th Floor
New York, NY 10001
800-851-4229
http://www.cmssonline.com
Investor InquiriesFinancial investors and securities analysts requiring financial reports,
interviews or other information should contact Mary Brevard, Director
of Investor Relations and Communications, at the Company’s head-
quarters, 312-322-8683.
Form 10-K ReportA copy of the Company’s annual report on Form 10-K, filed with the
Securities and Exchange Commission, is available to stockholders
without charge through the Company’s internet homepage or by writ-
ing the Investor Relations and Communications Department at the
Company’s headquarters or by calling 312-322-8524.
Dividend Reinvestment and Stock Purchase PlanThe BorgWarner Dividend Reinvestment and Stock Purchase Plan
has been established so that anyone can make direct purchases of
BorgWarner common stock and reinvest dividends. The Company
pays the brokerage commissions on purchases. To receive a prospec-
tus and enrollment package, contact ChaseMellon at 800-842-7629.
Questions about the plan can be directed to ChaseMellon at
800-851-4229. Information is also available through the Company’s
internet homepage.
Internet HomepageFor current news, stock quotes and other information on BorgWarner,
visit our new Internet Homepage: www.bwauto.com.
, BorgWarner, TORQUE-ON-DEMAND, MORSE, GEMINI, HY-VO and the
BorgWarner Indianapolis 500 Trophy are registered trademarks of BorgWarner Inc.
44

D I R E C T O R S E X E C U T I V E O F F I C E R S
Dr. Andrew F. Brimmer (2) President Brimmer & Company, Inc.
Jere A. Drummond (1,3,4) Vice ChairmanBellSouth Corporation
Paul E. Glaske (3,4) Chairman, President and Chief Executive Officer, Retired Blue Bird Corporation
James J. Kerley (2) Chairman, Retired Rohr, Inc.
Alexis P. Michas (1,2) Managing Partner and Director Stonington Partners, Inc.
John F. Fiedler Chairman and Chief Executive Officer
Lawrence B. SkatoffExecutive Vice President andChief Financial Officer
Gary P. Fukayama Executive Vice PresidentGroup President and General Manager,Air/Fluid Systems
Ronald M. Ruzic Executive Vice President Group President and General Manager, Morse TEC and Turbo Systems
Robert D. Welding Executive Vice President President and General Manager, Transmission Systems
Timothy M. ManganelloVice President President and General Manager, TorqTransfer Systems
John J. McGillVice PresidentPresident and General Manager,Cooling Systems
F. Lee WilsonVice PresidentPresident and General Manager,Turbo Systems
Jeffrey L. ObermayerVice President and Treasurer
William C. ClineVice President and Controller
Christopher A. Gebelein Vice President, Business Development
Laurene H. Horiszny Vice President, General Counsel andSecretary
John A. KalinaVice President and Chief Information Officer
Geraldine Kinsella Vice President, Human Resources
William E. Butler (3,4) Chairman and ChiefExecutive Officer, Retired Eaton Corporation
John F. Fiedler (1)Chairman and ChiefExecutive OfficerBorgWarner Inc.
Ivan W. Gorr (4)Chairman and Chief Executive Officer, Retired Cooper Tire & Rubber Company
John Rau (2,3)President and Chief Executive Officer Chicago Title Corporation
Phyllis Bonanno (2)PresidentColumbia College
COMMITTEES OF THE BOARD
1 Executive Committee
2 Finance and Audit Committee
3 Compensation Committee
4 Board Affairs Committee

2 0 0 S O U T H M I C H I G A N A V E N U E | C H I C A G O , I L 6 0 6 0 42 0 0 S O U T H M I C H I G A N A V E N U E | C H I C A G O , I L 6 0 6 0 4