Evaluation of the impact of explanatory variables on the ...
8
Introduction Operation of sewage treatment plants of communal sewage is a very complicated task when several technological processes must be controlled to get the required grade of the pollution reduction. This complication is caused by the stochastic character of the sewage inflow depending on the rainfall values, water level in the sewage recipient and on the amount of the water production whose variability leads to the great and mostly violent changes of the raw sewage inflow and the pollution loads. In order to operate correctly a treatment plant relevant information concerning the amount and load concentration of the sewage inflow shall be known with what the process technologist will be able to prepare the object for the approaching event by the choice of optimal settings of the installation clearing the sewage. The prediction of the sewage inflowing during an hour, a day or a week makes it possible to identify abnormal events that could occur for example in the wake of intensive rainfalls. In such situations the small pollution loads and excessive sewage amounts can cause some disturbances in the object functioning and this functional disorder can result in unsuitable decisions undertaken by the technologist responsible for the process management. The return of the process disturbed to the primary state is usually very expensive and time consuming what the practice shows and because of that broad research is conducted in Poland and abroad for developing mathematical models prognosticating the amount and quality of the inflowing sewage (Henze et al. 2000). Usually the soft computing models are used in such investigation whose mathematical description has not got any connection with the modelled processes and their physical interpretation. These models are mostly described by artificial neural networks (Wei et al. 2015, Bartkiewicz et al. 2016, Licznar 2004), regression trees (boosted trees, random forest etc.), support vector machines (Wei et al. 2015, Szeląg and Gawdzik 2016), wavelet analysis (Borowa et. al. 2007) and fuzzy logic (Bartkiewicz et al., 2010, Studzinski et al., 2013). Another group of the models are grey box models whose parameters have got already some physical interpretation and which are described by the methods of auto-regression (Delana and West, 2009), stochastic transfer function (Young 2001, Nesmerak et al. 2014) or multiple regression (Abyaneh, Archives of Environmental Protection Vol. 43 no. 3 pp. 74–81 PL ISSN 2083-4772 DOI 10.1515/aep-2017-0030 © Copyright by Polish Academy of Sciences and Institute of Environmental Engineering of the Polish Academy of Sciences, Zabrze, Poland 2017 Evaluation of the impact of explanatory variables on the accuracy of prediction of daily inflow to the sewage treatment plant by selected models nonlinear Bartosz Szeląg 1 *, Lidia Bartkiewicz 1 , Jan Studziński 2 , Krzysztof Barbusiński 3 1 Kielce University of Technology, Poland 2 Systems Research Institute PAN, Poland 3 Silesian University of Technology, Poland * Corresponding author’s e-mail: [email protected] Keywords: wastewater treatment plant, Data Mining, Random forest, forecasting inflow, k – nearest neighbour, Kernel regression. Abstract: The aim of the study was to evaluate the possibility of applying different methods of data mining to model the inflow of sewage into the municipal sewage treatment plant. Prediction models were elaborated using methods of support vector machines (SVM), random forests (RF), k-nearest neighbour (k-NN) and of Kernel regression (K). Data consisted of the time series of daily rainfalls, water level measurements in the clarified sewage recipient and the wastewater inflow into the Rzeszow city plant. Results indicate that the best models with one input delayed by 1 day were obtained using the k-NN method while the worst with the K method. For the models with two input variables and one explanatory one the smallest errors were obtained if model inputs were sewage inflow and rainfall data delayed by 1 day and the best fit is provided using RF method while the worst with the K method. In the case of models with three inputs and two explanatory variables, the best results were reported for the SVM and the worst for the K method. In the most of the modelling runs the smallest prediction errors are obtained using the SVM method and the biggest ones with the K method. In the case of the simplest model with one input delayed by 1 day the best results are provided using k-NN method and by the models with two inputs in two modelling runs the RF method appeared as the best.
Transcript of Evaluation of the impact of explanatory variables on the ...
IntroductionOperation of sewage treatment plants of communal sewage is a very complicated task when several technological processes must be controlled to get the required grade of the pollution reduction. This complication is caused by the stochastic character of the sewage infl ow depending on the rainfall values, water level in the sewage recipient and on the amount of the water production whose variability leads to the great and mostly violent changes of the raw sewage infl ow and the pollution loads. In order to operate correctly a treatment plant relevant information concerning the amount and load concentration of the sewage infl ow shall be known with what the process technologist will be able to prepare the object for the approaching event by the choice of optimal settings of the installation clearing the sewage. The prediction of the sewage infl owing during an hour, a day or a week makes it possible to identify abnormal events that could occur for example in the wake of intensive rainfalls. In such situations the small pollution loads and excessive sewage amounts can cause some disturbances in the object functioning and this functional
disorder can result in unsuitable decisions undertaken by the technologist responsible for the process management. The return of the process disturbed to the primary state is usually very expensive and time consuming what the practice shows and because of that broad research is conducted in Poland and abroad for developing mathematical models prognosticating the amount and quality of the infl owing sewage (Henze et al. 2000). Usually the soft computing models are used in such investigation whose mathematical description has not got any connection with the modelled processes and their physical interpretation. These models are mostly described by artifi cial neural networks (Wei et al. 2015, Bartkiewicz et al. 2016, Licznar 2004), regression trees (boosted trees, random forest etc.), support vector machines (Wei et al. 2015, Szeląg and Gawdzik 2016), wavelet analysis (Borowa et. al. 2007) and fuzzy logic (Bartkiewicz et al., 2010, Studzinski et al., 2013). Another group of the models are grey box models whose parameters have got already some physical interpretation and which are described by the methods of auto-regression (Delana and West, 2009), stochastic transfer function (Young 2001, Nesmerak et al. 2014) or multiple regression (Abyaneh,
Archives of Environmental ProtectionVol. 43 no. 3 pp. 74–81
PL ISSN 2083-4772DOI 10.1515/aep-2017-0030
© Copyright by Polish Academy of Sciences and Institute of Environmental Engineering of the Polish Academy of Sciences,Zabrze, Poland 2017
Evaluation of the impact of explanatory variables on the accuracy of prediction of daily infl ow
to the sewage treatment plant by selected models nonlinear
Bartosz Szeląg1*, Lidia Bartkiewicz1, Jan Studziński2, Krzysztof Barbusiński3
1 Kielce University of Technology, Poland2 Systems Research Institute PAN, Poland3 Silesian University of Technology, Poland
* Corresponding author’s e-mail: [email protected]
Keywords: wastewater treatment plant, Data Mining, Random forest, forecasting infl ow, k – nearest neighbour, Kernel regression.
Abstract: The aim of the study was to evaluate the possibility of applying different methods of data mining to model the infl ow of sewage into the municipal sewage treatment plant. Prediction models were elaborated using methods of support vector machines (SVM), random forests (RF), k-nearest neighbour (k-NN) and of Kernel regression (K). Data consisted of the time series of daily rainfalls, water level measurements in the clarifi ed sewage recipient and the wastewater infl ow into the Rzeszow city plant. Results indicate that the best models with one input delayed by 1 day were obtained using the k-NN method while the worst with the K method. For the models with two input variables and one explanatory one the smallest errors were obtained if model inputs were sewage infl ow and rainfall data delayed by 1 day and the best fi t is provided using RF method while the worst with the K method. In the case of models with three inputs and two explanatory variables, the best results were reported for the SVM and the worst for the K method. In the most of the modelling runs the smallest prediction errors are obtained using the SVM method and the biggest ones with the K method. In the case of the simplest model with one input delayed by 1 day the best results are provided using k-NN method and by the models with two inputs in two modelling runs the RF method appeared as the best.

Evaluation of the impact of explanatory variables on the accuracy of prediction of daily infl ow to the sewage treatment... 75
2014, Chuchro 2009). In the paper of Chuchro (2009) some models described by the methods of neural networks, auto--regression and multiple regression as well as ARIMA models have been used to forecast the sewage infl ows in the sewage treatment plant in Kraków, Sandomierz, Tarnobrzeg, Warsaw and Serock and the calculations done show their practical usefulness. The results received by Chuchro were similar to those obtained by Wei and Kusiak (2015) and by El-Din (2009) who have developed the sewage infl ow models by means of neural networks and using as the input variables the delayed infl ow and rainfall data. The impact of singular independent variables like sewage infl ow and rainfall on the quality of the sewage infl ow models has been investigated by Bartkiewicz et al. (2016) but only the ANN methods have been used then like in the research done by Wei and Kusiak (2015) and by El-Din. In the papers mentioned the ground waters level was not considered as the model input variable that can determine essentially the sewage infl ow in the case of leaking sanitary canals. It is also to be noticed that in the papers the searches of the best combination of the independent variables and of the fairest input data delays minimizing the errors of the sewage infl ow prediction while using different modelling methods have not been considered. Ability predictive of complex statistical models, including methods of learning, have been tested by many researchers on the example of the forecast runoff from the catchment (Abhart and Lee, 2002), the temperature of water in the watercourse (Piotrowski et al. 2014), surface runoff (Adamowski et al. 2012), etc.
Another remark that results from the literature overview (Borowa et al. 2007, Han et al. 2016) is that for the forecasting the sewage infl ow into the sewage treatment plant the methods of k-nearest neighbour (k-NN) and of random forest (RF) have not been yet used although their application to model the biological sewage treatment reactors was successfully confi rmed. The advantage of these methods is besides their satisfying prediction ability also the relatively simple model structure which is much simpler than by the ANN methods and this simplicity is important in practical applications by shortening the time of models calculation. On another side, the non-parametric method of Kernel regression (Kernel) is also relatively simple and has got satisfactory prediction ability as the k-NN and RF methods. It has been successfully applied to predict the water levels and fl ows in some catchment areas (Jonsodottir et al. 2007) but it has not been used to forecast the sewage infl ows to sewage treatment plant. Apart from the above mentioned methods also the method of support vector machines (SVM) has been applied to forecast the biochemical processes in sewage treatment plant but it has not been used to predict the sewage infl ows into the sewage treatment plant. The results of sewage treatment plant simulation obtained with SVM are similar to those got with k-NN and RF but it needs to be remarked that the models structure defi ned for SVM is much more complex than by the RF, k-NN, Kernel or ANN methods.
For this reason it seems to be suitable and advisable to analyse the usefulness of some other kinds of models by forecasting the raw sewage infl ows and to compare their abilities of prediction. In the paper the modelling methods of support vector machines, random forest, k-nearest neighbour and Kernel regression have been investigated and compared. Also the impact of input data on the prediction features of the models has been analysed. To calculate the models the 3-year measurement data concerning
the daily values of sewage infl ows, rain falls and water levels in the sewage recipient have been used.
The object of investigationThe object investigated is the wastewater treatment plant in Rzeszów built in the years of 1974-1988 and modernized many times later. The average capacity of the object is Qdśr = 62.500 m3/d and its maximal capacity is Qdmax = 75.000 m3/d and the equivalent number of the city inhabitants is equal to 400.000 RLM. The technology of wastewater treatment consists of mechanical and biological sewage clearing with the integrated removing of biogene substances. The technology rests on the conventional multiphase activated sludge realizing in the circulated way the preceding denitrifi cation and nitrifi cation of the wastewater. The key elements of the object are the staircase bars, horizontal sand traps, primary clarifi ers, activated sludge chambers and humus tanks (secondary clarifi ers). The object investigated collects the wastewater from the area of the city of Rzeszów. In the city a separate sewage system works which in principle consists of the sanitary and surface drainage sewers. In the old part of the city the separate system involves ca. 85% of the whole canalisation and the rest is the drainage sewers while in some parts of the city this latter drainage is lacking. Over 50% of the collectors’ length are the concrete canals and 65% of the sewerage exceeds its usage time of 20 years. The ground water level in the city area depends strongly on the water states in the Wisłok river passing the city and on its infl ows that collect the rainwater from the Dynowski plateau. By the high levels of the ground water which are locally ca. 0.3 m under the terrain level and by the big amounts of the rainwater an essential increase of the canals fi lling can be observed.
The methodology of investigationTo model the daily sewage infl ow into the wastewater treatment plant the methods of support vectors, random forest, k-nearest neighbours and Kernel regression have been used. The input signals to the models are different combinations of rainfall values measured at the Jesionka station, of water levels in the Wisłok river and of the sewage infl ows to the sewage treatment plant measured on the object input in the years 2005–2008 (IMGW). On the fi rst stage of the modelling in order to make the optimal choice of the model inputs their normalisation by the min-max transformation has been done (Rutkowski 2006) and the relevant correlation matrix has been calculated. Following by the means of the classifi cation trees method there was determined which inputs have got the biggest impact on the modelled daily sewage infl ow.
The linear multiple regression is the very known method of mathematical modelling (Box and Jenkins 1976) that enables the calculation of the variable being the model output (y) as a sum of a free element and the products of weight components and separated input variables. But in many calculations the identifi cation of the function describing the process modelled is diffi cult or not possible at all. So, some modifi cations of the linear regression method have been done and one of their variants is the Kernel regression in which families of smoothing functions are used. In the Kernel regression model (Kernel) the expected value of the variable investigated is calculated form the relation:
76 B. Szeląg, L. Bartkiewicz, J. Studziński, K. Barbusiński
(1)
=
=
⋅= n
iix
n
iiix
w
ywxm
1
1)(
where: wix – weight components determined from the formula wix=h-1∙K[(x-xi)/h]=Kh(x-xi) in which K(x) is called the estimator core and is usually in the form of the Gauss or Espanechnikov function; in the paper the latter function has been used in the calculations; h – smoothing coeffi cient determined by means of some appropriate algorithms (Simonoff 1996, Kulczycki, 2005).
The method of support vector machines (SVM) was applied fi rstly to solve the discrimination tasks but as it proved to be very effective and fast then it was used for the solution of regression problems (Vapnik 1998). For the relation between the dependent variable y and the independent variables x can be nonlinear then the nonlinear transformation φ:XL→Z from the teaching set of observations into a space of a bigger dimension is used in the SVM method. This transformation allows to use the method by the solution of complicated problems in the classifi cation and regression tasks.
The method of random forest (RF) has been developed by Breiman (2000) and it is used now by solving the classifi cation as well as the regression problems. In this method some random samples are taken from the teaching set by means of randomisation with return approach and then using these samples (n) training samples for the individual trees are created. In the following (n) tree structures are generated using a relevant algorithm. It must be emphasized that the choice of variables in the tree nodes in the RF method is of stochastic nature in difference to the method of regression trees.
The method of the k-nearest neighbours (k-NN) is one of the simplest nonparametric modelling methods and it can be used successfully for solving both the classifi cation and regression tasks similarly to the methods mentioned above (Piotrowski et al. 2006). The forecast of the depending variable value is calculated from the formula:
),(11
ji
N
ii xxJy
Ky
=
∧⋅= (2)
where: xi – one of K- nearest neighbours xj if the linear measure d(xi,xj) belongs to the smallest measures between the observations from the set ZN={(x1,y1),…,(xn,yn)}ϵR
p+1; xi=(x1,i,…,xp,i) – vector of (p) independent variables; yi – dependent variable, N – number of observations, J(xi, xj) – the following function:
=
otherwise
xforneighboursclosestKofoneisxifxxJ
jiji ,0
,1),( (3)
In the calculations mostly the linear measures of Euklides and Mahalanobis are applied. Mahalanobis distance is the distance between two points in n – dimensional space differentiating the contribution of the individual components and taking into account the correlations between them.
To assess the prediction abilities of the models developed the following formulas have been used:
– average relative error:
%10011 ,
,, ⋅−
⋅==
n
i obsi
prediobsi
yyy
nMAPE (4)
– average absolute error:
%10011
,, ⋅−⋅==
n
iprediobsi yy
nMAE (5)
where: n – number of data in the time series, yi,obs,pred – measured/calculated daily sewage infl ow to the sewage treatment plant, ŷi,obs/pred – average value of the measured/calculated daily sewage infl ow.
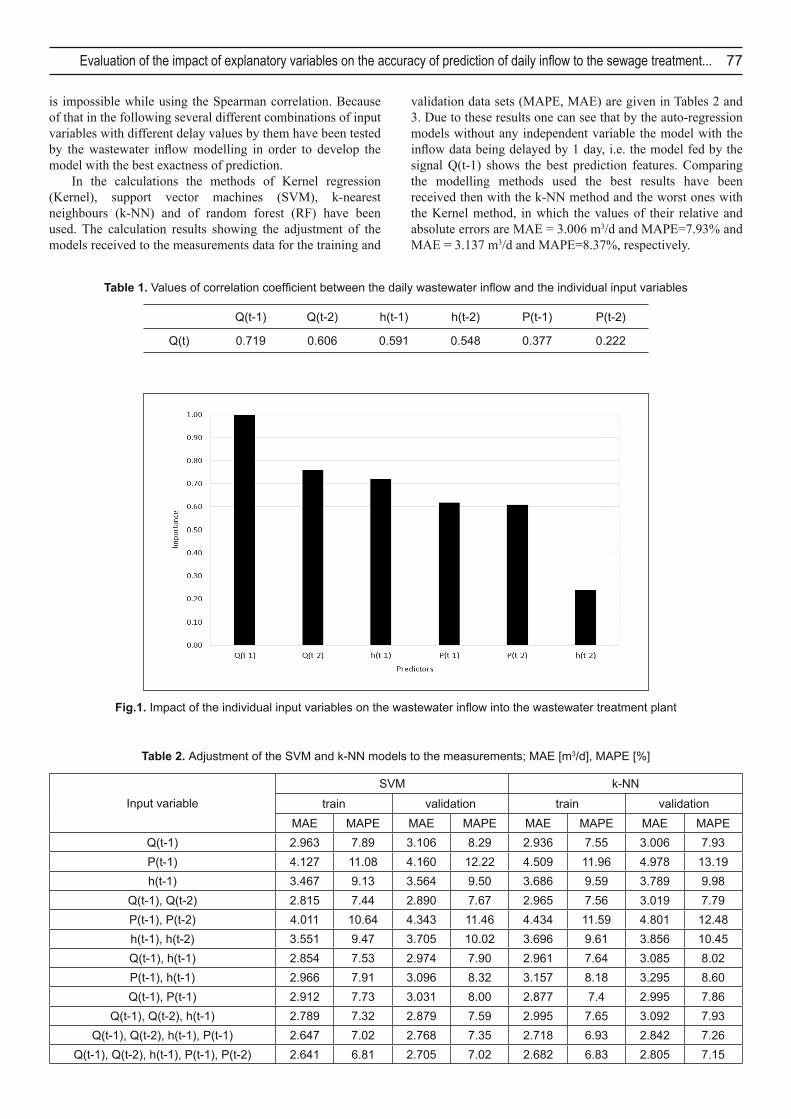
Calculation resultsAfter analysis of the measurements data one can say that in the time period investigated, i.e. of the years 2005–2008, the daily sewage infl ow into the sewage treatment plant changed from 24.306 m3/d in the antecedent periods up to 73.640 m3/d during the intensive rainfalls. The water levels in the Wisłok river had in this time the values from 0.41 m up to 5.58 m which resulted from the daily rainfall values change in the range 0–59.2 mm. Basing on the available data the time series for water levels, rainfall values and sewage fl ows with the delays of 1 and 2 days have been determined and then the impact of the prepared new input data on the sewage infl ow was settled by the calculation of the Spearman correlation coeffi cient and also by means of the classifi cation trees algorithm (see Tab. 1 and Fig. 1).
By means of these results the input variables with the biggest impact on the wastewater infl ow Q(t) could be determined and used for the models calculation. The calculation shows that the variables Q(t-1) and Q(t-2) have got the biggest impact on the infl ow what is confi rmed by the variable importance values equal to 1.00 and 0.77 and by the correlation coeffi cients equal to 0.719 and 0.606 received for them and shown in Fig. 1 and Table 1 respectively. One can see also that the water level in the river delayed by 1 day, i.e. the variable h(t-1) has got the similar impact on Q(t) as the variable Q(t-2), being the wastewater infl ow delayed by 2 days. As to assessment of the rainfall values P(t) and the water level h(t-2) on the infl ow there is some divergence between the results received by means of the Spearman correlation and of the classifi cation trees. According to Fig. 1 the water level in the Wisłok delayed by 1 day, i.e. the variables h(t-1), as well as the rainfall variables delayed by 1 and 2 days, i.e. P(t-1) and P(t-2) have got quite similar impact on the wastewater infl ow and only slightly smaller than the variable Q(t-2) while the water level delayed by 2 days, i.e. the variable h(t-2) infl uences the infl ow in a negligible grade. In contrast, according to Table 1 the impact of h(t-2) on the infl ow Q(t) is only slightly smaller than this one of h(t-1) and Q(t-2) while the infl uence of the variables P(t-1) and P(t-2) on Q(t) is insignifi cant. These differences by the interpretation of the data in Fig. 1 and Table 1 are caused by the fact that the classifi cation trees algorithm makes it possible to assess nonlinear relations between the variables investigated and this
Evaluation of the impact of explanatory variables on the accuracy of prediction of daily infl ow to the sewage treatment... 77
is impossible while using the Spearman correlation. Because of that in the following several different combinations of input variables with different delay values by them have been tested by the wastewater infl ow modelling in order to develop the model with the best exactness of prediction.
In the calculations the methods of Kernel regression (Kernel), support vector machines (SVM), k-nearest neighbours (k-NN) and of random forest (RF) have been used. The calculation results showing the adjustment of the models received to the measurements data for the training and
validation data sets (MAPE, MAE) are given in Tables 2 and 3. Due to these results one can see that by the auto-regression models without any independent variable the model with the infl ow data being delayed by 1 day, i.e. the model fed by the signal Q(t-1) shows the best prediction features. Comparing the modelling methods used the best results have been received then with the k-NN method and the worst ones with the Kernel method, in which the values of their relative and absolute errors are MAE = 3.006 m3/d and MAPE=7.93% and MAE = 3.137 m3/d and MAPE=8.37%, respectively.
Fig.1. Impact of the individual input variables on the wastewater infl ow into the wastewater treatment plant
Table 1. Values of correlation coeffi cient between the daily wastewater infl ow and the individual input variables
Q(t-1) Q(t-2) h(t-1) h(t-2) P(t-1) P(t-2)
Q(t) 0.719 0.606 0.591 0.548 0.377 0.222
Table 2. Adjustment of the SVM and k-NN models to the measurements; MAE [m3/d], MAPE [%]
Input variableSVM k-NN
train validation train validationMAE MAPE MAE MAPE MAE MAPE MAE MAPE
Q(t-1) 2.963 7.89 3.106 8.29 2.936 7.55 3.006 7.93P(t-1) 4.127 11.08 4.160 12.22 4.509 11.96 4.978 13.19h(t-1) 3.467 9.13 3.564 9.50 3.686 9.59 3.789 9.98
Q(t-1), Q(t-2) 2.815 7.44 2.890 7.67 2.965 7.56 3.019 7.79P(t-1), P(t-2) 4.011 10.64 4.343 11.46 4.434 11.59 4.801 12.48h(t-1), h(t-2) 3.551 9.47 3.705 10.02 3.696 9.61 3.856 10.45Q(t-1), h(t-1) 2.854 7.53 2.974 7.90 2.961 7.64 3.085 8.02P(t-1), h(t-1) 2.966 7.91 3.096 8.32 3.157 8.18 3.295 8.60Q(t-1), P(t-1) 2.912 7.73 3.031 8.00 2.877 7.4 2.995 7.86
Q(t-1), Q(t-2), h(t-1) 2.789 7.32 2.879 7.59 2.995 7.65 3.092 7.93Q(t-1), Q(t-2), h(t-1), P(t-1) 2.647 7.02 2.768 7.35 2.718 6.93 2.842 7.26
Q(t-1), Q(t-2), h(t-1), P(t-1), P(t-2) 2.641 6.81 2.705 7.02 2.682 6.83 2.805 7.15
78 B. Szeląg, L. Bartkiewicz, J. Studziński, K. Barbusiński
While developing the models under consideration of only one independent variable from the available variables P(t) and h(t) the worst results are obtained for the daily rainfall data delayed by 1 day, i.e. for P(t-1), what can be seen from the outcomes recorded in Tables 2 and 3. Then the best prediction results have been received with use of the SVM method (MAE=4.160 m3/d and MAPE =12.12%) and the worst ones with the k-NN method (MAE=4.978 m3/d and MAPE=13.19%). The modelling results gained for the water level data delayed by 1 day, i.e. for h(t-1) are placed between the results for Q(t-1) and P(t-1) and also as the best method proved itself the SVM method and as the worst one the Kernel method. Qualitatively similar results have been got for individual input data delayed by 1 and 2 days. The models developed by means of the SVM method were best for the infl ow data Q(t-1) and Q(t-2) with the adjustment parameters MAE=2.890 m3/d and MAPE=7.67%; the models were slightly worse for the input variables h(t-1) and h(t-2) (MAE=3.705 m3/d and MAPE=10.02%) and they were worst for the variables P(t-1) and P(t-2) (MAE=4.343 m3/d, MAPE=11.46%). The best method for the inputs h(t-1) and h(t-2) proved itself to be the RF method with MAE=3.572 m3/d and MAPE=9.56% and for the inputs P(t-1) and P(t-2) it was the SVM method with MAE=4.343 m3/d and MAPE=11.46%, alike as it was in the case of the infl ow data Q(t-1) and Q(t-2). For these individual inputs the worst modelling results have been received with the Kernel method by the input variables Q(t-1) and Q(t-2) (MAE=3.044 m3/d and MAPE=8.06%) and with the k-NN method by the input variables h(t-1) and h(t-2) (MAE=3.856 m3/d, MAPE=10.45%) as well as by the variables P(t-1) and P(t-2) (MAE=4.801 m3/d and MAPE=12.48%). While analysing farther the calculation results obtained it can be noticed that by the models with two independent variables being the combinations of two input signals from the variables set Q(t), h(t) and P(t) the smallest values of relative and absolute errors of modelling are got if the model inputs are wastewater infl ow and rainfall height delayed by 1 day, i.e. the variables Q(t-1) and P(t-1). In this case the best prediction values are received with help of the RF method (MAE=2.892 m3/d and MAPE=7.66%) and the worst ones with the Kernel method
(MAE=3.271 m3/d and MAPE=8.69%). The worst adjustment of the results to the measurement data is got for the independent variables combination P(t-1) and h(t-1). Then the best model has been developed using the SVM method (MAE=3.096 m3/d i MAPE=8.32%) and the worst one with the Kernel method (MAE=3.310 m3/d i MAPE=8.84%). The combination of variables Q(t-1) and h(t-1) as the model inputs gives usually intermediate results and once again the SVM method is then the best and the Kernel method is the worst one. The following analysis concerns the models with two independent variables and three input signals Q(t-1), Q(t-2) and h(t-1). In this case the best models have been obtained by means of the SVM method (MAE=2.879 m3/d and MAPE=7.59%) and the worst ones with the Kernel method (MAE=3.167 m3/d and MAPE=8.39%). Besides one can see that the consideration of the water level variable h(t-1) in the model fed already with the input data Q(t-1) and Q(t-2) makes worse its prediction ability while using the Kernel and k-NN methods. On the another side such the approach has not got any essential infl uence on the models received with the SVM and RF methods although the prediction results show then some slight improvement.
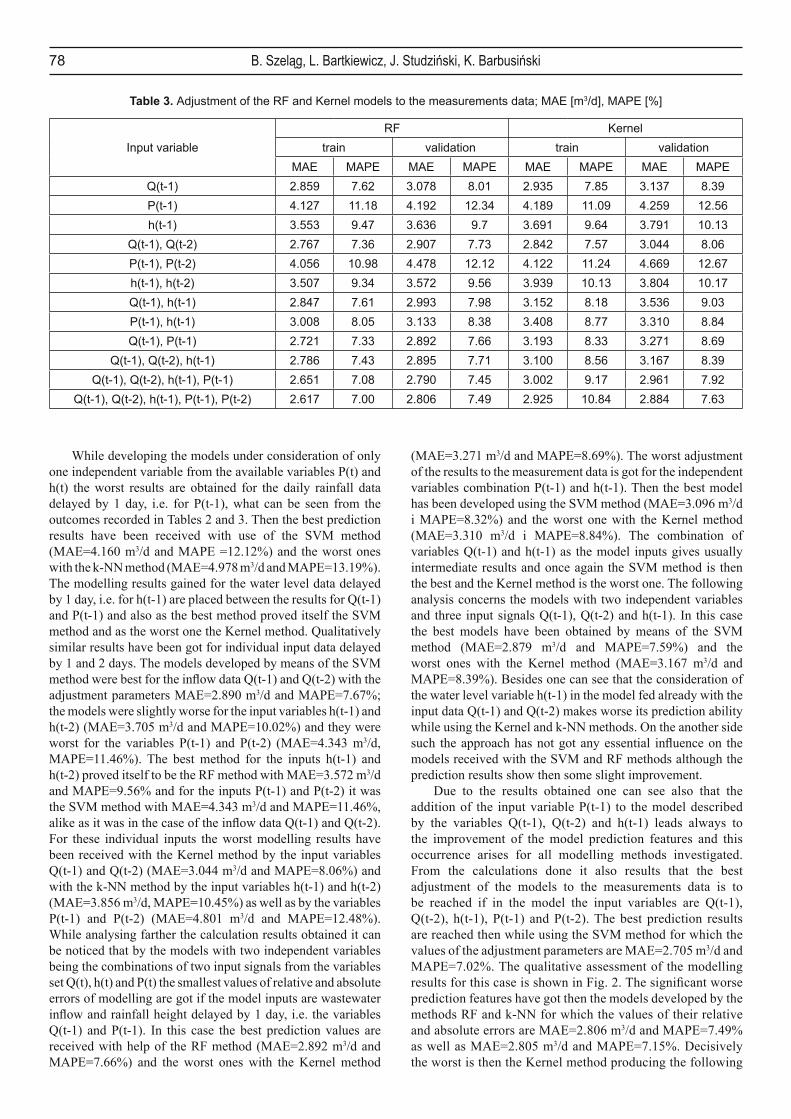
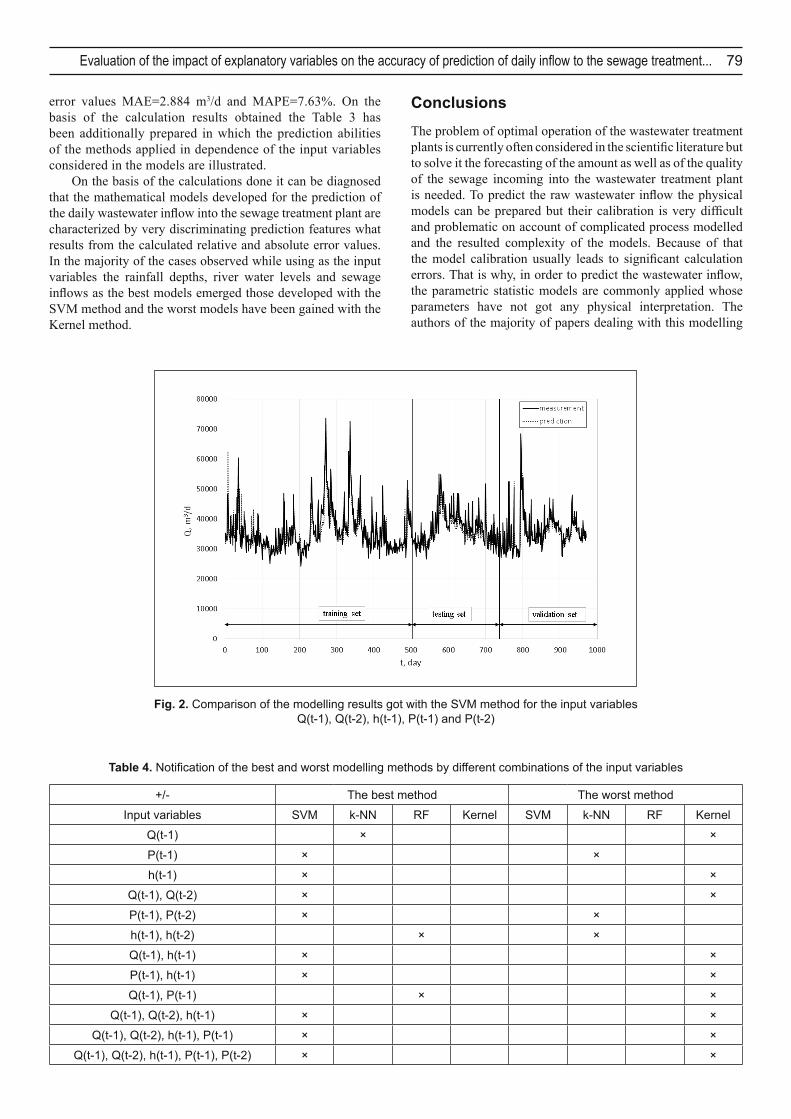
Due to the results obtained one can see also that the addition of the input variable P(t-1) to the model described by the variables Q(t-1), Q(t-2) and h(t-1) leads always to the improvement of the model prediction features and this occurrence arises for all modelling methods investigated. From the calculations done it also results that the best adjustment of the models to the measurements data is to be reached if in the model the input variables are Q(t-1), Q(t-2), h(t-1), P(t-1) and P(t-2). The best prediction results are reached then while using the SVM method for which the values of the adjustment parameters are MAE=2.705 m3/d and MAPE=7.02%. The qualitative assessment of the modelling results for this case is shown in Fig. 2. The signifi cant worse prediction features have got then the models developed by the methods RF and k-NN for which the values of their relative and absolute errors are MAE=2.806 m3/d and MAPE=7.49% as well as MAE=2.805 m3/d and MAPE=7.15%. Decisively the worst is then the Kernel method producing the following
Table 3. Adjustment of the RF and Kernel models to the measurements data; MAE [m3/d], MAPE [%]
Input variableRF Kernel
train validation train validationMAE MAPE MAE MAPE MAE MAPE MAE MAPE
Q(t-1) 2.859 7.62 3.078 8.01 2.935 7.85 3.137 8.39P(t-1) 4.127 11.18 4.192 12.34 4.189 11.09 4.259 12.56h(t-1) 3.553 9.47 3.636 9.7 3.691 9.64 3.791 10.13
Q(t-1), Q(t-2) 2.767 7.36 2.907 7.73 2.842 7.57 3.044 8.06P(t-1), P(t-2) 4.056 10.98 4.478 12.12 4.122 11.24 4.669 12.67h(t-1), h(t-2) 3.507 9.34 3.572 9.56 3.939 10.13 3.804 10.17Q(t-1), h(t-1) 2.847 7.61 2.993 7.98 3.152 8.18 3.536 9.03P(t-1), h(t-1) 3.008 8.05 3.133 8.38 3.408 8.77 3.310 8.84Q(t-1), P(t-1) 2.721 7.33 2.892 7.66 3.193 8.33 3.271 8.69
Q(t-1), Q(t-2), h(t-1) 2.786 7.43 2.895 7.71 3.100 8.56 3.167 8.39Q(t-1), Q(t-2), h(t-1), P(t-1) 2.651 7.08 2.790 7.45 3.002 9.17 2.961 7.92
Q(t-1), Q(t-2), h(t-1), P(t-1), P(t-2) 2.617 7.00 2.806 7.49 2.925 10.84 2.884 7.63
Evaluation of the impact of explanatory variables on the accuracy of prediction of daily infl ow to the sewage treatment... 79
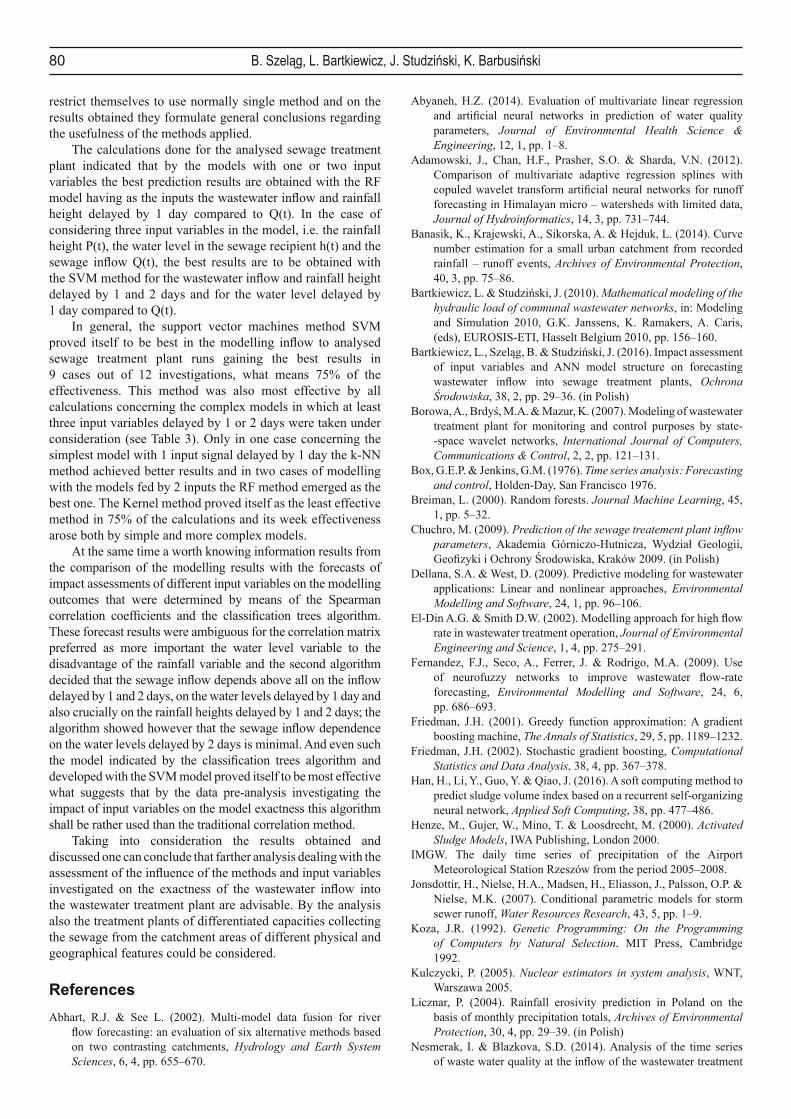
error values MAE=2.884 m3/d and MAPE=7.63%. On the basis of the calculation results obtained the Table 3 has been additionally prepared in which the prediction abilities of the methods applied in dependence of the input variables considered in the models are illustrated.
On the basis of the calculations done it can be diagnosed that the mathematical models developed for the prediction of the daily wastewater infl ow into the sewage treatment plant are characterized by very discriminating prediction features what results from the calculated relative and absolute error values. In the majority of the cases observed while using as the input variables the rainfall depths, river water levels and sewage infl ows as the best models emerged those developed with the SVM method and the worst models have been gained with the Kernel method.
ConclusionsThe problem of optimal operation of the wastewater treatment plants is currently often considered in the scientifi c literature but to solve it the forecasting of the amount as well as of the quality of the sewage incoming into the wastewater treatment plant is needed. To predict the raw wastewater infl ow the physical models can be prepared but their calibration is very diffi cult and problematic on account of complicated process modelled and the resulted complexity of the models. Because of that the model calibration usually leads to signifi cant calculation errors. That is why, in order to predict the wastewater infl ow, the parametric statistic models are commonly applied whose parameters have not got any physical interpretation. The authors of the majority of papers dealing with this modelling
Fig. 2. Comparison of the modelling results got with the SVM method for the input variables Q(t-1), Q(t-2), h(t-1), P(t-1) and P(t-2)
Table 4. Notifi cation of the best and worst modelling methods by different combinations of the input variables
+/- The best method The worst method
Input variables SVM k-NN RF Kernel SVM k-NN RF Kernel
Q(t-1) × ×
P(t-1) × ×
h(t-1) × ×
Q(t-1), Q(t-2) × ×
P(t-1), P(t-2) × ×
h(t-1), h(t-2) × ×
Q(t-1), h(t-1) × ×
P(t-1), h(t-1) × ×
Q(t-1), P(t-1) × ×
Q(t-1), Q(t-2), h(t-1) × ×
Q(t-1), Q(t-2), h(t-1), P(t-1) × ×
Q(t-1), Q(t-2), h(t-1), P(t-1), P(t-2) × ×
80 B. Szeląg, L. Bartkiewicz, J. Studziński, K. Barbusiński
restrict themselves to use normally single method and on the results obtained they formulate general conclusions regarding the usefulness of the methods applied.
The calculations done for the analysed sewage treatment plant indicated that by the models with one or two input variables the best prediction results are obtained with the RF model having as the inputs the wastewater infl ow and rainfall height delayed by 1 day compared to Q(t). In the case of considering three input variables in the model, i.e. the rainfall height P(t), the water level in the sewage recipient h(t) and the sewage infl ow Q(t), the best results are to be obtained with the SVM method for the wastewater infl ow and rainfall height delayed by 1 and 2 days and for the water level delayed by 1 day compared to Q(t).
In general, the support vector machines method SVM proved itself to be best in the modelling infl ow to analysed sewage treatment plant runs gaining the best results in 9 cases out of 12 investigations, what means 75% of the effectiveness. This method was also most effective by all calculations concerning the complex models in which at least three input variables delayed by 1 or 2 days were taken under consideration (see Table 3). Only in one case concerning the simplest model with 1 input signal delayed by 1 day the k-NN method achieved better results and in two cases of modelling with the models fed by 2 inputs the RF method emerged as the best one. The Kernel method proved itself as the least effective method in 75% of the calculations and its week effectiveness arose both by simple and more complex models.
At the same time a worth knowing information results from the comparison of the modelling results with the forecasts of impact assessments of different input variables on the modelling outcomes that were determined by means of the Spearman correlation coeffi cients and the classifi cation trees algorithm. These forecast results were ambiguous for the correlation matrix preferred as more important the water level variable to the disadvantage of the rainfall variable and the second algorithm decided that the sewage infl ow depends above all on the infl ow delayed by 1 and 2 days, on the water levels delayed by 1 day and also crucially on the rainfall heights delayed by 1 and 2 days; the algorithm showed however that the sewage infl ow dependence on the water levels delayed by 2 days is minimal. And even such the model indicated by the classifi cation trees algorithm and developed with the SVM model proved itself to be most effective what suggests that by the data pre-analysis investigating the impact of input variables on the model exactness this algorithm shall be rather used than the traditional correlation method.
Taking into consideration the results obtained and discussed one can conclude that farther analysis dealing with the assessment of the infl uence of the methods and input variables investigated on the exactness of the wastewater infl ow into the wastewater treatment plant are advisable. By the analysis also the treatment plants of differentiated capacities collecting the sewage from the catchment areas of different physical and geographical features could be considered.
ReferencesAbhart, R.J. & See L. (2002). Multi-model data fusion for river
fl ow forecasting: an evaluation of six alternative methods based on two contrasting catchments, Hydrology and Earth System Sciences, 6, 4, pp. 655–670.
Abyaneh, H.Z. (2014). Evaluation of multivariate linear regression and artifi cial neural networks in prediction of water quality parameters, Journal of Environmental Health Science & Engineering, 12, 1, pp. 1–8.
Adamowski, J., Chan, H.F., Prasher, S.O. & Sharda, V.N. (2012). Comparison of multivariate adaptive regression splines with copuled wavelet transform artifi cial neural networks for runoff forecasting in Himalayan micro – watersheds with limited data, Journal of Hydroinformatics, 14, 3, pp. 731–744.
Banasik, K., Krajewski, A., Sikorska, A. & Hejduk, L. (2014). Curve number estimation for a small urban catchment from recorded rainfall – runoff events, Archives of Environmental Protection, 40, 3, pp. 75–86.
Bartkiewicz, L. & Studziński, J. (2010). Mathematical modeling of the hydraulic load of communal wastewater networks, in: Modeling and Simulation 2010, G.K. Janssens, K. Ramakers, A. Caris, (eds), EUROSIS-ETI, Hasselt Belgium 2010, pp. 156–160.
Bartkiewicz, L., Szeląg, B. & Studziński, J. (2016). Impact assessment of input variables and ANN model structure on forecasting wastewater inflow into sewage treatment plants, Ochrona Środowiska, 38, 2, pp. 29–36. (in Polish)
Borowa, A., Brdyś, M.A. & Mazur, K. (2007). Modeling of wastewater treatment plant for monitoring and control purposes by state--space wavelet networks, International Journal of Computers, Communications & Control, 2, 2, pp. 121–131.
Box, G.E.P. & Jenkins, G.M. (1976). Time series analysis: Forecasting and control, Holden-Day, San Francisco 1976.
Breiman, L. (2000). Random forests. Journal Machine Learning, 45, 1, pp. 5–32.
Chuchro, M. (2009). Prediction of the sewage treatement plant infl ow parameters, Akademia Górniczo-Hutnicza, Wydział Geologii, Geofi zyki i Ochrony Środowiska, Kraków 2009. (in Polish)
Dellana, S.A. & West, D. (2009). Predictive modeling for wastewater applications: Linear and nonlinear approaches, Environmental Modelling and Software, 24, 1, pp. 96–106.
El-Din A.G. & Smith D.W. (2002). Modelling approach for high fl ow rate in wastewater treatment operation, Journal of Environmental Engineering and Science, 1, 4, pp. 275–291.
Fernandez, F.J., Seco, A., Ferrer, J. & Rodrigo, M.A. (2009). Use of neurofuzzy networks to improve wastewater fl ow-rate forecasting, Environmental Modelling and Software, 24, 6, pp. 686–693.
Friedman, J.H. (2001). Greedy function approximation: A gradient boosting machine, The Annals of Statistics, 29, 5, pp. 1189–1232.
Friedman, J.H. (2002). Stochastic gradient boosting, Computational Statistics and Data Analysis, 38, 4, pp. 367–378.
Han, H., Li, Y., Guo, Y. & Qiao, J. (2016). A soft computing method to predict sludge volume index based on a recurrent self-organizing neural network, Applied Soft Computing, 38, pp. 477–486.
Henze, M., Gujer, W., Mino, T. & Loosdrecht, M. (2000). Activated Sludge Models, IWA Publishing, London 2000.
IMGW. The daily time series of precipitation of the Airport Meteorological Station Rzeszów from the period 2005–2008.
Jonsdottir, H., Nielse, H.A., Madsen, H., Eliasson, J., Palsson, O.P. & Nielse, M.K. (2007). Conditional parametric models for storm sewer runoff, Water Resources Research, 43, 5, pp. 1–9.
Koza, J.R. (1992). Genetic Programming: On the Programming of Computers by Natural Selection. MIT Press, Cambridge 1992.
Kulczycki, P. (2005). Nuclear estimators in system analysis, WNT, Warszawa 2005.
Licznar, P. (2004). Rainfall erosivity prediction in Poland on the basis of monthly precipitation totals, Archives of Environmental Protection, 30, 4, pp. 29–39. (in Polish)
Nesmerak, I. & Blazkova, S.D. (2014). Analysis of the time series of waste water quality at the infl ow of the wastewater treatment

Evaluation of the impact of explanatory variables on the accuracy of prediction of daily infl ow to the sewage treatment... 81
plant and transfer functions, Journal of Hydrology and Hydromechanics, 62, 1, pp. 55–59.
Piotrowski, A., Napiorkowski, J.J. & Rowiński, P.M. (2006). Flash--fl ood forecasting by means of neural networks and nearest neighbour approach – a comparative study, Nonlinear Processes Geophysics, 13, 4, pp. 443–448.
Piotrowski, A., Osuch M., Napiórkowski, M.J., Rowiński P.M. & Napiórkowski, J.J. (2014). Comparing large number of metaheurestics for artifi cial neural networks training to predict water temperature in a natural river, Computers & Geosciences, 64, pp. 136–151.
Simonoff, J.S. (1996). Smoothing Methods in Statistics, Springer Series in Statistics, New York 1996.
Szeląg, B. & Gawdzik, J. (2016). Application of selected methods of artifi cial intelligence to activated sludge settleability predictions, Polish Journal of Environmental Studies, 25, 4, pp. 1709–1714.
Wei, X. & Kusiak, A. (2015). Short-term prediction of infl uent fl ow in wastewater treatment plant, Stochastic Environmental Research and Risk Assessment, 29, 1, pp. 241–249.
Young, P.C. (2001). Data-based mechanistic modeling and validation of rainfall-fl ow processes, in: Model validation: perspectives in hydrological science, M.G. Anderson, P.D. Bates, (eds). Wiley 2001.
Rutkowski, L. (2006). Computational Intelligence: Methods and Techniques, PWN, Warszawa 2006. (in Polish)
Vapnik, V. (1998). Statistical Learning Theory, John Wiley and Sons, New York, 1998.
Ocena wpływu zmiennych objaśniających na dokładność predykcji dobowego dopływu do oczyszczalni ścieków
wybranymi modelami nieliniowymi
Streszczenie: Celem pracy jest ocena możliwości zastosowania różnych metod data mining do modelowania dopływu ścieków do komunalnej oczyszczalni ścieków. Do opracowania modeli statystycznych metodą wektorów nośnych, lasów losowych, k – najbliższego sąsiada i regresji Kernela wykorzystano szeregi pomiarowe dobo-wych wartości opadów deszczu, stanów wody w odbiorniku oraz dopływów do komunalnej oczyszczalni ścieków w Rzeszowie. Z obliczeń wykonanych metodami SVM, RF, k-NN i K wynika, że dla modeli z jedną zmienną objaśniającą opóźnioną o dobę w stosunku do wartości dopływu, najlepsze wyniki otrzymano modelem auto-regresyjnym bazującym na metodzie k–NN a najgorsze regresją Kernela. W przypadku modeli z dwoma zmiennymi objaśniającymi najmniejsze wartości błędów uzyskano, dla modeli uwzględniających dopływ ścieków i całkowitą wysokość opadu deszczu z jednodobowym opóźnieniem; najlepsze wyniki uzyskano metodą RF a najgorsze re-gresji Kernela. Dla modeli z dwiema zmiennymi objaśniającymi, ale trzema sygnałami wejściowymi, najmniejsze błędy dopływu ścieków do OŚ uzyskano metodą SVM, a najgorsze regresji Kernela.Z wykonanych symulacji stwierdzono, że w większości przypadków najmniejsze wartości błędów dopływu ścieków do oczyszczalni otrzy-mano metodą SVM a największe metodą K. W przypadku najprostszego modelu z jednym sygnałem wejściowym opóźnionym o 1 dobę najlepsze wyniki obliczeń uzyskano metodą k-NN, a w dwóch przypadkach modeli, gdzie ujęto 2 sygnały wejściowe, najlepsza okazała się metoda RF.