1 Model Selection Response: Highway MPG Explanatory: 13 explanatory variables Indicator variables...
39
1 Model Selection Response: Highway MPG Explanatory: 13 explanatory variables Indicator variables for types of car – Sports Car, SUV, Wagon, Minivan There is an indicator for Pickup but there are no pickups in the data.
-
Upload
byron-joel-tyler -
Category
Documents
-
view
220 -
download
0
Transcript of 1 Model Selection Response: Highway MPG Explanatory: 13 explanatory variables Indicator variables...

1
Model Selection Response: Highway MPG Explanatory: 13 explanatory
variables Indicator variables for types of car
– Sports Car, SUV, Wagon, Minivan There is an indicator for Pickup but
there are no pickups in the data.

2
Indicator Variables The indicator variable takes
on the value 1 if it is that kind of vehicle and 0 otherwise.
If all four indicator variables are 0, then the vehicle is a Sedan.

3
Explanatory Variables Indicator variables for All
Wheel and Rear Wheel drive.
If both indicator variables are 0, then the vehicle has Front Wheel drive.

4
Explanatory Variables Engine size (liters) Cylinders (number) Horsepower Weight (pounds) Wheel Base (inches) Length (inches) Width (inches)

5
Forward Selection Fit Model – Personality:
Stepwise Y, Response – Highway MPG Put all 13 variables into the
Construct Model Effects box. Click on Run Model

6
Stepwise Fit Stopping Rule: P-value
Threshold Prob to Enter = 0.050 Prob to Leave = 0.050
Direction: Forward Click on Go

7
Stopping Rule: P-value Threshold
Prob to EnterProb to Leave
0.050.05
Direction: Forward
Stepwise Regression Control
1268.269SSE
96DFE
3.6347126RMSE
0.6543RSquare
0.6435RSquare Adj
12.122214Cp
4p
548.4498AICc
560.8374BIC
Lock EnteredInterceptSports CarSUVWagonMinivanAll WheelRear WheelEngineCylindersHorsepowerWeightWheel BaseLengthWidth
Parameter33.0251054
00000000
-0.0257556-0.00625970.20569376
00
Estimate11111111111111
nDF0
6.92801448.781571.9520589.29688445.270642.57080738.3166531.96371181.8159703.0322106.66963.0456350.141521
SS0.0000.5223.8000.1460.7023.5170.1932.9602.456
13.76253.215
8.0740.2290.011
"F Ratio"1
0.471850.0542
0.702810.404370.063830.661460.088630.120390.000358.5e-11
0.005480.6336
0.91821
"Prob>F"
Current Estimates
123
Step WeightHorsepowerWheel Base
ParameterEnteredEnteredEntered
Action0.00000.00010.0055
"Sig Prob"2065.965228.0966106.6696
Seq SS0.56310.62530.6543
RSquare35.606
18.8812.122
Cp234
p567.486554.308
548.45
AICc575.052564.308560.837
BIC
Step History
Stepwise Fit for Highway MPG

8
Forward Selection Three variables are added
Weight Horsepower Wheel Base
All variables added are still statistically significant.

9
Forward Selection Model with Weight,
Horsepower and Wheel Base. R2 = 0.6543, adj R2 = 0.6435 RMSE = 3.635 AICc = 548.45, BIC = 560.84 Cp = 12.1222

10
Stepwise Fit Stopping Rule: P-value
Threshold Prob to Enter = 0.050 Prob to Leave = 0.050
Direction: Backward Enter All
Click on Go

11

12
Backward Selection Eight variables are removed
Length, Rear Wheel, Wagon, Width, Engine, Wheel Base, Weight, Sports Car.
All variables left are statistically significant.

13
Backward Selection Model with SUV, Minivan, All
Wheel, Cylinders and Horsepower. R2 = 0.6874, adj R2 = 0.6708 RMSE = 3.493 AICc = 542.96, BIC = 559.98 Cp = 6.1511

14
Backward Selection The final model from
Backward selection is better than the final model from Forward selection. It has a higher R2 value, higher adj R2 value, lower RMSE, AICc, BIC and Cp value.

15
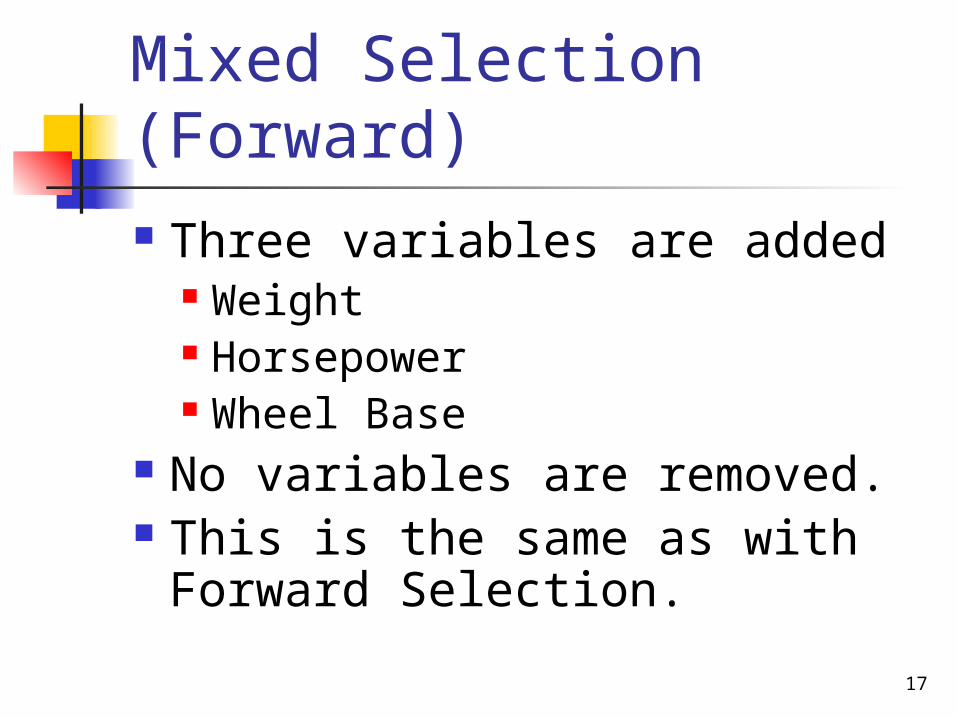
Mixed Selection (Forward)
Stopping Rule: P-value Threshold Prob to Enter = 0.050 Prob to Leave = 0.050
Direction: Mixed Click on Go

16
17
Mixed Selection (Forward) Three variables are added
Weight Horsepower Wheel Base
No variables are removed. This is the same as with
Forward Selection.

18
Mixed Selection (Backward) Stopping Rule: P-value
Threshold Prob to Enter = 0.050 Prob to Leave = 0.050
Direction: Mixed Enter All
Click on Go

19
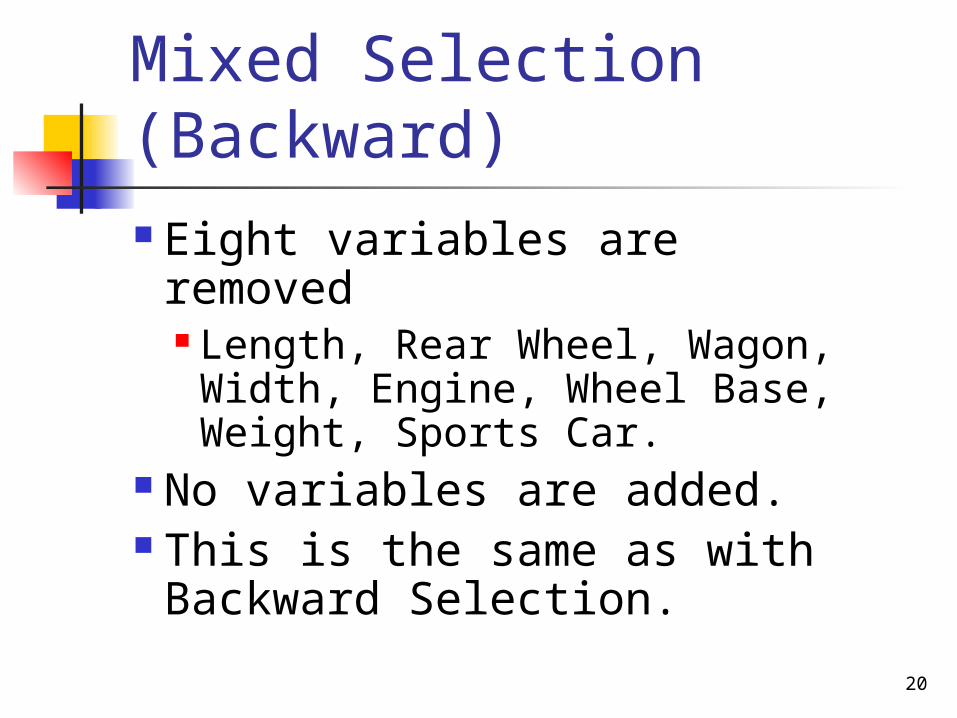
20
Mixed Selection (Backward) Eight variables are removed
Length, Rear Wheel, Wagon, Width, Engine, Wheel Base, Weight, Sports Car.
No variables are added. This is the same as with
Backward Selection.

21
All Possible Models 213 – 1 = 8191 models possible. 1-variable models – listed in
order of the R2 value. 2-variable models – listed in
order of the R2 value. etc. 13-variable (full) model.
22
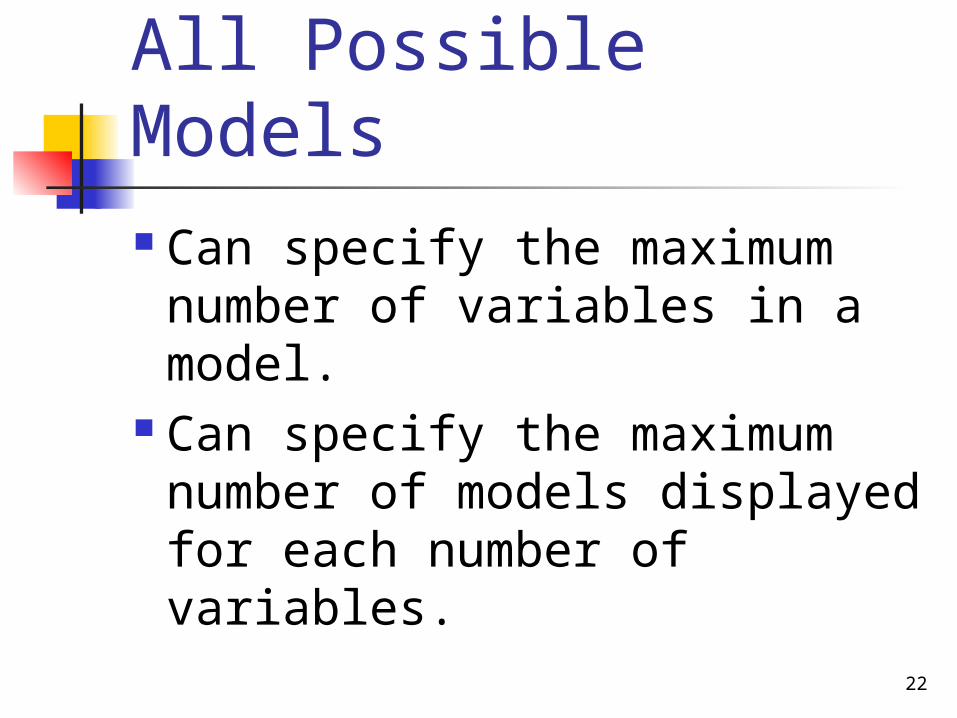
All Possible Models Can specify the maximum
number of variables in a model.
Can specify the maximum number of models displayed for each number of variables.

23
All Possible Models Model with all 13 variables has
the highest R2 value. R2 = 0.7145 Is this the “best” model? No, several variables are not
statistically significant.

24
All Possible Models Model with 7 variables has the
lowest RMSE value. Sports Car, SUV, Minivan, All Wheel, Cylinders, Horsepower, Weight
RMSE = 3.4282

25
Model with lowest RMSE
Is this the “best” model? No, several variables are not
statistically significant. Sports Car: F=3.847, P-
value=0.0529 Horsepower: F=3.761,
P-value=0.0555 Weight: F=3.653, P-value=0.0591

26
All Possible Models Model with 7 variables has the
lowest Cp value. Sports Car, SUV, Minivan, All Wheel, Cylinders, Horsepower, Weight
Cp = 4.7649 This is the same model as the
one with the lowest RMSE.

27
All Possible Models Model with 7 variables has the
lowest AICc and BIC values. Sports Car, SUV, Minivan, All Wheel, Cylinders, Horsepower, Weight
AICc = 541.854, BIC = 563.301 This is the same model as the
one with the lowest RMSE and Cp.

28
Strategies Start with the “best” 1-variable
model. Find a 2-variable model that
beats it. Find a 3-variable model that
beats the “best” 2-variable model.
Etc.

29
Strategies Start with the full (13-
variable) model. Is it “best”? Go to the 12-variable models.
Are any of these “best”? Etc.

30
“Best” Model The 7-variable model with
SUV, Minivan, All Wheel, Engine, Horsepower, Weight and Wheel Base
Appears to be the “best” model.

31
Prediction Equation
Predicted Highway MPG = 30.74 – 3.15*SUV – 3.28*Minivan – 2.08*All Wheel – 1.65*Engine – 0.0226*Horsepower – 0.0029*Weight + 0.163*Wheel Base

32
Summary All variables add significantly. R2 = 0.705, adj R2 = 0.682 RMSE = 3.431 AICc = 542.01, BIC = 563.45 Cp = 4.9011

33
-20
-15
-10
-5
0
5
10
15
20
Res
idua
l
Bes
t Mod
el
15 20 25 30 35
Predicted Highw ay MPG

34
.01
.05
.10
.25
.50
.75
.90
.95
.99
-3
-2
-1
0
1
2
3
Norm
al Q
uantil
e P
lot
5
10
15
20
25
30
35
Count
-5 0 5 10 15
35
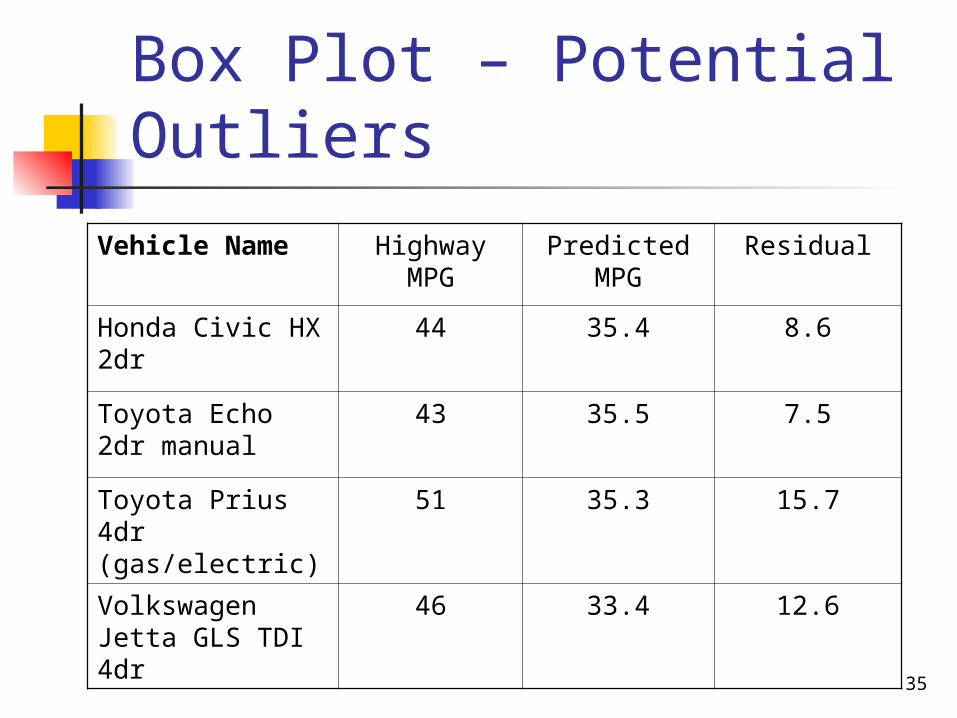
Box Plot – Potential Outliers
Vehicle Name Highway MPG
Predicted MPG
Residual
Honda Civic HX 2dr 44 35.4 8.6
Toyota Echo 2dr manual
43 35.5 7.5
Toyota Prius 4dr (gas/electric)
51 35.3 15.7
Volkswagen Jetta GLS TDI 4dr
46 33.4 12.6

36
Outlier How do we determine if a
potential outlier identified on the box plot is statistically significant?

37
Unusual Points in Regression
Outlier for Regression A point with an unusually
large residual.

38
Unusual Points in Regression
High leverage point. A point with an extreme
value for one, or more, of the explanatory variables

39
Influential Points Does a point influence where
the regression line goes? An outlier can. A high leverage point can. Are they statistically
significant?