Evaluation of methods for fault detection of planetary g ...
60
Evaluation of methods for fault detection of planetary gears for nutrunners JON BOMAN GUSTAV STORCK Master of Science Thesis Stockholm, Sweden 2014
Transcript of Evaluation of methods for fault detection of planetary g ...

Evaluation of methods for fault detection of planetary gears
for nutrunners
JON BOMAN GUSTAV STORCK
Master of Science Thesis
Stockholm, Sweden 2014


Evaluation of methods forfault detection of planetary gears
for nutrunners
Jon Boman
Gustav Storck
Master of Science Thesis MMK 2014:48 MDA 487KTH Industrial Engineering and Management
Machine DesignSE-100 44 STOCKHOLM


.
Examensarbete MMK2014:48 MDA 478
Utvardering av metoder for feldetektering avplanetvaxlar for mutterdragare
Jon BomanGustav Storck
Godkant Examinator Handledare
2014-06-19 Lei Feng Bjorn MollerUppdragsgivare Kontaktperson
Atlas CopcoIndustrial Technique AB
Per Forsberg
.
Sammanfattning.
Atlas Copco utfor accelererade livslangdsprov pa sina planetvaxlar for mutterdragare genom attkora dem med konstant hastighet och konstant moment tills de havererar. Foretaget onskade ettsatt att under drift detektera tidiga fel i vaxeln for att kunna avbryta testerna medan skadornafortfarande ar i ett tidigt stadium. Syftet med detta examensarbete var att utvardera olikametoder for feldetektering av planetvaxlar.
En bakgrundsstudie utfordes for att finna tidigare forskning inom omradet. Sen utfordes testeri en testrigg dar Normalised Summation of Difference Spectrum (NSDS) och Filtered Root MeanSquare (FRMS), beraknade fran den uppmatta transversal- och torsionsvibrationen, anvandessom indikatorer for vaxelns halsotillstand.
Resultaten fran testerna antydde att NSDS och FRMS formaga att indikera tidiga fel i vaxelnvar bristfalliga. Dock sa kunde liknande monster i torsionsvibrationen observeras for de vaxlarsom hade samma typ av skador, dar amplituden i ett sidoband till kuggingreppsfrekvensen okadekraftigt innan vaxeln havererade.


.
Master of Science Thesis MMK2014:48 MDA 478
Evaluation of methods for fault detection of planetarygears for nutrunners
Jon BomanGustav Storck
Approved Examiner Supervisor
2014-06-19 Lei Feng Bjorn MollerCommissioner Contact person
Atlas CopcoIndustrial Technique AB
Per Forsberg
.
Abstract.
Atlas Copco performs accelerated life testing on their planetary gears for nutrunners by runningthem at constant speed and torque until they fail. The company desired a way to detect initialgear faults during operation in order to stop the tests while the damages were still in an earlystage. The purpose of this thesis was to investigate different methods for planetary gear faultdetection.
An initial background study was performed to investigate previous research within the field.Then tests were performed in a test rig where the Normalised Summation of Difference Spectrum(NSDS) and Filtered Root Mean Square (FRMS), calculated from the measured transversal andtorsional vibration, were used as indicators of the gears health state.
The results from the tests indicated that the NSDS and FRMS were deficient as indicators ofinitial gear faults. However, similar behaviour in the torsional vibration could be observed fordifferent gears with the same fault mode, where the amplitude in one of the sidebands to themesh frequency increased significantly before the gears failed.


Preface
After five tough years of studying at KTH this master’s thesis was the final obstacle to overcome,la grande finale, before we could officially call ourselves fully fledged engineers. Since you arereading this report, we apparently made it.
We would like to thank all of you that we have come in contact with during our time at AtlasCopco, especially Per Forsberg and Johan Hedekall who have been our eminent supervisors. Youhave been encouraging and helpful throughout the whole process which we are eternally gratefulfor.
We also want to thank our supervisor at KTH, Bjorn Moller, who has given us valuable feedbackand guided us in our work.
Finally we would like to thank Anton Lagerholm and Staffan Molinder who did their master’sthesis simultaneously at Atlas Copco. All conversations about existential questions during ourshared lunch breaks have helped to keep our spirits high in times of darkness.
kcrotSvatsuGnamoBnoJ


Contents
List of Figures i
List of Tables iii
1 Introduction 1
1.1 Background and problem definition . . . . . . . . . . . . . . . . . . . . . . . . . . 1
1.2 Delimitations . . . . . . . . . . . . . . . . . . . . . . . . . . . . . . . . . . . . . . 2
1.3 Report structure . . . . . . . . . . . . . . . . . . . . . . . . . . . . . . . . . . . . 2
2 Frame of reference 3
2.1 Fundamentals of planetary gears . . . . . . . . . . . . . . . . . . . . . . . . . . . 3
2.2 Periodicities in planetary gears . . . . . . . . . . . . . . . . . . . . . . . . . . . . 4
2.2.1 Frequencies in planetary gears . . . . . . . . . . . . . . . . . . . . . . . . 4
2.2.2 Resets of planetary gears . . . . . . . . . . . . . . . . . . . . . . . . . . . 5
2.3 Planetary gear failure modes . . . . . . . . . . . . . . . . . . . . . . . . . . . . . 5
2.3.1 Pitting . . . . . . . . . . . . . . . . . . . . . . . . . . . . . . . . . . . . . . 5
2.3.2 Scuffing . . . . . . . . . . . . . . . . . . . . . . . . . . . . . . . . . . . . . 5
2.3.3 Deformation . . . . . . . . . . . . . . . . . . . . . . . . . . . . . . . . . . 6
2.3.4 Cracks . . . . . . . . . . . . . . . . . . . . . . . . . . . . . . . . . . . . . . 6
2.3.5 Lubrication failure . . . . . . . . . . . . . . . . . . . . . . . . . . . . . . . 6
2.4 Signal analysis . . . . . . . . . . . . . . . . . . . . . . . . . . . . . . . . . . . . . 7
2.4.1 Fourier Transform . . . . . . . . . . . . . . . . . . . . . . . . . . . . . . . 7
2.4.2 Root Mean Square . . . . . . . . . . . . . . . . . . . . . . . . . . . . . . . 7
2.4.3 Synchronous averaging . . . . . . . . . . . . . . . . . . . . . . . . . . . . . 8
2.4.4 Signal modulation . . . . . . . . . . . . . . . . . . . . . . . . . . . . . . . 8
3 Literature review 11
3.1 Vibration monitoring . . . . . . . . . . . . . . . . . . . . . . . . . . . . . . . . . . 11
3.1.1 Transversal vibration . . . . . . . . . . . . . . . . . . . . . . . . . . . . . . 11
3.1.2 Torsional vibration . . . . . . . . . . . . . . . . . . . . . . . . . . . . . . . 13
3.2 Diagnostic parameters . . . . . . . . . . . . . . . . . . . . . . . . . . . . . . . . . 13
3.2.1 FRMS and NSDS . . . . . . . . . . . . . . . . . . . . . . . . . . . . . . . . 13
4 Experimental set-up 15
4.1 The planetary gear . . . . . . . . . . . . . . . . . . . . . . . . . . . . . . . . . . . 15
4.2 The test rig . . . . . . . . . . . . . . . . . . . . . . . . . . . . . . . . . . . . . . . 16
4.3 Sensors and data acquisition . . . . . . . . . . . . . . . . . . . . . . . . . . . . . . 18
4.3.1 Data acquisition system . . . . . . . . . . . . . . . . . . . . . . . . . . . . 18
4.3.2 Torque transducer . . . . . . . . . . . . . . . . . . . . . . . . . . . . . . . 19
4.3.3 Charge accelerometer . . . . . . . . . . . . . . . . . . . . . . . . . . . . . 19
5 Method 215.1 Original test plan . . . . . . . . . . . . . . . . . . . . . . . . . . . . . . . . . . . . 215.2 Revised test plan . . . . . . . . . . . . . . . . . . . . . . . . . . . . . . . . . . . . 225.3 Data collection and processing . . . . . . . . . . . . . . . . . . . . . . . . . . . . 225.4 Synchronous average in practice . . . . . . . . . . . . . . . . . . . . . . . . . . . . 245.5 FRMS and NSDS in practice . . . . . . . . . . . . . . . . . . . . . . . . . . . . . 24
6 Results 276.1 Identification of fundamental frequencies . . . . . . . . . . . . . . . . . . . . . . . 276.2 Original test plan . . . . . . . . . . . . . . . . . . . . . . . . . . . . . . . . . . . . 306.3 Revised test plan . . . . . . . . . . . . . . . . . . . . . . . . . . . . . . . . . . . . 32
7 Discussion 377.1 Original test plan . . . . . . . . . . . . . . . . . . . . . . . . . . . . . . . . . . . . 377.2 Revised test plan . . . . . . . . . . . . . . . . . . . . . . . . . . . . . . . . . . . . 377.3 Problems and possible improvements to test rig . . . . . . . . . . . . . . . . . . . 387.4 In-tool application . . . . . . . . . . . . . . . . . . . . . . . . . . . . . . . . . . . 397.5 Recommendations for future work . . . . . . . . . . . . . . . . . . . . . . . . . . 39
8 Conclusions 41
9 Bibliography 43

List of Figures
1.1 Example of nutrunner. . . . . . . . . . . . . . . . . . . . . . . . . . . . . . . . . . 1
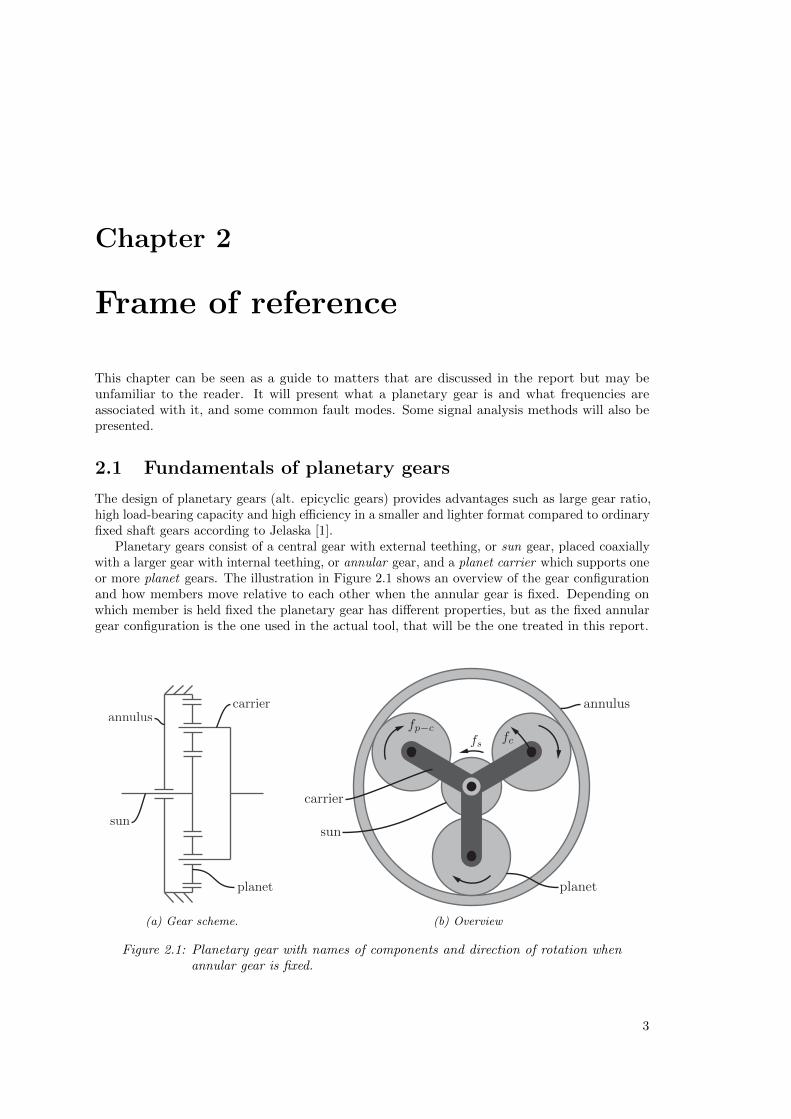
2.1 Planetary gear with names of components and direction of rotation when annulargear is fixed. . . . . . . . . . . . . . . . . . . . . . . . . . . . . . . . . . . . . . . 3
2.2 Examples of different gear failure modes. . . . . . . . . . . . . . . . . . . . . . . . 52.3 More examples of different gear failure modes. . . . . . . . . . . . . . . . . . . . . 62.4 Example of how synchronous averaging increases the signal-to-noise ratio. . . . . 82.5 Example of an amplitude modulated signal. . . . . . . . . . . . . . . . . . . . . . 92.6 Example of a frequency modulated signal. . . . . . . . . . . . . . . . . . . . . . . 9
3.1 Example of how the propagation difference for the vibration varies over timecausing an AM-effect on the signal perceived by the transducer. . . . . . . . . . . 12
4.1 The planetary gear used for testing. . . . . . . . . . . . . . . . . . . . . . . . . . 164.2 The rig used for testing. . . . . . . . . . . . . . . . . . . . . . . . . . . . . . . . . 174.3 Drawing of gear mounted in holder. . . . . . . . . . . . . . . . . . . . . . . . . . . 184.4 DEWE-43 USB DAQ used for collecting data. . . . . . . . . . . . . . . . . . . . . 18
5.1 Flowchart of the data processing. . . . . . . . . . . . . . . . . . . . . . . . . . . . 23
6.1 Frequency spectrum of the signal from torque sensor connected to gear 1. Nor-malised by the 2nd stage carrier frequency. The red/dotted lines indicate thelocations of identified sidebands. . . . . . . . . . . . . . . . . . . . . . . . . . . . 28
6.2 Frequency spectrum of signal from accelerometer mounted directly on the annulusof gear 1. Normalised by the 2nd stage carrier frequency. The blue/dotted linesindicate the locations of identified sidebands. . . . . . . . . . . . . . . . . . . . . 29
6.3 Investigation of NSDS health parameter from the original test plan. . . . . . . . 306.4 Investigation of FRMS health parameter from original test plan. . . . . . . . . . 316.5 2nd stage sun gear worn down in test 8. . . . . . . . . . . . . . . . . . . . . . . . 326.6 NSDS health parameter from the revised test plan. . . . . . . . . . . . . . . . . . 336.7 FRMS health parameter from the revised test plan. . . . . . . . . . . . . . . . . . 346.8 How the sideband fm − 2 × 3fs−c = 22.5 Hz changes over time in the different tests. 35
i


List of Tables
3.1 Vibration spectrum sidebands for different fault modes. . . . . . . . . . . . . . . 12
4.1 Number of gear teeth for the gear used. . . . . . . . . . . . . . . . . . . . . . . . 15
5.1 Selected fault modes for testing. . . . . . . . . . . . . . . . . . . . . . . . . . . . 215.2 Contents in dataset exported from Dewesoft X. . . . . . . . . . . . . . . . . . . . 225.3 Reset revolutions for planetary gear. . . . . . . . . . . . . . . . . . . . . . . . . . 245.4 Frequencies in Hz filtered in FRMS. . . . . . . . . . . . . . . . . . . . . . . . . . 25
6.1 Gear frequencies in Hz. Normalised by the 2nd stage carrier frequency. . . . . . . 276.2 Failure modes in tests 7-11, determined by visual inspection of the gears. . . . . 32
iii


Chapter 1
Introduction
Atlas Copco is a Swedish-based industrial group operating within four different business areas:compressor technique, mining and rock excavation technique, industrial technique and constructiontechnique. This master’s thesis has been carried out at the division Atlas Copco IndustrialTechnique AB in Stockholm which provides tools for customers in the automotive and aerospaceindustries, industrial manufacturing and maintenance, and in vehicle service. Their pneumaticand electric industrial tools and assembly systems assist customers in achieving fastening withinnarrow tolerances, minimising errors and interruptions in production.
1.1 Background and problem definition
Atlas Copco is continuously improving the planetary gear design for their electric nutrunners,see Figure 1.1, in order to increase life-span and power handling while maintaining a light andcompact unit that can fit inside a hand-held tool. As in all product development processes,performance tests are essential, Atlas Copco performs unit tests on their planetary gears in a labenvironment by applying a constant torque and running the gears at constant speed until theyfail completely. This approach accelerates the testing making it less time-consuming compared totesting the gear in an actual tool, which would require millions of joint tightenings. However, afterthe initial fault occurs, the gear deteriorates and may cause damage to additional components.Consequently making it difficult to identify the initial cause of failure and draw conclusions ofwhat the needed design improvements are.
Figure 1.1: Example of nutrunner.
1

Chapter 1 - Introduction
To improve the test process a method is desired that can detect when the first fault occurs andautomatically abort the test, providing an opportunity for the development engineer to examinethe gear before failing completely. Based on the problem presented, the aim of the master’s thesisis to develop this method. In order to succeed with the adopted challenge, the following researchquestion requires to be explored:
Is it possible and which methods are suitable for early stage fault detectionin Atlas Copco’s planetary gears for nutrunners.
The following factors are to be considered when comparing and evaluating the differentmethods performance:
• What is the size of detectable damages.
• Which fault modes are detectable.
• Possibility to identify the nature of the damage (e.g. pitting, tooth crack etc.).
• Repeatability.
• How do external factors affect the method (e.g. sensor placement, gear drive load etc.).
The ability to determine the gears health condition is also a function that may be integratedin future versions of electric nutrunners. The opportunity of detecting damages before completefailure would bring value to Atlas Copco’s customers since it would increase the possibility ofperforming predictive maintenance, reducing the risk of unforeseen stops in the production dueto tools failing.
1.2 Delimitations
The focus for this master’s thesis is to evaluate methods aimed to be used in a lab environment.When choosing amongst different methods, the ones believed to generate the best results in alab environment are to be investigated before the ones that have potential of being integrated infuture versions of Atlas Copco’s tools.
There exists several different models of planetary gears for different tools and applications,but for this evaluation testing will be performed on one single model selected by Atlas Copco.
1.3 Report structure
This thesis report starts with Chapter 2 explaining a few concepts and theories that are funda-mental for the research conducted. It is followed by Chapter 3 which is a summary of previousresearch, relevant for this thesis, within the same and adjacent fields. Then Chapter 4 presentsthe test set-up with the planetary gear examined, the test rig and measurement equipment. Thisis followed by Chapter 5 which describes the method and approach used for testing. The testresults are presented in Chapter 6 and are analysed in Chapter 7 where the authors thoughtson future improvements also are discussed. The thesis report ends with Chapter 8 containingconclusions drawn from the research conducted.
2
Chapter 2
Frame of reference
This chapter can be seen as a guide to matters that are discussed in the report but may beunfamiliar to the reader. It will present what a planetary gear is and what frequencies areassociated with it, and some common fault modes. Some signal analysis methods will also bepresented.
2.1 Fundamentals of planetary gears
The design of planetary gears (alt. epicyclic gears) provides advantages such as large gear ratio,high load-bearing capacity and high efficiency in a smaller and lighter format compared to ordinaryfixed shaft gears according to Jelaska [1].
Planetary gears consist of a central gear with external teething, or sun gear, placed coaxiallywith a larger gear with internal teething, or annular gear, and a planet carrier which supports oneor more planet gears. The illustration in Figure 2.1 shows an overview of the gear configurationand how members move relative to each other when the annular gear is fixed. Depending onwhich member is held fixed the planetary gear has different properties, but as the fixed annulargear configuration is the one used in the actual tool, that will be the one treated in this report.
sun
annulus
planet
carrier
(a) Gear scheme.
annulus
planet
carrier
sun
fs fcfp−c
(b) Overview
Figure 2.1: Planetary gear with names of components and direction of rotation whenannular gear is fixed.
3

Chapter 2 - Frame of reference
2.2 Periodicities in planetary gears
There are a lot of periodic behaviour in planetary gears, where several can be identified byvibration measurements. Some are best described by their individual frequencies, while thenumber of revolutions is more interesting for others.
2.2.1 Frequencies in planetary gears
The frequency spectrum for a planetary gear is more complex than for a fixed shaft gear. Thereason is that the design of the planetary gear leads to more gear pairs meshing, as thereare a number of planet gears and they all mesh with both the sun gear and the annular gearsimultaneously.
The fundamental frequencies in this section are given by Collacott [2]. They are calculatedfrom the number of teeth on the sun ts, planet tp and annular gear ta. The sun gear rotationalfrequency fs in Hz relative to the fixed annulus is
fs =Ns
60, (2.1)
where Ns is the suns rotational speed in revolutions per minute. The carrier frequency fc is
fc =ts
ts + tafs. (2.2)
These frequencies can be seen as absolute since they are relative to a fixed system, the annulargear. For some gear members it may be more interesting to calculate their frequencies relative toother non-stationary members. The planets frequency relative to the carrier fp−c is
fp−c =tsta
tp (ts + ta)fs =
tatpfc (2.3)
and the sun frequency relative the carrier fs−c is
fs−c =ta
ts + tafs =
tatsfc. (2.4)
The mesh frequency for a planetary gear with fixed annular gear is given by
fm =tsta
ts + tafs (2.5)
and combining Equation (2.5) with (2.2) yields
fm = tafc. (2.6)
If a gear member has a local fault on a single tooth it will excite a certain frequency dependingupon if it is the sun, planet or annular gear. These characteristic frequencies are often calledoverrun or high spot frequencies. They are based on the carrier frequency and the number ofplanet gears, as it determines how often the damaged tooth is in mesh with a planet gear. Theoverrun frequencies of the sun, planet, and annular gears respectively are given by
f∗s = ntatsfc (2.7)
f∗p = 2tatpfc (2.8)
f∗a = nfc, (2.9)
where n is the number of planet gears. There is a factor 2 in Equation (2.8) since the planetsmesh both with the sun and annulus in one complete revolution.
4
KTH Royal Institute of Technology - 2014
2.2.2 Resets of planetary gears
In order to achieve distributed wear on all teeth, planetary gears are preferably designed so thata tooth on one gear member will mesh with all teeth on the mating part before meshing withthe same tooth again. In this report, the period for the gear pair to return to the initial state(i.e. same two teeth in mesh) will be denoted as a ”reset”. The reset is calculated for both sunand planet gears for each stage and is given in revolutions of the carrier relative to the gear ofinterest. According to Samuel et al. [3] the reset can be calculated by
Reset =LCM (tg, ta)
ta, (2.10)
where LCM refers to the least common multiple, ta is the number of teeth on the annular gearand tg is the number of teeth on the gear of interest, i.e. the sun or planet gear. The LCM of allindividual resets yields the reset of the entire gear in revolutions of the planet carrier.
2.3 Planetary gear failure modes
The following section is a summary of commonly occurring gear failures described in Reference[4] and [5].
2.3.1 Pitting
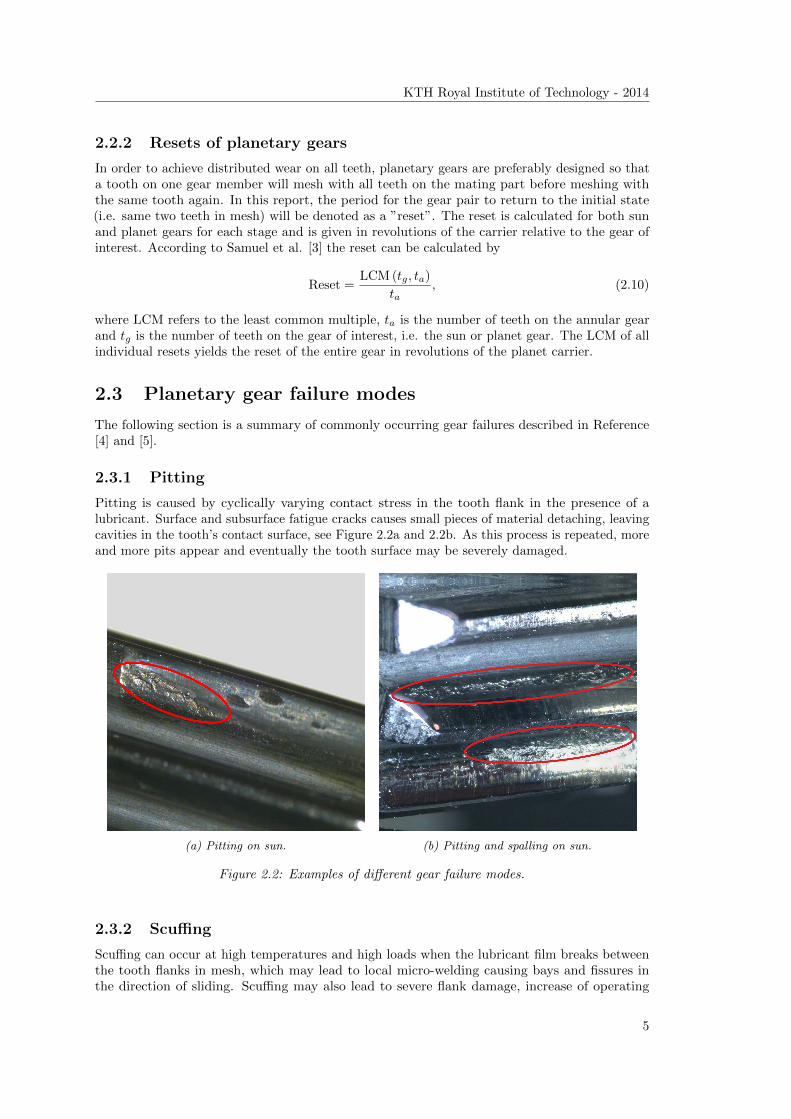
Pitting is caused by cyclically varying contact stress in the tooth flank in the presence of alubricant. Surface and subsurface fatigue cracks causes small pieces of material detaching, leavingcavities in the tooth’s contact surface, see Figure 2.2a and 2.2b. As this process is repeated, moreand more pits appear and eventually the tooth surface may be severely damaged.
(a) Pitting on sun. (b) Pitting and spalling on sun.
Figure 2.2: Examples of different gear failure modes.
2.3.2 Scuffing
Scuffing can occur at high temperatures and high loads when the lubricant film breaks betweenthe tooth flanks in mesh, which may lead to local micro-welding causing bays and fissures inthe direction of sliding. Scuffing may also lead to severe flank damage, increase of operating
5

Chapter 2 - Frame of reference
temperature, dynamic forces, vibrations, noise and loss of power. Compared to pitting and toothbreakage which often occur after millions of load cycles, scuffing can appear after a short-termoverload. However, if only light scuffing has occurred and the temporary overload is reduced, theflanks can smoothen themselves again when running under normal conditions for a period of time.
2.3.3 Deformation
Plastic deformation occurs when stresses in the gear exceed the yield strength in the material,causing a deformation that remains after the applied load is removed, see Figure 2.3a. This mayresult in deformed teeth and displacement of material due to the sliding/rolling action of gearsoperating under high loads and friction.
2.3.4 Cracks
Cracks in gears can occur due to multiple causes, fatigue cracks are caused by alternating orcyclic normal stress in the tooth when meshing. The initial crack is often very small and growsunder operation until the tooth fractures.
2.3.5 Lubrication failure
During long-time operation the gears lubricant can be used up, escape through seals or loose itslubricating properties. This may cause an increase in friction and temperature, bearing failureand a decrease of the gears efficiency, see Figure 2.3b.
(a) Teeth deformation on planet. (b) Bearing failure has caused temperature increaseon planet gear shaft.
Figure 2.3: More examples of different gear failure modes.
6

KTH Royal Institute of Technology - 2014
2.4 Signal analysis
Signal analysis is a vital part of understanding measured signals and there are a few fundamentaltools that have been utilized in this thesis project. They are the Fourier Transform, Root MeanSquare (RMS) and Synchronous averaging and will be described shortly in the following sections.
2.4.1 Fourier Transform
The following section is based on Boden et al. [6] and Wallin et al. [7]. The measured vibrationfrom most systems are a combination of several vibrations with varying period length. Identifyingindividual frequency components in the sampled signal can be difficult in the time domain.However, in the frequency domain all periodic contributions can be observed as peaks in thefrequency spectrum. Converting a continuous signal x (t) from the time domain to the frequencydomain is done by using the Fourier Transform
X (ω) =
∫ ∞−∞
x (t) e−iωtdt, (2.11)
where ω is the frequency of interest. However, a sampled signal is by default a discrete signal,and the Fourier Transform needs to be adapted. The result is the Discrete Fourier Transform,defined as
X (k) =1
N
N−1∑n=0
x (n) e−i2πnkN , (2.12)
where x (n) is the nth sample of the continuous signal x (t) and k is the index of the frequencyof interest. The Discrete Fourier Transform is a computationally heavy algorithm, where N2
operations is required for a signal of length N . By taking advantage of the symmetric propertiesof the trigonometric functions involved, computation time can be saved. The algorithm using thisproperty is called Fast Fourier Transform (FFT) and reduces the number of calculations requiredto N log2 (N), if N is a power of 2. In practice it is difficult to collect an exact power of 2 samplepoints, this can be solved by appending zeros or resampling the signal to the appropriate length.
2.4.2 Root Mean Square
There are several ways to extract valuable information from signals. With a sinusoidal signal itmay be interesting to look at its amplitude, since it gives the maximum value of the signal. If thesignal is more complicated, and especially if it is a sampled signal with much noise, the amplitudewill not give much information about the signal, simply because the signal does not have thesame peak value over time. To smooth noisy data a mean value can be calculated, however in thecase of signals with sinusoidal behaviour the mean will only be the offset from zero, which is inmost cases not interesting. But if each value is squared before the mean is calculated and thesquare root is calculated of the mean, the result will be the Root Mean Square (RMS). For adiscrete signal it is given by
RMS =
√√√√ 1
N
N∑n=1
[x (n)]2, (2.13)
and is a measure of the power content.
7

Chapter 2 - Frame of reference
2.4.3 Synchronous averaging
Sampled signals are always riddled with noise. A technique called Synchronous averaging can bevery effective in reducing the noise in vibration signals from rotating machinery. It is applied inthe time-domain and takes advantage of the periodic nature of such machinery where mechanicalsignals repeat cyclically every rotational cycle.
Synchronous averaging is performed by dividing the complete signal into subsets correspondingto one rotational cycle with the same number of equidistant sample-points. To compensate forvarying rotational speeds of the machine, causing the number of samples per rotational cycle todiffer, a measurement system that records the angular position can be used. Then the signal canbe resampled by interpolation ensuring that the vibration is sampled at the same position inevery rotational cycle.
By taking the average value of the matching sample points across all subsets, the signal-to-noiseratio is increased since non-periodic components (i.e. noise) are suppressed and the periodicsignal will be enhanced. An example of the methods effectiveness can be seen in Figure 2.4.
0 2 4 6 8 10
−1
0
1
Time [s]
Amplitude
(a) One period of a sine signal with random noise.
0 2 4 6 8 10
−1
0
1
Time [s]
(b) Synchronous average over 20 subsets.
Figure 2.4: Example of how synchronous averaging increases the signal-to-noise ratio.
2.4.4 Signal modulation
Consider a sine signaly (t) = A sin (ω0t) (2.14)
with amplitude A and angular frequency ω0. A modulation is when the amplitude or frequencyof the signal is modified by another periodic signal with an angular frequency ω1 that is less thanthe carrier frequency ω0, according to Roder [8]. If the signal amplitude is subject to the periodicvariation
Aam (t) = A (1 + k sin (ω1t)) , (2.15)
where k determines the amplitude of the modulation, the signal is Amplitude Modulated (AM),yielding
yam (t) = Aam (t) sin (ω0t). (2.16)
As seen in Figure 2.5a the amplitude of the original signal in the time domain has a sinusoidalwave form. In the frequency domain this can be seen as a pair of sidebands around the carrierfrequency, see Figure 2.5b.
8

KTH Royal Institute of Technology - 2014
0 0.2 0.4 0.6 0.8 1
−2
0
2
Time [s]
Amplitude
Modulated signal, 40 HzModulation signal, 5 Hz
(a) Time domain.
35 40 450
0.5
1
Frequency [Hz]
Am
plitu
de
Modulated spectrumCarrier frequency
5 Hz
(b) Frequency domain.
Figure 2.5: Example of an amplitude modulated signal.
In the other case where the carrier frequency varies periodically
ωfm (t) = ω0
(t +
k
ω1sin (ω1t)
)(2.17)
the signal is Frequency Modulated (FM), yielding
yfm (t) = A sin (ωfm (t)). (2.18)
In time domain the carrier signal will be compressed and expanded by the modulation, see Figure2.6a. In the frequency domain an infinite number of sidebands will appear, see Figure 2.6b.
0 0.2 0.4 0.6 0.8 1
−2
0
2
Time [s]
Amplitude
Modulated signalModulation signal
(a) Time domain.
35 40 450
0.5
1
Frequency [Hz]
Amplitude
Modulated spectrumCarrier frequency
(b) Frequency domain.
Figure 2.6: Example of a frequency modulated signal.
9


Chapter 3
Literature review
Machine monitoring is an art which has been practised for a long time, just by listening to themachine a skilled operator can estimate its condition. By experience he or she recognises thesound character of a healthy machine, and can therefore detect when the sound character changesdue to wear or failure of different components. In order to prevent machine breakdowns in theindustry, with high costs as a consequence, a lot of effort has been put into developing methods forautomated machine monitoring. The ability to estimate the current state of health of machinesenables the possibility to perform predictive maintenance which often is more cost-efficient thanrepairing at breakdowns, according to Boden [6]
Health monitoring and fault detection of gears specifically has been extensively researchedover several decades since they are an essential component in many machines, therefore vastamounts of literature can be found on the topic. In a review on the research available specificallyon planetary gear monitoring, Lei et al. [9] conclude that the majority of earlier work focused onfixed shaft gear drives which are less complex compared to planetary gears. However, they madethe observation that the amount of publications on specifically planetary gears had increasedrapidly in recent years. Especially in the aeronautical industry, several attempts have been madeto develop Health and Usage Monitoring or Prognostic and Health Management systems foruse in helicopter transmissions, where drive train failure is one of the most common cause ofaccidents, according to Samuel and Pines [10].
The gears in Atlas Copco’s tools are considerably smaller in size compared to helicoptertransmissions, which is a factor that limits the methods available since there is no space to mountsensors on individual components inside the gear drive.
The background study conducted for this thesis project has focused on the planetary gearscomplex spectral structure and how it changes over time with wear and damages. Understandingthis has been vital in order to know what to search for when analysing and post processingmeasurement data.
3.1 Vibration monitoring
All machines with moving components generate vibrations with varying frequencies that aretransferred throughout the system. Every machine element has a characteristic vibration signatureand the art of machine vibration monitoring is to understand how wear and damages to thedifferent components affects the vibration signal picked up by the transducer.
3.1.1 Transversal vibration
In fixed shaft gears, the mesh frequency is commonly one of the dominant frequency componentsin the vibration signal due to the cyclically varying contact force between the teeth pair inmesh. For planetary gears however, observations has shown that when measuring the transversal
11
lfeng
Highlight
have

Chapter 3 - Literature review
vibrations with a transducer mounted on the annular gear, it is the modulation sidebands tothe meshing frequency that are dominant. While the meshing frequency in some cases can becompletely suppressed. According to McFadden and Smith [11] this phenomenon is due to theplanets moving in relation to the annular gear causing the mesh location to vary over time. Thevibration generated from the meshing of the sun and planet pair will propagate to the transducervia the sun, bearings and annulus. The vibration generated from the meshing of the planetand annulus is transmitted directly through the annulus. As the carrier rotates, the distancefrom meshing location to the transducer will vary, as seen in Figure 3.1. Assuming that theannular gear flexes, the varying transmission distance causes a modulation effect on the vibrationperceived by the transducer. This is because the vibration contribution from one individual planetis greatest when it is passing the transducer and least when it is farthest away.
Accelerometer
Mesh fre
q.
Side
band
s
Time domain Frequency domain
f
t
Figure 3.1: Example of how the propagation difference for the vibration varies over timecausing an AM-effect on the signal perceived by the transducer.
Feng and Zuo [12] also points to the fact that the time-varying nature of the sun-planet andplanet-annular meshing results in amplitude modulation effects. In their publication they presentvibration signal models for fault diagnosis of planetary gears where they consider the AM andFM effects due to damaged gears and vibration transmission paths. Considering several differentfault modes, signal models were derived and validated through experimental and industrial testdata. Suppose that a gear tooth develops a local fault, such as a pit or root crack, that causes achange in the flank working surface or the meshing stiffness compared to other teeth. When thedamaged tooth engages with the mating gear tooth, the local fault will cause an impulse in thevibration signal with a meshing characteristic different from the undamaged teeth. Assumingthat the gears rotational speed is constant, this impulse will repeat periodically with a frequencycorresponding to the rotating frequency of the damaged gear and appear as a sideband to themesh frequency in the vibration spectrum, see Table 3.1. Even a healthy gear may generate thesesidebands due to imperfections from the manufacturing process, but Feng and Zuo show thatamplitude changes for the sidebands indicates damages to the corresponding gear.
Table 3.1: Vibration spectrum sidebands for different fault modes.
Damaged gear Sideband location
Annulus kfm ± nf∗aPlanet kfm ± nf∗p and kfm ± fc ± nf∗p
Sun kfm ± nf∗s and kfm ± fs ± nf∗sk, n = 1, 2, 3, . . .
12

KTH Royal Institute of Technology - 2014
3.1.2 Torsional vibration
As explained in the previous section, the transversal vibrations of planetary gears have a complexspectral structure due to the AM and FM nature. In this section, an alternative approach proposedby Feng and Zuo [13] is described where the torsional vibration is used as an alternative to thetransversal vibration. They comment in their article that when conducting their backgroundstudy, they had no success in finding earlier publications attempting to use the torsional vibrationfor the purpose of planetary gear fault diagnosis. In the writing of this thesis, two years afterFeng and Zuo’s article was published, their work was still the only one found on the topic.
The fundamental idea to observing the torsional vibration for planetary gear fault detection isthe same as for observing the transversal vibration. Gear faults will change the meshing stiffnesscausing an impulse also in the torque perceived by the transducer, and by detecting these impulsesone can identify gear faults.
As mentioned earlier the planets orbits around the sun gear, causing the planet-sun andplanet-annular meshing locations to change over time. In contrast to the transversal vibration,this will not cause an AM effect on the torsional vibration since the propagation distance fromthe meshing location to the torque transducer, connected to either the input or output shaft, isconstant over time. However, compared to fixed shaft gears where only the meshing gear pairaffect the modulation of the torsional vibration; planetary gears have multiple gear pairs thataffect the torsional vibration perceived by the torque transducer. Suppose one of the planets isdamaged, in that case the torsional vibration is affected by the meshing of both the planet-sunand planet-annular gear pair. If instead the sun or annular gear is damaged, only the meshing ofplanet-sun or planet-annular gear pair affects the torsional vibration. But there are still multiplegear pairs modulating the signal since the sun and annular gear is engaged with all planets.
By deriving a model for the torsional vibration Feng and Zuo show that the AM and FMparts of the torsional vibration signal contains information of the faulty gear. They show thatdistributed gear faults can be diagnosed by monitoring the change in the mesh frequency’ssidebands associated with the faulty gears frequency relative to the planet carrier, i.e. fs−c, fp−cand fr−c. Local gear faults can also be diagnosed in the same manner, but the local fault alsocauses sidebands associated with the faulty gears overrun frequencies f∗s , f∗p and f∗a .
3.2 Diagnostic parameters
One major challenge identified when performing the literature review was that most of themethods developed, specifically for planetary gears, rely on visual inspection of collected data. Theconsequence is that the methods performance largely depend on the expertise of the investigatorto spot features indicating gear damage, thus making it complicated to develop automatedalgorithms with adequate performance.
For fixed shaft gears there has been several diagnostic parameters designed for the purpose toaid in gear health monitoring. Two examples are the FM0 and FM4 presented by Stewart [14] inthe late 1970s. Where FM0 indicates distributed gear faults by detecting major changes in themesh pattern and FM4 indicates the occurrence of local faults on a limited number of teeth bydetecting higher-order sidebands appearing in the vibration signal. These parameters have alsobeen tested on planetary gears by Lei et al. [15] but were not considered very effective.
The following section will present two diagnostic parameters specially designed for planetarygears.
3.2.1 FRMS and NSDS
Lei et al. [15] published an article where they introduce two diagnostic parameters for planetarygears. First the Filtered Root Mean Square (FRMS) which is as the name suggests the RMS of a
13

Chapter 3 - Literature review
vibration signal after applying a filter cancelling certain frequencies. It is calculated by
FRMS =
√√√√ 1
N
N∑n=1
[y (n)]2, (3.1)
where y (n) is the nth data point of the filtered signal with length N samples. The process ofimplementing FRMS is as follows:
1. Calculate the Fourier transform of the sampled vibration signal.
2. Apply a filter in the frequency domain that removes the shaft frequency and its five-orderharmonics, the gear meshing frequency and its three-order harmonics, and the modulationsidebands and its harmonics.
3. Calculate the inverse Fourier transform of the filtered signal, yielding the filtered signaly (n).
4. Calculate the RMS of y (n).
The authors reasoning is that the vibration spectrum for a planetary gearbox has rich modulationsidebands in addition to the shaft frequency and mesh frequency with their respective harmonics.They mean that the vibration signal from both healthy and damaged gears have these modulationsidebands and are therefore not indicators of faults. The second parameter they introduce is theNormalised Summation of Difference Spectrum (NSDS). It is calculated by normalising the sumof positive amplitudes of the difference vibration spectrum between the healthy and faulty gear,mathematically expressed as
NSDS =
I∑i=1
Xd (i)
I∑i=1
Xg (i)
(3.2)
Xd (i) =
{Xg (i) −Xh (i) if Xg (i) > Xh (i)0 if Xg (i) 6 Xh (i)
where Xh (i) and Xg (i) are the frequency spectra of the vibration signal from a healthy andunknown gear, respectively. Since they believed that the vibration signal and the correspondingfrequency spectrum would change when damages to the gear occur, the idea was that the NSDSwould detect these changes.
Lei et al. evaluated the parameters performance by testing them on a healthy gear, a gearwith pitted sun gear and a gear with cracked sun gear. The vibration data was collected from atest rig running at three different speeds, with and without applying load. Their observation wasthat the parameters could clearly distinguish the different health conditions, although the FRMSwas sensitive to the gear speed and the normalisation factor in the NSDS was not perfect. Theycomment that the performance of the proposed parameters might be reduced if the applied loadvaries largely since the gears vibration characteristics would probably change.
14
Chapter 4
Experimental set-up
The experimental set-up will be presented in this chapter. Descriptions of the specific planetarygear as well as descriptions of the test rig and which sensors and data acquisition units used areprovided.
4.1 The planetary gear
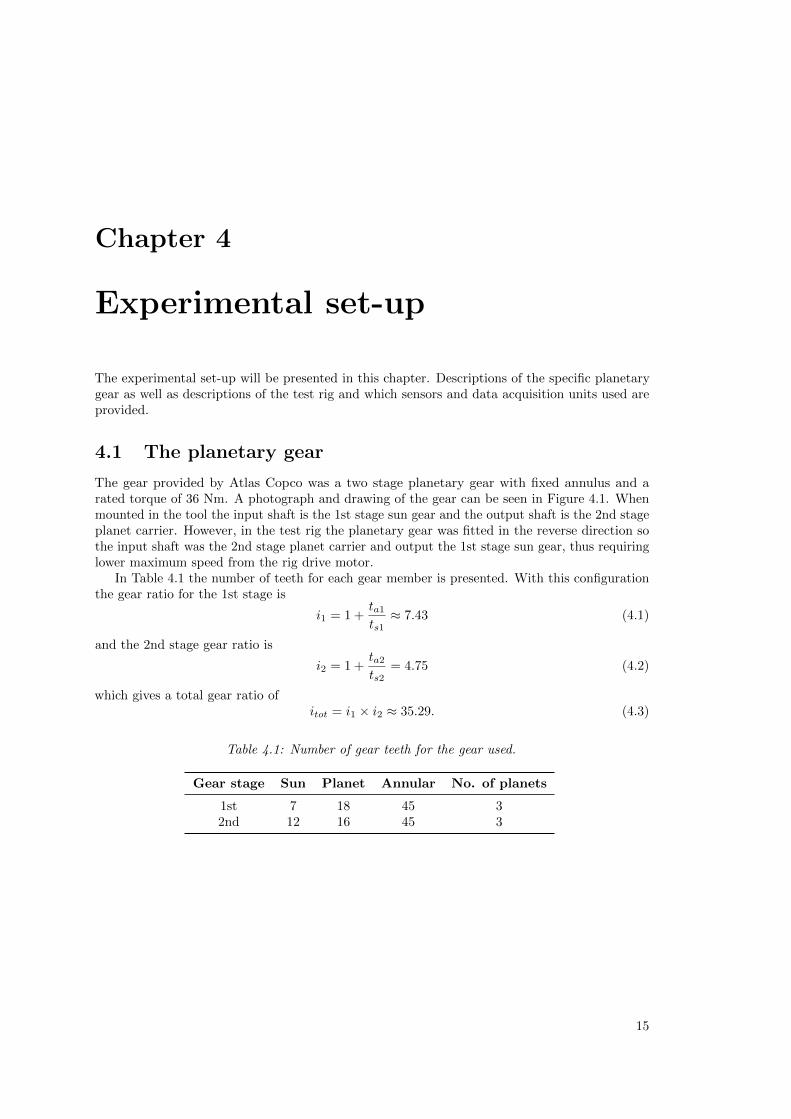
The gear provided by Atlas Copco was a two stage planetary gear with fixed annulus and arated torque of 36 Nm. A photograph and drawing of the gear can be seen in Figure 4.1. Whenmounted in the tool the input shaft is the 1st stage sun gear and the output shaft is the 2nd stageplanet carrier. However, in the test rig the planetary gear was fitted in the reverse direction sothe input shaft was the 2nd stage planet carrier and output the 1st stage sun gear, thus requiringlower maximum speed from the rig drive motor.
In Table 4.1 the number of teeth for each gear member is presented. With this configurationthe gear ratio for the 1st stage is
i1 = 1 +ta1ts1
≈ 7.43 (4.1)
and the 2nd stage gear ratio is
i2 = 1 +ta2ts2
= 4.75 (4.2)
which gives a total gear ratio ofitot = i1 × i2 ≈ 35.29. (4.3)
Table 4.1: Number of gear teeth for the gear used.
Gear stage Sun Planet Annular No. of planets
1st 7 18 45 32nd 12 16 45 3
15

Chapter 4 - Experimental set-up
Sun, 1st stage Annulus 1st stage 2nd stage
(a) Photograph of the gear.
Sun, 1st stage
Carrier, 1st stage/Sun, 2nd stage
Carrier, 2nd stage
Planet, 2nd stage
Annulus
Planet, 1st stage Planet bearing
(b) Drawing of the gear.
Figure 4.1: The planetary gear used for testing.
4.2 The test rig
A power recirculating or back-to-back test rig was used to perform the tests. The advantage withthis type of rig is that the only input power needed from the drive motor is to cover the powerlosses in the system, as the gear torque is not generated by applying a braking torque but isgenerated from torsional shafts.
The rig consisted of two straight parallel axes that were connected by sprockets and toothedbelts, see Figure 4.2. The bottom axis consisted of the two torsion shafts which were used toset the torque applied to the gears. While one of the shafts was held fixed, torque was manuallyapplied to the other with a lever generating torsion in the shafts. When the desired gear torquewas set, the two shafts were interlocked rotationally by tightening a friction coupling. Theplanetary gears were connected to the upper shaft, placed in holders fixating the annular gear asseen in Figure 4.3. Due to the back-to-back design, two planetary gears with the same ratio wererequired in order to match the rotational speeds. The torque in each gear was measured with
16

KTH Royal Institute of Technology - 2014
two in-line transducers connected to the 2nd stage carrier on each gear, which also measured theangular position of the carriers. To compensate for axial misalignment bellows couplings wereconnected on either side of the transducers. To measure transversal vibrations an accelerometerwas mounted with an adhesive directly on the annular gear of gear 1. The temperatures of thegears were measured on the annulus by two IR-thermometers. The rig was monitored by anAgilent DAQ configured to turn off the rig if either the measured torque or temperature deviatedfrom a predefined range.
(a) Photograph of the rig.
Drive motor
Gear 1
Bellows coupling
Friction coupling
Nc2 Ns1 Nc2
Toothed belt drive
Gear 2
Torsion shaft
Nc2 Nc2
Accelerometer
Torque transd. 1 Torque transd. 2
(b) Illustration of the rig.
Figure 4.2: The rig used for testing.
17

Chapter 4 - Experimental set-up
Gear holder
Bellows couplingconnector
Ball bearing
Spacer
Guide
Shaft tomating gear
Gear
Annular gearrotationalfixation
Figure 4.3: Drawing of gear mounted in holder.
4.3 Sensors and data acquisition
Choosing the equipment to collect data was an important part of the test set up, that includesdeciding what was to be measured, how to measure it and the resolution of the measurements. Inthis case the focus was on transversal and torsional vibrations and therefore accelerometers andtorque transducers connected to a data acquisition system was used.
4.3.1 Data acquisition system
The data acquisition hardware used during tests was a DEWE-43 [16] with 8 analogue and8 digital counter channels which can be seen in Figure 4.4. 24-bit sigma-delta analog-digitalconverters converted the analogue signals at a maximum rate of 200 000 samples per second. Allsensors except the thermometers were connected and sampled by the DEWE-43. Because of thelow rotational speed of the test rig, the frequencies within the planetary gears were relatively lowwith the main frequencies of interest ranging from 5 to 250 Hz. The sampling rate was thereforeset to 4 kHz. The DEWE-43 was connected to a computer via USB and the data was stored byusing the software Dewesoft X [17].
Figure 4.4: DEWE-43 USB DAQ used for collecting data.
18

KTH Royal Institute of Technology - 2014
4.3.2 Torque transducer
The torque transducer used was a Magtrol TM-312 [18] which was an in-line torque transducerwith a rated maximum torque of ±200 Nm, with an analogue output signal of ±10 VDC. It had abuilt-in 2nd order Butterworth low-pass filter with 12 predefined cut-off frequencies ranging from1 to 5000 Hz. During the tests it was set to 1000 Hz. The transducer also included a incrementalrotary encoder that outputted a digital signal with a resolution of 60 pulses/rev.
4.3.3 Charge accelerometer
Due to the small size of the planetary gears tested, the choice of accelerometers was limited. Theaccelerometer of choice was a Bruel & Kjær Type 4374 [19] with a base diameter of 5 mm, heightof 6.7 mm and a frequency range spanning from 1 to 26000 Hz. This was a charge accelerometerand an amplifier was needed to convert the vibration signal to an analogue voltage signal requiredby the DEWE-43. This was done by a Bruel & Kjær Type 2635 [19]. The amplifiers low-passfilter was set to 1000 Hz.
19

Chapter 5
Method
In this chapter the original and revised test plan are described. The following sections aredevoted to the data collection procedure, the implementation of the synchronous average and thecalculation of the health parameters.
5.1 Original test plan
In order to evaluate the methods presented the following test plan was constructed:
1. Run-in the gear.
2. Take reference measurements of the healthy gear at different speeds and loads.
3. Disassemble the gear and exchange one gear member with one that has a known fault.
4. Take measurements of the damaged gear.
5. Reassemble the gear with its original parts.
6. Take additional measurements to detect changes from the ones taken in step 2.
This process was to be repeated on several gears for the different fault modes selected, withthe purpose to determine the methods performance considering the factors mentioned in theintroduction. To further investigate the possibility to find faults at different speeds and loads,the speed was to be changed in three steps; 30, 60 and 90 rpm while the load was set to the ratedtorque, 36 Nm, and approximately half the rated torque, 15 Nm.
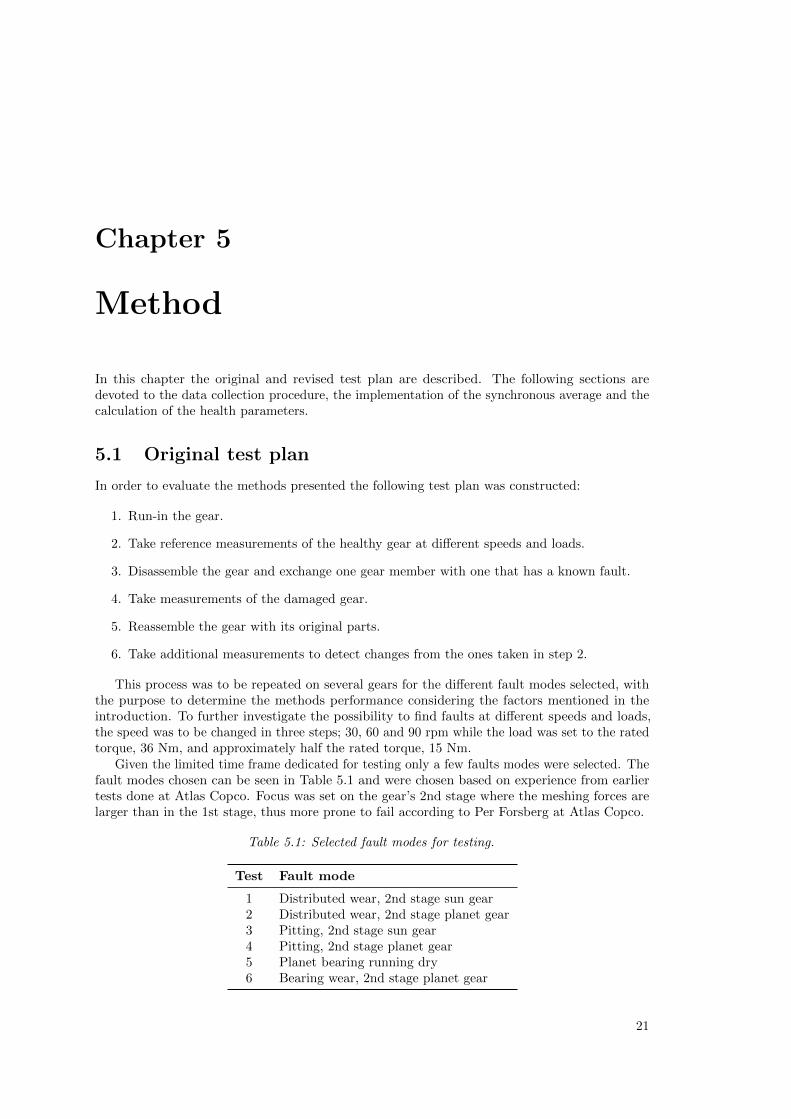
Given the limited time frame dedicated for testing only a few faults modes were selected. Thefault modes chosen can be seen in Table 5.1 and were chosen based on experience from earliertests done at Atlas Copco. Focus was set on the gear’s 2nd stage where the meshing forces arelarger than in the 1st stage, thus more prone to fail according to Per Forsberg at Atlas Copco.
Table 5.1: Selected fault modes for testing.
Test Fault mode
1 Distributed wear, 2nd stage sun gear2 Distributed wear, 2nd stage planet gear3 Pitting, 2nd stage sun gear4 Pitting, 2nd stage planet gear5 Planet bearing running dry6 Bearing wear, 2nd stage planet gear
21

Chapter 5 - Method
Due to the gear members small size it was considered hard to introduce faults manually,instead already faulty parts from earlier tests were planned to be used. By doing this the damagewas considered to be realistic and reproducible as the same part could be used for several differentgears.
5.2 Revised test plan
After starting out performing tests according to the original test plan presented in the previoussection, results showed that uncertainties were introduced in the disassembly and reassembly ofthe gear causing incoherent results. Since the time dedicated for testing was running out, anotherapproach had to be chosen in order to generate results reliable enough to draw conclusions from.
Instead of disassembling gears and exchanging healthy gear members for damaged ones,new gears were run continuously until they failed by natural wear. Measurements were takenperiodically throughout the whole test. This eliminated the uncertainties introduced by thereassembly of the gears, but also made it impossible to control the fault leading to a breakdown.The tests were run with the rated torque 36 Nm at 60 rpm which was the highest speed possiblewithout overheating the gear.
5.3 Data collection and processing
The following section refers to the steps 1 to 5 in Figure 5.1 and describes how the data collectionand post-processing were performed.
1. Since every test ran for approximately 48 hours, sampling continuously was not considerednecessary or practical due to the great amount of data that would have been stored.Therefore, the system was set up so that the data acquisition software, Dewesoft X, rancontinuously monitoring the number of revolutions completed but only saved data for aperiod of 5 gear resets every 35th reset. By using this approach, the total amount of datawas reduced and made it possible to continuously export the datasets, see Table 5.2, toMAT-files [20] as the test was running.
2-3. The MAT-files were individually loaded in Matlab where the torque and accelerometer datawas divided into five smaller subsets where every subset corresponded to one reset-period.
4. Using the position data (No. of revolutions completed, Table 5.2) every subset was resampledusing linear interpolation yielding five signals with the same number of uniformly distributedsample points. The synchronous average was then calculated by using all the subsets. Bysubtracting the signals mean value, the DC-gain was removed.
5. The synchronous averaged signal was used to calculate the health parameters presented inSection 3.2. The steps 2 to 5 was repeated for each dataset collected during the test. Thehealth parameter calculated was plotted to visualise the change during the gears life-span.
Table 5.2: Contents in dataset exported from Dewesoft X.
Signal Unit
Torque 1 NmTorque 2 NmAcceleration m/s2
No. of revolutions completed revSpeed rpmSample point time stamp s
22

KTH Royal Institute of Technology - 2014
2 4 6 8 10 12 14 1625
30
35
40
Tim
edomain
signal
2 4 6 8 10 12 14 160
0.2
0.4
0.6
0.8
1
Time [s]
Period
1.2.
3.4.
5.
3)
4)
5)
Torque
Acceleration
2)
1)
0 2 4 6 8 10 12x 104
0
0.05
0.1
0.15
0.2
0.25
0.3
0.35
Nr of revolutions completed [rev]
Healthparameter
10 20 30 40 50 60 70 8025
30
35
40
Tim
edomain
signal
10 20 30 40 50 60 70 800
0.2
0.4
0.6
0.8
1
T ime [s]
Period 1. 2. 3. 4. 5.
0 2 4 6 8 10 12 14 16−6
−4
−2
0
2
4
6
Position [rev]
Synch
ronisedavera
ge
...test10_001.mat test10_002.mat
Figure 5.1: Flowchart of the data processing.
23

Chapter 5 - Method
5.4 Synchronous average in practice
When performing the synchronous average two parameters needed to be determined, namely theperiod length of each subset and the number of subsets to average over. The latter was decidedby calculating the synchronous average by averaging over 10, 7, 5, and 3 subsets and comparingthe results. Visual inspection showed that there was no significant difference when averaging over10 subsets compared to only 5. Therefore 5 subsets were used throughout all tests.
The period length selected corresponded to 16 complete revolutions of the 2nd stage carrier.It should be noted that 16 revolutions of the carrier do not correspond to a reset of the entireplanetary gear. The resets for the annular-sun and annular-planet for both stages calculated byEquation (2.10) can be found in Table 5.3. Calculating the LCM of these resets yields the totalreset for the entire planetary gear,
Reset = LCM(7, 2, 4, 16) = 112. (5.1)
Running the rig at 60 rpm, it would have taken 5 × 112 s = 560 s to collect one dataset. Todecrease the amount of data another approach was tested where the reset of the 1st stageannular-sun was neglected. The idea was that the meshing of this gear pair had minimal effecton the torque and acceleration signal seen by the transducers, since the 1st stage meshing forcesare smaller than those for the 2nd stage. Another factor is that the vibrations from the 1ststage have to travel through the 2nd stage gears before reaching the torque transducer. Thelonger propagation distance may dampen these vibrations. Neglecting the reset of the 1st stageannular-sun yielded a period length of
Reset = LCM(2, 4, 16) = 16 (5.2)
revolutions of the 2nd stage carrier, corresponding to 5 × 16 s = 80 s at 60 rpm.When testing this alternative approach, no significant difference in the sampled signal was
visually observed, neither in the time domain nor the frequency domain. Therefore, it wasconsidered possible to select a period length of 16 carrier revolutions instead of 112, thus reducingthe amount of data approximately with a factor of 7.
Table 5.3: Reset revolutions for planetary gear.
Gear stage Annular - Sun Annular - Planet
1st 7 22nd 4 16
5.5 FRMS and NSDS in practice
The FMRS was calculated according to Section 3.2. After the time signal was transformed intothe frequency domain, the frequencies presented in Table 5.4 were filtered out using a 4th orderButterworth bandstop filter. These were the five first shaft frequency harmonics and the three firstmeshing frequency harmonics of the 1st and 2nd stage, calculated from the equations presentedin Section 2.2.1, and will of course vary depending on the design of the planetary gear in question.All other frequencies were left untouched and the signal was transferred back to the time domain.The RMS was then calculated yielding the FRMS value.
The NSDS parameter was calculated using Equation (3.2). For the revised test plan, wherethe whole life-span of the planetary gear was measured, the healthy frequency spectrum Xh waschosen to be the third measurement. It was chosen since it was considered that the gear would berun-in by that point and therefore a good representative of the signal from a healthy gear. Theinterpolation performed in the synchronous averaging guaranteed that all subsets were of equallength, and the normalisation of the frequencies yields that the difference spectrum Xd could
24

KTH Royal Institute of Technology - 2014
simply be calculated using element by element subtraction of the healthy frequency spectrumarray and the unknown frequency spectrum array, as the peaks in the frequency spectra wouldcorrelate throughout all subsets. The sum of all frequency amplitudes in the difference spectrumXd was then normalised by the sum of all frequency amplitudes in the unknown spectrum Xg
yielding the NSDS value.
Table 5.4: Frequencies in Hz filtered in FRMS.
Harmonic Shaft 1st stage mesh 2nd stage mesh
1 1 213.75 452 2 427.5 903 3 641.25 1354 4 - -5 5 - -
25


Chapter 6
Results
6.1 Identification of fundamental frequencies
Since the test rig contains a large number of rotating components with greater inertia relative tothe gear, one concern was that the frequencies not originating from the gear would dominate thetorque and acceleration signals. Initial measurements were taken on a healthy gear in order toconfirm that it was possible to obtain torque and acceleration signals where the frequencies ofinterest were able to be identified. The fundamental frequencies for the gear was calculated usingthe equations given in Section 2.2.1 and the numeric results can be seen in Table 6.1.
Table 6.1: Gear frequencies in Hz. Normalised by the 2nd stage carrier frequency.
Gear stage Mesh Abs. Rel. Char.
fm fc fs fp−c fs−c f∗s f∗p f∗a
1st 213.8 4.8 35.3 11.9 30.5 91.6 23.8 14.32nd 45 1 4.8 2.8 3.8 11.3 5.6 3
In Figure 6.1 and 6.2 the spectrum for a torque and acceleration dataset is presented,respectively. The dataset was sampled on a healthy gear and synchronous averaging over fiveresets was performed on the time-domain signal before performing the Fourier Transform.
In Figure 6.1a and Figure 6.2a one can identify the 2nd stage mesh frequency (45 Hz) as avery dominant component, and several of the sidebands expected according to Section 3.1.2 canalso be identified. That the 2nd stage mesh frequency is very significant may not be surprisingsince the torque sensor is connected directly to the 2nd stage planet carrier.
In Figure 6.1b and 6.2b the spectrum is zoomed in around the 1st stage mesh frequency (213.8Hz). Here the mesh frequency is not dominant and only a few of the expected sidebands can beidentified, even though the total number of sidebands is larger compared to the 2nd stage meshfrequency.
27

Chapter 6 - Results
30 35 40 45 50 55 600
5 · 10−2
0.1
0.15
0.2
f mfm
+1fc
fm
+1fp−
c
fm
+1fs
fm
+1fs−
c
fm
−1fc
fm
−1fp−
c
fm
−1fs
fm
−1fs−
c
fm
+2fc
fm
+2fp−
c
fm
+2fs
fm
+2fs−
c
fm
−2fc
fm
−2fp−
c
fm
−2fs
fm
−2fs−
c
fm
+3fc
fm
+3fp−
c
fm
+3fs
fm
+3fs−
c
fm
−3fc
fm
−3fp−
c
fm
−3fs
fm
−3fs−
c
Velocity normalised frequency [1/rev]
Amplitude
(a) 2nd stage mesh frequency with sidebands.
180 190 200 210 220 230 240 2500
5 · 10−2
0.1
0.15
0.2
f m
fm
+1fc
fm
+1fp−
c
fm
+1fs
fm
+1fs−
c
fm
−1fc
fm
−1fp−
c
fm
−1fs
fm
−1fs−
c
fm
+2fc
fm
+2fp−
c
fm
+2fs
fm
+2fs−
c
fm
−2fc
fm
−2fp−
c
fm
−2fs
fm
−2fs−
c
fm
+3fc
fm
+3fp−
c
fm
+3fs
fm
+3fs−
c
fm
−3fc
fm
−3fp−
c
fm
−3fs
fm
−3fs−
c
Velocity normalised frequency [1/rev]
Amplitude
(b) 1st stage mesh frequency with sidebands.
Figure 6.1: Frequency spectrum of the signal from torque sensor connected to gear 1.Normalised by the 2nd stage carrier frequency. The red/dotted lines indicatethe locations of identified sidebands.
28

KTH Royal Institute of Technology - 2014
25 30 35 40 45 50 55 60 650
5 · 10−2
0.1
0.15
0.2
f m
fm+1f∗ a
f m−
1f∗ a
fm+2f∗ a
fm−2f∗ a
fm+3f∗ a
fm−3f∗ a
fm+4f∗ a
fm−4f∗ a
fm+5f∗ a
fm−5f∗ a
fm+6f∗ a
fm−6f∗ a
fm+1f∗ s
fm−1f∗ s
Velocity normalised frequency [1/rev]
Amplitude
(a) 2nd stage mesh frequency.
190 200 210 220 230 2400
0.2
0.4
0.6
0.8
1
f m
fm+1f∗ a
fm−1f∗ a
fm+1f∗ p
fm−1f∗ p
fm+fc−1f∗ p
fm−fc+1f∗ p
fm+1f∗ s
fm+2f∗ s
Velocity normalised frequency [1/rev]
Amplitude
(b) 1st stage mesh frequency.
Figure 6.2: Frequency spectrum of signal from accelerometer mounted directly on theannulus of gear 1. Normalised by the 2nd stage carrier frequency. Theblue/dotted lines indicate the locations of identified sidebands.
29

Chapter 6 - Results
6.2 Original test plan
As mentioned earlier, testing according to the original test plan did not generate satisfactoryresults. As the idea was to exchange healthy gear members to damaged ones the gear requiredto be dismounted from the test rig and disassembled. It was observed that these actions aloneaffected the system making the signals collected before and after a disassembly to differ whencomparing them. This of course also affected the diagnostic parameters, making their value shifteven though the gears health state remained the same.
In Figure 6.3 and 6.4 it can be observed how the calculated NSDS and FRMS varied whenthe gear had run 15,000-20,000 revolutions while making changes in the test set up. The verticallines in the plots indicate when these changes were made and between each line the gear rancontinuously. The adjustments consisted for instance of removing and reinserting the 2nd stageresulting in new teeth pairs being in mesh, loosening and tightening the screws fastening thegear holder to the rig, releasing and reapplying the torque load. The smallest health parametervariation for the NSDS is for torque 1 (±10 %) while the acceleration varies most (±14 %). Forthe FRMS it is the acceleration that varies least (±10 %) while most is torque 2 (±13 %).
1.5 1.55 1.6 1.65 1.7 1.75 1.8 1.85 1.9 1.95 2 2.05
·104
0.22
0.24
0.26
0.28
0.3
0.32
NSDS,Torque2
1.5 1.55 1.6 1.65 1.7 1.75 1.8 1.85 1.9 1.95 2 2.05
·104
0.22
0.24
0.26
0.28
0.3
0.32
NSDS,Torque1
1.5 1.55 1.6 1.65 1.7 1.75 1.8 1.85 1.9 1.95 2 2.05
·104
0.18
0.2
0.22
0.24
0.26
Revolutions completed [rev]
NSDS,Accelerom
ter
Figure 6.3: Investigation of NSDS health parameter from the original test plan.
30

KTH Royal Institute of Technology - 2014
1.5 1.55 1.6 1.65 1.7 1.75 1.8 1.85 1.9 1.95 2 2.05
·104
2.2
2.4
2.6
2.8
3
FRMS,Torque2
1.5 1.55 1.6 1.65 1.7 1.75 1.8 1.85 1.9 1.95 2 2.05
·104
2
2.2
2.4
2.6
2.8
FRMS,Torque1
1.5 1.55 1.6 1.65 1.7 1.75 1.8 1.85 1.9 1.95 2 2.05
·104
9
10
11
12
13
Revolutions completed [rev]
FRMS,Accelerom
ter
Figure 6.4: Investigation of FRMS health parameter from original test plan.
31

Chapter 6 - Results
6.3 Revised test plan
Five tests were done according to the revised test plan and they are denoted as test 7 to 11.In four out of these five (test 8-11), the gears failed because the 2nd stage sun gear wore downon gear 2 as seen in Figure 6.5. In test 11 a fractured sun tooth was also jammed between thesun and planet. Test 7 stopped due to a 2nd stage planet bearing failure on gear 1. The failuremodes for each test can be found in Table 6.2 as well. The total life-span for each gear variedfrom approximately 105,000 revolutions (test 10) to 145,000 revolutions (test 7).
Figure 6.5: 2nd stage sun gear worn down in test 8.
Table 6.2: Failure modes in tests 7-11, determined by visual inspection of the gears.
Test Gear Stage Failure mode
7 1 2nd Planet bearing failure8-10 2 2nd Sun worn down11 2 2nd Sun worn down, teeth fractured and jammed in sun-planet mesh
In Figure 6.6 the NSDS health parameter is plotted based on the torque and the accelerometersignals collected throughout the gears’ life-span. It can be observed that the NSDS for torque 1 and2 increased continuously in the initial 20,000 revolutions in test 8-11 and then remained relativelyconstant until the gear failed, except in test 11 where a jump could be seen at approximately100,000 revolutions. In test 7 the NSDS for torque 1 and 2 had a different evolution where it grewless in the beginning and remained lower in value compared to the other tests. At approximately135,000 revolutions it jumped as in test 11.
The results of the FRMS health parameter is shown in Figure 6.7. One can see that theevolution of the FRMS over the gears life-span varied between the different tests. In test 8 theFRMS calculated from the torque peaked after approximately 60,000 revolutions and almostreturned to its initial value when the gear failed. In test 11 it remained relatively constant up to90,000 revolutions where it started to rise rapidly, and after 100,000 revolutions a jump could beobserved before it declined until the gears failed at 110,000 revolutions. One can see that theFRMS calculated from the acceleration signal differed significantly in every test but 7 and 11.
32

KTH Royal Institute of Technology - 2014
0 0.2 0.4 0.6 0.8 1 1.2 1.4
·105
0.1
0.2
0.3
0.4
0.5
0.6
NSDS,Torque2
0 0.2 0.4 0.6 0.8 1 1.2 1.4
·105
0.1
0.2
0.3
0.4
0.5
0.6
NSDS,Torque1
Test 7 Test 8 Test 9 Test 10 Test 11
0 0.2 0.4 0.6 0.8 1 1.2 1.4
·105
0
0.2
0.4
0.6
Revolutions completed [rev]
NSDS,Accelerom
eter
Figure 6.6: NSDS health parameter from the revised test plan.
33

Chapter 6 - Results
0 0.2 0.4 0.6 0.8 1 1.2 1.4
·105
0.5
1
1.5
2
2.5
FRMS,Torque2
0 0.2 0.4 0.6 0.8 1 1.2 1.4
·105
0.5
1
1.5
2
2.5FRMS,Torque1
Test 7 Test 8 Test 9 Test 10 Test 11
0 0.2 0.4 0.6 0.8 1 1.2 1.4
·105
0
5
10
Revolutions completed [rev]
FRMS,Accelerom
eter
Figure 6.7: FRMS health parameter from the revised test plan.
34
KTH Royal Institute of Technology - 2014
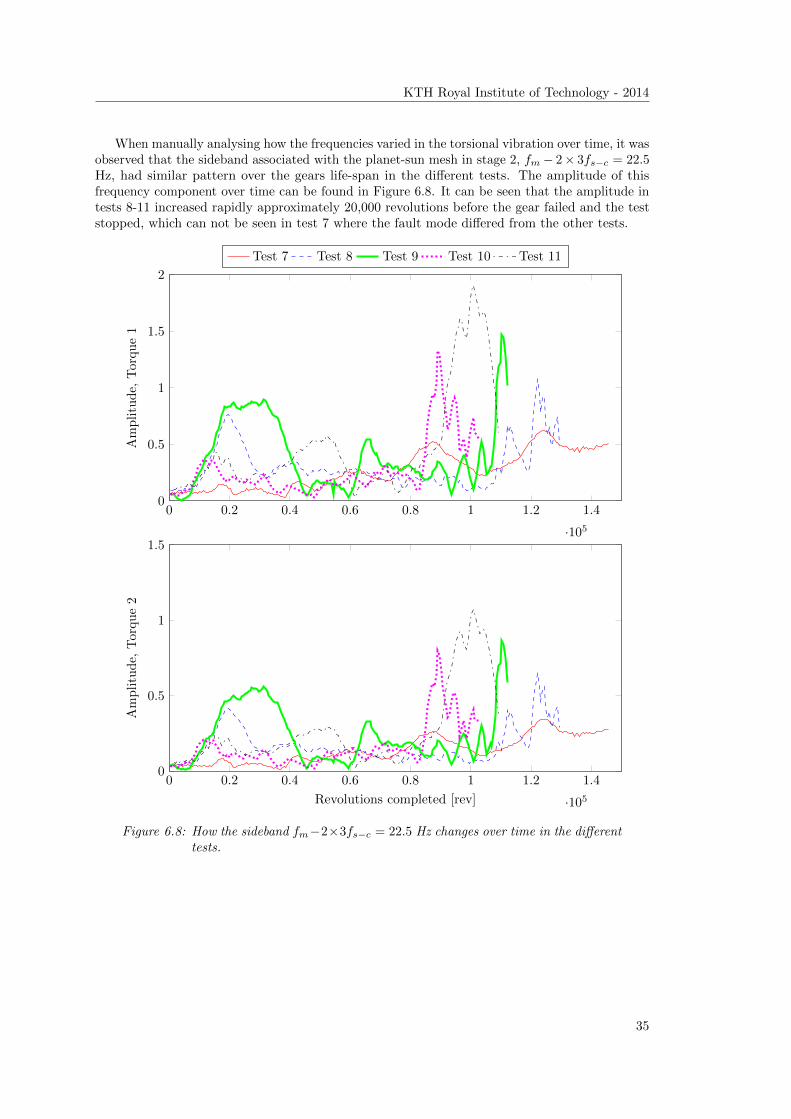
When manually analysing how the frequencies varied in the torsional vibration over time, it wasobserved that the sideband associated with the planet-sun mesh in stage 2, fm − 2× 3fs−c = 22.5Hz, had similar pattern over the gears life-span in the different tests. The amplitude of thisfrequency component over time can be found in Figure 6.8. It can be seen that the amplitude intests 8-11 increased rapidly approximately 20,000 revolutions before the gear failed and the teststopped, which can not be seen in test 7 where the fault mode differed from the other tests.
0 0.2 0.4 0.6 0.8 1 1.2 1.4
·105
0
0.5
1
1.5
2
Amplitude,
Torque1
Test 7 Test 8 Test 9 Test 10 Test 11
0 0.2 0.4 0.6 0.8 1 1.2 1.4
·105
0
0.5
1
1.5
Revolutions completed [rev]
Amplitude,
Torque2
Figure 6.8: How the sideband fm−2×3fs−c = 22.5 Hz changes over time in the differenttests.
35


Chapter 7
Discussion
This chapter discusses the test results presented and problems that arose, some improvements ofthe rig will be suggested. It ends by discussing the possibilities to incorporate fault detection inan actual tool and recommendations for future work.
7.1 Original test plan
It can be seen in Figure 6.3 that the small adjustments to the rig necessary to be able to introducefaulty gear members caused the NSDS to take distinct jumps in comparison with the resultsshown in Figure 6.6. The same is true for the FRMS parameter, although the jumps were not asevident. In the tests conducted by Lei et al. [15] the relative variation in the health parametersvalues for a healthy gear is within ±6 % for the NSDS and within ±2 % for the FRMS. This canbe compared to the relative difference in our results where the NSDS and FRMS differed up to±14 % and ±13 %, respectively. Based on the results from the original test plan it was consideredthat the difference in the NSDS and FRMS, before and after disassembling the rig or gear, couldnot be exclusively linked to the insertion of a faulty gear member. The fluctuations that could beobserved just by small variations in the test set-up was considered too large for us to be confidentenough to draw any conclusions from the tests and therefore we decided to revise the test plan.
7.2 Revised test plan
Torque: In Figure 6.6 the NSDS over time for torque 1 and torque 2 in test 7 distinguishes itselffrom the other four tests. This may not be surprising since test 7 had a unique fault mode, andthe 2nd stage sun gear in gear 2 was not nearly as worn down as in test 8-11. The large jump intest 7 after approximately 135,000 revolutions might indicate when the needle bearing actuallyshattered and small parts of the needles spread in the gear. After the jump the NSDS also seemto fluctuate more than before. Tests 8-11 all had similar faults and the NSDS does show a similarlevel and pattern for all of them. However, there is no distinct behaviour over time consideredto be an indicator that the gears have been damaged or are about to fail. They all have someirregularities towards the end, but by that time the gears were surely already worn out. In test11, a distinct jump in the NSDS can be seen after approximately 97,000 and 103,000 revolutions,this may have been caused by teeth fracturing on the 2nd stage sun spreading metal chips inthe gear. The FRMS parameter in Figure 6.7 show similar signs as the NSDS regarding theseparation between test 7 and tests 8-11 although not as clearly. Tests 8-11 also have a largevariation compared to the NSDS results.
Acceleration: As the accelerometer was mounted on gear 1 and it was gear 2 that failed intests 8-11 , it may not be surprising that neither the NSDS or FRMS for the acceleration showany distinctive indication of faults. After an initial rise the NSDS remains relatively constant
37

Chapter 7 - Discussion
throughout the gears whole life-span in all tests. The FRMS however differs in all tests, both inpattern and level. In test 7 where it was gear 1 that failed, the FRMS seem to fluctuate more thelast 1,500 revolutions, similar to the NSDS. Besides this observation we have not been able toidentify any distinct behaviour that could indicate gear damage our failure.
Sideband: Analysing the averaged frequency spectra for tests 8-11, similar patterns could beobserved. The 2nd stage sun-carrier frequency multiplied by the number of planets and itsharmonics, increased in amplitude towards the end of the tests. The most notable increase inamplitude was observed for the 2nd harmonic, as seen in Figure 6.8. That these frequenciesincreased in amplitude is reasonable since it was the 2nd stage sun gear that broke down in thosefour tests. Observing the same frequencies for test 7 it was seen that they did not increase inthe same fashion, probably since the sun gear was not nearly as worn down. One should notehowever that the increase occurs approximately 20,000 revolutions before the gear fails and isprobably not an indicator of early faults as the 2nd stage sun is probably severely worn by thattime. Another point that needs to be stressed is that there is only one test where the 2nd stagesun gear was not the reason for failure, which is not enough to conclude that the harmonicsamplitude change indicate that the sun is about to fail.
7.3 Problems and possible improvements to test rig
The test rig used was originally designed for long term testing where two new planetary gearswere mounted and then run until one or both broke down. This kind of test does not require anydismounting of the gear during a test run, so there was no need in getting everything to alignexactly the same each and every test. The original test plan was aimed at first collecting referencedata of the healthy gear, then disassembling the gear and replacing a healthy gear member witha faulty one, then perform measurements on the new gear configuration. This required that thegear could be remounted and aligned exactly as before the disassembly.
As seen in Figure 4.3, the shaft connecting the bellows coupling with the planetary gear wasa converter from a smooth clamping surface, required for the bellows coupling, to splines fittingthe planetary gears 2nd stage carrier. For alignment purposes this converter had a guide witha roller bearing. The guide was mounted on the holder of the planetary gear with two screws.There was nothing but the screws aligning the guide radially with the gear, a design that allowedthe guide to be moved up or down slightly between each mounting. We suspected that with asmall misalignment, the gear was loaded differently every time the gear was remounted causingthe difference in the signals measured. In order to solve this problem a new spacer was madewith a design that fixed the guide radially. The original spacer was made of plastic, and the newof aluminium, which also helped too cool the gear more efficiently due to the aluminium havingbetter thermal conductivity.
During testing it was observed that the shaft connecting the two gears 1st stage suns oscillatedradially and axially. The axial movement actually caused the sun gear to come in contact withthe center of the 1st stage carrier, grinding a small pit up to 1 mm deep in some tests. Whetherthis affected the measurements is not known, but if the connecting shaft was locked axially andradially with a guide this would not be a potential source of error. This guide could be designedso it is mounted in both gear holders, thereby fixating the distance between them and makingsure they align accurately.
The back-to-back rig design required two identical gears to be connected. We believe thatthese affected each other and also the torque signal measured on the opposite side of theirindividual mounting position. As both gears needed to be identical they had common frequencycharacteristics, which means that they could potentially superpose certain frequencies, increasingor decreasing the amplitude. It may be more appropriate to use another kind of test rig whereonly one gear is required. Instead of generating torque with the help of torsional shafts one canuse an electrical brake to load the gear.
38

KTH Royal Institute of Technology - 2014
7.4 In-tool application
As mentioned in the introduction an in-tool fault detection application is a possible furtherextension of our work. Although no conclusions could be drawn of our tests some things areworth noting, for example the aforementioned fact that we were able to detect several of theexpected frequencies within the torque spectrum, which is positive as the tool already has atorque transducer used to measure the tightening torque. It would probably not be possible forthe fault detection application to collect measurements during a tightening sequence due to thelarge torque variation and the number of revolutions are too few. Instead the application wouldprobably require to be run in a service mode where the tool is run with a constant torque loadand speed, to ensure that the planetary gear completes a number of resets which can be used toperform a synchronous average.
To calculate a frequency spectrum of high enough quality, running at 60 rpm on the outputshaft of the gear, a sampling rate of 4 kHz is sufficient, as shown in our results. At that speedand using the same number of resets as we have done in our tests, the measurement sequencewould take 80 seconds. To calculate the SA three signals needs to be stored, torque, time andangle. If they are stored with 32 bit float precision it would require 3×32×4000×80
8 = 5, 760, 000bytes of free space. Once a health parameter is calculated all sampled data can be deleted andonly a 16 bit float is needed to store the health parameter.
7.5 Recommendations for future work
Many of the expected frequencies were identified in the torsional vibration spectrum and aninteresting pattern was observed in one of the sidebands for all gears with similar fault mode.Considering these results we recommend further investigation of fault detection by analysingthe torsional vibration. We suggest that the focus should be on constructing and performingnew tests where the relevant frequencies in the planetary gear are further analysed, trying toidentify patterns in the frequency spectra as damages develops in the gear. If patterns canbe identified a tailored health parameter can be developed that indicates variation in certainfrequency components.
We believe that the gear meshing frequencies will be less dampened and more easily identifiedin the frequency spectra if another test rig is used where shafts and couplings have less inertiacompared to the test rig we used. It would also be interesting to use the same kind of torquetransducer that is used in the actual tool. Further we would also recommend using a test rigrequiring only one single gear eliminating the possibility of torsional vibrations from a secondgear affecting the signal perceived by the transducer.
39


Chapter 8
Conclusions
Even though the test results did not meet the expectations, they still provide valuable knowledgefor future research. The following list states the conclusions drawn from this master’s thesis.
• Torque and acceleration frequency spectra contained the expected frequencies.
• The test-rig could not provide the precision required for the kind of testing that wasoriginally planned.
• That, in the case of these small planetary gears, no conclusion could be drawn from theselected health parameters, FRMS and NSDS, regarding the state of the planetary gear.
• The revised test plan showed indications that frequencies correlating with damaged partswere excited.
41


Chapter 9
Bibliography
[1] D. Jelaska, Gears and Gear Drives. Wiley-Blackwell, 2012.
[2] R. A. Collacott, Mechanical Fault Diagnosis and Condition Monitoring. Chapman andHall, 1977.
[3] P. D. Samuel and D. J. Pines, “Vibration separation methodology for planetary gear healthmonitoring,” in Proc. SPIE, Smart Structures and Materials 2000: Smart Structures andIntegrated Systems, vol. 3985, 2000, pp. 250–260.
[4] ISO 10825:1995, “Gears - wear and damage to gear teeth - terminology,” InternationalOrganization for Standardization, 1995.
[5] ANSI/AGMA 1010-E95, “Appearance of gear teeth - terminology of wear and failure,”American Gear Manufacturers Association, 2007.
[6] H. Boden, K. Ahlin, and U. Carlsson, Applied Signal Analysis. KTH Farkost & Flyg /MWL, 2010.
[7] H. Wallin, H. Boden, U. Carlsson, M. Abom, and R. Glav, Ljud och vibrationer. KTHFarkost & Flyg / MWL, 2001.
[8] H. Roder, “Amplitude, phase and frequency modulation,” Proceedings of the Institute ofradio engineers, vol. 19, no. 12, pp. 2145–2176, 1931.
[9] Y. Lei, J. Lin, M. J. Zuo, and Z. He, “Condition monitoring and fault diagnosis of planetarygearboxes: A review,” Measurement, vol. 48, pp. 292–305, 2014.
[10] P. D. Samuel and D. J. Pines, “A review of vibration-based techniques for helicoptertransmission diagnostics,” Journal of Sound and Vibration, vol. 282, no. 475-508, 2005.
[11] P. D. McFadden and J. D. Smith, “An explanation for the asymmetry of the modulationsidebands about the tooth mesh frequency in epicyclic gear vibration,” in Proceedings of theInstitution of Mechanical Engineers, Part C: Journal of Mechanical Engineering Science,1985, pp. 65–70.
[12] Z. Feng and M. J. Zuo, “Vibration signal models for fault diagnosis of planetary gearboxes,”Journal of Sound and Vibration, vol. 331, pp. 4919–4939, 2012.
[13] Z. Feng, “Fault diagnosis of planetary gearboxes via torsional vibration signal analysis,”Mechanical Systems and Signal Processing, vol. 36, pp. 401–421, 2012.
[14] R. Stewart, “Some useful analysis techniques for gearbox diagnostics,” Machine HealthMonitoring Group, Institute of Sound and Vibration Research, University of Southampton,Tech. Rep., July 1977.
43

Chapter 9 - Bibliography
[15] Y. Lei, D. Kong, J. Lin, and M. J. Zuo, “Fault detection of planetary gearboxes using newdiagnostic parameters,” Measurement Science and Technology, vol. 23, 2012.
[16] (2013, 16 December) Dewe-43 Technical reference manual. PDF. Dewesoft. [Online].Available: http://www.dewesoft.com/download?file=DEWE-43 User%20Manual V2.5.pdf
[17] (2013, 12 December) DEWESoft X1 User manual. PDF. Dewesoft. [Online]. Available:http://www.dewesoft.com/download?file=DEWESoftX1 Manual Beta.pdf
[18] (2011, June) Magtrol TM 300 series users manual. PDF. Magtrol. [Online]. Available:http://www.magtrol.com/manuals/tm300manual.pdf
[19] Master Catalogue 1983 Electronic Instruments. Bruel & Kjær, 1983.
[20] (2014, March) MATLAB R© MAT-File Format. PDF. The MathWorks Inc. [Online]. Available:http://www.mathworks.com/help/pdf doc/matlab/matfile format.pdf
44