Europe’s Favourite Airline - Ryanair · Europe’s Favourite Airline Proven, ... Highly Rated...
21
Transcript of Europe’s Favourite Airline - Ryanair · Europe’s Favourite Airline Proven, ... Highly Rated...

2
Europe ’s Favour i te A i r l ine
Proven, resilient business model
Europe’s Lowest Fare/Lowest Cost Carrier
No. 1, Traffic – 119m (+12%)
No. 1, Cover – 85 Bases
No. 1, Service – Low Fares/On-time/Fewest Canx
– “Always Getting Better” Program
Fwd Bookings & Traffic Rising (119m)
293 a/c order = grow to 200m p.a. by FY24
Industry leading cash generation & liquidity
Unblemished 32 year safety record
Strong BBB+ (stable) rating S&P and Fitch
3
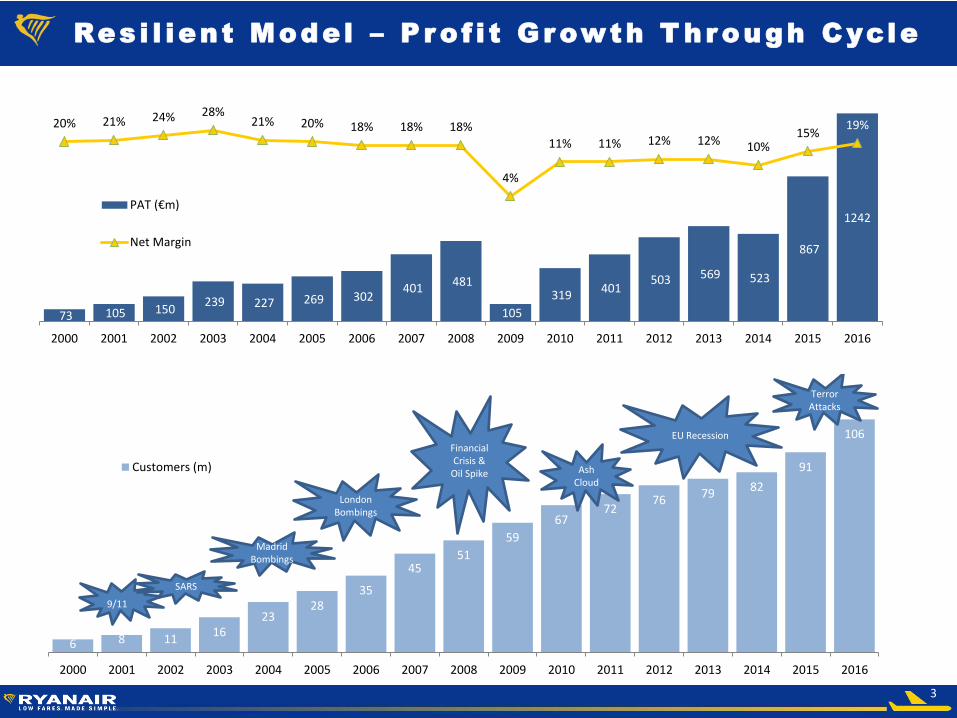
Res i l ient Model – P ro f i t Growth T hrough Cycle
6 8 11 16
23 28
35
45 51
59
67 72
76 79 82
91
106
2000 2001 2002 2003 2004 2005 2006 2007 2008 2009 2010 2011 2012 2013 2014 2015 2016
Customers (m)
9/11
SARS
Madrid Bombings
London Bombings
Financial Crisis &
Oil Spike Ash Cloud
EU Recession
Terror Attacks
73 105 150 239 227 269 302
401 481
105
319 401
503 569 523
867
1242
20% 21% 24% 28% 21% 20% 18% 18% 18%
4%
11% 11% 12% 12% 10% 15%
19%
2000 2001 2002 2003 2004 2005 2006 2007 2008 2009 2010 2011 2012 2013 2014 2015 2016
PAT (€m)
Net Margin
4
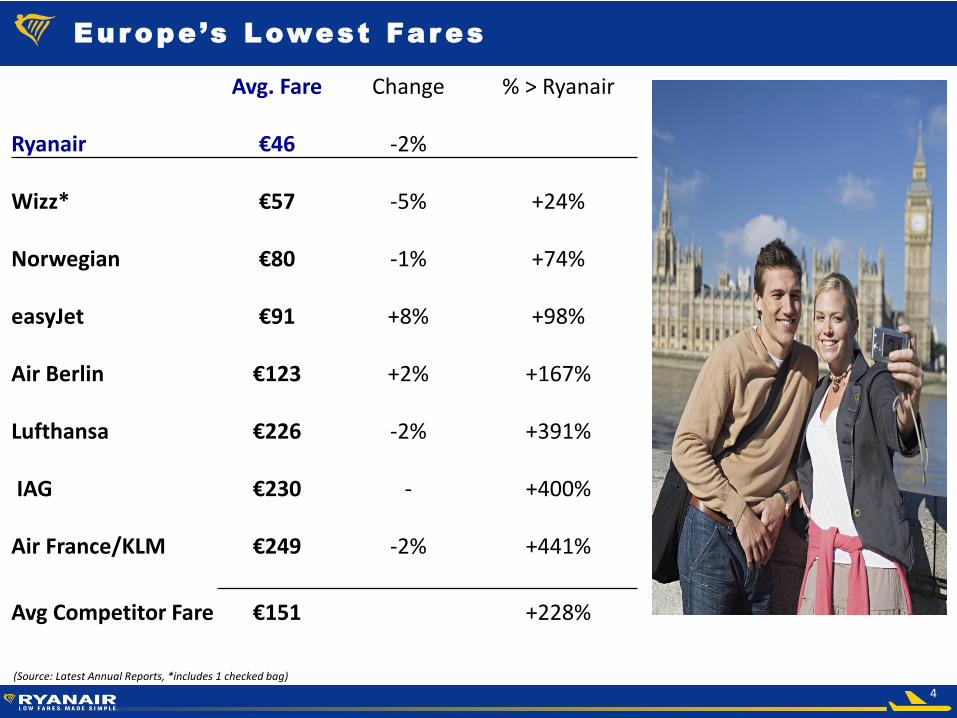
Europe ’s Lowest Fares
(Source: Latest Annual Reports, *includes 1 checked bag)
Avg. Fare Change % > Ryanair Ryanair €46 -2% Wizz* €57 -5% +24% Norwegian €80 -1% +74% easyJet €91 +8% +98% Air Berlin €123 +2% +167% Lufthansa €226 -2% +391% IAG €230 - +400%
Air France/KLM €249 -2% +441%
Avg Competitor Fare €151 +228%

5
Europe ’s Lowest Costs
(Source: Latest Annual Reports)
(€ per pax ex-fuel) RYA WIZ EZJ NOR AB1 LUV
Staff 5 5 10 15 19 48 Airport & Hand. 8 12 22 19 28 9
Route Charges 6 6 6 8 9 0 Own’ship & maint. 6 14 9 25 31 18
S & M other 3 3 8 6 29 17
Total (PY) 28 (29) 40 (39) 55 (51) 73 (62) 116 (107) 92 (74)
%> Ryanair +43% +96% +161% +314% +230%

6
85 bases
200+ airports (105 Prim)
33 countries
1,800+ routes
119m customers
371 x B737 fleet
293 x B737s on order
Europe ’s No. 1 Coverage

7
Europe ’s No. 1 Mar ket Share (15%)
*(Note: CapStats intra Eur Departing capacity)
Country (Cap m)* No. 1 No. 2 No. 3 Share
UK (134) easyJet BA 18%
Germany (125) Luft Air Berlin 7%
Spain (122) Vueling Iberia 18%
CEE (93) Wizz Aegean 15%
Italy (91) Alitalia Easyjet 27%
Greece (27) Aegean easyJet 16%
Portugal (25) TAP easyJet 19%
Poland (19) LOT Wizz 29%
Ireland (18) Aer Lingus BA 50%
Belgium (17) Brussels Jetairfly 29%

8
A lway s Get t i ng B e t t e r (AGB ) r a i s es g r ow t h t o 200m
p .a .
(Source: Annual Reports, company forecasts)
C’mers (m) 15/16
69
79 79
88
106
119
130
143
152
162
175
189
200
65
85
105
125
145
165
185
FY17 FY18 FY19 FY20 FY21 FY22 FY23 FY24
200

9
Dec 15 Dec 16
Traffic (m) 24.9 28.8 +16%
Load Factor 93% 95% +2%
Avg. fare (incl. bag) €40 €33 -17%
Revenue (€m) 1,330 1,345 +1%
Cost Per Pax €48 €43 -12%
PAT (€m) 103 95 -8%
Net Margin 8% 7% -1ppt
EPS (€ cent) 7.73 7.60 -2%
Q3 Resul ts

10
(buy-back.
Q3 Balance Sheet (BBB+ rated)
(i)
Mar 16 (€m) Dec 16 (€m)
Assets (incl. a/c) 6,883 7,742
Cash 4,335 3,165
Total 11,218 10,907
Liabilities 3,598 2,305
Debt 4,023 3,741
S/H funds 3,597 4,861
Total 11,218 10,907
11
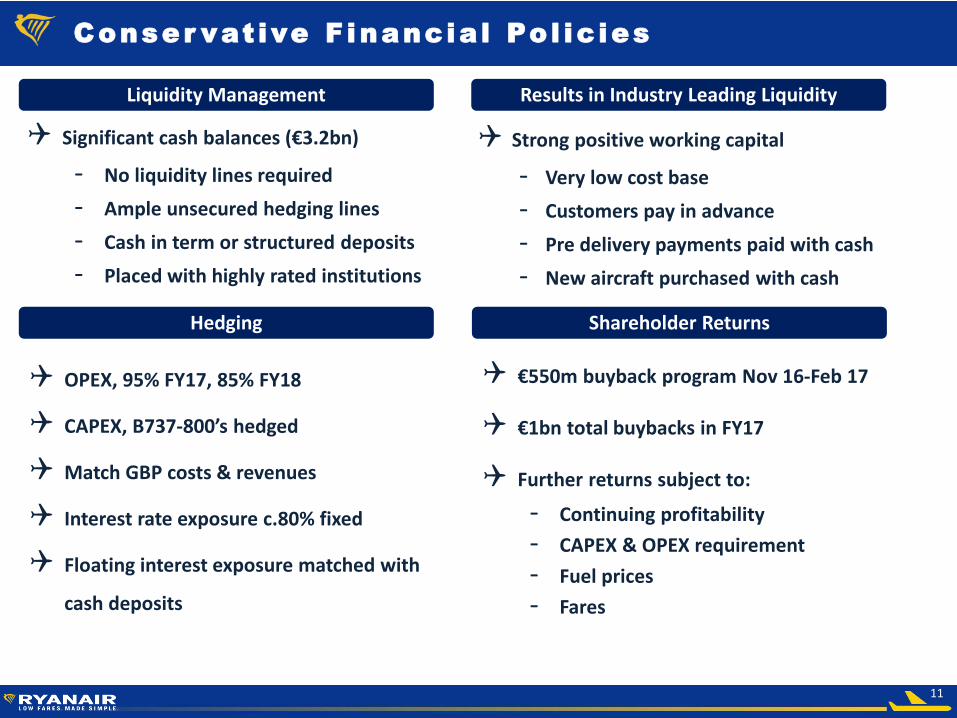
Conser vat ive F inancia l Po l ic ies
Liquidity Management Results in Industry Leading Liquidity
Significant cash balances (€3.2bn)
- No liquidity lines required
- Ample unsecured hedging lines
- Cash in term or structured deposits
- Placed with highly rated institutions
Strong positive working capital
- Very low cost base
- Customers pay in advance
- Pre delivery payments paid with cash
- New aircraft purchased with cash
OPEX, 95% FY17, 85% FY18
CAPEX, B737-800’s hedged
Match GBP costs & revenues
Interest rate exposure c.80% fixed
Floating interest exposure matched with
cash deposits
Hedging Shareholder Returns
€550m buyback program Nov 16-Feb 17
€1bn total buybacks in FY17
Further returns subject to:
- Continuing profitability
- CAPEX & OPEX requirement
- Fuel prices
- Fares

12
Fue l Hedge Update
FY17 95% hedged @ $623 per metric tonne
FY18 87% hedged @ $493 per metric tonne
Lower fuel passed on in lower fares
FY15 FY16 FY17 FY18
Q1 $945 $934 $659 $508 (90%)
Q2 $942 $935 $652 $494 (91%)
Q3 $960 $876 $603 $476 (90%)
Q4 $959 $828 $563 (95%) $490 (75%)
FY $950 $898 $623 $493 (87%)

13
H igh l y Rated A i r l ine
BBB+ stable corporate rating from S&P & Fitch
– Strong investment grade
– Stable outlook
– “A-” anchor (S&P), notched due to possible CAPEX & shareholder returns
– Industry leading liquidity, cost base & cash generation
– Existing eurobonds included in ECB Corporate Sector Purchase Programme
– BBB+ (stable) note rating expected
Eurobond market offers attractive low-rate term funding
Access to wide range of financing options

14
Secured Debt Coverage
131 unencumbered aircraft (36% of fleet)
Average age of fleet 6 years
€6.8bn
€3.2bn
€2.0bn
€0.9bn
Total Assets (Book Value) Secured Debt
Other Assets
Secured Debt
Cash
Book Value of Fleet
€10.9bn
€2.0bn

15
73
7-8
00
Ord
er
MA
X O
rde
r
Increased g rowth to FY24
Net Fleet additions
Y.E. Fleet C’mers
p.a.
Controlled Growth
Ann Cum
FY15 308 91m +11% +11%
FY16 341 106m +18% +30%
FY17 +42 383 119m +12% +46%
FY18 +44 427 130m +9% +59%
FY19 +21 448 143m +10% +75%
FY20 +33 481 152m +6% +86%
FY21 +35 516 162m +7% +98%
FY22 +24 540 175m +8% +114%
FY23 +35 575 189m +8% +131%
FY24 +10 585 200m +6% +144%
16
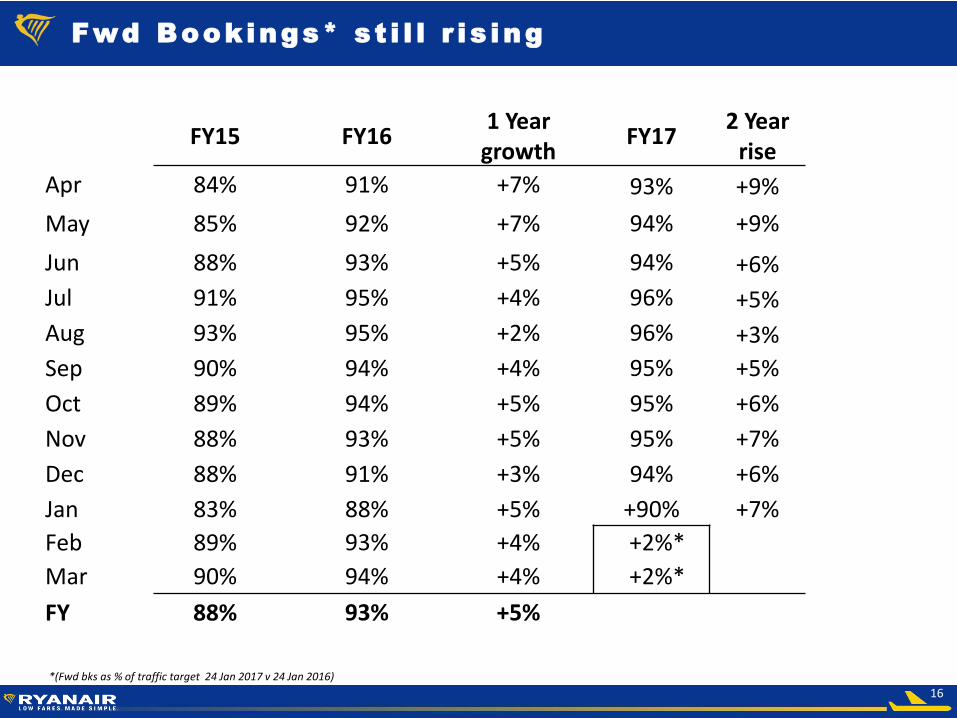
Fwd Bookings* s t i l l r i s ing
FY15 FY16 1 Year
growth FY17
2 Year rise
Apr 84% 91% +7% 93% +9%
May 85% 92% +7% 94% +9%
Jun 88% 93% +5% 94% +6%
Jul 91% 95% +4% 96% +5%
Aug 93% 95% +2% 96% +3%
Sep 90% 94% +4% 95% +5%
Oct 89% 94% +5% 95% +6%
Nov 88% 93% +5% 95% +7%
Dec 88% 91% +3% 94% +6%
Jan 83% 88% +5% +90% +7%
Feb 89% 93% +4% +2%*
Mar 90% 94% +4% +2%*
FY 88% 93% +5%
*(Fwd bks as % of traffic target 24 Jan 2017 v 24 Jan 2016)

17
Cur rent Developments
Forward bookings rise, on lower fares & AGB (119m)
Weak GBP, increased capacity dampens pricing
Hard Brexit a negative – weaker GBP/lower UK growth
FY18 Fuel > 85% hedged @ approx. $49bbl
€550m share buyback over 90% completed
18m “MyRyanair” members, 20m by Mar 17
17m app users, 4.5 star rating on iOS & Android

18
FY17 Out look
Q4 fares: down as much as –15% (no Easter)
Fuel saving (c. €160m) – passed on in lower fares
Ex-fuel unit costs fall approx. 4%
Downside risks:
- Q4 fares (LF active/yield pass)
- External shocks/ATC strikes/capac. growth

19
Appendices
Appendices

20
3 year s o f A lways Gett ing Better (AGB)
Year 1 Year 2 Year 3
• New website • Ryanair Car Hire • MyRyanair
• Reduced fees • New native app • One Flick Purchase
• GDS & Corporates • Customer Charter • Simplified bags
• Business Plus • US website • Ryanair Rooms
• Free 2nd Bag • New interiors • New Leisure Plus
• Allocated seating • New uniforms • Ryanair Holidays

21
Discla imer
IMPORTANT: The following applies to this presentation, the oral presentation of the information in this document by Ryanair DAC (the “Company”) or any person on behalf of the Company, and any question-and-answer session that follows the oral presentation. By attending the meeting where this presentation is made, by attending any question-and-answer session or by reading the presentation slides, you agree to be bound by the following limitations. This presentation is not for publication, release or distribution, into the United States or any other jurisdiction in which such dissemination would be unlawful. This presentation and the information contained herein are not an offer of securities for sale in the United States or any other jurisdiction. No action has been or will be taken by the Company in any jurisdiction that would, or is intended to, permit a public offering of securities in any jurisdiction where action for that purpose is required. In particular, no securities have been or will be registered under the U.S. Securities Act of 1933, as amended (the “Securities Act”) or with any securities regulatory authority of any state or other jurisdiction of the United States and securities may not be offered, sold or delivered within the United States except pursuant to an exemption from, or in a transaction not subject to, the registration requirements of the Securities Act and applicable state securities laws and may only be sold outside the United States in reliance on Regulation S under the Securities Act and otherwise in compliance with all applicable laws and regulations in each jurisdiction in which any such offer, sale or delivery of securities is made. The Company does not intend to register or to conduct a public offering of any securities in any jurisdiction. This presentation and its contents may not be viewed by persons within the United States (within the meaning of Regulation S under the Securities Act). This presentation may not be provided to any person in a member state of the European Economic Area (“EEA”) which has implemented the Prospectus Directive (each, a “relevant member state”) (except for the United Kingdom), who is not a “qualified investor” (as that term is defined in Article 2(l)(e) of the Prospectus Directive). This presentation must not be acted on or relied on in any member state of the EEA by persons who are not qualified investors. In any member state of the EEA, any investment or investment activity to which this presentation relates is available only to qualified investors to whom it may lawfully be communicated (all such persons together, “relevant persons”). Any investment activity to which this presentation relates is available only to and will be engaged in only with, relevant persons. This presentation does not constitute or form part of, and should not be construed as, an offer or invitation to sell securities of the Company, or the solicitation of an offer to subscribe for or purchase securities of the Company, and nothing contained herein shall form the basis of or be relied on in connection with any contract or commitment whatsoever. Any decision to purchase any securities of the Company should be made solely on the basis of the conditions of the securities and the information contained in the offering circular, information statement or equivalent disclosure document prepared in connection with the offering of such securities. Prospective investors are required to make their own independent investigations and appraisals of the business and financial condition of the Company and the nature of any securities before taking any investment decision with respect to securities of the Company. By accessing this presentation the recipient will be deemed to represent that they possess, sufficient investment expertise to understand the risks involved in any purchase or sale of any financial instrument or any other information contained herein. The information in this presentation has not been independently verified. No representation or warranty, express or implied, is made as to the accuracy, completeness or fairness of the presentation and the information contained herein. None of BNP Paribas, Citigroup Global Markets Limited, Crédit Agricole Corporate and Investment Bank, the Company, or any other person accepts any liability for any loss howsoever arising, directly or indirectly, from this presentation or its contents. This presentation contains certain forward-looking statements as defined under U.S. legislation. By their nature, such statements involve uncertainty; as a consequence, actual results and developments may differ from those expressed in or implied by such statements depending on a variety of factors which could cause actual results and developments to differ materially from those express or implied by the forward-looking statements including those identified in this presentation and other factors discussed in the Company's Annual Report on Form 20-F filed with the U.S. Securities and Exchange Commission. It is not reasonably possible to itemise all of the many factors and specific events that could affect the outlook and results of an airline operating in the European economy. Among the factors that are subject to change and could significantly impact the Company's expected results are the airline pricing environment, fuel costs, “Brexit”, competition from new and existing carriers, market prices for the replacement aircraft, costs associated with environmental, safety and security measures, actions of the Irish, U.K., European Union (“EU”) and other governments and their respective regulatory agencies, fluctuations in currency exchange rates and interest rates, airport access and charges, labour relations, the economic environment of the airline industry, the general economic environment in Ireland, the UK and Continental Europe, the general willingness of passengers to travel and other economics, social and political factors and flight interruptions caused by volcanic ash emissions or other atmospheric disruptions. These and other factors could adversely affect the outcome and financial effects of events or developments referred to in this presentation on the Ryanair Group. Forward looking statements contained in this presentation based on trends or activities should not be taken as a representation that such trends or activities will continue in the future. Except as may be required by the rules of any applicable regulatory body or by law, the Company disclaims any obligation or undertaking to release publicly any updates or revisions to any forward statements contained herein.