RYANAIR REPORTS FULL YEAR NET PROFIT OF … · Ryanair, Europe’s biggest low fares airline today...
19
1 RYANAIR REPORTS FULL YEAR NET PROFIT OF €523M TRAFFIC GROWS 3% TO 81.7M - LOAD FACTOR UP 1% TO 83% Ryanair, Europe’s biggest low fares airline today (May 19) announced full year net profit of €523m, slightly ahead of previous guidance. Traffic grew 3% to 81.7m passengers. Revenue per passenger was flat, as strong ancillary revenue growth offset a 4% fall in average fares. Excluding fuel, sector length adjusted unit costs fell by 3%. Full Year (IFRS) Mar 31, 2013 Mar 31, 2014 % Change Passengers(m) 79.3m 81.7m +3% Revenue(m) €4,884m €5,037m +3% Profit after Tax €569m €523m -8% Basic EPS(€ cent) 39.45 36.96 -6% “Ryanair’s, Michael O’Leary, said: The highlights of the past financial year include:- Customer experience improving rapidly. New website launched with “fare finder” facility. 121 new routes. 8 new bases – Athens, Thessaloniki, Brussels, Lisbon, Rome (FCO), Catania, Lamezia & Palermo. 180 new aircraft ordered, delivery 2014 to 2018. Fares launched on GDS (Galileo & Worldspan) and Google flight search. Net profit of €523m despite a 4% fall in avg fares. €482m share buyback completed. While disappointing that profits fell 8% to €523m due mainly to a 4% decline in fares, weaker sterling, and higher fuel costs, we reacted quickly to this weaker environment last September by lowering fares and improving our customer experience which caused H2 traffic to grow 4% as load factors rose 1%. Ancillary revenues grew 17%, much faster than traffic growth, and now accounts for 25% of total revenues. New Routes and Bases Forward bookings for Summer 14 are significantly ahead of last year, since we began offering lower fares and released our seasonal schedules earlier, and this should continue to deliver 2% higher load factors, and help us manage fares closer to departure as we have less capacity to sell. We recently opened 4 new bases at Athens, Brussels, Lisbon and Rome. These are performing ahead of expectation as customers switch from high fare carriers to Ryanair’s lower fares and industry leading customer service. We announced 3 new bases for winter 2014 in Cologne, Gdansk, and Warsaw. We released our winter 2014 schedule 3 months earlier than last year, offering our customers lower fares much earlier than our competitors, while we focus on building frequency and
Transcript of RYANAIR REPORTS FULL YEAR NET PROFIT OF … · Ryanair, Europe’s biggest low fares airline today...

1
RYANAIR REPORTS FULL YEAR NET PROFIT OF €523M TRAFFIC GROWS 3% TO 81.7M - LOAD FACTOR UP 1% TO 83%
Ryanair, Europe’s biggest low fares airline today (May 19) announced full year net profit of €523m, slightly ahead of previous guidance. Traffic grew 3% to 81.7m passengers. Revenue per passenger was flat, as strong ancillary revenue growth offset a 4% fall in average fares. Excluding fuel, sector length adjusted unit costs fell by 3%.
Full Year (IFRS) Mar 31, 2013 Mar 31, 2014 % Change
Passengers(m) 79.3m 81.7m +3%
Revenue(m) €4,884m €5,037m +3%
Profit after Tax €569m €523m -8%
Basic EPS(€ cent) 39.45 36.96 -6%
“Ryanair’s, Michael O’Leary, said:
The highlights of the past financial year include:-
Customer experience improving rapidly.
New website launched with “fare finder” facility.
121 new routes.
8 new bases – Athens, Thessaloniki, Brussels, Lisbon, Rome (FCO), Catania, Lamezia & Palermo.
180 new aircraft ordered, delivery 2014 to 2018.
Fares launched on GDS (Galileo & Worldspan) and Google flight search.
Net profit of €523m despite a 4% fall in avg fares.
€482m share buyback completed. While disappointing that profits fell 8% to €523m due mainly to a 4% decline in fares, weaker sterling, and higher fuel costs, we reacted quickly to this weaker environment last September by lowering fares and improving our customer experience which caused H2 traffic to grow 4% as load factors rose 1%. Ancillary revenues grew 17%, much faster than traffic growth, and now accounts for 25% of total revenues.
New Routes and Bases Forward bookings for Summer 14 are significantly ahead of last year, since we began offering lower fares and released our seasonal schedules earlier, and this should continue to deliver 2% higher load factors, and help us manage fares closer to departure as we have less capacity to sell. We recently opened 4 new bases at Athens, Brussels, Lisbon and Rome. These are performing ahead of expectation as customers switch from high fare carriers to Ryanair’s lower fares and industry leading customer service. We announced 3 new bases for winter 2014 in Cologne, Gdansk, and Warsaw. We released our winter 2014 schedule 3 months earlier than last year, offering our customers lower fares much earlier than our competitors, while we focus on building frequency and

2
capacity on key business city pairs. We expect these new bases will provide significant growth opportunities as we start deliveries (Sept 2014) of our new Boeing 737-800 NG aircraft order. Customer Experience Improvement We have worked hard over the last 6 months to improve customer experience and enhance our industry leading service (lowest fares, most on-time flights, the youngest fleet). These initiatives include, (i) allocated seating (ii) a simpler, easier to use, website with a brilliant “fare finder” facility, (iii) free small 2nd carry-on bag, (iv) “quiet flights” (v) a 24 hour “grace period” to correct minor booking errors, (vi) reduced boarding card and airport bag fees, and (vii) a new service to cater for groups and corporate travellers. Our new family product will launch in June and will allow children (when travelling with their family) to receive discounts on allocated seats and bags, while families who travel frequently with Ryanair can qualify for discounts on future flights. In the autumn we will launch a business service in conjunction with our frequency build on key business routes which will include same day flight changes, bigger bag allowances, premium seat allocation, mobile boarding pass, and fast-track through security at many Ryanair airports. This service, together with our new GDS distribution strategy, will make Ryanair much more accessible and easier to use for business customers. Digital & Distribution Improvements Our new digital strategy began to roll out last November with a much easier to use website, cutting the booking process from 17 to 5 “clicks”. More recently we unveiled a new website with “fare finder” which enables customers to easily find our lowest fares, share these fares with their friends and book them quickly. The “My Ryanair” registration service has been welcomed by customers with over 2m already registered. We will continue to invest in web and digital improvements over the coming year, as we deliver an industry leading mobile app (tailored for smart phones and tablets) by mid-summer, and improve our digital marketing and CRM services for the benefit of all our customers. In April, we began extensive TV and outdoor advertising in major EU markets to promote our new website and recent customer experience improvements. These campaigns will continue through the year, as our marketing and advertising spend rises to approx. €35m (from just €10m last year), although this spend is still less than €0.50 per passenger. We have broadened our distribution by becoming the first low fares airline in Europe to partner with Google’s “Flight Search” function, which is now available in the UK, France, Germany, Italy, Holland, Ireland, Poland and Spain (and more countries follow shortly). This partnership enables consumers to easily access and book Ryanair’s lower fares every time they search on Google. In April we began distribution on Galileo and Worldspan GDS systems, which allows travel and corporate agents to see and book Ryanair’s low fares. We are in talks with other GDS‘s (to broaden our distribution base) and hope to add more before year end. Our new Groups and Corporate travel service launched in January and take up of these services is growing rapidly.
3
Fuel We are 90% hedged for FY15 at a cost of $960 per tonne (approx. $96 p.bl). This will generate net savings of approx. €70m compared to FY14. In light of recent oil price and US$ weakness we have hedged approx. 13% of our FY16 fuel (at approx. $94 per barrel), and have also hedged our dollar requirements which will deliver further savings of up to 4% per passenger, in Euro terms, in FY 2016. Balance Sheet Our balance sheet remains among the strongest in the industry and was a key factor in S&P and Fitch recently awarding BBB+ ratings to Ryanair, making us the highest rated airline in the world. During FY14 we completed €482m of share buybacks, well ahead of our original €400m target. We remain committed to returning a further €500m to shareholders in Q4 via a special dividend subject to AGM approval. This will bring the total returns to Ryanair shareholders since 2008 to over €2.5bn. Our business model remains strongly cash generative and year end cash amounted to €3.2bn (net cash of €158m), despite €482m in buybacks, debt repayments of €391m, and capex of €506m during the year. Outlook. We expect FY15 traffic to grow by 4% to over 84.6m as load factors increase 2% to 85% and we add some limited new route and capacity growth. Most of this growth will be skewed towards H2 as we reduce our winter grounding from 70 aircraft in FY14 to approx. 50 in FY15. While fares fell by 4% in FY14 we expect FY15 fares to rise by up to 2%. H1 fares will rise by up to 6% due in part to Easter, stable growth in Q2, and stronger forward bookings and load factors. However we remain very cautious about H2 guidance (especially following last winter’s weak price environment) where we are committed to 6% capacity growth which could cause H2 fares to fall by as much as 6% to 8%. Unit costs for FY15 will be flat. Fuel costs (which includes de-icing) will be €70m lower than last year as we are 90% hedged, but we expect de-icing costs to rise from last year’s unusually mild winter. Excluding fuel unit costs will rise by approx. 5% reflecting pay increases, primary airport charges, a €25m rise in advertising and marketing, and ownership cost increases due to summer lease ins and new aircraft deliveries from September onwards. In conclusion, we expect this combination of a strong H1, but a weaker H2 will generate a significant rise in after tax profits to a range of between €580m to €620m, although this guidance is heavily qualified by H2 yield outturn, over which we currently have zero visibility.
ENDS.
For further information Howard Millar Joe Carmody please contact: Ryanair Holdings plc Edelman www.ryanair.com Tel: 353-1-9451212 Tel: 353-1-6789333

4
Certain of the information included in this release is forward looking and is subject to important risks and uncertainties that could cause actual results to differ materially. It is not reasonably possible to itemise all of the many factors and specific events that could affect the outlook and results of an airline operating in the European economy. Among the factors that are subject to change and could significantly impact Ryanair’s expected results are the airline pricing environment, fuel costs, competition from new and existing carriers, market prices for the replacement aircraft, costs associated with environmental, safety and security measures, actions of the Irish, U.K., European Union (“EU”) and other governments and their respective regulatory agencies, weather related disruptions, fluctuations in currency exchange rates and interest rates, airport access and charges, labour relations, the economic environment of the airline industry, the general economic environment in Ireland, the UK and Continental Europe, the general willingness of passengers to travel and other economics, social and political factors.
Ryanair is Europe’s favourite low fares airline, operating more than 1,600 daily flights (over 500,000 per year) from 68 bases, across 1,600 low fare routes, connecting 186 destinations in 30 countries and operating a fleet of 300 new Boeing 737-800 aircraft. Ryanair has recently announced firm orders for a further 180 new Boeing aircraft, which will be delivered between 2014 and 2018. Ryanair currently has a team of more than 9,000 highly skilled professionals, will carry 84.6 million passengers this year and has an outstanding 30-year safety record.
5
Ryanair Holdings plc and Subsidiaries
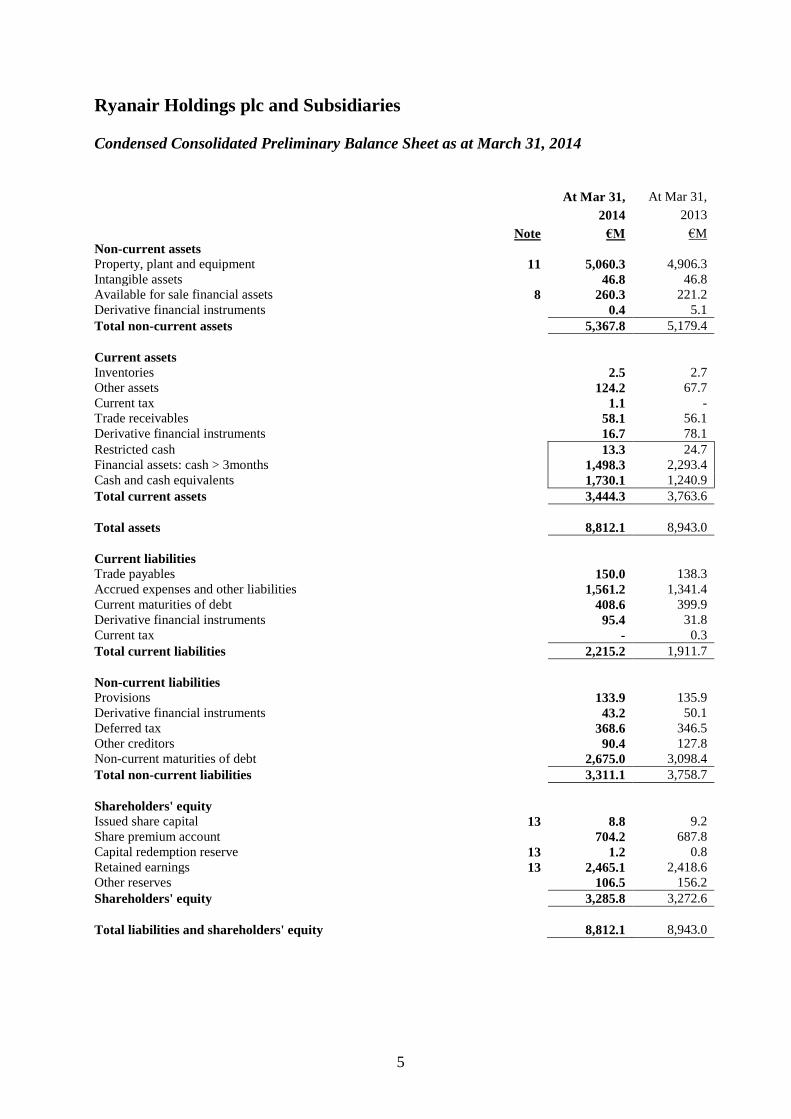
Condensed Consolidated Preliminary Balance Sheet as at March 31, 2014
At Mar 31, At Mar 31,
2014 2013
Note €M €M
Non-current assets
Property, plant and equipment 11 5,060.3 4,906.3
Intangible assets 46.8 46.8
Available for sale financial assets 8 260.3 221.2
Derivative financial instruments 0.4 5.1
Total non-current assets 5,367.8 5,179.4
Current assets
Inventories 2.5 2.7
Other assets 124.2 67.7
Current tax 1.1 -
Trade receivables 58.1 56.1
Derivative financial instruments 16.7 78.1
Restricted cash 13.3 24.7
Financial assets: cash > 3months 1,498.3 2,293.4
Cash and cash equivalents 1,730.1 1,240.9
Total current assets 3,444.3 3,763.6
Total assets 8,812.1 8,943.0
Current liabilities
Trade payables 150.0 138.3
Accrued expenses and other liabilities 1,561.2 1,341.4
Current maturities of debt 408.6 399.9
Derivative financial instruments 95.4 31.8
Current tax - 0.3
Total current liabilities 2,215.2 1,911.7
Non-current liabilities
Provisions 133.9 135.9
Derivative financial instruments 43.2 50.1
Deferred tax 368.6 346.5
Other creditors 90.4 127.8
Non-current maturities of debt 2,675.0 3,098.4
Total non-current liabilities 3,311.1 3,758.7
Shareholders' equity
Issued share capital 13 8.8 9.2
Share premium account 704.2 687.8
Capital redemption reserve 13 1.2 0.8
Retained earnings 13 2,465.1 2,418.6
Other reserves 106.5 156.2
Shareholders' equity 3,285.8 3,272.6
Total liabilities and shareholders' equity 8,812.1 8,943.0

6
Ryanair Holdings plc and Subsidiaries
Condensed Consolidated Preliminary Income Statement for the year ended
March 31, 2014
Year Year
Ended Ended
Mar 31, Mar 31,
2014 2013
Note €M €M
Operating revenues
Scheduled revenues 3,789.5 3,819.8
Ancillary revenues 1,247.2 1,064.2
Total operating revenues - continuing operations 5,036.7 4,884.0
Operating expenses
Fuel & oil 2,013.1 1,885.6
Airport & handling charges 617.2 611.6
Route charges 522.0 486.6
Staff costs 463.6 435.6
Depreciation 351.8 329.6
Marketing, distribution & other 192.8 197.9
Maintenance, materials & repairs 116.1 120.7
Aircraft rentals 101.5 98.2
Total operating expenses 4,378.1 4,165.8
Operating profit - continuing operations 658.6 718.2
Other income/(expenses)
Finance expense (83.2) (99.3)
Finance income 16.5 27.4
Foreign exchange (loss)/gain (0.5) 4.6
Total other expenses (67.2) (67.3)
Profit before tax 591.4 650.9
Tax expense on profit on ordinary activities 4 (68.6) (81.6)
Profit for the year – all attributable to equity holders of parent 522.8 569.3
Earnings per ordinary share (in € cent)
Basic 10 36.96 39.45
Diluted 10 36.86 39.33
Weighted average no. of ordinary shares (in Ms)
Basic 10 1,414.6 1,443.1
Diluted 10 1,418.2 1,447.4
7
Ryanair Holdings plc and Subsidiaries
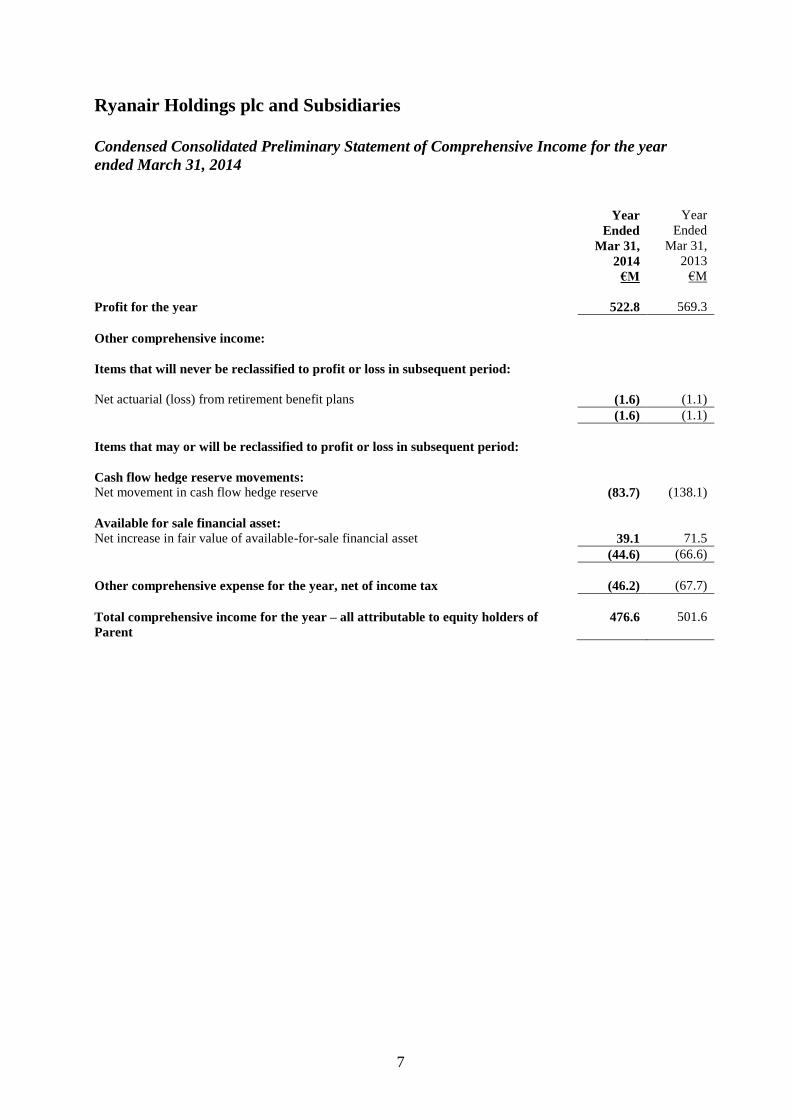
Condensed Consolidated Preliminary Statement of Comprehensive Income for the year
ended March 31, 2014
Year
Year
Ended Ended
Mar 31, Mar 31,
2014 2013
€M €M
Profit for the year 522.8 569.3
Other comprehensive income:
Items that will never be reclassified to profit or loss in subsequent period:
Net actuarial (loss) from retirement benefit plans (1.6) (1.1)
(1.6) (1.1)
Items that may or will be reclassified to profit or loss in subsequent period:
Cash flow hedge reserve movements:
Net movement in cash flow hedge reserve (83.7) (138.1)
Available for sale financial asset:
Net increase in fair value of available-for-sale financial asset 39.1 71.5
(44.6) (66.6)
Other comprehensive expense for the year, net of income tax (46.2) (67.7)
Total comprehensive income for the year – all attributable to equity holders of
Parent
476.6 501.6
8
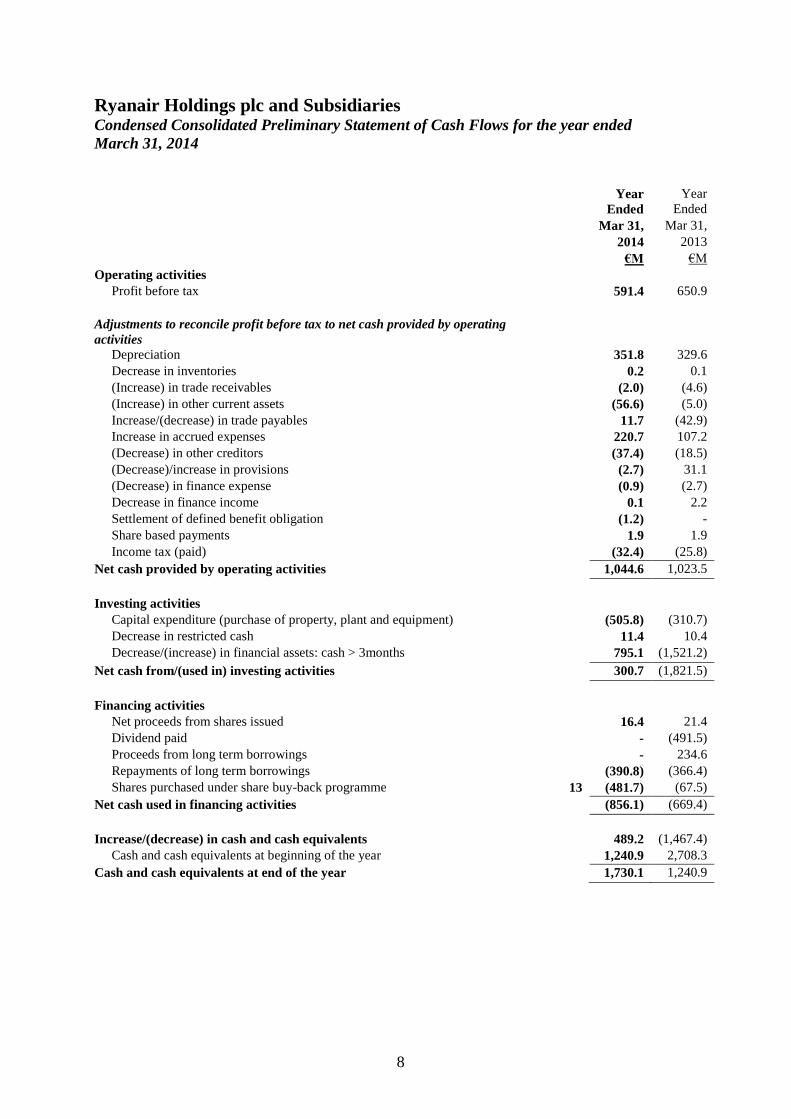
Ryanair Holdings plc and Subsidiaries Condensed Consolidated Preliminary Statement of Cash Flows for the year ended
March 31, 2014
Year
Year
Ended Ended
Mar 31, Mar 31,
2014 2013
€M €M
Operating activities
Profit before tax 591.4 650.9
Adjustments to reconcile profit before tax to net cash provided by operating
activities
Depreciation 351.8 329.6
Decrease in inventories 0.2 0.1
(Increase) in trade receivables (2.0) (4.6)
(Increase) in other current assets (56.6) (5.0)
Increase/(decrease) in trade payables 11.7 (42.9)
Increase in accrued expenses 220.7 107.2
(Decrease) in other creditors (37.4) (18.5)
(Decrease)/increase in provisions (2.7) 31.1
(Decrease) in finance expense (0.9) (2.7)
Decrease in finance income 0.1 2.2
Settlement of defined benefit obligation (1.2) -
Share based payments 1.9 1.9
Income tax (paid) (32.4) (25.8)
Net cash provided by operating activities 1,044.6 1,023.5
Investing activities
Capital expenditure (purchase of property, plant and equipment) (505.8) (310.7)
Decrease in restricted cash 11.4 10.4
Decrease/(increase) in financial assets: cash > 3months 795.1 (1,521.2)
Net cash from/(used in) investing activities 300.7 (1,821.5)
Financing activities
Net proceeds from shares issued 16.4 21.4
Dividend paid - (491.5)
Proceeds from long term borrowings - 234.6
Repayments of long term borrowings (390.8) (366.4)
Shares purchased under share buy-back programme 13 (481.7) (67.5)
Net cash used in financing activities (856.1) (669.4)
Increase/(decrease) in cash and cash equivalents 489.2 (1,467.4)
Cash and cash equivalents at beginning of the year 1,240.9 2,708.3
Cash and cash equivalents at end of the year 1,730.1 1,240.9
9
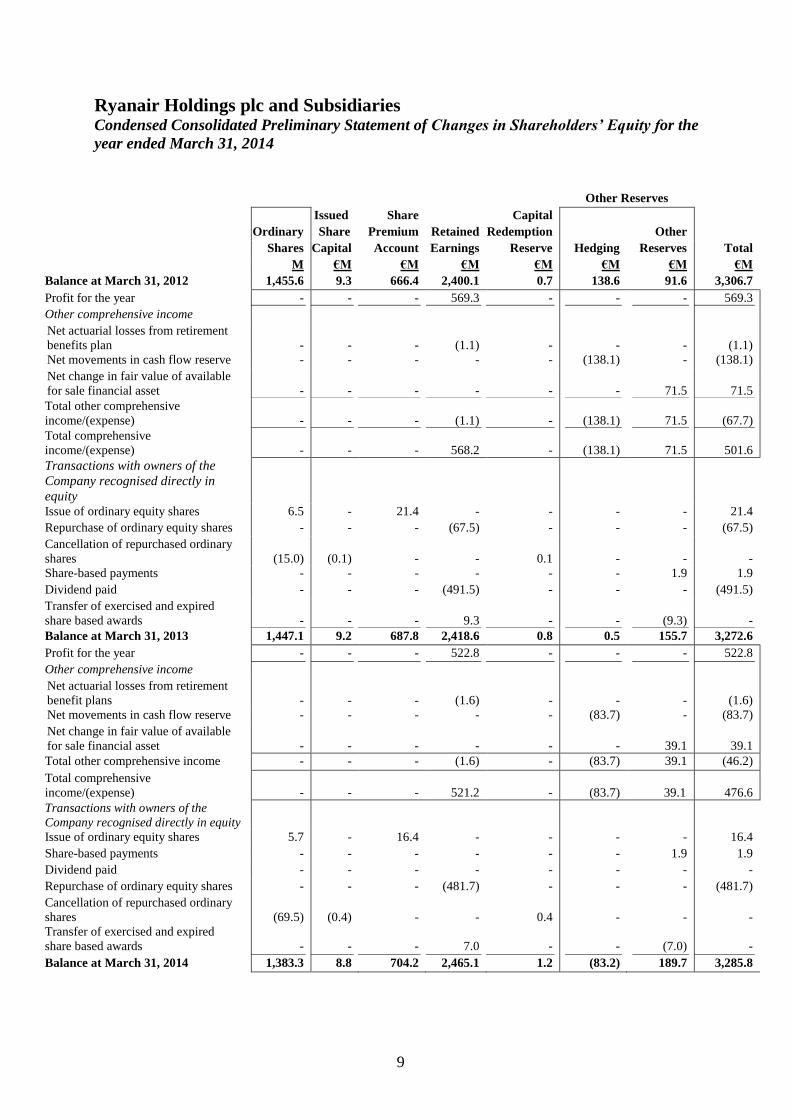
Ryanair Holdings plc and Subsidiaries Condensed Consolidated Preliminary Statement of Changes in Shareholders’ Equity for the
year ended March 31, 2014
Other Reserves
Issued Share Capital
Ordinary Share Premium Retained Redemption Other
Shares Capital Account Earnings Reserve Hedging Reserves Total
M €M €M €M €M €M €M €M
Balance at March 31, 2012 1,455.6 9.3 666.4 2,400.1 0.7 138.6 91.6 3,306.7
Profit for the year - - - 569.3 - - - 569.3
Other comprehensive income
Net actuarial losses from retirement
benefits plan
-
-
-
(1.1)
-
-
-
(1.1)
Net movements in cash flow reserve - - - - - (138.1) - (138.1)
Net change in fair value of available
for sale financial asset
-
-
-
-
-
-
71.5
71.5
Total other comprehensive
income/(expense)
-
-
-
(1.1)
-
(138.1)
71.5
(67.7)
Total comprehensive
income/(expense)
-
-
-
568.2
-
(138.1)
71.5
501.6
Transactions with owners of the
Company recognised directly in
equity
Issue of ordinary equity shares 6.5 - 21.4 - - - - 21.4
Repurchase of ordinary equity shares - - - (67.5) - - - (67.5)
Cancellation of repurchased ordinary
shares
(15.0)
(0.1)
-
-
0.1
-
-
-
Share-based payments - - - - - - 1.9 1.9
Dividend paid - - - (491.5) - - - (491.5)
Transfer of exercised and expired
share based awards
-
-
-
9.3
-
-
(9.3)
-
Balance at March 31, 2013 1,447.1 9.2 687.8 2,418.6 0.8 0.5 155.7 3,272.6
Profit for the year - - - 522.8 - - - 522.8
Other comprehensive income
Net actuarial losses from retirement
benefit plans
-
-
-
(1.6)
-
-
-
(1.6)
Net movements in cash flow reserve - - - - - (83.7) - (83.7)
Net change in fair value of available
for sale financial asset
-
-
-
-
-
-
39.1
39.1
Total other comprehensive income - - - (1.6) - (83.7) 39.1 (46.2)
Total comprehensive
income/(expense)
-
-
-
521.2
-
(83.7)
39.1
476.6
Transactions with owners of the
Company recognised directly in equity
Issue of ordinary equity shares 5.7 - 16.4 - - - - 16.4
Share-based payments - - - - - - 1.9 1.9
Dividend paid - - - - - - - -
Repurchase of ordinary equity shares - - - (481.7) - - - (481.7)
Cancellation of repurchased ordinary
shares
(69.5)
(0.4)
-
-
0.4
-
-
-
Transfer of exercised and expired
share based awards
-
-
-
7.0
-
-
(7.0)
-
Balance at March 31, 2014 1,383.3 8.8 704.2 2,465.1 1.2 (83.2) 189.7 3,285.8
10
Ryanair Holdings plc and Subsidiaries
Operating and Financial Overview
Summary year ended March 31, 2014
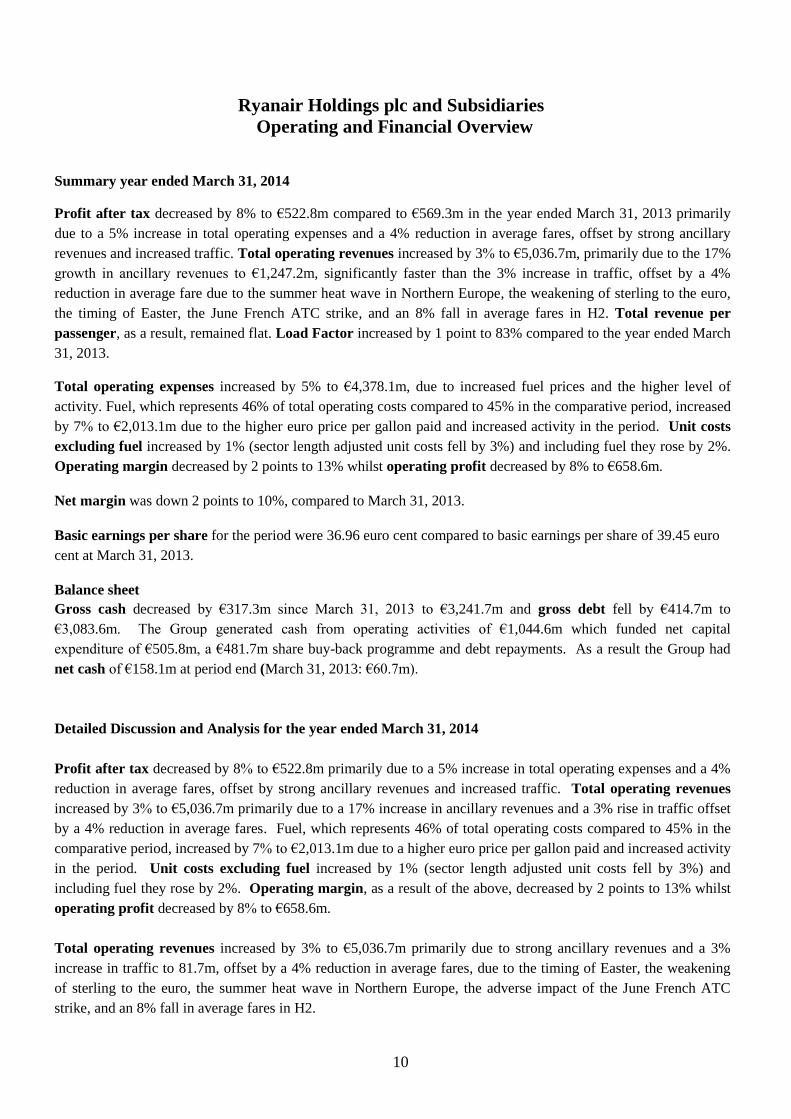
Profit after tax decreased by 8% to €522.8m compared to €569.3m in the year ended March 31, 2013 primarily
due to a 5% increase in total operating expenses and a 4% reduction in average fares, offset by strong ancillary
revenues and increased traffic. Total operating revenues increased by 3% to €5,036.7m, primarily due to the 17%
growth in ancillary revenues to €1,247.2m, significantly faster than the 3% increase in traffic, offset by a 4%
reduction in average fare due to the summer heat wave in Northern Europe, the weakening of sterling to the euro,
the timing of Easter, the June French ATC strike, and an 8% fall in average fares in H2. Total revenue per
passenger, as a result, remained flat. Load Factor increased by 1 point to 83% compared to the year ended March
31, 2013.
Total operating expenses increased by 5% to €4,378.1m, due to increased fuel prices and the higher level of
activity. Fuel, which represents 46% of total operating costs compared to 45% in the comparative period, increased
by 7% to €2,013.1m due to the higher euro price per gallon paid and increased activity in the period. Unit costs
excluding fuel increased by 1% (sector length adjusted unit costs fell by 3%) and including fuel they rose by 2%.
Operating margin decreased by 2 points to 13% whilst operating profit decreased by 8% to €658.6m.
Net margin was down 2 points to 10%, compared to March 31, 2013.
Basic earnings per share for the period were 36.96 euro cent compared to basic earnings per share of 39.45 euro
cent at March 31, 2013.
Balance sheet
Gross cash decreased by €317.3m since March 31, 2013 to €3,241.7m and gross debt fell by €414.7m to
€3,083.6m. The Group generated cash from operating activities of €1,044.6m which funded net capital
expenditure of €505.8m, a €481.7m share buy-back programme and debt repayments. As a result the Group had
net cash of €158.1m at period end (March 31, 2013: €60.7m).
Detailed Discussion and Analysis for the year ended March 31, 2014
Profit after tax decreased by 8% to €522.8m primarily due to a 5% increase in total operating expenses and a 4%
reduction in average fares, offset by strong ancillary revenues and increased traffic. Total operating revenues
increased by 3% to €5,036.7m primarily due to a 17% increase in ancillary revenues and a 3% rise in traffic offset
by a 4% reduction in average fares. Fuel, which represents 46% of total operating costs compared to 45% in the
comparative period, increased by 7% to €2,013.1m due to a higher euro price per gallon paid and increased activity
in the period. Unit costs excluding fuel increased by 1% (sector length adjusted unit costs fell by 3%) and
including fuel they rose by 2%. Operating margin, as a result of the above, decreased by 2 points to 13% whilst
operating profit decreased by 8% to €658.6m.
Total operating revenues increased by 3% to €5,036.7m primarily due to strong ancillary revenues and a 3%
increase in traffic to 81.7m, offset by a 4% reduction in average fares, due to the timing of Easter, the weakening
of sterling to the euro, the summer heat wave in Northern Europe, the adverse impact of the June French ATC
strike, and an 8% fall in average fares in H2.
11
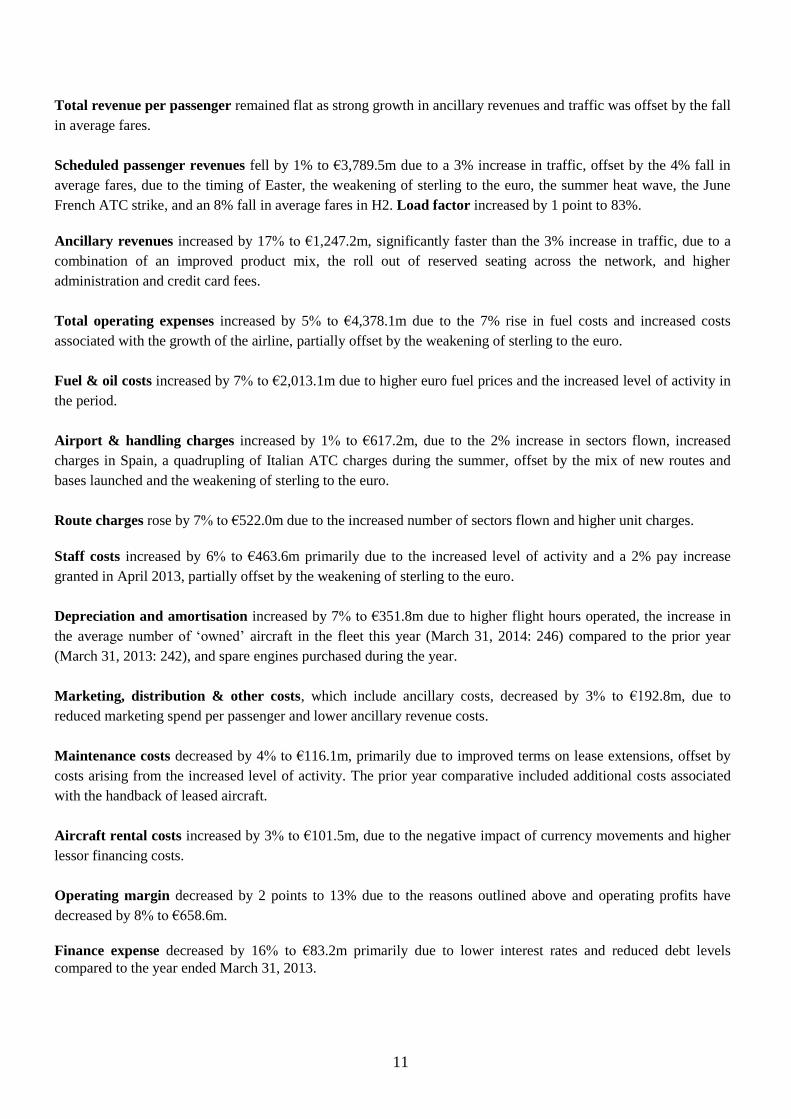
Total revenue per passenger remained flat as strong growth in ancillary revenues and traffic was offset by the fall
in average fares.
Scheduled passenger revenues fell by 1% to €3,789.5m due to a 3% increase in traffic, offset by the 4% fall in
average fares, due to the timing of Easter, the weakening of sterling to the euro, the summer heat wave, the June
French ATC strike, and an 8% fall in average fares in H2. Load factor increased by 1 point to 83%.
Ancillary revenues increased by 17% to €1,247.2m, significantly faster than the 3% increase in traffic, due to a
combination of an improved product mix, the roll out of reserved seating across the network, and higher
administration and credit card fees.
Total operating expenses increased by 5% to €4,378.1m due to the 7% rise in fuel costs and increased costs
associated with the growth of the airline, partially offset by the weakening of sterling to the euro.
Fuel & oil costs increased by 7% to €2,013.1m due to higher euro fuel prices and the increased level of activity in
the period.
Airport & handling charges increased by 1% to €617.2m, due to the 2% increase in sectors flown, increased
charges in Spain, a quadrupling of Italian ATC charges during the summer, offset by the mix of new routes and
bases launched and the weakening of sterling to the euro.
Route charges rose by 7% to €522.0m due to the increased number of sectors flown and higher unit charges.
Staff costs increased by 6% to €463.6m primarily due to the increased level of activity and a 2% pay increase
granted in April 2013, partially offset by the weakening of sterling to the euro.
Depreciation and amortisation increased by 7% to €351.8m due to higher flight hours operated, the increase in
the average number of ‘owned’ aircraft in the fleet this year (March 31, 2014: 246) compared to the prior year
(March 31, 2013: 242), and spare engines purchased during the year.
Marketing, distribution & other costs, which include ancillary costs, decreased by 3% to €192.8m, due to
reduced marketing spend per passenger and lower ancillary revenue costs.
Maintenance costs decreased by 4% to €116.1m, primarily due to improved terms on lease extensions, offset by
costs arising from the increased level of activity. The prior year comparative included additional costs associated
with the handback of leased aircraft.
Aircraft rental costs increased by 3% to €101.5m, due to the negative impact of currency movements and higher
lessor financing costs.
Operating margin decreased by 2 points to 13% due to the reasons outlined above and operating profits have
decreased by 8% to €658.6m.
Finance expense decreased by 16% to €83.2m primarily due to lower interest rates and reduced debt levels
compared to the year ended March 31, 2013.
12
Finance income decreased by 40% to €16.5m due to lower interest rates and gross cash balances, partially offset
by increased dividend income from Aer Lingus received in the year.
Balance sheet
Gross cash decreased by €317.3m since March 31, 2013 to €3,241.7m and gross debt fell by €414.7m to
€3,083.6m. The Group generated cash from operating activities of €1,044.6m which funded net capital
expenditure of €505.8m, a €481.7m share buy-back programme and debt repayments. As a result the Group had
net cash of €158.1m at period end (March 31, 2013: €60.7m).
Shareholders’ equity increased by €13.2m in the period to €3,285.8m primarily due the net profit after tax of
€522.8m, offset by a €481.7m share buy-back and the impact of IFRS accounting treatment for derivatives.

13
Ryanair Holdings plc Notes forming Part of the Condensed Consolidated
Preliminary Financial Statements
1. Basis of preparation and significant accounting policies
Ryanair Holdings plc (the “Company”) is a company domiciled in Ireland. The condensed consolidated
preliminary financial statements of the Company for the year ended March 31, 2014 comprise the Company
and its subsidiaries (together referred to as the “Group”).
These condensed consolidated preliminary financial statements (“the preliminary financial statements”), which
should be read in conjunction with our 2013 Annual Report for the year ended March 31, 2013, have been
prepared in accordance with International Accounting Standard No. 34 “Interim Financial Reporting” as
adopted by the EU (“IAS 34”). They do not include all of the information required for full annual financial
statements, and should be read in conjunction with the most recent published consolidated financial statements
of the Group. The consolidated financial statements of the Group as at and for the year ended March 31, 2013,
are available at www.ryanair.com.
The comparative figures included for the year ended March 31, 2013 do not constitute statutory financial
statements of the Group within the meaning of Regulation 40 of the European Communities (Companies,
Group Accounts) Regulations, 1992. The consolidated financial statements of the Group for the year ended
March 31, 2013, together with the independent auditor’s report thereon, have been filed with the Irish
Registrar of Companies following the Company’s Annual General Meeting and are also available on the
Company’s Website. The auditor’s report on those financial statements was unqualified.
The Audit Committee, upon delegation of authority by the Board of Directors, approved the preliminary
financial statements for the year ended March 31, 2014 on May 14, 2014.
Except as stated otherwise below, this year’s financial information has been prepared in accordance with the
accounting policies set out in the Group’s most recent published consolidated financial statements, which were
prepared in accordance with IFRS as adopted by the EU and in compliance with IFRS as issued by the
International Accounting Standards Board.
The following new and amended standards, that have been issued by the International Accounting Standards
Board (IASB), and have been adopted by the EU, and that are effective for the first time for the financial year
beginning on or after January 1, 2013, have been applied by the Group for the first time in the condensed
consolidated preliminary financial statements;
IAS 1 (amendment 2011), “Presentation of Items of financial statements”.
IAS 19 (amendment 2011), “Employee benefits”.
IFRS 7 (amendment), “Disclosures – Offsetting Financial Assets and Financial Liabilities”
IFRS 13, “Fair Value Measurement”.
“Improvements to IFRSs”. 2009-2011 Cycle.
IAS 27 (amended 2011), “Separate financial statements”.
IAS 28 (amended 2011), “Associates and joint ventures”.

14
IAS 36 (amendment), “Recoverable Amount Disclosures for Non-Financial Assets” (effective
for fiscal periods beginning on or after January 1, 2014).
IFRS 10, “Consolidated Financial Statements”.
IFRS 11, “Joint arrangements”.
IFRS 12, “Disclosure of interests in other entities”.
The adoption of these new or amended standards did not have a material impact on our financial position or
results from operations in the year ended March 31, 2014.
The following new or revised IFRS standards and IFRIC interpretations will be adopted for purposes of the
preparation of future financial statements, where applicable. We do not anticipate that the adoption of these
new or revised standards and interpretations will have a material impact on our financial position or results
from operations.
IAS 32 (amendment), “Financial instruments: Presentation-offsetting financial assets and
financial liabilities” (effective for fiscal periods beginning on or after January 1, 2014).*
IAS 39 (amendment), “Novation of Derivatives and Continuation of Hedge Accounting”
(effective for fiscal periods beginning on or after January 1, 2014).*
IAS 19 (amendment), “Defined Benefit Plans: Employee Contributions” (effective for fiscal
periods beginning on or after July 1, 2014).
IFRIC 21, “Levies” (effective for fiscal periods beginning on or after January 1, 2014).
IFRS 9, “Financial Instruments” (2009, as amended in 2011 and 2013) (effective date to be
determined).
“Improvements to IFRSs”. 2010-2012 Cycle (effective for fiscal periods beginning on or after
July 1, 2014).
“Improvements to IFRSs”. 2011-2013 Cycle (effective for fiscal periods beginning on or after
July 1, 2014).
IFRS 14, “Regulators Deferral Accounts” (effective for fiscal periods beginning on or after
January 1, 2016).
* Endorsed by the EU (IASB effective date in brackets).
15
2. Estimates
The preparation of financial statements requires management to make judgements, estimates and assumptions that
affect the application of accounting policies and the reported amounts of assets and liabilities, income and expense.
Actual results may differ from these estimates.
In preparing these consolidated financial statements, the significant judgements made by management in applying
the Group’s accounting policies and the key sources of estimation uncertainty were the same as those that applied
in the most recent published consolidated financial statements.
3. Seasonality of operations
The Group’s results of operations have varied significantly from quarter to quarter, and management expects these
variations to continue. Among the factors causing these variations are the airline industry’s sensitivity to general
economic conditions and the seasonal nature of air travel. Accordingly the first half-year typically results in higher
revenues and results.
4. Income tax expense
The Group’s consolidated effective tax rate in respect of operations for the year ended March 31, 2014 was 11.6%
(March 31, 2013: 12.5%). The tax charge for the year ended March 31, 2014 of €68.6m (March 31, 2013: €81.6m)
comprises a deferred tax charge relating to the temporary differences for property, plant and equipment recognised
in the income statement.
5. Share based payments
The terms and conditions of the share option programme are disclosed in the most recent, published, consolidated
financial statements. The charge of €1.9m is the fair value of various share options granted in prior periods, which
are being recognised within the income statement in accordance with employee services rendered.
6. Contingencies
The Group is engaged in litigation arising in the ordinary course of its business. The Group does not believe that
any such litigation will individually or in aggregate have a material adverse effect on the financial condition of the
Group. Should the Group be unsuccessful in these litigation actions, management believes the possible liabilities
then arising cannot be determined but are not expected to materially adversely affect the Group’s results of
operations or financial position.
7. Capital commitments
At March 31, 2014 Ryanair had an operating fleet of 297 (2013: 305) Boeing 737-800NG aircraft. Following
shareholder approval at an EGM on June 18, 2013, the Group has agreed to purchase 175 new Boeing 737 800NG
aircraft between fiscal 2015 and 2019. The Company also agreed on April 30, 2014, to purchase a further 5 Boeing
737 800NG for delivery in fiscal 2016, bringing the total order to 180 Boeing 737-800NG aircraft.
16
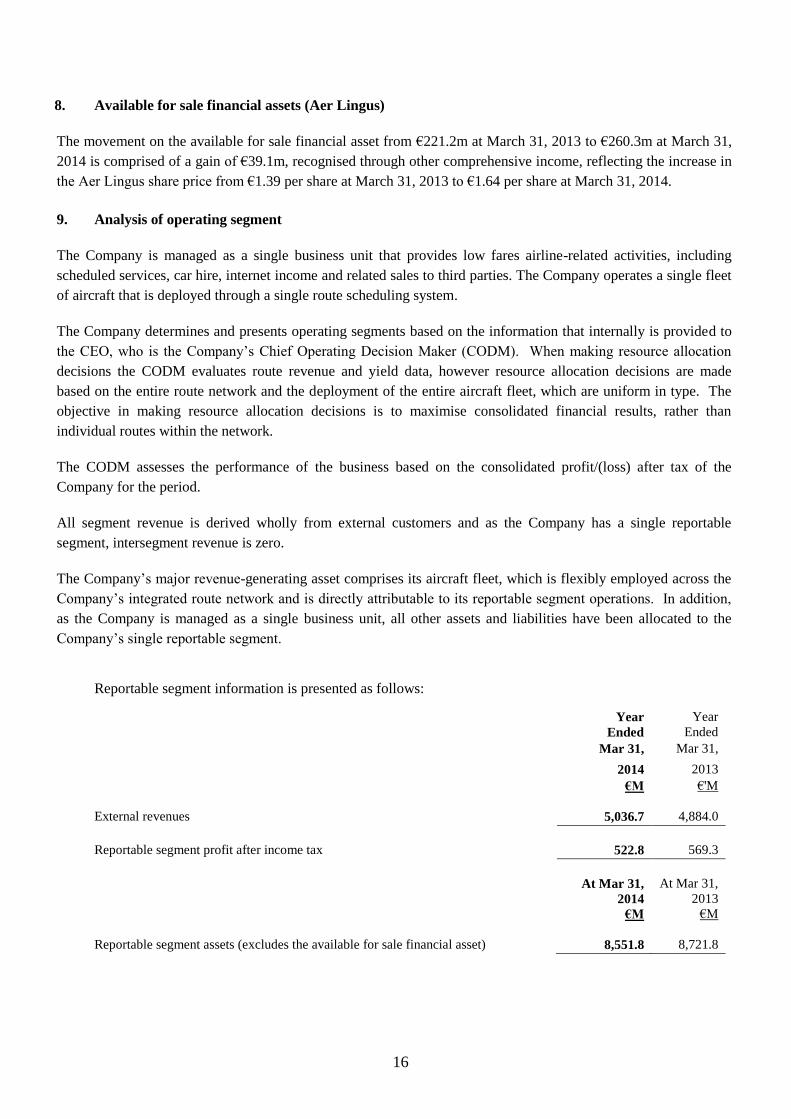
8. Available for sale financial assets (Aer Lingus)
The movement on the available for sale financial asset from €221.2m at March 31, 2013 to €260.3m at March 31,
2014 is comprised of a gain of €39.1m, recognised through other comprehensive income, reflecting the increase in
the Aer Lingus share price from €1.39 per share at March 31, 2013 to €1.64 per share at March 31, 2014.
9. Analysis of operating segment
The Company is managed as a single business unit that provides low fares airline-related activities, including
scheduled services, car hire, internet income and related sales to third parties. The Company operates a single fleet
of aircraft that is deployed through a single route scheduling system.
The Company determines and presents operating segments based on the information that internally is provided to
the CEO, who is the Company’s Chief Operating Decision Maker (CODM). When making resource allocation
decisions the CODM evaluates route revenue and yield data, however resource allocation decisions are made
based on the entire route network and the deployment of the entire aircraft fleet, which are uniform in type. The
objective in making resource allocation decisions is to maximise consolidated financial results, rather than
individual routes within the network.
The CODM assesses the performance of the business based on the consolidated profit/(loss) after tax of the
Company for the period.
All segment revenue is derived wholly from external customers and as the Company has a single reportable
segment, intersegment revenue is zero.
The Company’s major revenue-generating asset comprises its aircraft fleet, which is flexibly employed across the
Company’s integrated route network and is directly attributable to its reportable segment operations. In addition,
as the Company is managed as a single business unit, all other assets and liabilities have been allocated to the
Company’s single reportable segment.
Reportable segment information is presented as follows:
Year
Year
Ended Ended
Mar 31, Mar 31,
2014 2013
€M
€'M
External revenues 5,036.7 4,884.0
Reportable segment profit after income tax 522.8 569.3
At Mar 31,
2014
€M
At Mar 31,
2013
€M
Reportable segment assets (excludes the available for sale financial asset) 8,551.8 8,721.8

17
10. Earnings per share
Year
Year
Ended Ended
Mar-31 Mar-31
2014 2013
Basic earnings/(losses) per ordinary share euro cent 36.96 39.45
Diluted earnings/(losses) per ordinary share euro cent 36.86 39.33
Weighted average number of ordinary shares (in M’s) - basic 1,414.6 1,443.1
Weighted average number of ordinary shares (in M’s) - diluted 1,418.2 1,447.4
Diluted earnings per share takes account solely of the potential future exercises of share options granted under the
Company’s share option schemes and the weighted average number of shares includes weighted average share
options assumed to be converted of 3.6m (2013: 4.3m).
11. Property, plant and equipment
Acquisitions
Capital expenditure in the year amounted to €505.8m and is primarily aircraft pre delivery payments and the cost
of spare engines purchased.
12. Financial instruments and financial risk management
Financial risk factors
We are exposed to various financial risks arising in the normal course of business. Our financial risk exposures
are predominantly related to commodity price, foreign exchange and interest rate risks. The Company uses
financial instruments to manage exposures arising from these risks.
These preliminary financial statements do not include all financial risk management information and
disclosures required in the annual financial statements, and should be read in conjunction with the 2013
Annual Report. There have been no changes in our risk management policies in the year.
Fair value hierarchy
Financial instruments measured at fair value in the balance sheet are categorised by the type of valuation
method used. The different valuation levels are defined as follows:
Level 1: quoted prices (unadjusted) in active markets for identical assets or liabilities that the Group can
access at the measurement date.
Level 2: inputs other than quoted prices included within Level 1 that are observable for that asset or
liability, either directly or indirectly.
Level 3: unobservable inputs for the asset or liability.
18
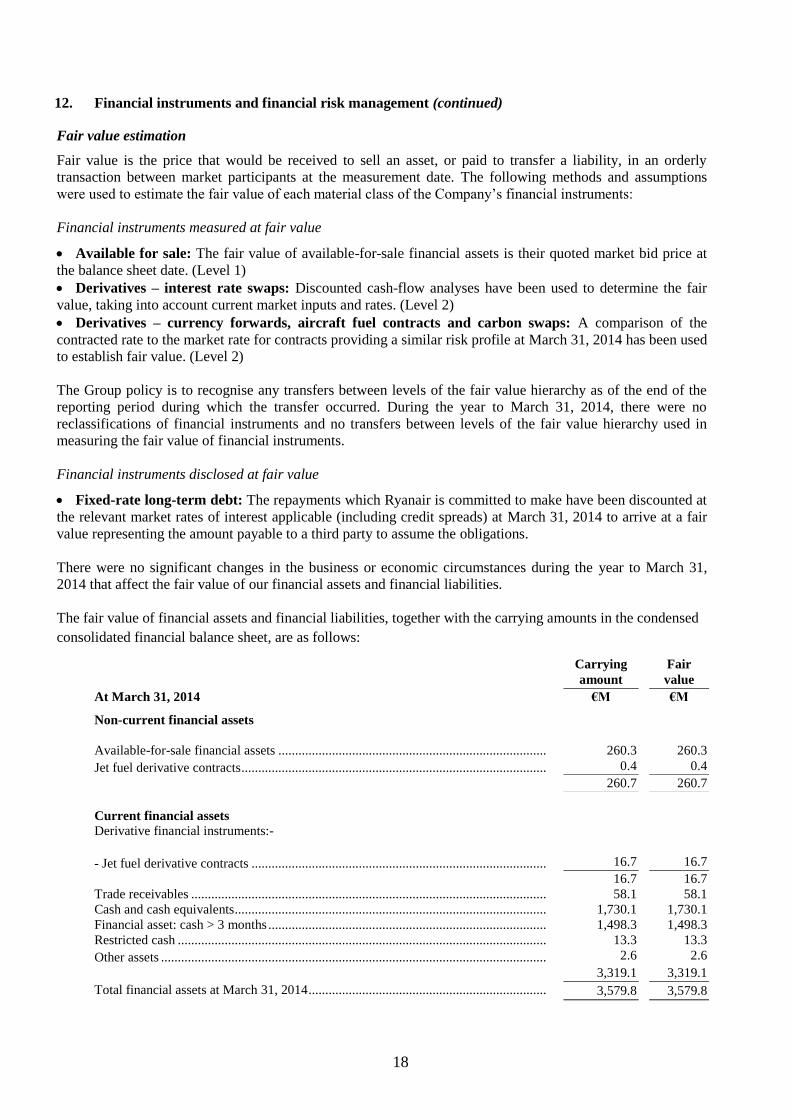
12. Financial instruments and financial risk management (continued)
Fair value estimation
Fair value is the price that would be received to sell an asset, or paid to transfer a liability, in an orderly
transaction between market participants at the measurement date. The following methods and assumptions
were used to estimate the fair value of each material class of the Company’s financial instruments:
Financial instruments measured at fair value
Available for sale: The fair value of available-for-sale financial assets is their quoted market bid price at
the balance sheet date. (Level 1)
Derivatives – interest rate swaps: Discounted cash-flow analyses have been used to determine the fair
value, taking into account current market inputs and rates. (Level 2)
Derivatives – currency forwards, aircraft fuel contracts and carbon swaps: A comparison of the
contracted rate to the market rate for contracts providing a similar risk profile at March 31, 2014 has been used
to establish fair value. (Level 2)
The Group policy is to recognise any transfers between levels of the fair value hierarchy as of the end of the
reporting period during which the transfer occurred. During the year to March 31, 2014, there were no
reclassifications of financial instruments and no transfers between levels of the fair value hierarchy used in
measuring the fair value of financial instruments.
Financial instruments disclosed at fair value
Fixed-rate long-term debt: The repayments which Ryanair is committed to make have been discounted at
the relevant market rates of interest applicable (including credit spreads) at March 31, 2014 to arrive at a fair
value representing the amount payable to a third party to assume the obligations.
There were no significant changes in the business or economic circumstances during the year to March 31,
2014 that affect the fair value of our financial assets and financial liabilities.
The fair value of financial assets and financial liabilities, together with the carrying amounts in the condensed
consolidated financial balance sheet, are as follows:
Carrying
amount
Fair
value
At March 31, 2014 €M €M
Non-current financial assets
Available-for-sale financial assets ................................................................................ 260.3 260.3
Jet fuel derivative contracts ........................................................................................... 0.4 0.4
260.7 260.7
Current financial assets
Derivative financial instruments:-
- Jet fuel derivative contracts ........................................................................................ 16.7 16.7
16.7 16.7
Trade receivables .......................................................................................................... 58.1 58.1
Cash and cash equivalents ............................................................................................. 1,730.1 1,730.1
Financial asset: cash > 3 months ................................................................................... 1,498.3 1,498.3
Restricted cash .............................................................................................................. 13.3 13.3
Other assets ................................................................................................................... 2.6 2.6
3,319.1 3,319.1
Total financial assets at March 31, 2014 ....................................................................... 3,579.8 3,579.8

19
12. Financial instruments and financial risk management (continued)
Carrying
amount
Fair
value
At March 31, 2014 €M €M
Non-current financial liabilities
Derivative financial instruments:-
- Interest rate swaps....................................................................................................... 41.4 41.4
- U.S. dollar currency forward contracts ....................................................................... 1.8 1.8
43.2 43.2
Long-term debt .............................................................................................................. 2,675.0 2,720.2
2,718.2 2,763.4
Current financial liabilities
Derivative financial instruments:-
- Interest rate swaps....................................................................................................... 31.0 31.0
- U.S. dollar currency forward contracts ....................................................................... 64.4 64.4
95.4 95.4
Long-term debt .............................................................................................................. 408.6 408.6
Trade payables .............................................................................................................. 150.0 150.0
Accrued expenses .......................................................................................................... 401.7 401.7
1,055.7 1,055.7
Total financial liabilities at March 31, 2014 ................................................................. 3,773.9 3,819.1
13. Share buy-back
In the year ended March 31, 2014 the Company bought back 69.5m ordinary shares at a total cost of €481.7m.
This is equivalent to approximately 4.8% of the Company’s issued share capital at March 31, 2013. All ordinary
shares repurchased were cancelled. Accordingly, share capital decreased by 69.5m ordinary shares with a nominal
value of €0.4m and the capital redemption reserve increased by a corresponding €0.4m. The capital redemption
reserve is required to be created under Irish law to preserve permanent capital in the Parent Company.
On June 20, 2013 the Company detailed plans to return up to €1.0 billion to shareholders over the following two
years. At March 31, 2014 €481.7m has been completed via share buybacks and the balance (in either special
dividends or share buybacks) is to be completed in the fiscal year to March 31, 2015 (subject to profitability and
shareholder approval at the AGM).
14. Related party transactions
We have related party relationships with our subsidiaries, directors and senior key management personnel. All
transactions with subsidiaries eliminate on consolidation and are not disclosed.
There were no related party transactions in the year ended March 31, 2014 that materially affected the financial
position or the performance of the Company during that period and there were no changes in the related party
transactions described in the 2013 Annual Report that could have a material effect on the financial position or
performance of the Company in the same period.
15. Post balance sheet events
On April 30, 2014, the Company agreed to purchase a further 5 Boeing 737 800NG for delivery in fiscal 2016,
bringing the total number of aircraft to be purchased from Boeing to 180 for delivery between fiscal 2015 and
2019.


![Porters 5 [Ryanair]](https://static.fdocuments.us/doc/165x107/55cf8548550346484b8c553e/porters-5-ryanair.jpg)