RYANAIR FULL YEAR PROFITS RISE 6% TO € 1.316BN AS LOWER ... · Ryanair, Europe’s No. 1 airline,...
19
Ryanair, Europe’s No. 1 airline, today (30 May) reported a 6% increase in full year net profit to €1.316bn. The combination of a 13% cut in average fares, coupled with Year 3 of the “Always Getting Better” (AGB) programme delivered 13% traffic growth to 120m customers, and an industry leading 94% load factor. Unit costs fell by 11% (ex-fuel down 5%). Full Year Results (IFRS) Mar 31, 2016 Mar 31, 2017 % Change Customers (m) 106.4 120.0 +13% Revenue (m) €6,536 €6,648 +2% Profit after Tax (m)* €1,242 €1,316 +6% Net Margin* 19% 20% +1% Basic EPS* €0.93 €1.05 +14% *Excludes exceptional accounting gain of €317.5m on the sale of Aer Lingus shareholding in FY16. Ryanair’s CEO Michael O’Leary said: “We are pleased to report a 6% increase in PAT to €1.316bn, despite difficult trading conditions in FY17 caused by a series of security events at European cities, a switch of charter capacity from North Africa, Turkey and Egypt to mainland Europe, and a sharp decline in Sterling following the June 2016 Brexit vote. We reacted to these challenges by improving our customer experience, and stimulating growth with lower fares. Highlights of the past year include: Ave. fares fell 13% to €41 Traffic grew 13% to 120m customers Load factor rose to an industry leading 94% Unit costs were cut 11% (ex-fuel they declined 5%) We delivered Year 3, and announced Year 4, initiatives of AGB Over €1bn was returned to shareholders via share buybacks New Routes, Bases & Fleet During FY17 we took delivery of 52 new B737’s, launched 206 new routes, and opened 10 new bases at primary airports in Bucharest, Corfu, Frankfurt Main, Hamburg, Ibiza, Nuremburg, Prague, Sofia, Timisoara and Vilnius. Our fleet will grow to 427 aircraft by March ‘18 as we increase traffic to 130m customers. This year, our 2 aircraft base at Frankfurt Main (opened in March) will increase to 7 aircraft from September. In April we opened a base in Naples and next autumn we open bases in Memmingen (Munich) and Poznan, as well as launching our first flights to Tel Aviv and the Ukraine (our 34 th country). We recently announced the launch of Ryanair Sun, a charter airline which will have a Polish AOC and management team. This airline will operate in summer ’18 with a fleet of 5 aircraft and will significantly boost our presence in Poland where Ryanair is already the largest scheduled airline. We expect Ryanair Sun to become Poland’s No.1 charter airline, as it grows to 15 aircraft by summer ’19. As legacy competitors in Italy, Germany, Romania, and Poland undergo deep restructuring, the scale of our airport growth negotiations is accelerating. We continue to juggle more opportunities for 2018 and 2019 than our existing fleet growth can accommodate. Accordingly, we are engaged in a fleet review with Boeing, and are taking up opportunities to accelerate fleet growth in 2018 and 2019 by extending 10 of our planned lease returns in these years, and adding selectively to our RYANAIR FULL YEAR PROFITS RISE 6% TO € 1.316 BN AS LOWER FARES & AGB DRIVE RECORD TRAFFIC OF 120M PA € 600 M SHARE BUYBACK ANNOUNCED
Transcript of RYANAIR FULL YEAR PROFITS RISE 6% TO € 1.316BN AS LOWER ... · Ryanair, Europe’s No. 1 airline,...
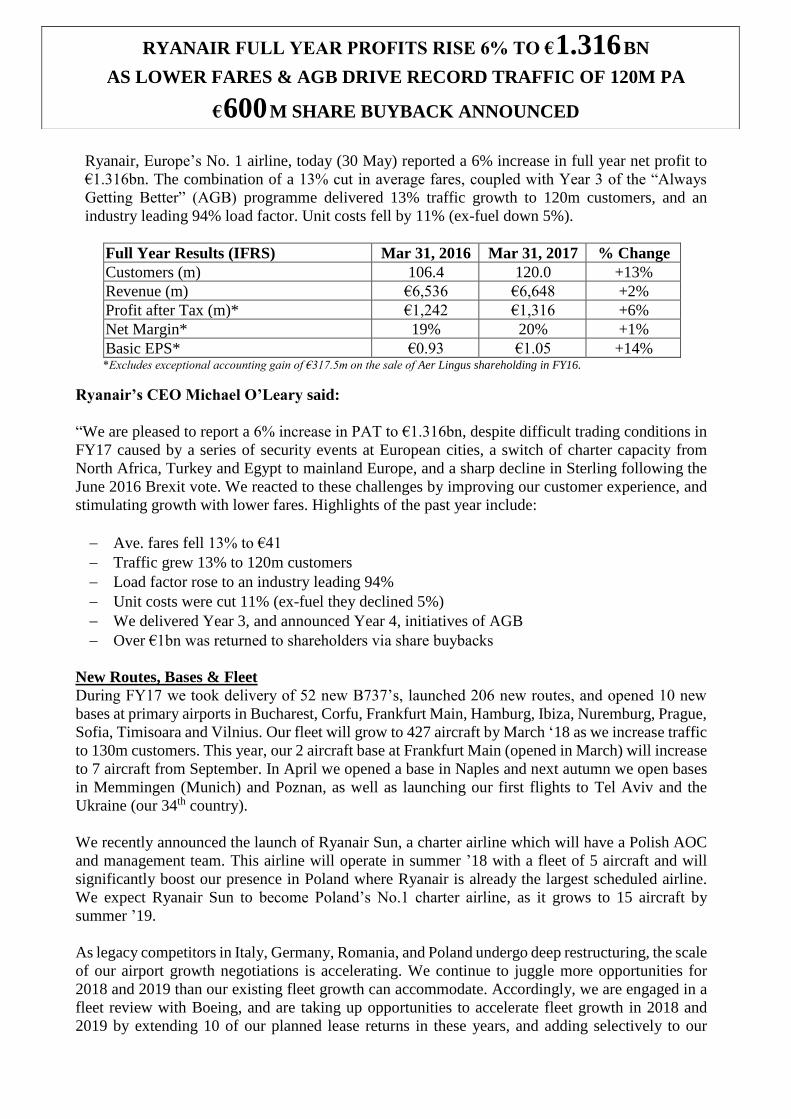
Ryanair, Europe’s No. 1 airline, today (30 May) reported a 6% increase in full year net profit to
€1.316bn. The combination of a 13% cut in average fares, coupled with Year 3 of the “Always
Getting Better” (AGB) programme delivered 13% traffic growth to 120m customers, and an
industry leading 94% load factor. Unit costs fell by 11% (ex-fuel down 5%).
Full Year Results (IFRS) Mar 31, 2016 Mar 31, 2017 % Change
Customers (m) 106.4 120.0 +13%
Revenue (m) €6,536 €6,648 +2%
Profit after Tax (m)* €1,242 €1,316 +6%
Net Margin* 19% 20% +1%
Basic EPS* €0.93 €1.05 +14% *Excludes exceptional accounting gain of €317.5m on the sale of Aer Lingus shareholding in FY16.
Ryanair’s CEO Michael O’Leary said:
“We are pleased to report a 6% increase in PAT to €1.316bn, despite difficult trading conditions in
FY17 caused by a series of security events at European cities, a switch of charter capacity from
North Africa, Turkey and Egypt to mainland Europe, and a sharp decline in Sterling following the
June 2016 Brexit vote. We reacted to these challenges by improving our customer experience, and
stimulating growth with lower fares. Highlights of the past year include:
Ave. fares fell 13% to €41
Traffic grew 13% to 120m customers
Load factor rose to an industry leading 94%
Unit costs were cut 11% (ex-fuel they declined 5%)
We delivered Year 3, and announced Year 4, initiatives of AGB
Over €1bn was returned to shareholders via share buybacks
New Routes, Bases & Fleet
During FY17 we took delivery of 52 new B737’s, launched 206 new routes, and opened 10 new
bases at primary airports in Bucharest, Corfu, Frankfurt Main, Hamburg, Ibiza, Nuremburg, Prague,
Sofia, Timisoara and Vilnius. Our fleet will grow to 427 aircraft by March ‘18 as we increase traffic
to 130m customers. This year, our 2 aircraft base at Frankfurt Main (opened in March) will increase
to 7 aircraft from September. In April we opened a base in Naples and next autumn we open bases
in Memmingen (Munich) and Poznan, as well as launching our first flights to Tel Aviv and the
Ukraine (our 34th country).
We recently announced the launch of Ryanair Sun, a charter airline which will have a Polish AOC
and management team. This airline will operate in summer ’18 with a fleet of 5 aircraft and will
significantly boost our presence in Poland where Ryanair is already the largest scheduled airline.
We expect Ryanair Sun to become Poland’s No.1 charter airline, as it grows to 15 aircraft by
summer ’19.
As legacy competitors in Italy, Germany, Romania, and Poland undergo deep restructuring, the scale
of our airport growth negotiations is accelerating. We continue to juggle more opportunities for
2018 and 2019 than our existing fleet growth can accommodate. Accordingly, we are engaged in a
fleet review with Boeing, and are taking up opportunities to accelerate fleet growth in 2018 and
2019 by extending 10 of our planned lease returns in these years, and adding selectively to our
RYANAIR FULL YEAR PROFITS RISE 6% TO € 1.316 BN
AS LOWER FARES & AGB DRIVE RECORD TRAFFIC OF 120M PA
€ 600 M SHARE BUYBACK ANNOUNCED
current order where Boeing may have some delivery opportunities over the next 24 months. As
competitor airlines undergo deep restructuring, we are aware of the need to have additional short
haul aircraft to respond quickly as these unique growth opportunities arise.
Improving the AGB Customer Experience
Year 3 of our AGB programme has seen forward bookings and load factors rise for the third year in
a row as we improved our website, mobile app, and digital platforms. We recently announced Year
4 of AGB which will deliver connecting flights (initially on Ryanair flights, then later with other
partners) and last week began selling long haul flights from Madrid with Air Europa. We will roll-
out Ryanair Holidays to all markets, and continue to build our “Amazon of Travel” platform through
better search tools, travel guides, express booking, auto check-in, and onward transport partnerships.
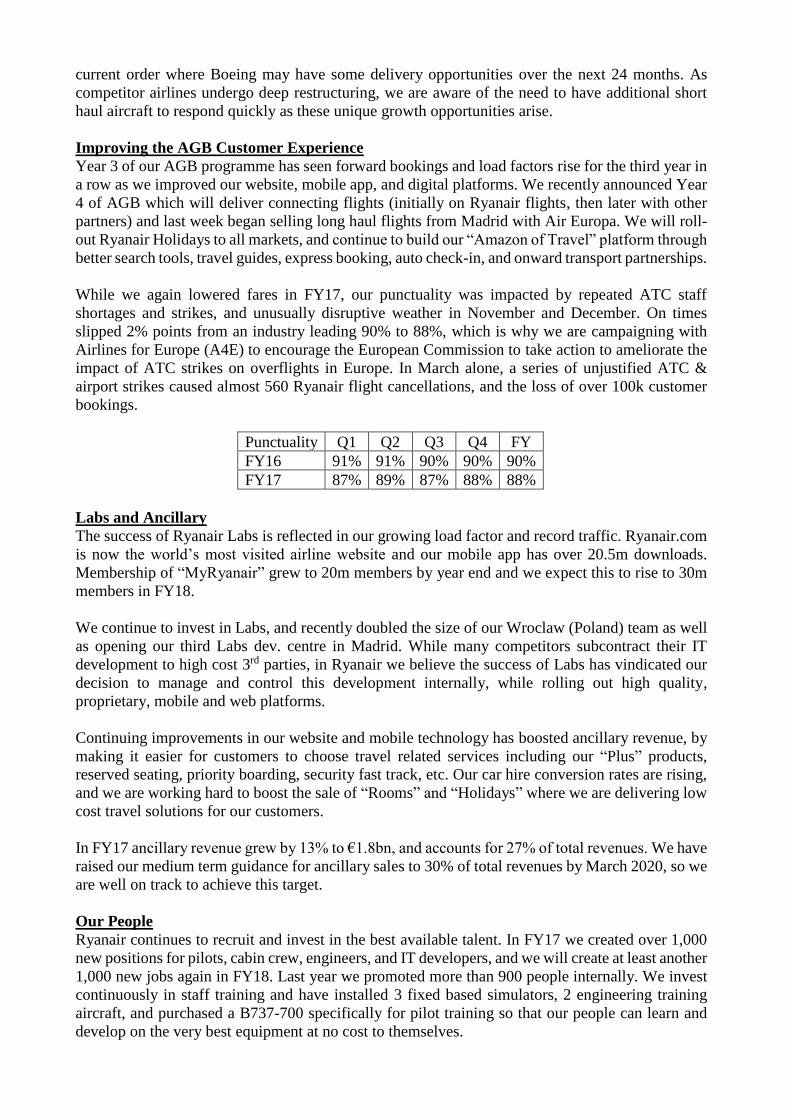
While we again lowered fares in FY17, our punctuality was impacted by repeated ATC staff
shortages and strikes, and unusually disruptive weather in November and December. On times
slipped 2% points from an industry leading 90% to 88%, which is why we are campaigning with
Airlines for Europe (A4E) to encourage the European Commission to take action to ameliorate the
impact of ATC strikes on overflights in Europe. In March alone, a series of unjustified ATC &
airport strikes caused almost 560 Ryanair flight cancellations, and the loss of over 100k customer
bookings.
Punctuality Q1 Q2 Q3 Q4 FY
FY16 91% 91% 90% 90% 90%
FY17 87% 89% 87% 88% 88%
Labs and Ancillary
The success of Ryanair Labs is reflected in our growing load factor and record traffic. Ryanair.com
is now the world’s most visited airline website and our mobile app has over 20.5m downloads.
Membership of “MyRyanair” grew to 20m members by year end and we expect this to rise to 30m
members in FY18.
We continue to invest in Labs, and recently doubled the size of our Wroclaw (Poland) team as well
as opening our third Labs dev. centre in Madrid. While many competitors subcontract their IT
development to high cost 3rd parties, in Ryanair we believe the success of Labs has vindicated our
decision to manage and control this development internally, while rolling out high quality,
proprietary, mobile and web platforms.
Continuing improvements in our website and mobile technology has boosted ancillary revenue, by
making it easier for customers to choose travel related services including our “Plus” products,
reserved seating, priority boarding, security fast track, etc. Our car hire conversion rates are rising,
and we are working hard to boost the sale of “Rooms” and “Holidays” where we are delivering low
cost travel solutions for our customers.
In FY17 ancillary revenue grew by 13% to €1.8bn, and accounts for 27% of total revenues. We have
raised our medium term guidance for ancillary sales to 30% of total revenues by March 2020, so we
are well on track to achieve this target.
Our People
Ryanair continues to recruit and invest in the best available talent. In FY17 we created over 1,000
new positions for pilots, cabin crew, engineers, and IT developers, and we will create at least another
1,000 new jobs again in FY18. Last year we promoted more than 900 people internally. We invest
continuously in staff training and have installed 3 fixed based simulators, 2 engineering training
aircraft, and purchased a B737-700 specifically for pilot training so that our people can learn and
develop on the very best equipment at no cost to themselves.
In April we negotiated new pay and condition agreements with 10 of our pilot and cabin crew bases
which means that all of our 86 bases now enjoy 5 year agreements, which guarantee them industry
leading rosters, and pay increases each year. At a time when many of Europe’s airlines are cutting
pay, pensions, and jobs, this combination of job security and annual pay increases is a key attraction
for Ryanair’s people.
In April the European Court of Justice (ECJ) issued a positive ruling in the A-Rosa social tax case
which – although it does not involve Ryanair directly – clarifies the social tax status of international
transport workers. This now allows Ryanair to return to the French Courts to recover the unlawful
double-charges (approx. €15m) imposed on Ryanair and our people. The A-Rosa decision should
also halt actions by the Italian Authorities who have sought to double-charge social taxes which
have already been validly paid in Ireland under EU law.
Balance Sheet and Shareholder Returns
Our balance sheet remains strong. At year end we report a modest net debt of just over €200m
having spent €1.45bn on CAPEX, and €1.02bn on share buybacks in FY17. In February we raised
a further €750m in the Eurobond market, at an annual coupon of just 1.125% p.a. We will use this
finance for aircraft CAPEX which will ensure we maintain the lowest fleet costs of any EU airline.
We completed €1.02bn in shareholder buybacks in February. The success of our buyback
programme is underlined by the fact that while profits grew by 6% in FY17, earnings per share have
accelerated by more than double this rate (14%) to €1.05 in March 2017. We are committed to
returning surplus cash to shareholders, as long as we are profitable, cash generative, and can fund
aircraft CAPEX from internally generated revenues.
The Board has approved a further €600m share buyback which will start this week and, subject to
market conditions, be completed by the end of October. Since the current split between ordinary
shares and ADR’s is 58%/42%, we will confine this buyback to ordinary shares. This latest buyback
will increase the funds returned to shareholders since 2008 to over €5.4bn.
Brexit:
Ryanair actively campaigned for a remain vote in the UK Referendum. We were disappointed by
the result, and are concerned at the significant uncertainty over the terms of the UK’s departure from
the EU in March 2019. For our customers, we hope the UK will remain in Open Skies which will
mean no change for UK consumers and visitors. However, the UK has indicated that it does not
wish to do so, and until we get clarity over the final terms of the UK’s future trading relationship
with the EU, there must be significant uncertainty over flights between the UK and the EU for a
period of time from March 2019 onwards.
A “hard” Brexit could cause significant disruption to UK/EU flights for a period of months after
March 2019, which is why we must remain flexible. In the absence of such certainty, or direction,
we will continue to pivot our growth away from the UK in 2017 and 2018 to capitalise on the many
growth opportunities elsewhere in Europe. We have contingency plans and will adapt to changed
circumstances in the best interests of our customers.
Outlook
As usual at this time of year, the full year outlook is clouded by the absence of H2 yield visibility.
We expect our “load factor active” policy will grow traffic 8% to 130m. While forward bookings in
H1 are reasonably robust (up 1% on prior year) pricing remains soft, and depends on the absence of
security events in Europe’s cities or airports. While Q1 will benefit from Easter, we have limited
visibility of close-in peak summer bookings and zero H2 visibility. We expect FY18 ave. fares will
decline by -5% to -7% due to weaker Sterling, and continuing excess capacity in Europe. Ancillary
revenue per customer will likely be flat as we continue to drive penetration with discounts. We
expect our fuel bill will fall by €70m in FY18, but we will pass on these savings to customers in
lower air fares. We expect ex-fuel unit cost to fall by 1% in FY18.
As a result of these factors we are cautiously guiding an 8% increase in FY18 net profit to a range
of €1.40bn to €1.45bn. Investors should be wary of the risk of negative Brexit developments, or any
repeat of last year’s security events at European cities, which could damage consumer confidence,
close-in bookings, and this FY18 guidance.”
ENDS.
For further information Neil Sorahan Piaras Kelly
please contact: Ryanair Holdings plc Edelman
www.ryanair.com Tel: 353-1-9451212 Tel: 353-1-6789333
Certain of the information included in this release is forward looking and is subject to important risks and uncertainties that could cause
actual results to differ materially. It is not reasonably possible to itemise all of the many factors and specific events that could affect the
outlook and results of an airline operating in the European economy. Among the factors that are subject to change and could significantly
impact Ryanair’s expected results are the airline pricing environment, fuel costs, competition from new and existing carriers, market prices
for the replacement aircraft, costs associated with environmental, safety and security measures, actions of the Irish, U.K., European Union
(“EU”) and other governments and their respective regulatory agencies, uncertainties surrounding Brexit, weather related disruptions,
fluctuations in currency exchange rates and interest rates, airport access and charges, labour relations, the economic environment of the
airline industry, the general economic environment in Ireland, the UK and Continental Europe, the general willingness of passengers to
travel and other economics, social and political factors and unforeseen security events.
Ryanair is Europe’s favourite airline, carrying 130m customers p.a. on more than 2,000 daily flights from 86 bases,
connecting over 200 destinations in 34 countries on a fleet of over 400 Boeing 737 aircraft, with a further 260 Boeing
737’s on order, which will enable Ryanair to lower fares and grow traffic to 200m p.a. by FY24. Ryanair has a team
of more than 13,000 highly skilled aviation professionals delivering Europe’s No.1 on-time performance, and extending
an industry leading 32 year safety record.
1
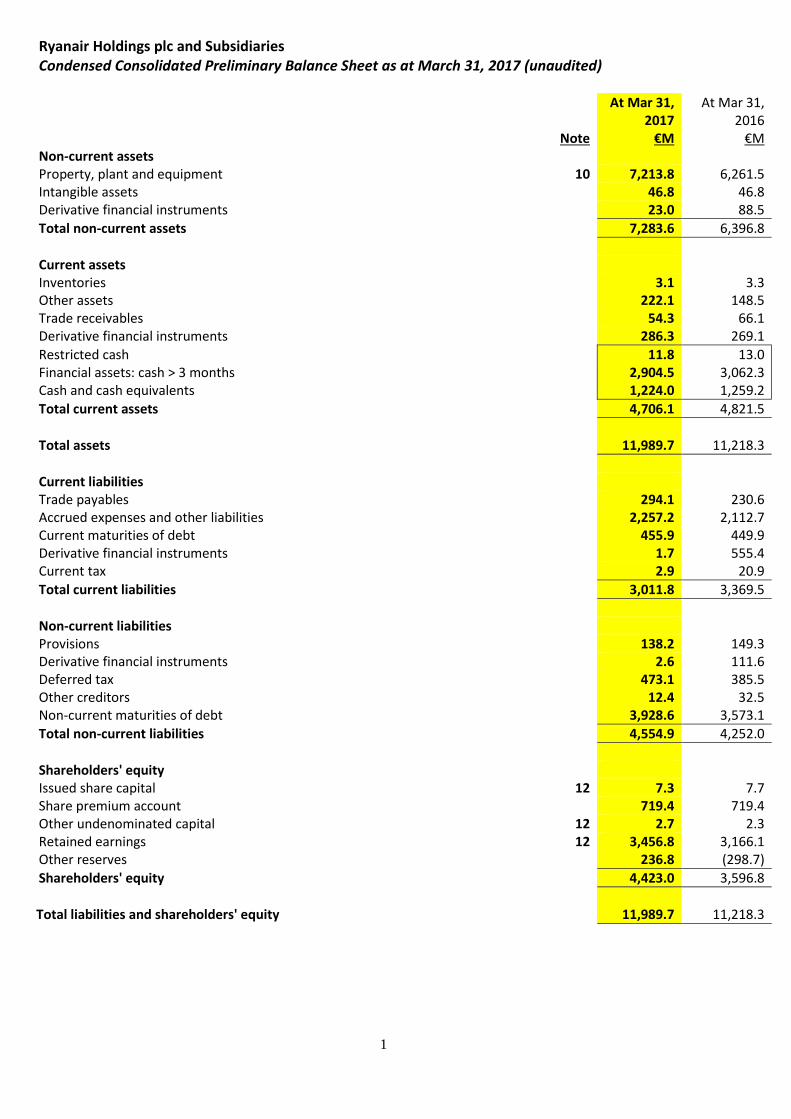
Ryanair Holdings plc and Subsidiaries Condensed Consolidated Preliminary Balance Sheet as at March 31, 2017 (unaudited)
At Mar 31, At Mar 31, 2017 2016 Note €M €M Non-current assets Property, plant and equipment 10 7,213.8 6,261.5 Intangible assets 46.8 46.8 Derivative financial instruments 23.0 88.5
Total non-current assets 7,283.6 6,396.8
Current assets Inventories 3.1 3.3 Other assets 222.1 148.5 Trade receivables 54.3 66.1 Derivative financial instruments 286.3 269.1
Restricted cash 11.8 13.0 Financial assets: cash > 3 months 2,904.5 3,062.3 Cash and cash equivalents 1,224.0 1,259.2
Total current assets 4,706.1 4,821.5
Total assets 11,989.7 11,218.3
Current liabilities Trade payables 294.1 230.6 Accrued expenses and other liabilities 2,257.2 2,112.7 Current maturities of debt 455.9 449.9 Derivative financial instruments 1.7 555.4 Current tax 2.9 20.9
Total current liabilities 3,011.8 3,369.5
Non-current liabilities Provisions 138.2 149.3 Derivative financial instruments 2.6 111.6 Deferred tax 473.1 385.5 Other creditors 12.4 32.5 Non-current maturities of debt 3,928.6 3,573.1
Total non-current liabilities 4,554.9 4,252.0
Shareholders' equity Issued share capital 12 7.3 7.7 Share premium account 719.4 719.4 Other undenominated capital 12 2.7 2.3 Retained earnings 12 3,456.8 3,166.1 Other reserves 236.8 (298.7)
Shareholders' equity 4,423.0 3,596.8
Total liabilities and shareholders' equity 11,989.7 11,218.3
2
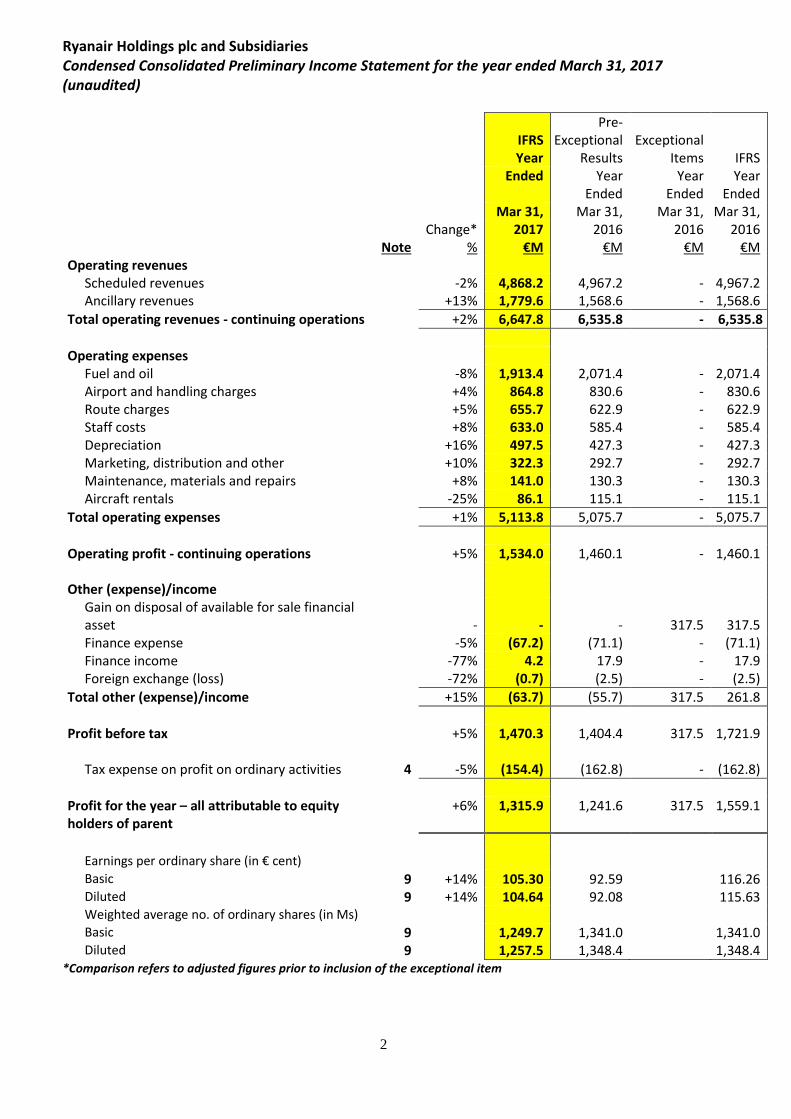
Ryanair Holdings plc and Subsidiaries Condensed Consolidated Preliminary Income Statement for the year ended March 31, 2017 (unaudited)
IFRS Year
Pre- Exceptional
Results
Exceptional
Items
IFRS Ended Year
Ended Year
Ended Year
Ended Mar 31, Mar 31, Mar 31, Mar 31, Change* 2017 2016 2016 2016 Note % €M €M €M €M Operating revenues Scheduled revenues -2% 4,868.2 4,967.2 - 4,967.2 Ancillary revenues +13% 1,779.6 1,568.6 - 1,568.6
Total operating revenues - continuing operations +2% 6,647.8 6,535.8 - 6,535.8
Operating expenses Fuel and oil -8% 1,913.4 2,071.4 - 2,071.4 Airport and handling charges +4% 864.8 830.6 - 830.6 Route charges +5% 655.7 622.9 - 622.9 Staff costs +8% 633.0 585.4 - 585.4 Depreciation +16% 497.5 427.3 - 427.3 Marketing, distribution and other +10% 322.3 292.7 - 292.7 Maintenance, materials and repairs +8% 141.0 130.3 - 130.3 Aircraft rentals -25% 86.1 115.1 - 115.1
Total operating expenses +1% 5,113.8 5,075.7 - 5,075.7
Operating profit - continuing operations +5% 1,534.0 1,460.1 - 1,460.1 Other (expense)/income Gain on disposal of available for sale financial
asset
-
-
-
317.5
317.5 Finance expense -5% (67.2) (71.1) - (71.1) Finance income -77% 4.2 17.9 - 17.9 Foreign exchange (loss) -72% (0.7) (2.5) - (2.5)
Total other (expense)/income +15% (63.7) (55.7) 317.5 261.8
Profit before tax +5% 1,470.3 1,404.4 317.5 1,721.9 Tax expense on profit on ordinary activities 4 -5% (154.4) (162.8) - (162.8)
Profit for the year – all attributable to equity holders of parent
+6% 1,315.9 1,241.6 317.5 1,559.1
Earnings per ordinary share (in € cent) Basic 9 +14% 105.30 92.59 116.26 Diluted 9 +14% 104.64 92.08 115.63 Weighted average no. of ordinary shares (in Ms) Basic 9 1,249.7 1,341.0 1,341.0 Diluted 9 1,257.5 1,348.4 1,348.4
*Comparison refers to adjusted figures prior to inclusion of the exceptional item
3
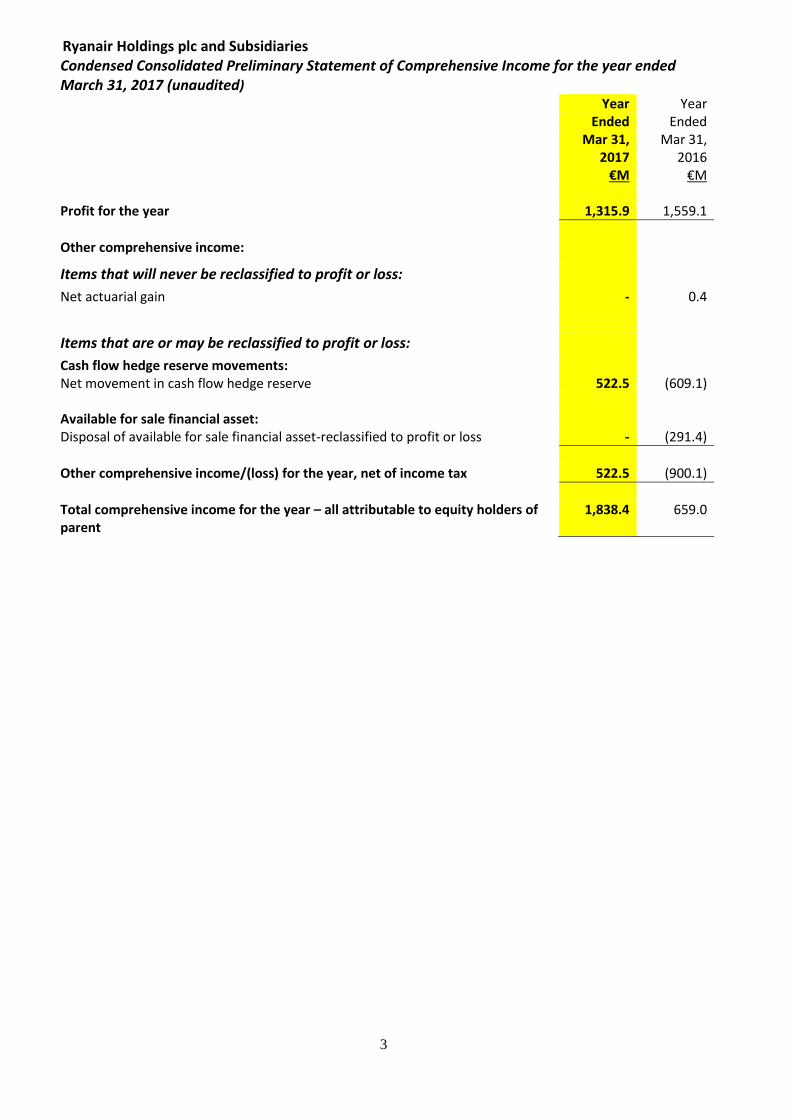
Ryanair Holdings plc and Subsidiaries Condensed Consolidated Preliminary Statement of Comprehensive Income for the year ended March 31, 2017 (unaudited) Year Year Ended Ended Mar 31, Mar 31, 2017 2016 €M €M Profit for the year 1,315.9 1,559.1
Other comprehensive income:
Items that will never be reclassified to profit or loss:
Net actuarial gain - 0.4
Items that are or may be reclassified to profit or loss:
Cash flow hedge reserve movements: Net movement in cash flow hedge reserve 522.5 (609.1) Available for sale financial asset: Disposal of available for sale financial asset-reclassified to profit or loss - (291.4)
Other comprehensive income/(loss) for the year, net of income tax 522.5 (900.1)
Total comprehensive income for the year – all attributable to equity holders of parent
1,838.4 659.0
4
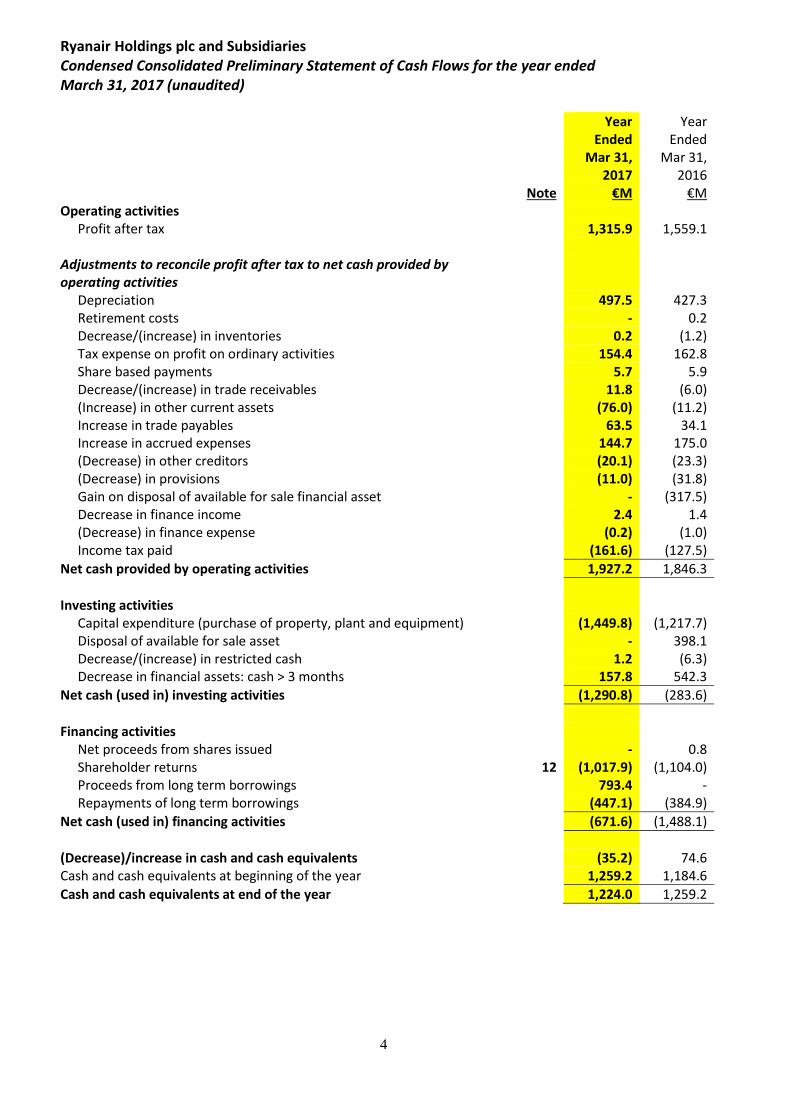
Ryanair Holdings plc and Subsidiaries Condensed Consolidated Preliminary Statement of Cash Flows for the year ended March 31, 2017 (unaudited) Year Year Ended Ended Mar 31, Mar 31, 2017 2016 Note €M €M Operating activities Profit after tax 1,315.9 1,559.1 Adjustments to reconcile profit after tax to net cash provided by operating activities
Depreciation 497.5 427.3 Retirement costs - 0.2 Decrease/(increase) in inventories 0.2 (1.2) Tax expense on profit on ordinary activities 154.4 162.8 Share based payments 5.7 5.9 Decrease/(increase) in trade receivables 11.8 (6.0) (Increase) in other current assets (76.0) (11.2) Increase in trade payables 63.5 34.1 Increase in accrued expenses 144.7 175.0 (Decrease) in other creditors (20.1) (23.3) (Decrease) in provisions (11.0) (31.8) Gain on disposal of available for sale financial asset - (317.5) Decrease in finance income 2.4 1.4 (Decrease) in finance expense (0.2) (1.0) Income tax paid (161.6) (127.5)
Net cash provided by operating activities 1,927.2 1,846.3
Investing activities Capital expenditure (purchase of property, plant and equipment) (1,449.8) (1,217.7) Disposal of available for sale asset - 398.1 Decrease/(increase) in restricted cash 1.2 (6.3) Decrease in financial assets: cash > 3 months 157.8 542.3
Net cash (used in) investing activities (1,290.8) (283.6)
Financing activities Net proceeds from shares issued - 0.8 Shareholder returns 12 (1,017.9) (1,104.0) Proceeds from long term borrowings 793.4 - Repayments of long term borrowings (447.1) (384.9)
Net cash (used in) financing activities (671.6) (1,488.1)
(Decrease)/increase in cash and cash equivalents (35.2) 74.6 Cash and cash equivalents at beginning of the year 1,259.2 1,184.6
Cash and cash equivalents at end of the year 1,224.0 1,259.2
5
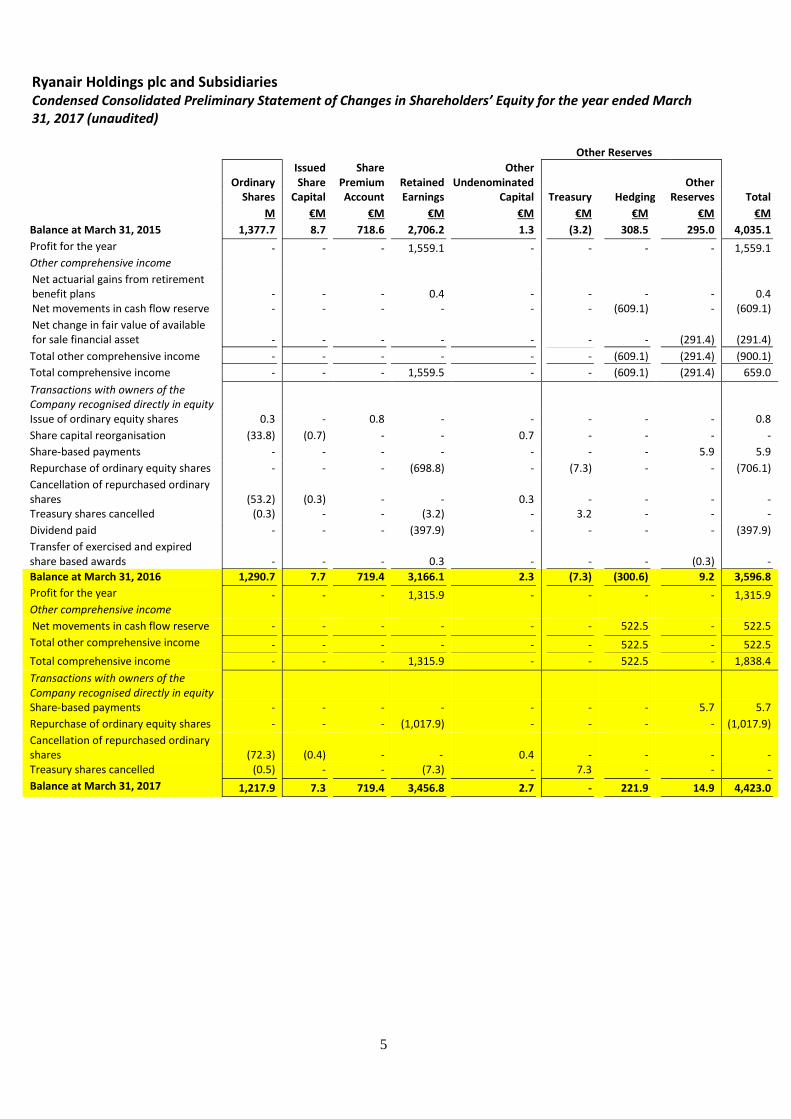
Ryanair Holdings plc and Subsidiaries Condensed Consolidated Preliminary Statement of Changes in Shareholders’ Equity for the year ended March 31, 2017 (unaudited) Other Reserves
Ordinary
Issued Share
Share Premium
Retained
Other Undenominated
Other
Shares Capital Account Earnings Capital Treasury Hedging Reserves Total
M €M €M €M €M €M €M €M €M
Balance at March 31, 2015 1,377.7 8.7 718.6 2,706.2 1.3 (3.2) 308.5 295.0 4,035.1
Profit for the year - - - 1,559.1 - - - - 1,559.1 Other comprehensive income
Net actuarial gains from retirement benefit plans
-
-
-
0.4
-
-
-
-
0.4
Net movements in cash flow reserve - - - - - - (609.1) - (609.1)
Net change in fair value of available for sale financial asset
-
-
-
-
-
-
-
(291.4)
(291.4)
Total other comprehensive income - - - - - - (609.1) (291.4) (900.1)
Total comprehensive income - - - 1,559.5 - - (609.1) (291.4) 659.0
Transactions with owners of the Company recognised directly in equity
Issue of ordinary equity shares 0.3 - 0.8 - - - - - 0.8
Share capital reorganisation (33.8) (0.7) - - 0.7 - - - -
Share-based payments - - - - - - - 5.9 5.9
Repurchase of ordinary equity shares - - - (698.8) - (7.3) - - (706.1)
Cancellation of repurchased ordinary shares
(53.2)
(0.3)
-
-
0.3
-
-
-
-
Treasury shares cancelled (0.3) - - (3.2) - 3.2 - - -
Dividend paid - - - (397.9) - - - - (397.9)
Transfer of exercised and expired share based awards
-
-
-
0.3
-
-
-
(0.3)
-
Balance at March 31, 2016 1,290.7 7.7 719.4 3,166.1 2.3 (7.3) (300.6) 9.2 3,596.8
Profit for the year - - - 1,315.9 - - - - 1,315.9 Other comprehensive income
Net movements in cash flow reserve - - - - - - 522.5 - 522.5
Total other comprehensive income - - - - - - 522.5 - 522.5
Total comprehensive income - - - 1,315.9 - - 522.5 - 1,838.4
Transactions with owners of the Company recognised directly in equity
Share-based payments - - - - - - - 5.7 5.7
Repurchase of ordinary equity shares - - - (1,017.9) - - - - (1,017.9)
Cancellation of repurchased ordinary shares
(72.3)
(0.4)
-
-
0.4
-
-
-
-
Treasury shares cancelled (0.5) - - (7.3) - 7.3 - - -
Balance at March 31, 2017 1,217.9 7.3 719.4 3,456.8 2.7 - 221.9 14.9 4,423.0
6
Ryanair Holdings plc and Subsidiaries Introduction
For the purposes of the Management Discussion and Analysis (“MD&A”) (with the exception of the balance
sheet commentary below) all figures and comments are by reference to the prior year adjusted results
excluding the exceptional items referred to below. A reconciliation of the results for the period under IFRS
to the adjusted results is provided in note 8 of this financial report.
MD&A Year Ended March 31, 2017
The exceptional item in the year ended March 31, 2016 comprised an accounting gain of €317.5M arising on
the disposal of Ryanair’s 29.8% shareholding in Aer Lingus. Income Statement Scheduled revenues: Scheduled revenues fell by 2% to €4,868.2M as 13% traffic growth (to 120.0M) was offset by a 13% reduction in average fare to €41.
Ancillary revenues: Ancillary revenues rose by 13% to €1,779.6M (27% of total revenues compared to 24% in the period ended March 31, 2016) driven by a solid performance in reserved seating, priority boarding, car hire and on-board sales offset by lower travel insurance and hotels penetration.
Operating Expenses: Fuel and oil: Fuel and oil fell by 8% to €1,913.4M due to lower euro fuel prices offset by an 11% increase in block hours and higher load factors (up 1 point to 94%). Airport and handling charges: Airport and handling charges rose by 4% to €864.8M due to 13% traffic growth offset by more competitive airport deals and weaker sterling against the euro. Route charges: Route charges increased by 5% to €655.7M due to an 11% increase in sectors flown offset by Eurocontrol price reductions in France, Germany and the UK (aided by weaker sterling). Staff costs: Staff costs rose by 8% to €633.0M, lower than the 13% increase in traffic, due to 11% more sectors and the impact of a 2% pay increase in April 2016 offset by weaker sterling against the euro. Depreciation: Depreciation increased by 16% to €497.5M due to 52 (+17%) additional owned aircraft in the fleet at period end (350 at March 31, 2017 compared to 298 at March 31, 2016). Marketing, distribution and other: Marketing, distribution and other rose by 10% to €322.3M, due mainly to increased distribution costs related to higher on-board sales, disruption costs related to ATC strikes (primarily French) in the period and higher passenger compensation costs following an ECJ ruling in September 2015.
7
Maintenance, materials and repairs: Maintenance, materials and repairs rose by 8% to €141.0M due to the timing of aircraft checks, the stronger US dollar against the euro and lease handbacks. Aircraft rentals: Aircraft rentals decreased by 25% to €86.1M due to the absence of short-term summer leases compared to the prior year comparative and the handback of 10 leased aircraft over the past year.
Ownership and maintenance:
During the year ended March 31, 2017 ownership and maintenance costs (depreciation, maintenance,
aircraft rentals and financing costs) rose by 6% to €791.8M, which is significantly lower than the 13%
increase in passenger numbers. Unit costs fell by 11%, excluding fuel they were down by 5%, which compares favourably to the 13% increase in traffic in the year. Other income/(expense): Finance expense: Finance expense decreased by 5% to €67.2M primarily due to lower interest rates. Finance income:
Finance income fell by €13.7M due to the absence of the Aer Lingus dividend this year (€8M in FY16),
significantly lower deposit interest rates and lower average cash balances throughout the year.
Balance sheet: Gross cash decreased by €194.2M to €4,140.3M since March 31, 2016. Gross debt rose by €361.5M to €4,384.5M at period end, reflective of a €750M Eurobond issuance, in February, offset by debt repayments. €1,927.2M net cash flow was generated by operating activities. Net capital expenditure was €1,449.8M, shareholder returns and debt repayments amounted to €1,017.9M and €447.1M respectively. Net debt was €244.2M at period end. (March 31, 2016: Net cash €311.5M). Shareholders’ equity: Shareholders’ equity increased by €826.2M to €4,423.0M in the year primarily due to a net profit after tax of €1,315.9M and IFRS hedge accounting treatment for derivatives of €522.5M offset by €1,017.9M of shareholder returns.
8
Ryanair Holdings plc and Subsidiaries Notes forming Part of the Condensed Consolidated
Preliminary Financial Statements
1. Basis of preparation and significant accounting policies
Ryanair Holdings plc (the “Company”) is a company domiciled in Ireland. The unaudited condensed consolidated preliminary financial statements of the Company for the year ended March 31, 2017 comprise the Company and its subsidiaries (together referred to as the “Group”).
These unaudited condensed consolidated preliminary financial statements (“the preliminary financial statements”), which should be read in conjunction with our 2016 Annual Report for the year ended March 31, 2016, have been prepared in accordance with International Accounting Standard No. 34 “Interim Financial Reporting” as adopted by the EU (“IAS 34”). They do not include all of the information required for full annual financial statements, and should be read in conjunction with the most recent published consolidated financial statements of the Group. The consolidated financial statements of the Group as at and for the year ended March 31, 2016, are available at http://investor.ryanair.com/.
The comparative figures included for the year ended March 31, 2016 do not constitute statutory financial statements of the Group within the meaning of the Companies Act, 2014. The consolidated financial statements of the Group for the year ended March 31, 2016, together with the independent auditor’s report thereon, were filed with the Irish Registrar of Companies following the Company’s Annual General Meeting and are also available on the Company’s Website. Statutory financial statements for the year ended March 31, 2016 have been filed with the Companies’ Office. The auditor’s report on those financial statements was unqualified.
The Audit Committee, upon delegation of authority by the Board of Directors, approved the condensed consolidated preliminary financial statements for the year ended March 31, 2017 on May 26, 2017.
Except as stated otherwise below, this period’s financial information has been prepared in accordance with the accounting policies set out in the Group’s most recent published consolidated financial statements, which were prepared in accordance with IFRS as adopted by the EU and also in compliance with IFRS as issued by the International Accounting Standards Board (IASB).
The following new and amended standards, that have been issued by the IASB, and which are effective for the first time for the current financial year beginning on or after January 1, 2016, and have also been endorsed by the EU, have been applied by the Group for the first time in these condensed consolidated financial statements;
• Amendments to IFRS 11: “Accounting for Acquisitions of Interests in Joint Operations” (effective for fiscal periods beginning on or after January 1, 2016)
• Amendments to IAS 16 and IAS 38: “Clarification of Acceptable Methods of Depreciation and Amortisation” (effective for fiscal periods beginning on or after January 1, 2016)
• Amendments to IAS 16 Property, Plant and Equipment and IAS 41 Bearer Plants (effective for fiscal periods beginning on or after January 1, 2016)
• Amendments to IAS 27 Equity method in Separate Financial Statements (effective for fiscal periods beginning on or after January 1, 2016)
• Amendments to IAS 1: “Disclosure Initiative” (effective for fiscal periods beginning on or after January 1, 2016)
9
• “Annual Improvements to IFRSs” 2012-2014 Cycle (effective for fiscal periods beginning on or after January 1, 2016)
• Amendments to IFRS 10, IFRS 12 and IAS 28: “Investment Entities - Exception to Consolidation” (effective for fiscal periods beginning on or after January 1, 2016)
The adoption of these amended standards did not have a material impact on our financial position or results from operations in the year ended March 31, 2017. The following new or revised IFRS standards and IFRIC interpretations will be adopted for purposes of the preparation of future financial statements, where applicable. Those that are not as yet EU endorsed are flagged below. We do not anticipate that the adoption of these new or revised standards and interpretations will have a material impact on our financial position or results from operations:
• IFRS 14: “Regulatory Deferral Accounts” (effective for fiscal periods beginning on or after January 1, 2016)*
• Amendments to IAS 7: “Disclosure Initiative” (effective for fiscal periods beginning on or after January 1, 2017)*
• Amendments to IAS 12: “Recognition of Deferred Tax Assets for Unrealised Losses” (effective for fiscal periods beginning on or after January 1, 2017)*
• IFRS 15: “Revenue from Contracts with Customers including Amendments to IFRS 15” (effective for fiscal periods beginning on or after January 1, 2018)*
• IFRS 9: “Financial Instruments” (effective for fiscal periods beginning on or after January 1, 2018)*
• Clarifications to IFRS 15: “Revenue from Contracts with Customers (effective for fiscal periods beginning on or after January 1, 2018)*
• Amendments to IFRS 2: “Classification and Measurement of Share Based Payment Transactions” (effective for fiscal periods beginning on or after January 1, 2018)*
• Amendments to IFRS 4: Applying IFRS 9 “Financial Instruments” with IFRS 4: “Insurance Contracts” (effective for fiscal periods beginning on or after January 1, 2018)*
• Annual Improvements to IFRS 2014-2016 Cycle (effective for fiscal periods beginning on or after January 1, 2018)*
• IFRIC Interpretation 22: “Foreign Currency Transactions and Advance Consideration” (effective for fiscal periods beginning on or after January 1, 2018)*
• Amendments to IAS 40: “Transfers of Investment Property” (effective for fiscal periods beginning on or after January 1, 2018)*
• IFRS 16: “Leases” (effective for fiscal periods beginning on or after January 1, 2019)*
* These standards or amendments to standards are not as yet EU endorsed.
Exceptional item: The Group presents certain items separately, which are unusual, by virtue of their size and incidence, in the context of our ongoing core operations, as we believe this presentation represents the underlying business more accurately and reflects the manner in which investors typically analyse the results.
10
Any amounts deemed exceptional for management discussion and analysis purposes have been classified for the purposes of the income statement in the same way as non-exceptional amounts of the same nature. The exceptional item in the year ended March 31, 2016 relates to a one-off gain on disposal of our 29.8% shareholding in Aer Lingus.
2. Estimates
The preparation of financial statements requires management to make judgements, estimates and
assumptions that affect the application of accounting policies and the reported amounts of assets and
liabilities, income and expense. Actual results may differ from these estimates.
In preparing these condensed consolidated interim financial statements, the significant judgements made by
management in applying the Group’s accounting policies and the key sources of estimation uncertainty were
the same as those that applied in the most recent published consolidated financial statements.
3. Seasonality of operations
The Group’s results of operations have varied significantly from quarter to quarter, and management
expects these variations to continue. Among the factors causing these variations are the airline industry’s
sensitivity to general economic conditions and the seasonal nature of air travel. Accordingly the first half-
year typically results in higher revenues and results.
4. Income tax expense
The Group’s consolidated effective tax rate in respect of operations for the year ended March 31, 2017 was
10.5% (March 31, 2016: 11.6%). The tax charge for the year ended March 31, 2017 of €154.4M (March 31,
2016: €162.8M) comprises a current tax charge of €143.6M and a deferred tax charge of €10.8M relating to
the temporary differences for property, plant and equipment recognised in the income statement.
5. Share based payments
The terms and conditions of the share option programme are disclosed in the most recent, published,
consolidated financial statements. The charge of €5.7M is the fair value of various share options granted in
current and prior periods, which are being recognised within the income statement in accordance with
employee services rendered.
6. Contingencies
The Group is engaged in litigation arising in the ordinary course of its business. The Group does not believe
that any such litigation will individually, or in aggregate, have a material adverse effect on the financial
condition of the Group. Should the Group be unsuccessful in these litigation actions, management believes
the possible liabilities then arising cannot be determined but are not expected to materially adversely affect
the Group’s results of operations or financial position.
11
7. Capital commitments
At March 31, 2017 Ryanair had an operating fleet of 383 (2016: 341) Boeing 737 aircraft. The Group agreed
to purchase 183 new Boeing 737-800NG aircraft from the Boeing Corporation during the periods Fiscal 2015
to Fiscal 2019 of which 11 aircraft were delivered in the year ended March 31, 2015, 41 were delivered in
the year ended March 31, 2016 and 52 were delivered in the year ended March 31, 2017.
The Group also agreed to purchase up to 200 (100 firm and 100 options) Boeing 737 Max 200 aircraft from
the Boeing Corporation during the periods Fiscal 2020 to Fiscal 2024.
8. Analysis of operating segment
The Group is managed as a single business unit that provides low fares airline-related activities, including
scheduled services, car-hire, internet income and related sales to third parties. The Group operates a single
fleet of aircraft that is deployed through a single route scheduling system.
The Group determines and presents operating segments based on the information that internally is
provided to the CEO, who is the Group’s Chief Operating Decision Maker (CODM). When making resource
allocation decisions the CODM evaluates route revenue and yield data. However, resource allocation
decisions are made based on the entire route network and the deployment of the entire aircraft fleet, which
are uniform in type. The objective in making resource allocation decisions is to maximise consolidated
financial results, rather than individual routes within the network.
The CODM assesses the performance of the business based on the adjusted profit/(loss) after tax of the
Group for the period.
All segment revenue is derived wholly from external customers and as the Group has a single reportable
segment, intersegment revenue is zero.
The Group’s major revenue-generating asset comprises its aircraft fleet, which is flexibly employed across
the Group’s integrated route network and is directly attributable to its reportable segment operations. In
addition, as the Group is managed as a single business unit, all other assets and liabilities have been
allocated to the Group’s single reportable segment.
Reportable segment information is presented as follows: Year Year Ended Ended Mar 31, Mar 31,
2017 2016 €M
€'M
External revenues 6,647.8 6,535.8
Reportable segment profit after income tax (excluding gain on disposal of the available for sale financial asset - FY 2016 only)
1,315.9
1,241.6
At Mar 31, 2017
€M
At Mar 31, 2016
€M Reportable segment assets
11,989.7
11,218.3
12
Reconciliation of reportable segment profit or loss to consolidated profit after income tax is as follows:
Year Year Ended Ended Mar 31, Mar 31, 2017 2016 €M €M
Total adjusted profit for reportable segment 1,315.9 1,241.6 Other items of profit or loss
Gain on disposal of available for sale financial asset - 317.5
Profit for the year – IFRS 1,315.9 1,559.1
9. Earnings per share
Year Year Ended Ended Mar 31, Mar 31, 2017 2016
Basic earnings per ordinary share euro cent 105.30 116.26 Diluted earnings per ordinary share euro cent 104.64 115.63 Weighted average number of ordinary shares (in M’s) – basic 1,249.7 1,341.0 Weighted average number of ordinary shares (in M’s) – diluted 1,257.5 1,348.4
Diluted earnings per share takes account of the potential future exercises of share options granted under the
Company’s share option schemes and the weighted average number of shares includes weighted average
share options assumed to be converted of 7.8M (2016: 7.4M).
10. Property, plant and equipment
Acquisitions and disposals
Capital expenditure in the year to March 31, 2017 amounted to €1,449.8M and primarily relates to aircraft
pre delivery payments and 52 aircraft deliveries.
13
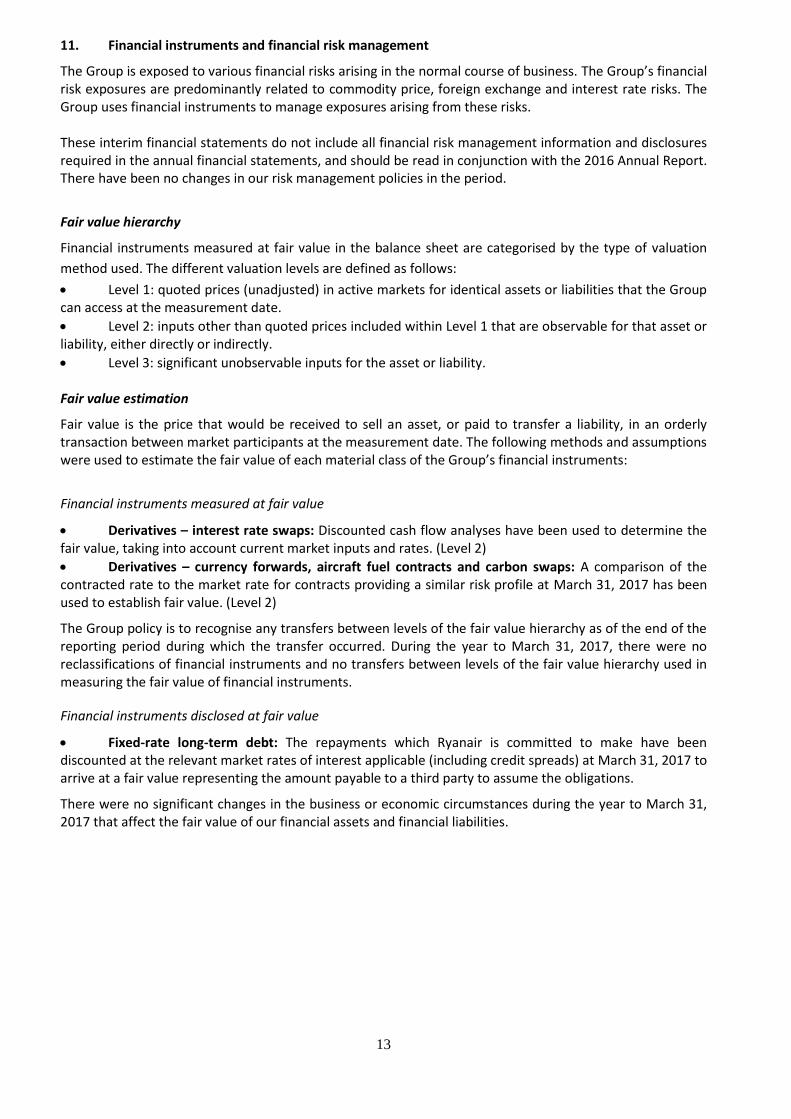
11. Financial instruments and financial risk management
The Group is exposed to various financial risks arising in the normal course of business. The Group’s financial risk exposures are predominantly related to commodity price, foreign exchange and interest rate risks. The Group uses financial instruments to manage exposures arising from these risks. These interim financial statements do not include all financial risk management information and disclosures required in the annual financial statements, and should be read in conjunction with the 2016 Annual Report. There have been no changes in our risk management policies in the period.
Fair value hierarchy
Financial instruments measured at fair value in the balance sheet are categorised by the type of valuation
method used. The different valuation levels are defined as follows:
• Level 1: quoted prices (unadjusted) in active markets for identical assets or liabilities that the Group can access at the measurement date.
• Level 2: inputs other than quoted prices included within Level 1 that are observable for that asset or liability, either directly or indirectly.
• Level 3: significant unobservable inputs for the asset or liability.
Fair value estimation
Fair value is the price that would be received to sell an asset, or paid to transfer a liability, in an orderly transaction between market participants at the measurement date. The following methods and assumptions were used to estimate the fair value of each material class of the Group’s financial instruments:
Financial instruments measured at fair value
• Derivatives – interest rate swaps: Discounted cash flow analyses have been used to determine the fair value, taking into account current market inputs and rates. (Level 2)
• Derivatives – currency forwards, aircraft fuel contracts and carbon swaps: A comparison of the contracted rate to the market rate for contracts providing a similar risk profile at March 31, 2017 has been used to establish fair value. (Level 2)
The Group policy is to recognise any transfers between levels of the fair value hierarchy as of the end of the reporting period during which the transfer occurred. During the year to March 31, 2017, there were no reclassifications of financial instruments and no transfers between levels of the fair value hierarchy used in measuring the fair value of financial instruments.
Financial instruments disclosed at fair value
• Fixed-rate long-term debt: The repayments which Ryanair is committed to make have been discounted at the relevant market rates of interest applicable (including credit spreads) at March 31, 2017 to arrive at a fair value representing the amount payable to a third party to assume the obligations.
There were no significant changes in the business or economic circumstances during the year to March 31, 2017 that affect the fair value of our financial assets and financial liabilities.
14
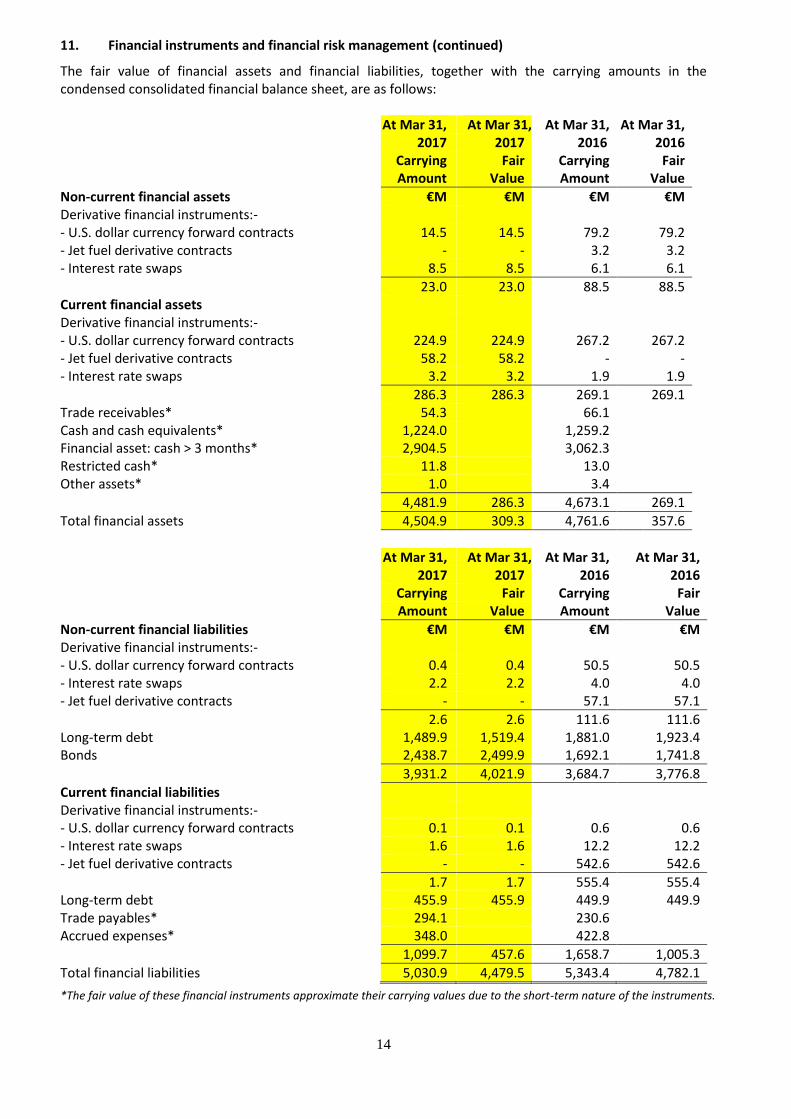
11. Financial instruments and financial risk management (continued)
The fair value of financial assets and financial liabilities, together with the carrying amounts in the condensed consolidated financial balance sheet, are as follows: At Mar 31, At Mar 31, At Mar 31, At Mar 31, 2017 2017 2016 2016 Carrying Fair Carrying Fair Amount Value Amount Value
Non-current financial assets €M €M €M €M Derivative financial instruments:- - U.S. dollar currency forward contracts 14.5 14.5 79.2 79.2 - Jet fuel derivative contracts - - 3.2 3.2 - Interest rate swaps 8.5 8.5 6.1 6.1
23.0 23.0 88.5 88.5
Current financial assets Derivative financial instruments:- - U.S. dollar currency forward contracts 224.9 224.9 267.2 267.2 - Jet fuel derivative contracts 58.2 58.2 - - - Interest rate swaps 3.2 3.2 1.9 1.9
286.3 286.3 269.1 269.1 Trade receivables* 54.3 66.1 Cash and cash equivalents* 1,224.0 1,259.2 Financial asset: cash > 3 months* 2,904.5 3,062.3 Restricted cash* 11.8 13.0 Other assets* 1.0 3.4
4,481.9 286.3 4,673.1 269.1
Total financial assets 4,504.9 309.3 4,761.6 357.6
At Mar 31, At Mar 31, At Mar 31, At Mar 31, 2017 2017 2016 2016 Carrying Fair Carrying Fair Amount Value Amount Value
Non-current financial liabilities €M €M €M €M Derivative financial instruments:- - U.S. dollar currency forward contracts 0.4 0.4 50.5 50.5 - Interest rate swaps 2.2 2.2 4.0 4.0 - Jet fuel derivative contracts - - 57.1 57.1
2.6 2.6 111.6 111.6 Long-term debt 1,489.9 1,519.4 1,881.0 1,923.4 Bonds 2,438.7 2,499.9 1,692.1 1,741.8
3,931.2 4,021.9 3,684.7 3,776.8
Current financial liabilities Derivative financial instruments:- - U.S. dollar currency forward contracts 0.1 0.1 0.6 0.6 - Interest rate swaps 1.6 1.6 12.2 12.2 - Jet fuel derivative contracts - - 542.6 542.6
1.7 1.7 555.4 555.4 Long-term debt 455.9 455.9 449.9 449.9 Trade payables* 294.1 230.6 Accrued expenses* 348.0 422.8
1,099.7 457.6 1,658.7 1,005.3
Total financial liabilities 5,030.9 4,479.5 5,343.4 4,782.1
*The fair value of these financial instruments approximate their carrying values due to the short-term nature of the instruments.
15
12. Shareholder returns
In the year ended March 31, 2017 the Company bought back 36.0M shares at a total cost of approximately
€468M under its €886M share buyback programme which commenced in February 2016. This buyback was
equivalent to approximately 2.8% of the Company’s issued share capital at March 31, 2016. All of these
ordinary shares repurchased were cancelled at March 31, 2017.
In addition to the above, in the year ended March 31, 2017, the Company bought back 36.3M shares at a
total cost of approximately €550M under its €550M share buyback programme which was announced and
commenced in November 2016. This buyback was equivalent to approximately 2.8% of the Company’s
issued share capital at March 31, 2016. All of these ordinary shares repurchased were cancelled at March 31,
2017.
In the year ended March 31, 2016, the Company bought back 24.6M ordinary shares at a total cost of €288M
under its €400M share buyback programme which commenced in February 2015 and ended in August 2015
and 29.1M ordinary shares at a total cost of approximately €418M under its €886M share buyback which
commenced in February 2016. These were equivalent to approximately 3.9% of the Company’s issued share
capital at March 31, 2015. 53.2M of these ordinary shares repurchased were cancelled at March 31, 2016.
The remaining 0.5M ordinary shares were cancelled on April 1, 2016.
As a result of the share buybacks, in the year ended March 31, 2017, share capital decreased by 72.3M
ordinary shares (53.2M ordinary shares in the year ended March 31, 2016) with a nominal value of €0.4M
(€0.3M in the year ended March 31,2016) and the capital redemption reserve increased by a corresponding
€0.4M (€0.3M in the year ended March 31, 2016). The capital redemption reserve is required to be created
under Irish law to preserve permanent capital in the Parent Company.
In addition to the above, the Company returned €398M to shareholders via a B Share scheme in November
2015, and completed a capital reorganisation which involved the consolidation of its ordinary share capital
on a 39 for 40 basis which resulted in the reduction of ordinary shares in issue by 33.8M ordinary shares to
1,319.3M. The nominal value of an ordinary share was also reduced from 0.635 euro cent each to 0.600 euro
cent each under the reorganisation. All ‘B’ Shares and Deferred Shares issued in connection with the B Share
scheme were either redeemed or cancelled during the financial year ended March 31, 2016, such that there
were no ‘B’ Shares or Deferred Shares remaining in issue as at March 31, 2016.
13. Related party transactions
The Company has related party relationships with its subsidiaries, directors and senior key management
personnel. All transactions with subsidiaries eliminate on consolidation and are not disclosed.
There were no related party transactions in the year ended March 31, 2017 that materially affected the
financial position or the performance of the Company during that period and there were no changes in the
related party transactions described in the 2016 Annual Report that could have a material effect on the
financial position or performance of the Company in the same period.
14. Post balance sheet events
There were no significant post balance sheet events.


![Porters 5 [Ryanair]](https://static.fdocuments.us/doc/165x107/55cf8548550346484b8c553e/porters-5-ryanair.jpg)