EU RICE MARKET - Agro-alimentarias · XXII Jornadas del Arroz Zaragoza (Spain) 9th March 2016 EU...
26
XXII Jornadas del Arroz Zaragoza (Spain) 9 th March 2016 EU RICE MARKET Damien PLAN European Commission DG AGRI
-
Upload
phungxuyen -
Category
Documents
-
view
214 -
download
0
Transcript of EU RICE MARKET - Agro-alimentarias · XXII Jornadas del Arroz Zaragoza (Spain) 9th March 2016 EU...
XXII Jornadas del Arroz Zaragoza (Spain)
9th March 2016
EU RICE MARKET
Damien PLAN European Commission
DG AGRI
Contents
1. EU Rice - Overview
2. EU Rice Trade – Imports/Exports
3. EU Rice Market – 2015/16 situation
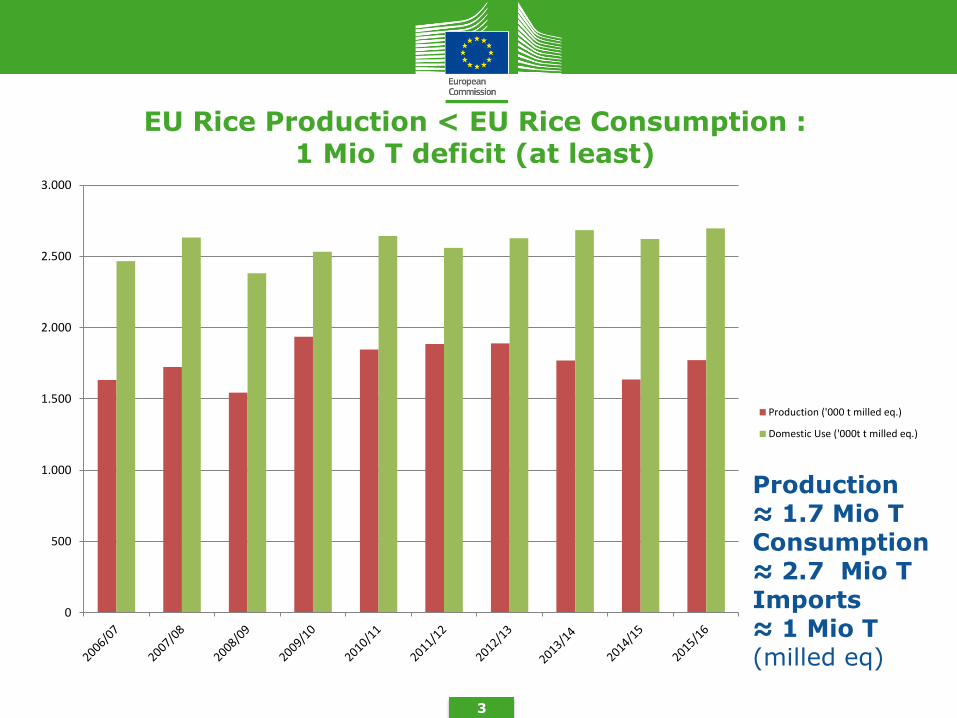
EU Rice Production < EU Rice Consumption : 1 Mio T deficit (at least)
3
Production ≈ 1.7 Mio T Consumption ≈ 2.7 Mio T Imports ≈ 1 Mio T (milled eq)
0
500
1.000
1.500
2.000
2.500
3.000
Production ('000 t milled eq.)
Domestic Use ('000t t milled eq.)
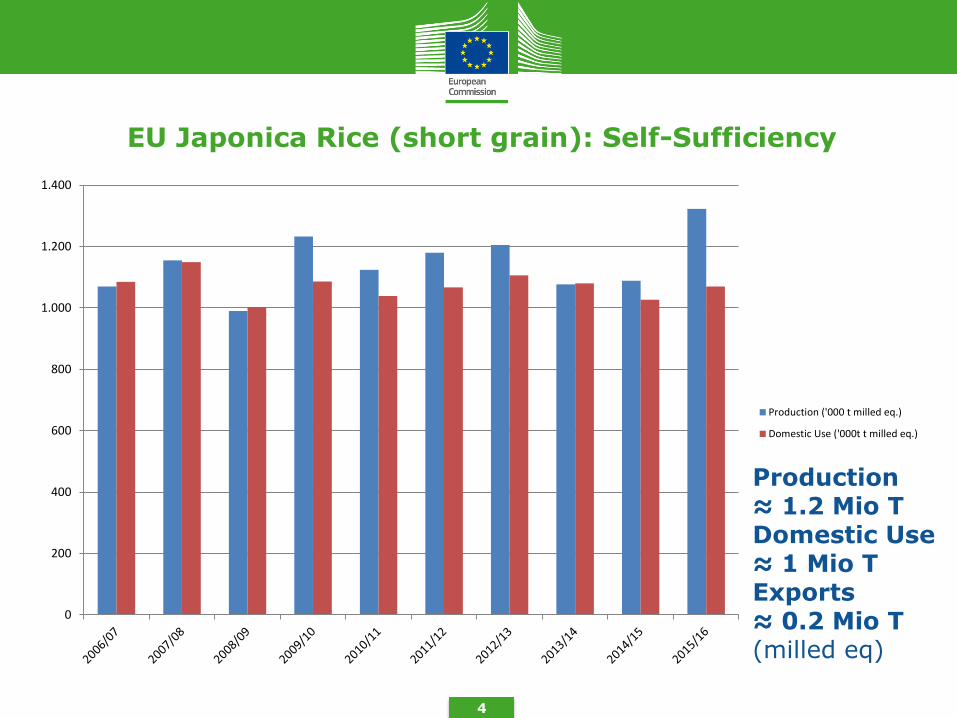
EU Japonica Rice (short grain): Self-Sufficiency
4
Production ≈ 1.2 Mio T Domestic Use ≈ 1 Mio T Exports ≈ 0.2 Mio T (milled eq)
0
200
400
600
800
1.000
1.200
1.400
Production ('000 t milled eq.)
Domestic Use ('000t t milled eq.)
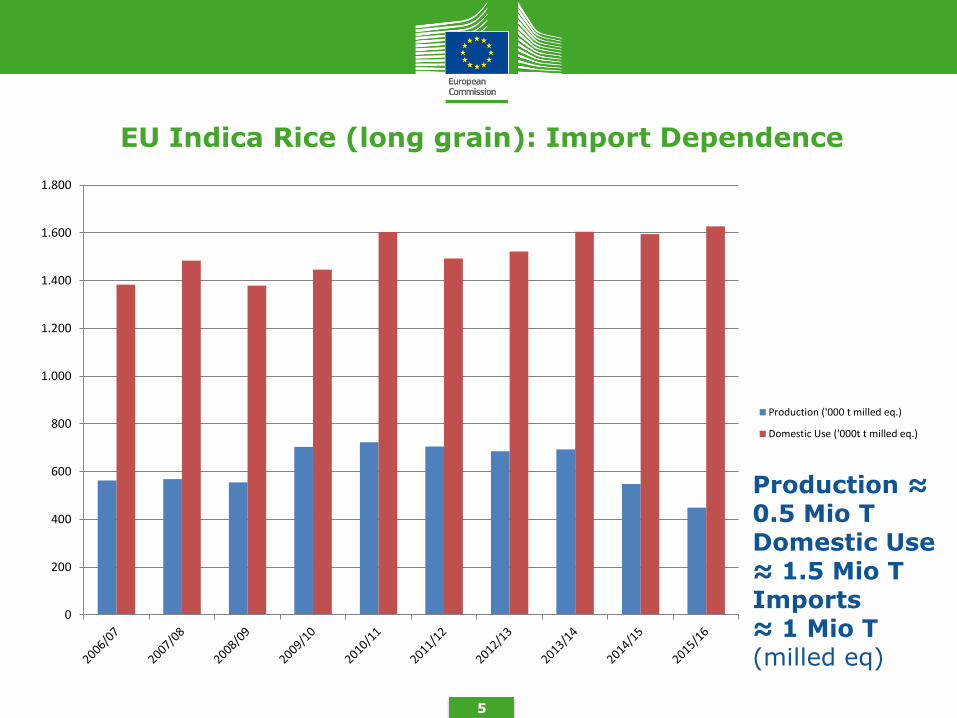
EU Indica Rice (long grain): Import Dependence
5
Production ≈ 0.5 Mio T Domestic Use ≈ 1.5 Mio T Imports ≈ 1 Mio T (milled eq)
0
200
400
600
800
1.000
1.200
1.400
1.600
1.800
Production ('000 t milled eq.)
Domestic Use ('000t t milled eq.)
Contents
1. EU Rice - Overview
2. EU Rice Trade – Imports/Exports
3. EU Rice Market – 2015/16 situation
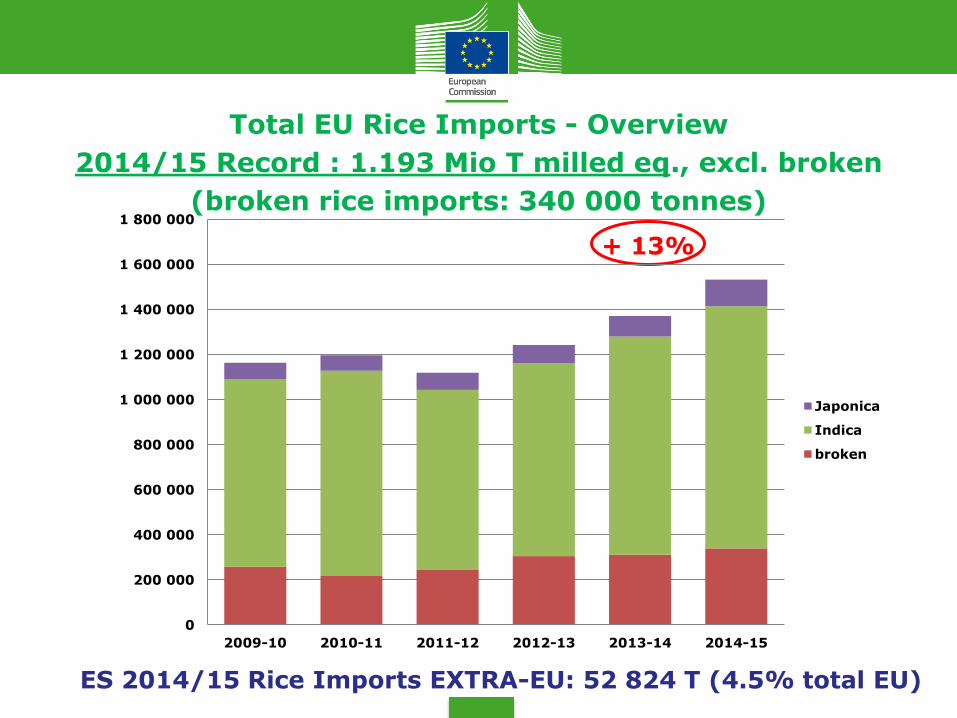
Total EU Rice Imports Imports – overview Total EU Rice Imports - Overview
2014/15 Record : 1.193 Mio T milled eq., excl. broken
(broken rice imports: 340 000 tonnes)
+ 13%
ES 2014/15 Rice Imports EXTRA-EU: 52 824 T (4.5% total EU)
0
200 000
400 000
600 000
800 000
1 000 000
1 200 000
1 400 000
1 600 000
1 800 000
2009-10 2010-11 2011-12 2012-13 2013-14 2014-15
Japonica
Indica
broken
8
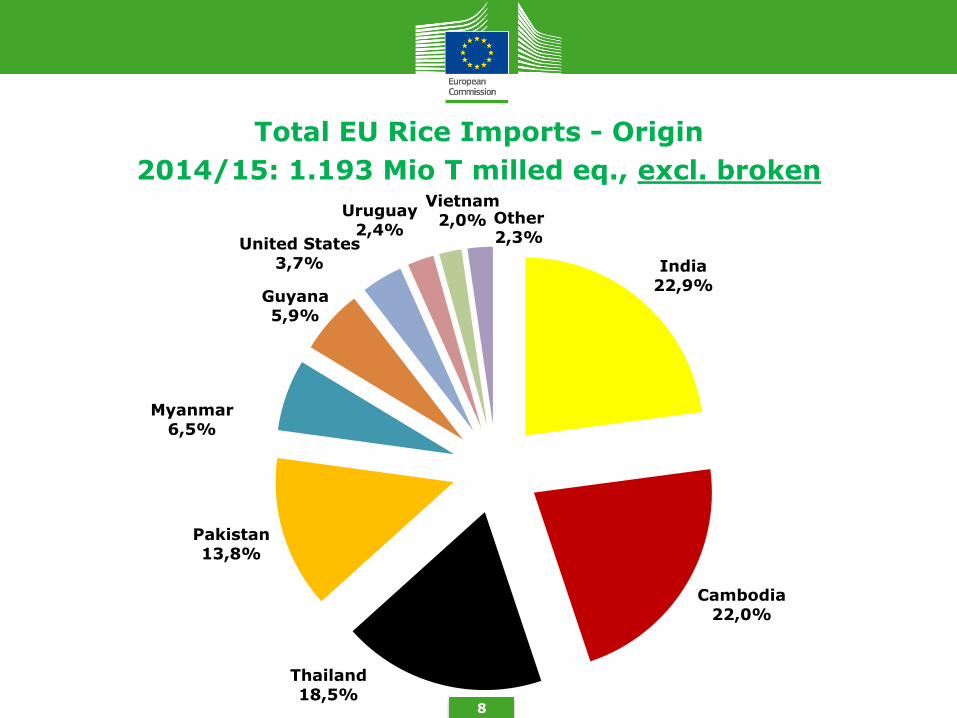
Total EU Rice Imports - Origin
2014/15: 1.193 Mio T milled eq., excl. broken
India 22,9%
Cambodia 22,0%
Thailand 18,5%
Pakistan 13,8%
Myanmar 6,5%
Guyana 5,9%
United States 3,7%
Uruguay 2,4%
Vietnam 2,0% Other
2,3%
9
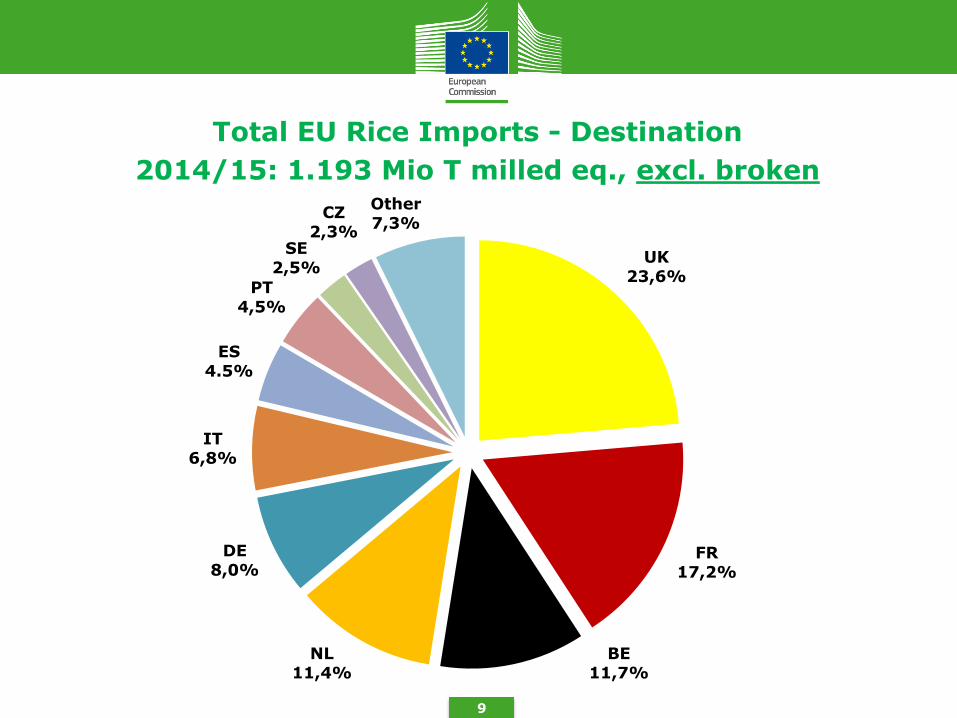
Total EU Rice Imports - Destination
2014/15: 1.193 Mio T milled eq., excl. broken
UK 23,6%
FR 17,2%
BE 11,7%
NL 11,4%
DE 8,0%
IT 6,8%
ES 4.5%
PT 4,5%
SE 2,5%
CZ 2,3%
Other 7,3%
-
100.000
200.000
300.000
400.000
500.000
600.000
2009/10 2010/11 2011/12 2012/13 2013/14 2014/15
in t
on
nes
mill
ed e
q.
paddy husked milled / semi-milled broken
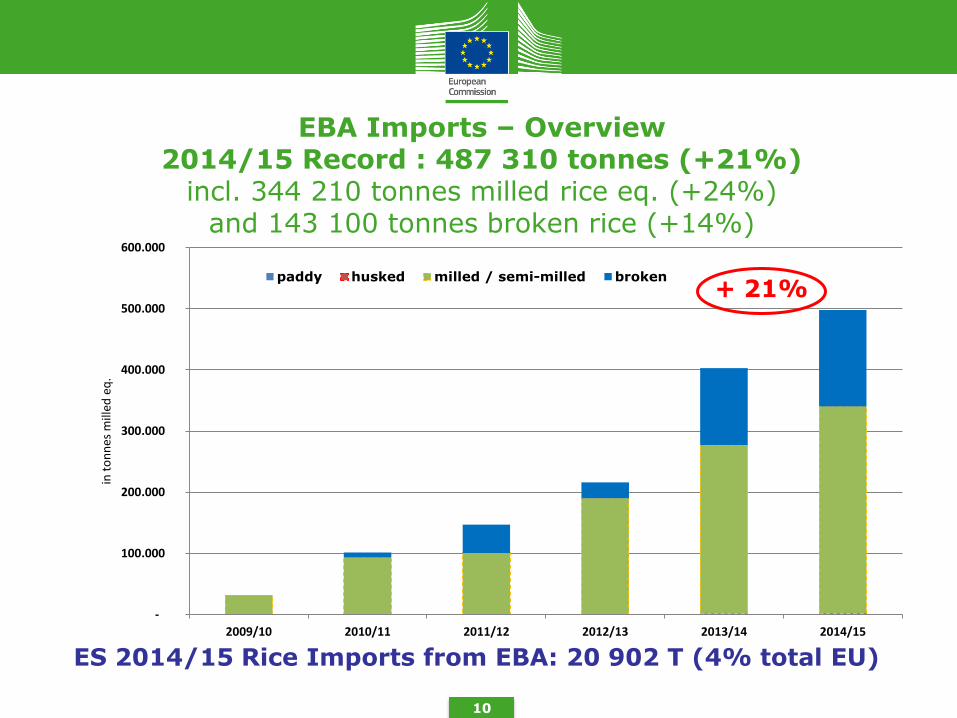
ES 2014/15 Rice Imports from EBA: 20 902 T (4% total EU)
EBA Imports – Overview 2014/15 Record : 487 310 tonnes (+21%)
incl. 344 210 tonnes milled rice eq. (+24%) and 143 100 tonnes broken rice (+14%)
10
+ 21%
11
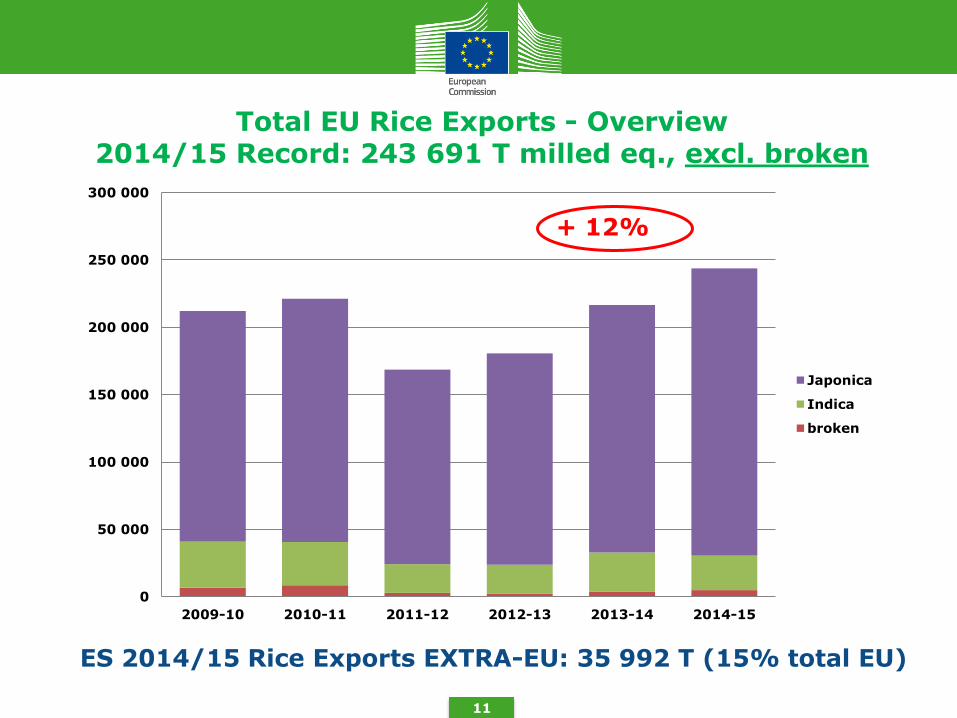
Total EU Rice Exports - Overview 2014/15 Record: 243 691 T milled eq., excl. broken
0
50 000
100 000
150 000
200 000
250 000
300 000
2009-10 2010-11 2011-12 2012-13 2013-14 2014-15
Japonica
Indica
broken
+ 12%
ES 2014/15 Rice Exports EXTRA-EU: 35 992 T (15% total EU)
12
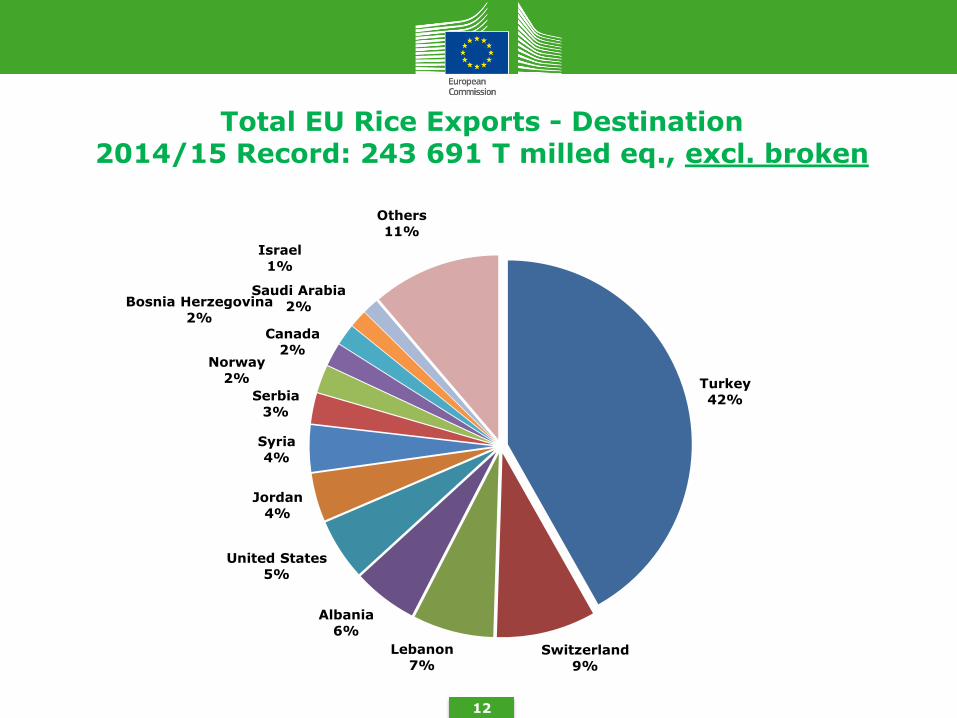
Turkey
42%
Switzerland
9%
Lebanon
7%
Albania
6%
United States
5%
Jordan
4%
Syria
4%
Serbia
3%
Norway
2%
Canada
2%
Bosnia Herzegovina
2%
Saudi Arabia
2%
Israel
1%
Others
11%
Total EU Rice Exports - Destination 2014/15 Record: 243 691 T milled eq., excl. broken
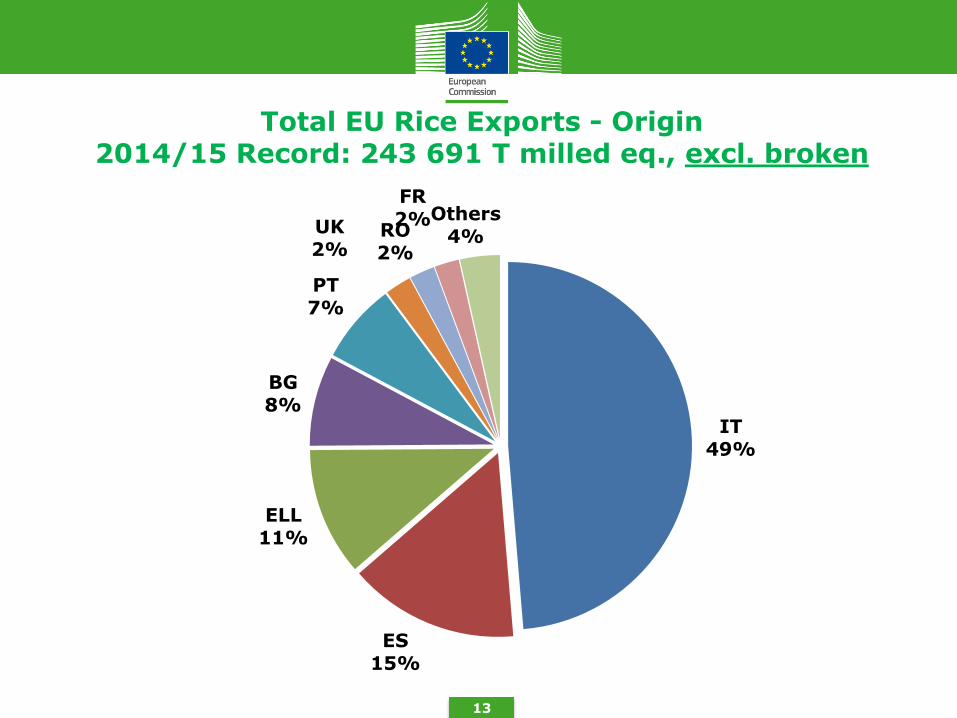
Total EU Rice Exports - Origin 2014/15 Record: 243 691 T milled eq., excl. broken
13
IT 49%
ES 15%
ELL 11%
BG 8%
PT
7%
UK 2%
RO 2%
FR
2% Others 4%
Contents
1. EU Rice - Overview
2. EU Rice Trade – Imports/Exports
3. EU Rice Market – 2015/16 situation
-
100
200
300
400
500
600
2009/10 2010/11 2011/12 2012/13 2013/14 2014/15 2015/16
Are
a (
'00
0 h
a)
Japonica Indica Total
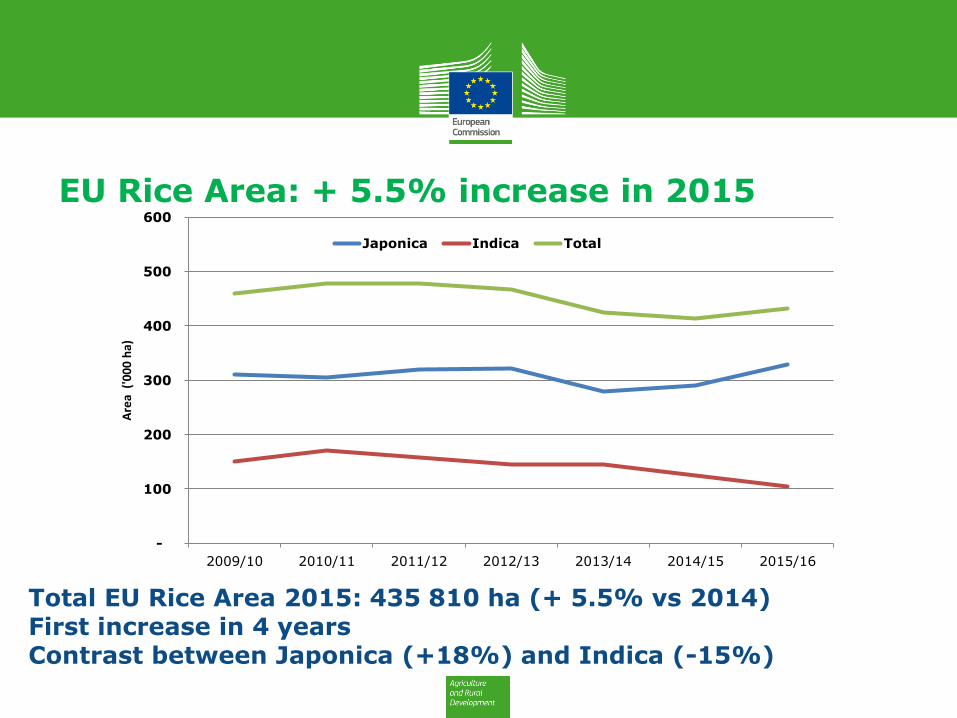
EU Rice Area: + 5.5% increase in 2015
15
Total EU Rice Area 2015: 435 810 ha (+ 5.5% vs 2014) First increase in 4 years Contrast between Japonica (+18%) and Indica (-15%)
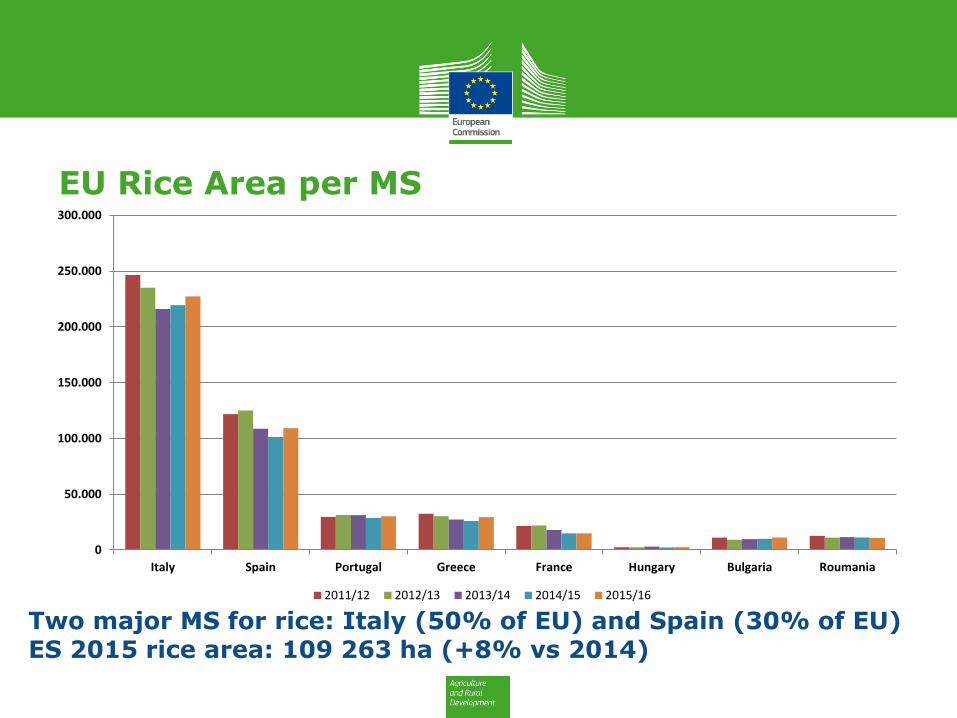
EU Rice Area per MS
16
Two major MS for rice: Italy (50% of EU) and Spain (30% of EU) ES 2015 rice area: 109 263 ha (+8% vs 2014)
0
50.000
100.000
150.000
200.000
250.000
300.000
Italy Spain Portugal Greece France Hungary Bulgaria Roumania
2011/12 2012/13 2013/14 2014/15 2015/16
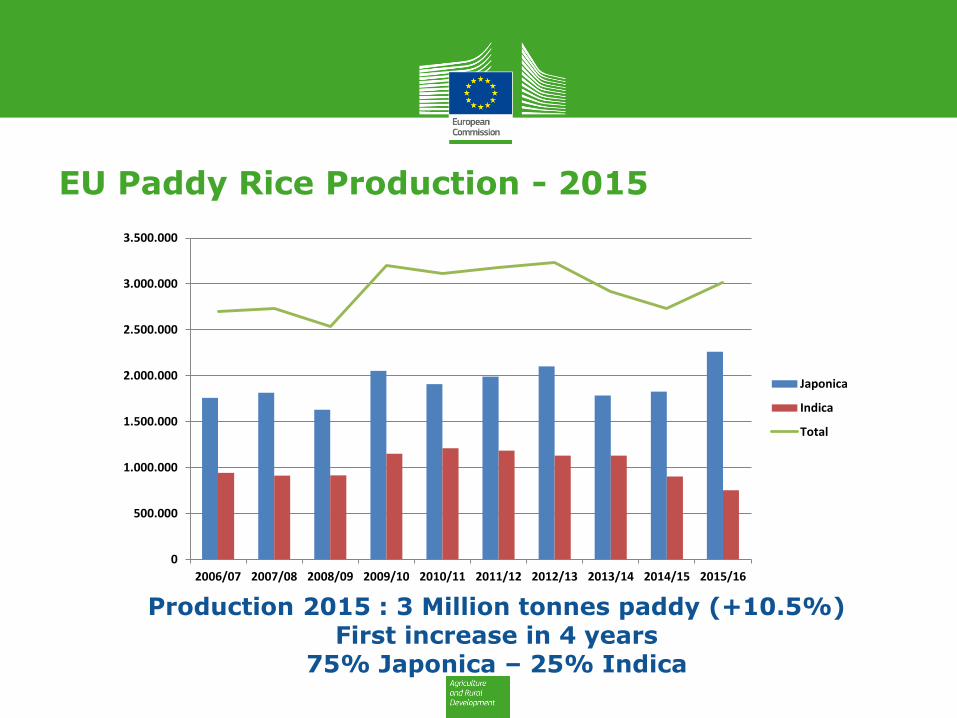
EU Paddy Rice Production - 2015
0
500.000
1.000.000
1.500.000
2.000.000
2.500.000
3.000.000
3.500.000
2006/07 2007/08 2008/09 2009/10 2010/11 2011/12 2012/13 2013/14 2014/15 2015/16
Japonica
Indica
Total
Production 2015 : 3 Million tonnes paddy (+10.5%) First increase in 4 years
75% Japonica – 25% Indica
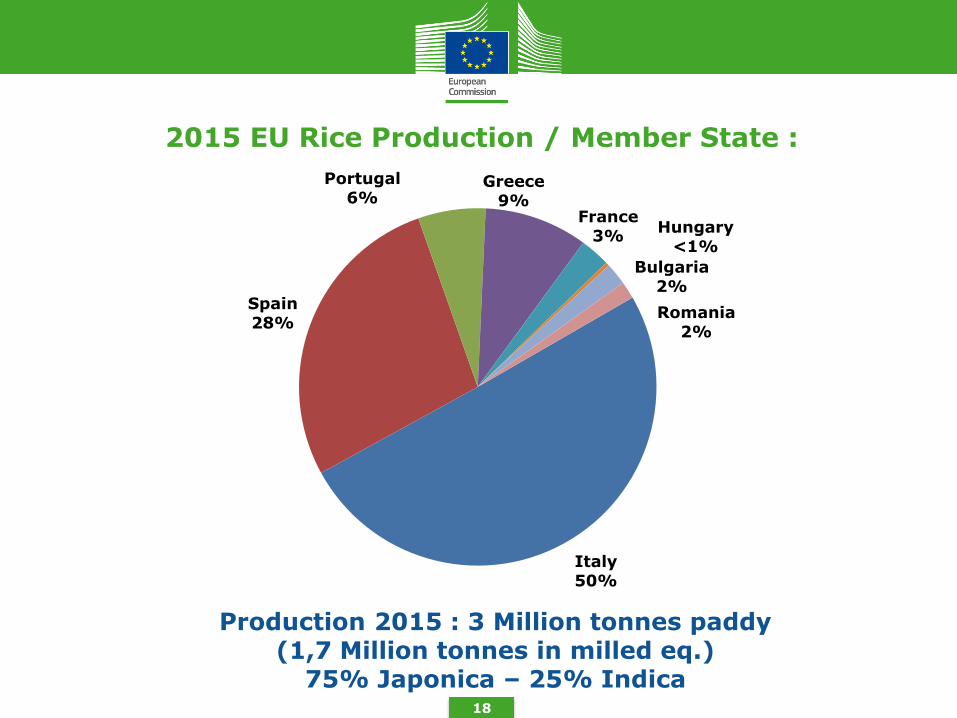
2015 EU Rice Production / Member State :
18
Production 2015 : 3 Million tonnes paddy (1,7 Million tonnes in milled eq.)
75% Japonica – 25% Indica
Italy 50%
Spain 28%
Portugal 6%
Greece 9%
France 3%
Hungary <1%
Bulgaria 2%
Romania 2%
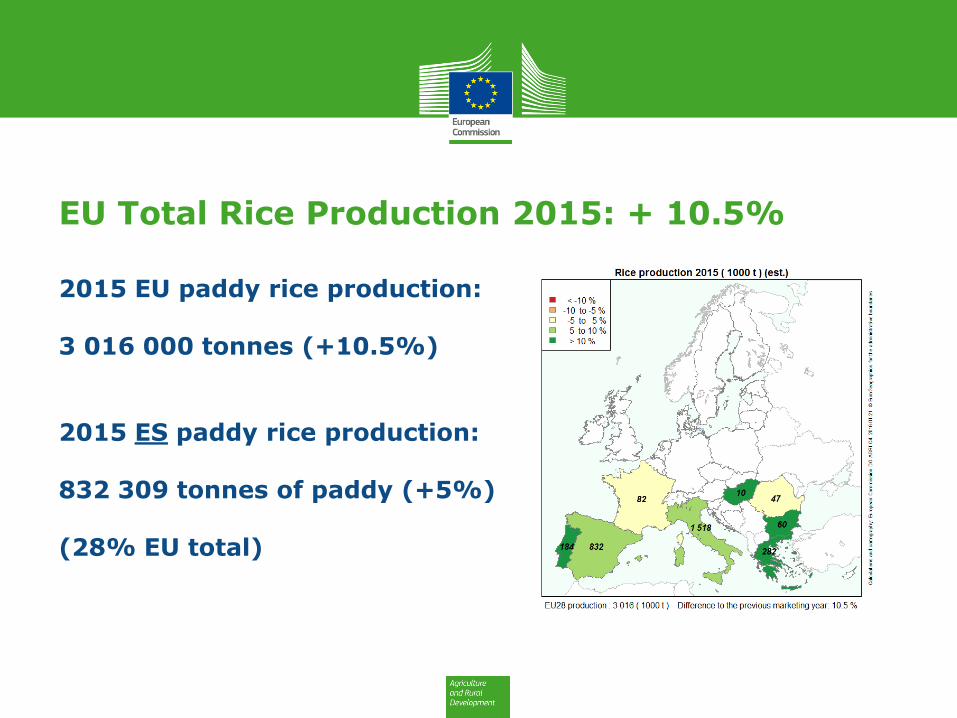
EU Total Rice Production 2015: + 10.5%
2015 EU paddy rice production: 3 016 000 tonnes (+10.5%) 2015 ES paddy rice production: 832 309 tonnes of paddy (+5%) (28% EU total)
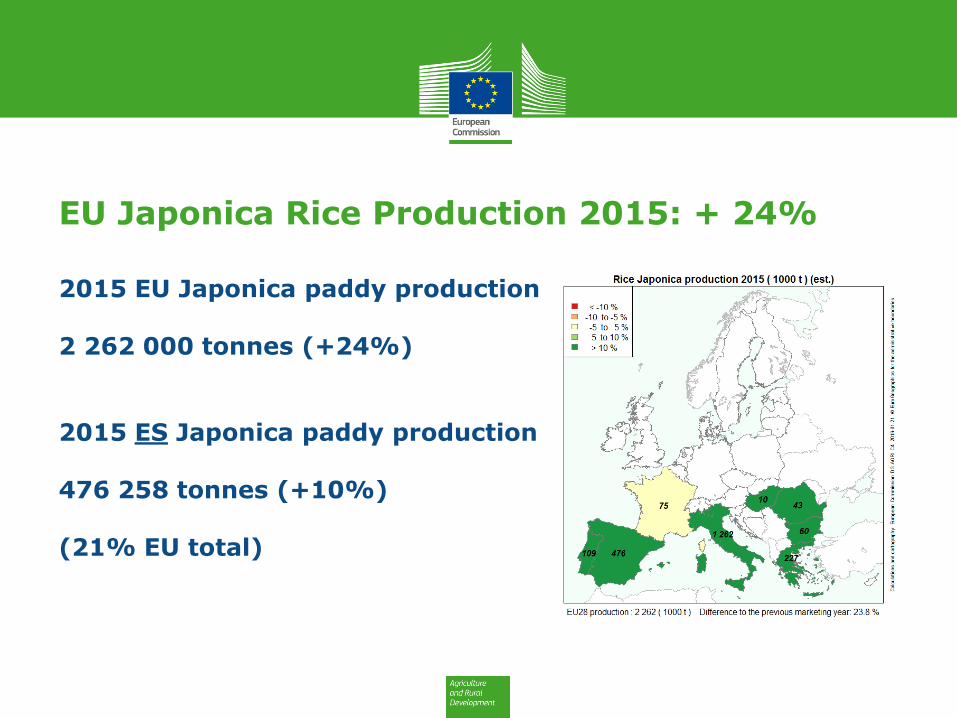
EU Japonica Rice Production 2015: + 24%
2015 EU Japonica paddy production : 2 262 000 tonnes (+24%) 2015 ES Japonica paddy production : 476 258 tonnes (+10%) (21% EU total)
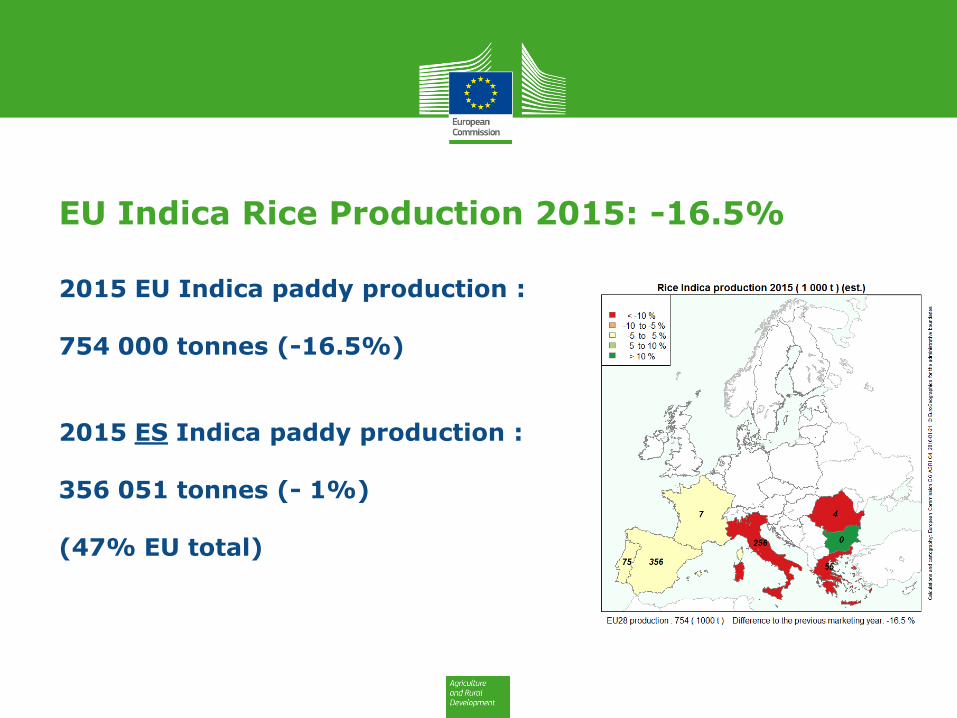
EU Indica Rice Production 2015: -16.5%
2015 EU Indica paddy production : 754 000 tonnes (-16.5%) 2015 ES Indica paddy production : 356 051 tonnes (- 1%) (47% EU total)

Spanish Paddy Rice Production
2015/16: 832 309 tonnes of paddy (+5%) Japonica: 476 258 tonnes (+ 10% vs 2014) – 57% of ES total Indica: 356 051 tonnes (- 1% vs 2014) – 43% of ES total
0
100.000
200.000
300.000
400.000
500.000
600.000
2006/07 2007/08 2008/09 2009/10 2010/11 2011/12 2012/13 2013/14 2014/15 2015/16
Japonica
Indica
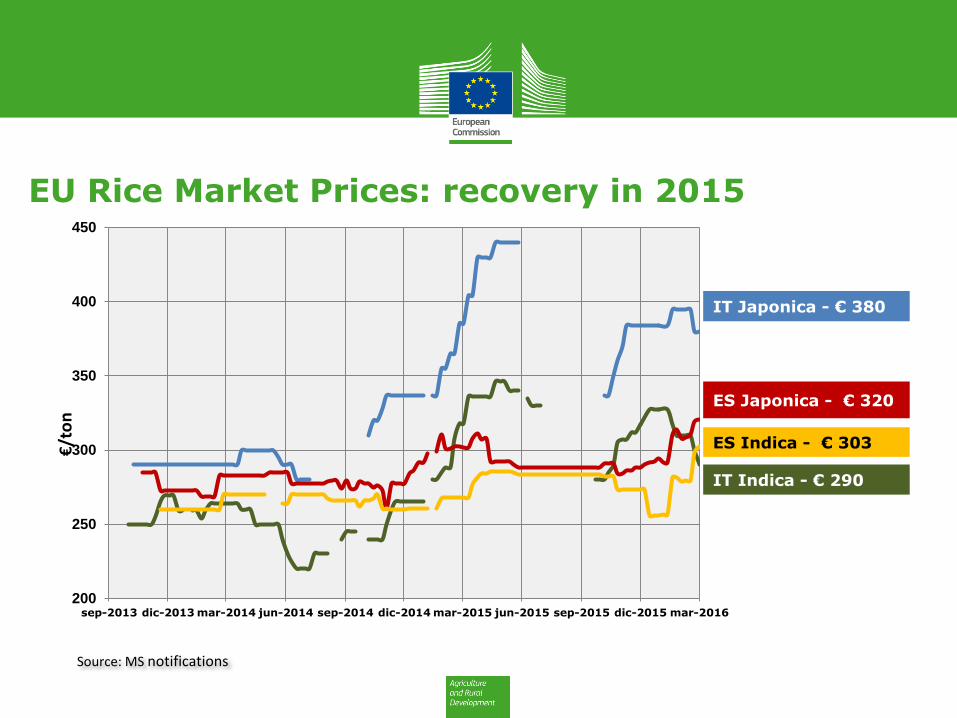
EU Rice Market Prices: recovery in 2015
200
250
300
350
400
450
sep-2013 dic-2013 mar-2014 jun-2014 sep-2014 dic-2014 mar-2015 jun-2015 sep-2015 dic-2015 mar-2016
€/t
on
Source: MS notifications
IT Japonica - € 380
IT Indica - € 290
ES Japonica - € 320
ES Indica - € 303
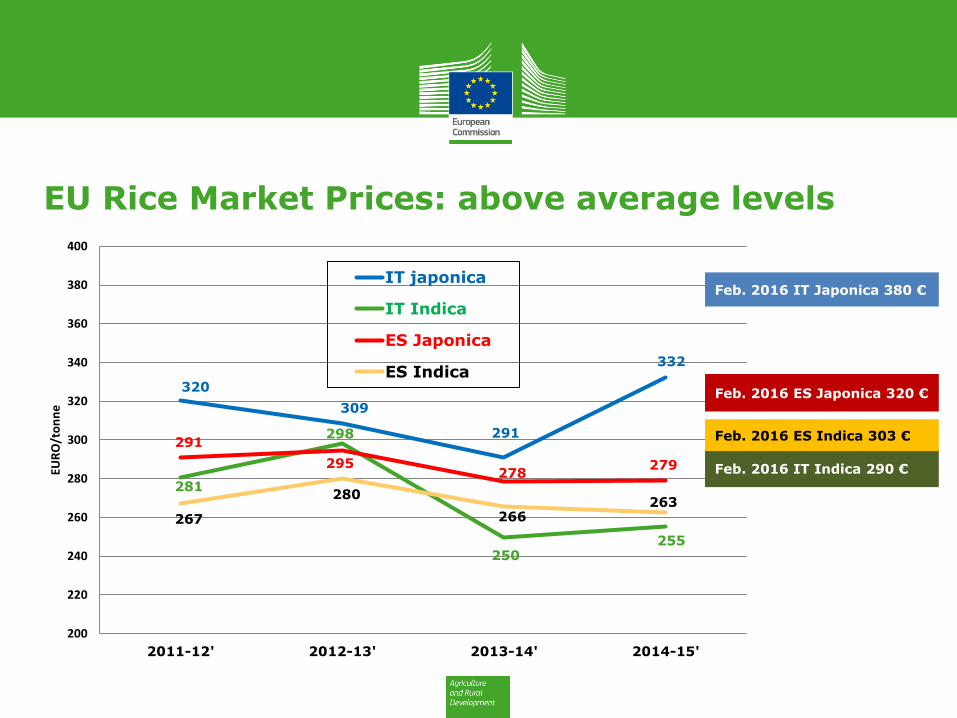
EU Rice Market Prices: above average levels
320
309
291
332
281
298
250 255
291
295 278
279
267
280
266 263
200
220
240
260
280
300
320
340
360
380
400
2011-12' 2012-13' 2013-14' 2014-15'
EUR
O/t
on
ne
IT japonica
IT Indica
ES Japonica
ES Indica
Feb. 2016 ES Japonica 320 €
Feb. 2016 IT Indica 290 €
Feb. 2016 ES Indica 303 €
Feb. 2016 IT Japonica 380 €
Conclusions
• EU Rice Market 2015:
• EU paddy prices recovery (tight supply/demand early 2015)
• Good year for EU rice production : high area + good yields; sharp contrast Japonica (+24%) – Indica (-17%)
• Record year for EU rice trade (record imports of Indica, record exports of Japonica)
• EU Rice Market 2016:
• Supply: high (Japonica: high production, Indica: high imports)
• Demand: to be seen (in particular Japonica exports)
• Prices: still above average levels

Thank you for your attention
More information at: http://ec.europa.eu/agriculture/cereals/index_en.htm
Follow-up: