EU Market Situation for Eggs Committee for the Common ... · Common Organisation of the...
27
EU Market Situation for Eggs Committee for the Common Organisation of the Agricultural Markets 17 May 2018
Transcript of EU Market Situation for Eggs Committee for the Common ... · Common Organisation of the...

EU Market Situation
for Eggs
Committee for the
Common Organisation of the Agricultural
Markets
17 May 2018

F O R E C A S T
EU market situation for Eggs 17 May 2018
Source : Experts WG
2016 2017 2018 %2017/2016 %2018/2017
FR 956 000 994 000 985 000 4.0 -0.9
DE 880 000 890 000 912 000 1.1 2.5
ES 814 000 773 800 839 900 -4.9 8.5
IT 840 000 808 000 833 000 -3.8 3.1
UK 780 800 762 400 777 600 -2.4 2.0
NL 715 000 684 000 716 000 -4.3 4.7
PL 603 500 607 500 622 500 0.7 2.5
RO 360 000 320 000 360 000 -11.1 12.5
BE 200 000 200 000 200 000 0.0 0.0
CZ 161 200 174 700 175 000 8.4 0.2
HU 147 300 149 370 151 650 1.4 1.5
PT 134 000 135 000 136 000 0.7 0.7
SE 134 000 134 000 134 000 0.0 0.0
EL 128 000 128 000 128 000 0.0 0.0
AT 115 180 115 880 115 950 0.6 0.1
BG 94 000 94 000 94 000 0.0 0.0
DK 82 000 84 200 86 800 2.7 3.1
FI 71 500 74 000 75 000 3.5 1.4
IE 45 000 70 180 73 200 56.0 4.3
SK 71 000 71 000 71 000 0.0 0.0
LT 51 700 50 000 51 000 -3.3 2.0
LV 42 200 42 200 42 200 0.0 0.0
HR 35 090 41 090 41 090 17.1 0.0
SI 20 400 21 000 21 000 2.9 0.0
CY 10 100 10 000 10 100 -1.0 1.0
EE 9 800 9 800 9 800 0.0 0.0
EU 7 148 870 7 131 220 7 308 890 -0.2 2.5
EU average without Romania
EU production of total eggs (expert forecast May 2018)
Qty in Tonnes % change

EU market situation for Eggs 17 May 2018
Enr. Cage211 28453.2%
Free range60 60915.3%
Barn105 36326.5%
Organic
20 0915.1%
Number of Laying Hens 2017by way of keeping
based on the EU Member States that communicated data
according to Commission Implementing Regulation (EC) 2017/1185
MS communicated data(MT prel number)
Total not in cage186 063 610 laying hens = 46,8%
Total Enr. cage
211 283 874 laying hens = 53,2%
Total Laying Hens397 347 484 laying hens

L A Y I N G H E N S
EU market situation for Eggs 17 May 2018
17.05.2018
(NOMBRE POULES)
AGRI G3 Moyenne poules pondeuses présentes par type d'élevage
Average number of laying hens
R. 2017/1185, Art. 12(b) - Annex III.10
% enriched % free range % Barn % Organic
/ total enriched / total free range / total Barn / total Organic
BE 3 699 795 39.3% 1 298 505 13.8% 4 007 687 42.6% 412 445 4.4% 9 418 433 2.4% 5 718 638 9 418 433 60.7%
BG 2 703 935 56.5% 171 964 3.6% 1 912 787 39.9% 0 0.0% 4 788 687 1.2% 2 084 751 4 788 687 43.5%
CZ 4 876 207 84.0% 8 900 0.2% 905 428 15.6% 16 350 0.3% 5 806 886 1.5% 930 678 5 806 886 16.0%
DK 865 188 19.6% 371 571 8.4% 1 864 655 42.1% 1 322 927 29.9% 4 424 342 1.1% 3 559 154 4 424 342 80.4%
DE 3 631 054 6.9% 9 764 018 18.5% 33 163 317 63.0% 6 096 269 11.6% 52 654 659 13.3% 49 023 605 52 654 659 93.1%
EE 907 942 86.3% 31 448 3.0% 76 401 7.3% 36 089 3.4% 1 051 881 0.3% 143 938 1 051 881 13.7%
IE 1 881 394 54.2% 1 445 790 41.7% 37 871 1.1% 105 609 3.0% 3 470 665 0.9% 1 589 270 3 470 665 45.8%
EL 3 631 413 84.4% 123 501 2.9% 418 051 9.7% 127 347 3.0% 4 300 313 1.1% 668 899 4 300 313 15.6%
ES 41 046 685 87.8% 2 531 860 5.4% 2 822 867 6.0% 331 505 0.7% 46 732 918 11.8% 5 686 232 46 732 918 12.2%
FR 31 806 415 64.8% 9 857 493 20.1% 3 134 536 6.4% 4 247 725 8.7% 49 046 170 12.4% 17 239 754 49 046 170 35.2%
HR 1 358 702 73.1% 29 652 1.6% 468 691 25.2% 699 0.0% 1 857 745 0.5% 499 042 1 857 745 26.9%
IT 21 597 438 61.8% 956 554 2.7% 10 881 049 31.1% 1 528 615 4.4% 34 963 657 8.8% 13 366 218 34 963 657 38.2%
CY 325 318 71.7% 44 732 9.9% 73 773 16.3% 9 664 2.1% 453 488 0.1% 128 169 453 488 28.3%
LV 2 447 954 86.5% 46 116 1.6% 333 685 11.8% 1 520 0.1% 2 829 276 0.7% 381 321 2 829 276 13.5%
LT 2 670 443 95.7% 2 252 0.1% 107 193 3.8% 10 650 0.4% 2 790 539 0.7% 120 095 2 790 539 4.3%
LU 0 0.0% 12 000 10.5% 90 200 79.0% 12 000 10.5% 114 201 0.0% 114 201 114 201 100.0%
HU 4 423 666 63.4% 45 860 0.7% 2 478 990 35.5% 26 670 0.4% 6 975 187 1.8% 2 551 520 6 975 187 36.6%
MT 0 0 0 0 0 0.0% 0 0
NL 6 234 000 18.2% 5 487 000 16.0% 20 608 000 60.0% 1 997 000 5.8% 34 326 001 8.6% 28 092 001 34 326 001 81.8%
AT 61 622 0.9% 1 499 623 22.3% 4 377 351 65.0% 794 888 11.8% 6 733 485 1.7% 6 671 863 6 733 485 99.1%
PL 40 182 119 86.8% 1 493 022 3.2% 4 441 954 9.6% 152 815 0.3% 46 269 911 11.7% 6 087 791 46 269 911 13.2%
PT 8 556 836 92.7% 148 056 1.6% 470 322 5.1% 50 698 0.5% 9 225 913 2.3% 669 076 9 225 913 7.3%
RO 4 779 611 59.9% 281 809 3.5% 2 863 960 35.9% 58 744 0.7% 7 984 125 2.0% 3 204 513 7 984 125 40.1%
SI 687 110 57.3% 38 882 3.2% 448 693 37.4% 24 336 2.0% 1 199 022 0.3% 511 911 1 199 022 42.7%
SK 2 601 903 84.5% 23 280 0.8% 447 608 14.5% 5 334 0.2% 3 078 126 0.8% 476 222 3 078 126 15.5%
FI 2 591 251 60.0% 129 905 3.0% 1 369 175 31.7% 231 267 5.4% 4 321 599 1.1% 1 730 347 4 321 599 40.0%
SE 988 488 12.3% 244 461 3.0% 5 474 563 67.9% 1 353 469 16.8% 8 060 982 2.0% 7 072 494 8 060 982 87.7%
UK 16 399 876 37.2% 24 520 695 55.6% 2 075 142 4.7% 1 136 778 2.6% 44 132 492 11.1% 27 732 616 44 132 492 62.8%
EUR 28 210 956 365 53% 60 608 949 15% 105 353 949 27% 20 091 413 5% 397 010 677 100% 186 054 321 397 010 677 46.9%
Percentage of total 53.1% 15.3% 26.5% 5.1%
2017
Barn OrganicCage Free rangeEnriched
Total
General by
MS
Total/Total Altern.
Total Altern.
No enriched
included
Total by
MS
Production alternative
% MS/Total
%
altern./tota
l altern.

EU market situation for Eggs 17 May 2018
P R O D U C T I O N
0
1 000
2 000
3 000
4 000
5 000
6 000
7 000
8 000
9 000
Jan Feb Mar Apr May Jun Jul Aug Sep Oct Nov Dec
Production forecast of eggs in shell(Mio pieces)
2 016 2 017 2 018

EU market situation for Eggs 17 May 2018
P R I C E S
E U E V O L U T I O N
E G G S
90
110
130
150
170
190
210
€ur
o/
10
0kg
Evolution of the weekly EUaverage price for Class A eggs in packing stations
Avg. 2013-17 2016 2017 2018
Latest price ==> 123.19 EUR/100 kg
Evolution compared same period last year (Week 19) : + 0.5%
Source: MSs notifications (Commission Implementing Regulation (EC) 2017/1185)

EU market situation for Eggs 17 May 2018
W O R L D
M A R K E T
E G G P R I C E S
EU – US – BR & IN
0
50
100
150
200
250
300
350
In €
uro/
100
kg
Egg prices of EU, USA, Brazil and India
EU US BR IN
77.93123.19 102.41110.61
Sources:
EU = weighted average of MS prices - Average class L&MUS = weekly USDA prices - Eggs grade A ,ChicagoBR = average of prices in main producing states - (noticiasagricolas.com.br)
IN = average of NECC prices in available Production Centres - (e2necc.com)

EU market situation for Eggs 17 May 2018
W O R L D
M A R K E T
EGGS FOR BREAKING PRICES
EU & US
0
50
100
150
200
250
| 2016 | 2017 | 2018 |
€uro
/ 100
kg
Prices of Eggs for consumption and Eggs for breaking
EU-Eggs for Consumption US breaking (high)
EU Barn breaking (high) EU Enriched cage breaking (high)
EU Free range for breaking (high)
Eggs free range for breaking quotation have been added to the graph on 16.09.2016

EU market situation for Eggs 17 May 2018
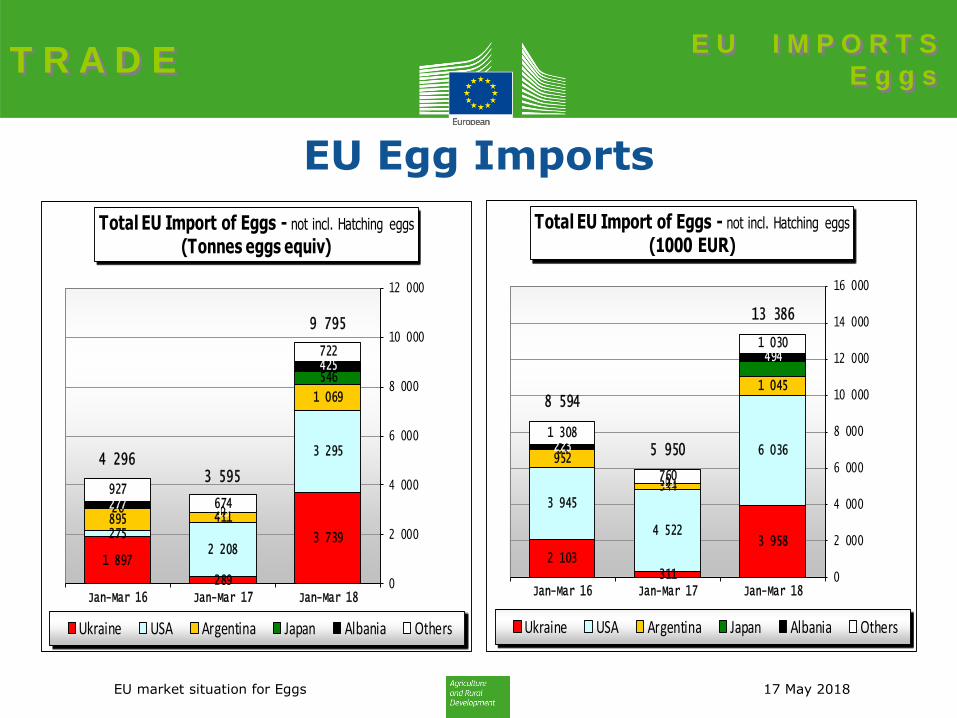
EU Imports of Eggs:
Trade Figures (Comext – tonnes egg equiv.) not incl. Hatching eggs
Compared
tonnes % tonnes % tonnes % tonnes % tonnes % to Jan-Mar 17
Ukraine 163 1.2% 3 665 19.0% 8 043 46.9% 2 938 13.1% 3 739 38.2% +++
USA 4 156 30.5% 2 745 14.2% 3 450 20.1% 11 558 51.7% 3 295 33.6% + 49%
Argentina 1 433 10.5% 3 232 16.7% 1 864 10.9% 2 921 13.1% 1 069 10.9% + 160%
Japan 0 0.0% 0 0.0% 26 0.1% 193 0.9% 546 5.6% +++
Albania 0 0.0% 1 554 8.0% 824 4.8% 1 326 5.9% 425 4.3% +++
For.JRep.Mac 86 0.6% 0 0.0% 4 0.0% 674 3.0% 195 2.0% +++
Others 7 794 57.2% 8 108 42.0% 2 930 17.1% 2 733 12.2% 527 5.4%
Extra-EU 13 632 19 304 17 140 22 341 9 795
% change + 42% - 11% + 30% + 172.5%
2014 2015 2016 Jan-Mar 182017
T R A D E E U I M P O R T S
E g g s
EU market situation for Eggs 17 May 2018
EU Egg Imports
1 897
289
3 7392752 208
3 295
895 411
1 069
26 0
546
27713
425
927674
722
4 2963 595
9 795
0
2 000
4 000
6 000
8 000
10 000
12 000
Jan-Mar 16 Jan-Mar 17 Jan-Mar 18
Total EU Import of Eggs - not incl. Hatching eggs
(Tonnes eggs equiv)
Ukraine USA Argentina Japan Albania Others
2 103311
3 958
3 945
4 522
6 036952
344
1 045
64
0
223
13
494
1 308
760
1 030
8 594
5 950
13 386
0
2 000
4 000
6 000
8 000
10 000
12 000
14 000
16 000
Jan-Mar 16 Jan-Mar 17 Jan-Mar 18
Total EU Import of Eggs - not incl. Hatching eggs
(1000 EUR)
Ukraine USA Argentina Japan Albania Others
T R A D E E U I M P O R T S
E g g s

1 72.9
57.9
37.2
32.3
2.2
1.4
0.3
0.0
0 500 1 000 1 500 2 000
04072100 - Fresh Eggs of Gallus forConsumption
04089180 - Dried Eggs not in Shell
04081180 - Dried Egg Yolks
04089980 - Fresh or Cooked Eggs not in Shel
35021990 - Other Egg Albumin
04081981 - Liquid Egg Yolks
35021190 - Dried Egg Albumin
04079010 - Preserved or Cooked Eggs of Poultryin Shell
EU Imports of Egg products from UKRAINE in 2017 (Full year)
(in tonnes)
09.4275
09.4276
09.4401
out of quota
Inward processing *
Total imports: 3 041 tonnes
2 46.2
1 14.9
47.2
17.2
1.5
0.3
0 500 1 000 1 500 2 000 2 500 3 000
04089180 - Dried Eggs not in Shell
04072100 - Fresh Eggs of Gallus forConsumption
04081180 - Dried Egg Yolks
04089980 - Fresh or Cooked Eggs not in Shel
35021190 - Dried Egg Albumin
35021990 - Other Egg Albumin
EU Imports of Egg products from UKRAINE in 2018 (January - April) (in tonnes)
09.4275
09.4276
09.4401
09.4015
out of quota
Inward processing *
Total imports: 4 273 tonnes
*: up to February 2018

EU market situation for Eggs 17 May 2018
T R A D E E U E X P O R T S
E g g s
0
5 000
10 000
15 000
20 000
25 000
30 000
35 000
|Jan 16
2016 |Jan 17
2017 |Jan 18
2018
in Tonnes egg equiv.
EU Exports of selected EGGS products (including Hatching eggs)
FRESH Albumin Not In Shell Yolk Hatching

EU market situation for Eggs 17 May 2018
EU Egg Trade Balance (not including Hatching eggs)
T R A D E B A L A N C E
1018
2318 17
27
16
30
69
2530
3945
2330 34
21
37
2014
19 1722
10
144
164
186
209
231
201 205
191
142
198 198202
167
187
150
182
217
186
220
233
280
246
210
49
0
50
100
150
200
250
300
19951996199719981999200020012002200320042005200620072008200920102011201220132014201520162017Jan-Mar18
in 1000 TonnesIMPORTS EXPORTS

EU market situation for Eggs 17 May 2018
EU Exports of Eggs:
Trade Figures (Comext – tonnes egg equiv.) not incl. Hatching eggs
T R A D E E U E X P O R T S
E g g s
Compared
tonnes % tonnes % tonnes % tonnes % tonnes % to Jan-Mar 17
Japan 78 765 34% 73 487 26% 46 086 19% 53 211 25% 12 904 26% - 14.7%
Sw itzerland 41 483 18% 41 257 15% 40 402 16% 40 665 19% 10 776 22% - 2%
Israel 3 532 2% 11 750 4% 12 553 5% 10 719 5% 7 355 15% + 51%
Thailand 4 939 2% 5 147 2% 5 728 2% 10 046 5% 1 581 3% - 47%
Turkey 1 639 1% 1 651 1% 2 972 1% 4 314 2% 1 158 2% + 59%
Taiw an 3 445 1% 4 082 1% 6 483 3% 7 340 4% 1 052 2% - 51%
South Korea 2 661 1% 3 455 1% 5 162 2% 7 908 4% 759 2% - 70%
Gambia 2 647 1% 2 527 1% 2 963 1% 2 396 1% 732 1% - 32%
Malaysia 1 874 1% 2 987 1% 3 295 1% 2 225 1% 717 1% + 13%
Ukraine 2 146 1% 1 880 1% 2 885 1% 2 171 1% 672 1% + 20%
Russia 7 659 3% 3 854 1% 5 278 2% 4 932 2% 653 1% - 54%
Others 82 053 35% 128 381 46% 112 670 46% 63 619 30% 11 034 22%
Extra-EU 232 843 280 458 246 477 209 546 49 391
% change + 20% - 12% - 15% - 24.7%
2014 2015 2016 Jan-Mar 182017

EU market situation for Eggs 17 May 2018
EU Egg Exports
6 98215 123 12 904
10 880
11 02810 776
6 126
4 865 7 355
1 581727 1 158
37 470
30 874
15 617
63 892 65 592
49 391
0
10 000
20 000
30 000
40 000
50 000
60 000
70 000
Jan-Mar 16 Jan-Mar 17 Jan-Mar 18
Total EU Export of Eggs not incl. hatching eggs (T. eggs equiv.)
Japan Switzerland Israel Thailand Turkey Others
9 515 10 219 9 956
16 291
7 347 5 69911 848
52 544
34 960 20 568
87 376
69 120
60 758
0
10 000
20 000
30 000
40 000
50 000
60 000
70 000
80 000
90 000
100 000
Jan-Mar 16 Jan-Mar 17 Jan-Mar 18
Total EU Export of Eggs not incl. hatching eggs (1000 EUR)
Japan Switzerland Israel Thailand Turkey Others
T R A D E E U E X P O R T S
E g g s

EU market situation for Eggs 17 May 2018
T R A D E 1 Day chicks
Compared
Tonnes % Tonnes % Tonnes % Tonnes % to Jan-Mar17
Russia 43 431 51% 37 599 46% 33 427 39% 8 712 42% - 6.5%
Iraq 9 384 11% 12 925 16% 16 900 20% 3 198 15% - 21.8%
Libya 4 672 6% 5 468 7% 4 543 5% 1 611 8% - 8.3%
Ukraine 8 257 10% 4 281 5% 5 430 6% 1 044 5% + 61.7%
Switzerland 2 912 3% 2 786 3% 2 565 3% 704 3% + 7.7%
Belarus 557 1% 899 1% 1 677 2% 578 3% + 159.1%
U.A.Emirates 861 1% 1 918 2% 2 199 3% 509 2% - 14.8%
Others 14 606 17% 15 320 19% 18 288 22% 4 588 22% + 5.4%
Extra-EU 84 680 81 196 85 029 20 943
% change Year / Year-1 + 11.7% - 4.1% + 4.7% - 3.2%
EU Exports of hatching eggs
2015 2016 2017
Trade figures (Comext - tonnes egg equivalent)
Jan-Mar18

T R A D E 1 Day chicks
Compared
Tonnes % Tonnes % Tonnes % Tonnes % to Jan-Mar17
Ukraine 3 708 36% 3 058 32% 2 936 34% 784 35% + 9.0%
Russia 624 6% 577 6% 526 6% 150 7% + 25.8%
Egypt 1 401 14% 525 5% 486 6% 115 5% - 34.5%
Belarus 558 5% 676 7% 337 4% 108 5% + 78.6%
Serbia 343 3% 333 3% 358 4% 94 4% + 9.9%
Morocco 349 3% 483 5% 315 4% 80 4% - 10.3%
Albania 253 2% 264 3% 263 3% 78 4% + 37.3%
Ghana 173 2% 206 2% 309 4% 75 3% - 10.8%
Philippines 95 1% 319 3% 121 1% 74 3% + 23.8%
Algeria 296 3% 309 3% 208 2% 56 3% - 0.2%
Moldova 469 5% 169 2% 182 2% 45 2% - 8.7%
Others 2 095 20% 2 735 28% 2 583 30% 575 26% + 17.9%
Extra-EU 10 363 9 653 8 625 2 235
% change Year / Year-1 - 6.9% - 10.7% + 9.4%
Jan-Mar182015 2016 2017
EU Exports of one day chicksTrade figures (Comext - tonnes)
EU market situation for Eggs 17 May 2018

EU market situation for Eggs 17 May 2018
Where to find data:
• http://ec.europa.eu/agriculture/markets/index_en.htm
• Click on link: Eggs
• Click on link: Presentations and prices
(righthand side under: in this chapter)
• Choose the item (link) you want
EUROPA SITE MARKETS

Feed costs
copyright_purestock_thinkstockphotos_72969376_low

2
Euro – US Dollar exchange rate
0.8
1.0
1.2
1.4
1.6
01/99 01/00 01/01 01/02 01/03 01/04 01/05 01/06 01/07 01/08 01/09 01/10 01/11 01/12 01/13 01/14 01/15 01/16 01/17 01/18
Exchange rate: Spot, ECB reference - U.S. Dollar/Euro
11/05/2018: 1 EUR = 1.19 USD

3
Euro – Argentine Peso and Brazilian Real
exchange rate
0.0
2.0
4.0
6.0
8.0
10.0
12.0
14.0
16.0
18.0
20.0
22.0
24.0
26.0
28.0
Exchange rate: ARG Peso/Euro, Spot, ECB reference and local market quotes
Exchange rate: BRA Real/Euro, Spot, ECB reference
11/05/2018: 1 EUR = 27.08 ARS = 4.25 BRL

4
World cereal prices ($/t)
140
160
180
200
220
240
260
280
300
$ /
to
nn
e
Wheat - Black Sea Milling $ 214
Wheat - US SRW Gulf $ 218
Wheat - FR Cl. 1 Rouen $ 205
Maize - FR Bordeaux $ 196
Maize - US 3YC Gulf $ 193
Barley-FR Dlvd Rouen feed $ 204

5
US CME SRW wheat futures
120
140
160
180
200
220
240
260
0
50
100
150
200
250
300
350
400
07/15 01/16 07/16 01/17 07/17 01/18
$/t
Daily
tra
ded v
olu
me (
1000 c
ontr
acts
of 136 to
nnes)
Chicago (CME) SRW futures
Daily volume
JUL 2018 (R)
DEC 2018 (R)
JUL 2019 (R)
183
197
209
180
190
200
210
220
0
50
100
150
200
28/04/18 02/05/18 06/05/18 10/05/18
$/t
Daily
tra
ded v
olu
me (
1000 c
ontr
acts
of 136 to
nnes)
Chicago (CME) SRW futures
Last 14 days

6
CME maize futures
100
125
150
175
200
225
250
0
160
320
480
640
800
960
1 120
12/14 06/15 12/15 06/16 12/16 06/17 12/17
$/t
Daily
tra
ded v
olu
me (
1000 c
ontr
acts
of 127 to
nnes)
Chicago (CME) Maize futures
Daily volume
JUL 2018 (R)
DEC 2018 (R)
JUL 2019 (R)
156
163
170
150
155
160
165
170
175
0
150
300
450
600
28/04/18 02/05/18 06/05/18 10/05/18
$/t
Daily
tra
ded v
olu
me (
1000 c
ontr
acts
of 127 to
nnes)
Chicago (CME) Maize futures
Last 14 days

Soybeans export prices $/ton (fob)
7
300
320
340
360
380
400
420
440
460
480
$ /
to
nn
e US 2Y Gulf - $ 412
Ukraine - $ 433
Brazil Paranagua - $ 419
Argentina Up River - $ 424

8
Soyameal world quotations $/ton
250
300
350
400
450
500
550
600
May
-16
Jun-
16
Jul-1
6
Aug-
16
Sep-
16
Oct-1
6
Nov-
16
Dec-
16
Jan-
17
Feb-
17
Mar
-17
Apr-1
7
May
-17
Jun-
17
Jul-1
7
Aug-
17
Sep-
17
Oct-1
7
Nov-
17
Dec-
17
Jan-
18
Feb-
18
Mar
-18
$/to
n
Brazil Paranagua
US Gulf
Argentina Up River
Source: IGC
405.0 460.0440.0

9
CME soya futures
300
310
320
330
340
350
360
370
380
390
400
0
100
200
300
400
500
600
700
800
900
11/14 05/15 11/15 05/16 11/16 05/17 11/17
$/t
Daily
tra
ded v
olu
me (
1000 c
ontr
acts
of 136 t)
Chicago (CME) soybeans futures
Daily volume
JUL 2018 (R)
AUG 2018 (R)
SEP 2018 (R)
JUL 2019 (R)
369370
371
373
365
370
375
380
385
390
0
50
100
150
200
250
300
350
28/04/18 05/05/18
$/t
Da
ily
tra
de
d v
olu
me
(1
00
0 c
on
tra
cts
of
13
6 t)
Chicago (CME) soybeans futures
Last 14 days