Ethnic Concentration and Bank Use in Immigrant Communities
44
1 Ethnic Concentration and Bank Use in Immigrant Communities September 2010 Sarah Bohn Public Policy Institute of California 500 Washington Street Suite 600 San Francisco, CA 94111 [email protected] phone: 415-291-4413 fax: 415-2914401 Sarah Pearlman (corresponding author) Vassar College 124 Raymond Ave Box 497 Poughkeepsie, NY 12603 [email protected] phone: 845-437-5212 fax: 845-437-7576 Acknowledgements: The authors are grateful to participants at the Southern Economic Association 2008, 2009 and APPAM Fall 2009 annual meetings and seminar participants at Wesleyan, Vassar and Amherst for comments. All remaining errors are their own.
Transcript of Ethnic Concentration and Bank Use in Immigrant Communities

1
Ethnic Concentration and Bank Use in Immigrant Communities
September 2010
Sarah Bohn
Public Policy Institute of California
500 Washington Street Suite 600
San Francisco, CA 94111
phone: 415-291-4413
fax: 415-2914401
Sarah Pearlman (corresponding author)
Vassar College
124 Raymond Ave Box 497
Poughkeepsie, NY 12603
phone: 845-437-5212
fax: 845-437-7576
Acknowledgements:
The authors are grateful to participants at the Southern Economic Association 2008, 2009 and
APPAM Fall 2009 annual meetings and seminar participants at Wesleyan, Vassar and Amherst
for comments. All remaining errors are their own.
2
Ethnic Concentration and Bank Use in Immigrant Communities
September 2010
Abstract:
Despite the many benefits of bank use, large portions of the U.S. population remain unbanked.
One of the largest is immigrants, where the incidence of being unbanked is over 12% higher than
among natives. In this paper we document growth in the nativity gap in bank use over time,
showing that immigrants are increasingly less likely to have a bank account than natives. We
also test the importance of immigrant enclaves, defined as areas with high concentration of
immigrants from the same region, in explaining the increasing differential in bank use.
Immigrants living near a high proportion of co-ethnics may exhibit lower formal bank use
because immigrant networks provide informal financial services. Using data on bank use, bank
location, immigrant status, and immigrant population from the SIPP, Census, and FDIC we find
that immigrants living in areas with higher concentration of immigrants from their source region
are significantly less likely to have a bank account. The economic significance of our estimates
is large, and the results suggest that immigrant enclaves , even measured at a high level, have
power in explaining the persistence and increasing severity of the nativity gap in bank use in the
U.S.
JEL codes: G21, J10

3
Despite the prevalence and expansion of bank use in the U.S., large portions of the U.S.
population remain unbanked (Rhine, Greene and Toussaint-Comeau 2006). One of the largest is
immigrants, where the incidence of being unbanked is over twelve percent higher than among
natives1 (Paulson and Osili 2006b; Rhine and Greene 2006). Financial institutions confer many
benefits to their users, including providing safe and low cost savings instruments, access to
financial securities, and the means to increase investment in a home or business (Washington
2006). Without formal banking relationships it is more difficult for households to acquire
financial assets, and researchers and policymakers are concerned that this may inhibit the wealth
accumulation of unbanked households. For immigrant households, this may have long term
impacts if non-participation in the formal financial sector inhibits their economic success and
slows their incorporation into the American economy (Bernanke 2004).
Given concerns over economic assimilation and bank use several recent papers have
explored the determinants of unbanked status among immigrants. Among other factors,
education, income, wealth, family size, and institutional quality in the source region are all found
to be correlated with bank use (Osili and Paulson 2006a, 2006b; Rhine and Greene 2006). One
factor that has been mentioned but not specifically explored, however, is the concentration of
immigrants from the same source region, or residency in an immigrant enclave. The networks
available to immigrants in such areas may affect bank use through the provision of alternative,
informal financial services and information about financial services. If immigrants living in
concentrated areas have ample access to informal financial arrangements that are good
1 Author’s calculations from the 2001 Survey of Income and Program Participation (SIPP).

4
substitutes for formal services or are less likely to learn about formal banking services, they may
be less likely to open, maintain, and fully utilize a bank account.2
An interest in enclave effects for bank use stems from multiple factors. First, it is unclear
that limited supply of banks, the natural culprit for non-participation, is the full explanation for
unbanked status. Despite efforts to increase access to banking services in underserved
neighborhoods, which include some immigrant enclaves, unbanked rates remain high (Haughney
2009). Second, case studies in immigrant neighborhoods provide evidence that informal credit
sometimes supplants the need for formal loans (Bond and Townsend 1996).3 Third, evidence
that informal financial vehicles such as Rotating Credit and Savings Associations (ROSCAs) are
used in certain U.S. immigrant communities suggest that informal arrangements also might
supplant the need for formal deposits (Light and Deng 1995). Finally, given the prevalence of
informal financial arrangements in many immigrants’ home countries, we anticipate reliance
may persist after relocation (Osili and Paulson 2008).
We first examine changes in bank use by immigrant households over time using data
from the 1990, 1996 and 2001 Survey of Income and Program Participation (SIPP), a nationally
representative, longitudinal dataset that contains information on immigrant status and financial
market participation. We find that immigrants are becoming less banked and that the nativity
gap is increasing over time. For example, the percent of immigrant households with a bank
account falls from 78% in 1990 to 70% in 2001, while the nativity gap, or the difference between
the percentage of native households with a bank account and immigrant households with a bank
2 Osili and Paulson (2006b) also highlight the importance of social networks in bank use and suggest that
immigrants living near other unbanked immigrants may be more likely to be unbanked. 3 In a paper on the Little Village neighborhood in Chicago, Bond and Townsend (1996) find a low use of formal
loans among Hispanic and Asian immigrants and a high incidence of informal loans, mainly from family and
friends. Several households and entrepreneurs demonstrate a preference for more flexible informal loans, leading
the authors to conclude that “… far from being ignored by banks, poor and minority communities may be choosing
not to use their services.”

5
account, increases from 8% in 1990 to 13.8% in 2001. The nativity gap and its increase over the
1990 to 2001 period are statistically significant and persist when the propensities are regression-
adjusted to account for observable changes in the socioeconomic characteristics of immigrants
and native-born over time.
We next examine whether the size of, and increase in, the nativity gap can be explained
by enclaves, as measured by the concentration of immigrants from similar source regions in a
metropolitan area. This measure, derived from U.S. Census data, follows much of the
immigration literature and assumes that the propensity for immigrants to rely on social networks
is intensified the higher the concentration of similar immigrants in a metropolitan area
(Andersson, Burgess and Lane 2009; Bertrand, Luttmer, and Mullainathan 2000; Borjas 1986,
1995; Chiswick and Miller 2005). While enclaves may be more precisely measured at the sub-
MSA level, research suggests that among immigrants, networks are determined by ethnicity
rather than neighborhood (Borjas 1995) or operate more broadly than within a narrowly-defined
neighborhood (Hellerstein, Neumark and McInerney 2009). As such, MSAs are a reasonable
measure of enclaves. Also, utilizing a larger geographic area should bias us against finding a
result, which is preferable to finding a spurious result from mismeasured smaller enclaves.
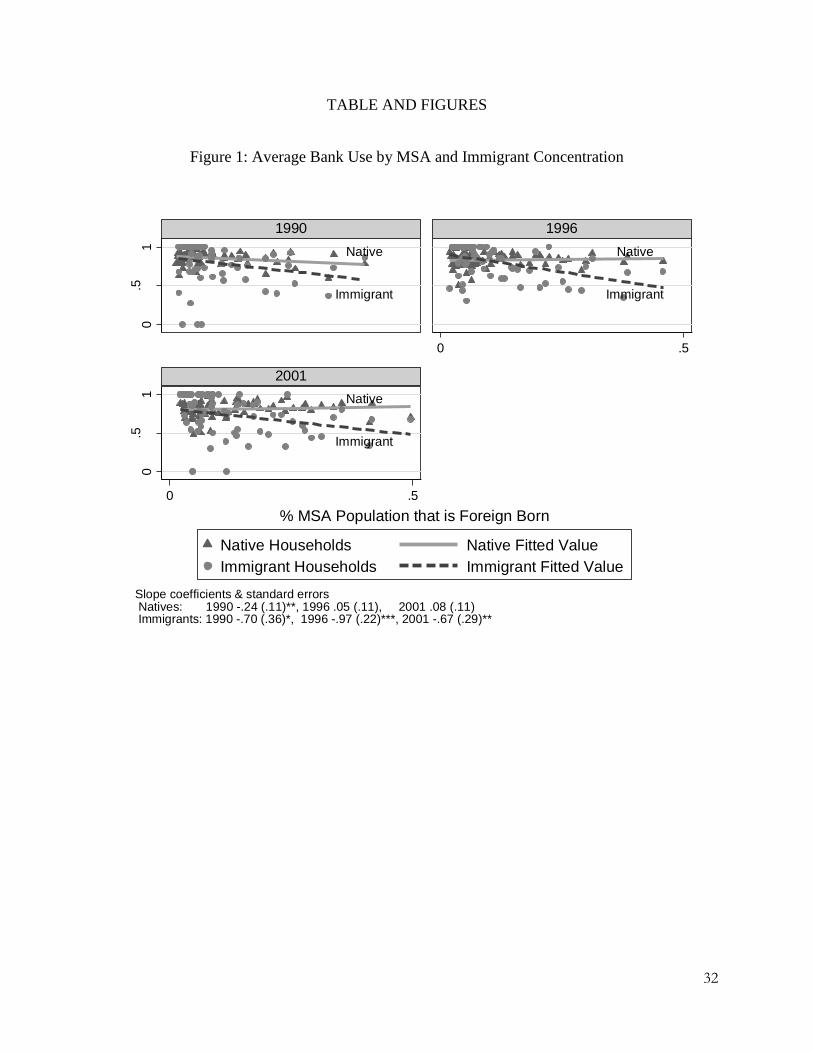
A cursory look at the data, shown in Figure 1, suggests a relationship between immigrant
concentration and the nativity gap exists. In each year there is a significant negative correlation
between average immigrant bank use in an MSA and immigrant concentration. No similar
correlation exists for native households, except in 1990. This suggests that immigrant
concentration differentially impacts immigrant bank use relative to that of natives.
Of course the unconditional correlations between immigrant bank use and immigrant
concentration might not tell us about MSA-specific effects given that where immigrants and

6
banks decide to locate is not random. We thus formally estimate bank use, controlling for
individual characteristics, including, income, gender, ethnicity, education, permanent residency
status, and time in the U.S., and MSA characteristics, including local unemployment rates and
the supply of banks. Our identification relies on variation in immigrant concentration within
MSAs over time and the differential effect this variation has on natives and immigrants.
Specifically, we assume that any additional effect that the concentration of immigrants from
region j, in MSA s in year y has on the bank use of immigrants from region j in the same space
and time constitutes an enclave effect. For example, by controlling for the impact that the
overall concentration of immigrants from Latin America has on bank use for all households in an
MSA, we can estimate the additional effect that this concentration has, if any, on Latin American
immigrant households.
Overall, we find that immigrants living in areas where there is a higher concentration of
immigrants from their region of origin are less likely to have a bank account, with the most
significant effects found for interest bearing bank accounts. No similar effects are found for
native households, even those from similar ethnic backgrounds to immigrants. In addition,
overall immigrant concentration does little to predict bank use for immigrant households. What
matters is the concentration of immigrants from the same source region, suggesting that our
estimates may capture a negative relationship between residency in an enclave and bank use for
immigrant households. The magnitude of our estimates is significant, suggesting that for a 10%
increase in concentration, the probability an immigrant household has a bank account falls
between 2.6-3.4%. Given the increases in immigrant concentration over time, this can partially
explain the rising nativity gap.

7
We also carry out multiple tests to ensure that our measure of immigrant enclaves is not
simply picking up unobservable factors at the MSA, individual, or cohort level which jointly
determine immigrant location and bank use. For example, failing to control for unobserved
MSA-time varying characteristics, such as the supply of quasi banking services (check cashing,
payday loans, pawnshops), unobserved individual characteristics such as skill that determine
where immigrants locate, and changes in the composition of the immigrant population over time
can bias our estimates. Our results are robust to additional controls for the concerns outlined
above. To the degree that we effectively mitigate endogeneity concerns, our results provide
evidence that variation in immigrant concentration can partially explain differences in nativity
gaps across MSAs and across time.
The paper proceeds as follows. Section II describes the data, including a discussion of
information on immigrant status, region of origin, bank use, immigrant concentration by
metropolitan area and MSA controls. Section III presents estimates of bank use. Section IV
examines the robustness of our main estimates. Section V concludes.
Section II: Data
Section IIA: Data on Region of Origin and Immigrant Concentration
The principal source of data for our study is the Survey of Income and Program
Participation (SIPP). The SIPP is a nationally representative, longitudinal dataset and contains
detailed information on immigrant status, region of origin, and financial market participation.
We use the 1990, 1996 and 2001 rounds of the SIPP, and within each round, the wave that most
closely coincides with the relevant Census year.4 Our unit of analysis is the household. We
4 In the 1990 SIPP we use the 4
th wave, which runs from January to April of 1991. In the 1996 SIPP we use the 3rd
wave, which runs from November 1996 to February 1997. In the 2001 SIPP we use the 3rd
wave, which runs from
September to December of 2001. While each round of the SIPP is a panel containing multiple waves (participants
are interviewed every four months over a span of 3-4 years), we restrict attention to one wave. Since immigrant

8
choose households over individuals because many of the banking decisions may be similar
across members of the same household, particularly spouses who have joint bank accounts. In
our analysis a household is defined as immigrant or native based on the status of the head of
household, defined as the reference person in the SIPP.5 We restrict attention to heads of
household between the ages of 18 and 64 who live in metropolitan areas. The result is a repeated
cross-section that contains 34,906 households, 85.2% of whom are native and 14.8% of whom
are immigrant.6
To establish ethnic enclaves, we use data on immigrant concentration by metropolitan
statistical area (MSA) from the 1990 and 2000 Decennial Census. Immigrant concentration is
measured by the percentage of the population in a given MSA comprised of immigrants from a
particular region. The Census gives reliable population estimates at the MSA level, for native-
born and immigrants and, more specifically, by region of birth. This allows us to measure ethnic
enclaves for immigrants from the same region for the 75 MSAs in our sample.7 Although a
typical enclave may be more precisely measured at a finer level, such as census tract, an MSA is
status, bank use and an individual’s location vary little for an individual over a 3-4 year period, the panel data are
not particularly useful for our analysis. 5 Other studies define households more restrictively, considering couple immigrant households to be those in which
both partners are foreign born (Cobb-Clark and Hildebrand 2006b). We consider this definition in Section IV. 6 Immigrant is defined as foreign born, regardless of subsequent citizenship status. Two exceptions are individuals
born to U.S. citizens abroad and Puerto Ricans, who are counted as natives. Also, we remove 61 households that
have extreme bank to total wealth values. 7 We only include MSAs that appear in the 1990, 1996 and 2001 samples. This leads to an exclusion of 26 MSAs
which do not appear in all of the panels. The 1990 SIPP wave is matched to the 1990 Decennial Census, the 2001
wave is matched to the 2000 Decennial Census, and the 1996 wave is matched to data interpolated between the 1990
and 2000 Censuses. In using an interpolated rather than an actual value we face the problem associated with
measurement error in an independent variable, since the 1996 concentration variable is a proxy for the true value. If
the measurement error is uncorrelated with the true value, our estimates will be unbiased. If the measurement error
is uncorrelated with the observed value, our estimates face attenuation bias, which makes our estimates a lower
bound on the true value of the coefficient for immigrant concentration. Thus measurement error will not overly
inflate our estimates. It will, however, increase the standard error of our estimates. To address this we also
estimated all of our results using the last wave of the 1996 SIPP, which takes place in year 2000 and thus does not
necessitate a proxy variable. These results are available upon request and are similar in all cases.

9
the finest geographic level we can match to individuals sampled in the SIPP. 8 Furthermore,
research suggests that among immigrants, networks are determined by ethnicity rather than
neighborhood (Borjas 1995) or operate more broadly than within a narrowly-defined
neighborhood (Hellerstein, Neumark and McInerney 2009). As such, MSAs may be an
appropriate measure of enclaves. Finally, there is significant variation in the concentration of
immigrants even at the MSA level, which means this may appropriately capture differences in
enclave size. We illustrate this in more detail below.
We group immigrants by region of origin rather than country, given the small number of
immigrants from most countries in the SIPP. Four different regions of origin are defined: Latin
America, which includes Mexico, Central and South America, Asia, Europe, and Other, which
includes the Caribbean, Africa, Other North America, and Oceania.9 Table 1 provides
information on the composition of the immigrants in the sample and in the general population.
Immigrants from Latin America make up the largest component, comprising about 40% of all
immigrants in the sample, while immigrants from Asia make up the second largest group,
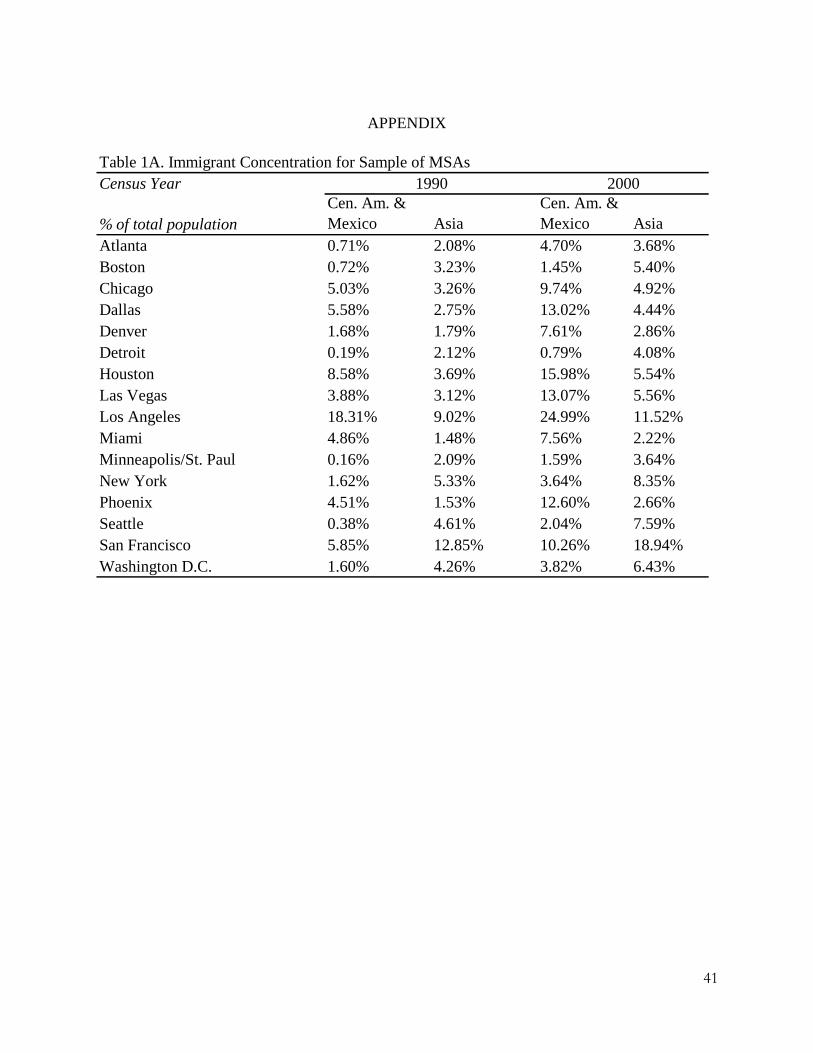
comprising 27% of immigrants in the sample. These two groups have also increased
significantly as a percentage of the total U.S. population, as captured by MSA concentration
ratios. For example, in 1990 the average concentration of immigrants from Latin America for
MSAs in our sample was 4.6%, while the average concentration of immigrants from Asia was
3.7%. This increases to 8.4% and 5.6%, respectively, in 2001.10
8 Census tracts are not available in the public use SIPP or Census. Also, the SIPP does not have sufficient sample
size to capture differences in native and foreign born behavior across census tracts. 9 We also separated out the Caribbean, creating 5 regions. This generated similar point estimates in all cases.
However, due to the small sample sizes for the Caribbean and re-formulated Other group, we lose precision. 10
Latin American and Asian immigrants also increase as a percentage of total immigrants in the population. In
1990 immigrants from Latin America made up approximately 33.2% of all immigrants in the population, while
immigrants from Asia made up 24.9%. This increases to 40% and 29.1%, respectively, in 2001.

10
We also account for tenure in the U.S. and legal status, since the importance of enclaves
in determining bank behavior may vary by these two factors. Tenure is measured by year of
entry, used to define three categories of time in the U.S.: 0-5 years (“new”), 6-10 years, and more
than 10 years in the U.S (“established”). Legal status, meanwhile, is impossible to precisely
measure as neither the SIPP nor any representative dataset includes indicators of legal versus
illegal status.11
However the SIPP does ask immigrant respondents whether they are naturalized,
permanent residents, or neither.12
These three categories capture some of the essential
differences between immigrant groups with various levels of incorporation. Immigrants who
have neither citizenship nor permanent resident status include a large proportion of
undocumented immigrants, who make up approximately 10% of the US labor market (Passel
2008). Non-permanent residents also include those in the U.S. under non-resident visas, such as
H1-B or student visas. We consider concerns about the misclassification of the legal status of
immigrants in Section IV.
Information on tenure and residency status is included in Table 1. The table illustrates
the long tenure of the immigrant sample, as the majority of immigrants have been in the U.S. for
10 years or longer. Less than twenty percent have tenure of 5 years or less. Regarding residency
status, approximately forty percent of the immigrant sample is comprised of naturalized citizens,
while another forty percent is comprised of permanent residents. Less than twenty percent is
comprised of non permanent residents.
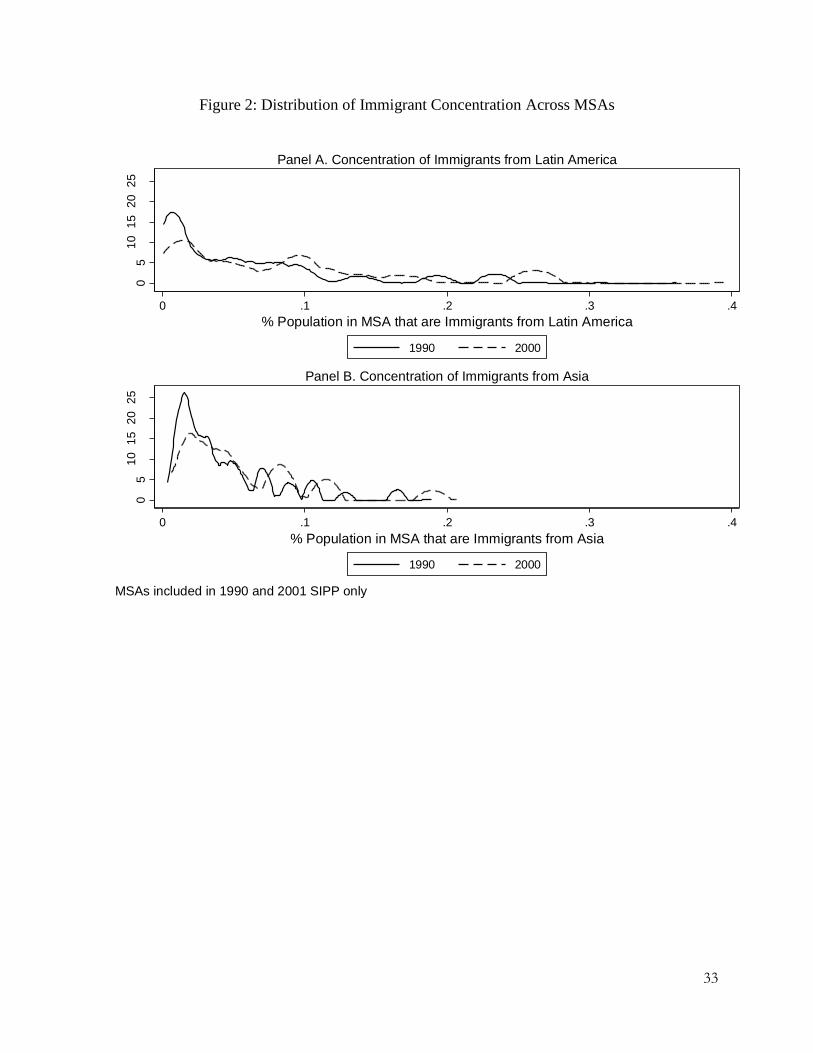
The variation in immigrant concentration within MSAs across time provides
identification for our model. To provide an idea of this variation, Figure 2 shows the distribution
11
Indeed, it would be difficult to obtain accurate responses on legal status in a large-scale survey, even if the
question were asked. However, researchers estimate that nationally representative surveys similar to the SIPP
(Census and CPS) have been able to capture the large majority of the illegal population. 12
In the 1990 SIPP individuals are not asked separately about their naturalization status and permanent residency
status. We categorize non-naturalized individuals as non-permanent residents for this wave.

11
of immigrant concentration across MSAs for Latin American and Asian immigrants, the two
largest groups in the population. The graphs illustrate the significant variation in concentration
for each group and time period. While there is clustering at a few points in the distribution and
while the distributions are skewed left, there is a substantial spread, showing the large variation
in concentration across MSAs. Furthermore, over time the distributions shift to the right,
reflecting two aspects of demographic change. First, the size of the immigrant population from
Asia and Latin America has increased. Second, there is some movement of immigrants to places
other than the most concentrated, “gateway”, cities (Bohn 2009).
Section II.B.: Bank Use Data
We classify a household as “banked” if any adult age 18-64 has a bank account, which
includes checking accounts, savings accounts, certificates of deposit and money market deposit
accounts. Given the importance of banks for asset accumulation, we focus on interest bearing
bank accounts separately. These include everything except non-interest bearing checking
accounts.13
Summary statistics are presented in Table 2.14
The first half of Table 2 considers
bank use for the entire sample. The unconditional means show a large and statistically
significant nativity gap. In 1990 86.1% of native households had a bank account while only
78.1% of immigrant households had a bank account. This constitutes a gap of 8%. This gap
increases in 1996 and again in 2001. In 1996 the nativity gap rises to 12.1%, and in 2001 the gap
increases further to 13.8%. While bank use declines over the eleven year period for both natives
13
We consider the division by interest bearing and non interest bearing accounts because the 1990 SIPP accounts for
bank accounts in this way. Unlike the 1996 and 2001 SIPP, it does not separately account for checking accounts,
which means we cannot consider checking and savings account separately. Regarding interest bearing accounts,
85.9% of households with a bank account have at least one interest bearing account. 14
This analysis considers immigrant households collectively. A breakdown for immigrants by region of origin is
available upon request.

12
and immigrants, the declines are greater for immigrant households, showing that immigrants are
becoming relatively more unbanked than natives.
The second half of the table breaks down bank use by time in the U.S. and different
categories of legal status for the immigrant population only. As expected, bank use is higher
among households that have been in the U.S. for longer periods of time. Seventy six percent of
immigrants with tenure of 11 years or more have a bank account, as compared with only 67.1%
of immigrants with tenure of 5 years or less. Bank use is also higher for naturalized citizens than
for permanent and non permanent residents. For example, 82.9% of naturalized citizen
immigrant households have a bank account, a value that approaches that of natives. Meanwhile
only 65.5% of permanent resident households and 63.9% of non-permanent resident households
have a bank account, values that are significantly below those of natives.
We also investigate basic correlations between bank use for native and immigrant
households and the overall concentration of immigrants in a metropolitan area. We calculate the
average bank use of native and immigrant households in an MSA and compare this to immigrant
concentration. The averages, plotted by year, are shown in Figure 1. For all years there is a
statistically significant, inverse relationship between the concentration of immigrants in an MSA
and the average bank use of immigrants. In every year except 1990, the same relationship does
not exist with native households. While these graphs show unconditional correlations only,
they suggest that immigrant concentration may play a role in explaining the size and increase in
the nativity gap in bank use.
Section IIC: Metropolitan-level Controls
The goal of this study is to see if immigrant bank behavior varies across ethnic enclaves
of different sizes, with variation in enclaves over time and place providing identification. In
13
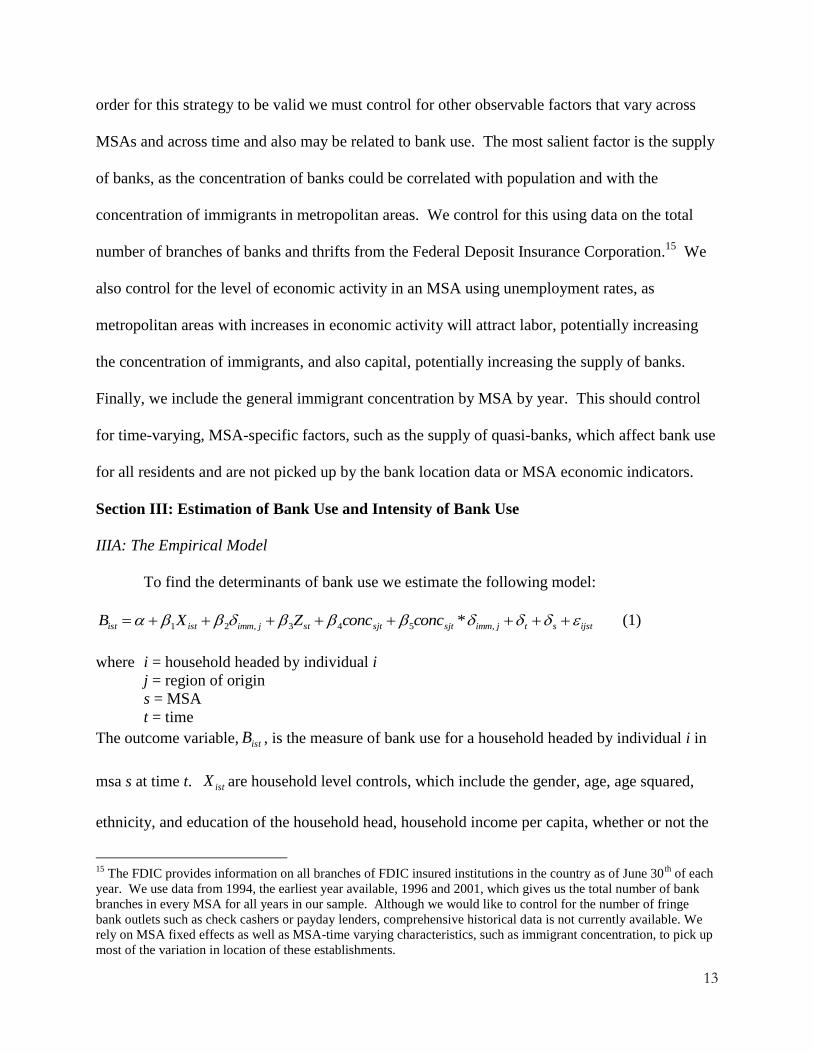
order for this strategy to be valid we must control for other observable factors that vary across
MSAs and across time and also may be related to bank use. The most salient factor is the supply
of banks, as the concentration of banks could be correlated with population and with the
concentration of immigrants in metropolitan areas. We control for this using data on the total
number of branches of banks and thrifts from the Federal Deposit Insurance Corporation.15
We
also control for the level of economic activity in an MSA using unemployment rates, as
metropolitan areas with increases in economic activity will attract labor, potentially increasing
the concentration of immigrants, and also capital, potentially increasing the supply of banks.
Finally, we include the general immigrant concentration by MSA by year. This should control
for time-varying, MSA-specific factors, such as the supply of quasi-banks, which affect bank use
for all residents and are not picked up by the bank location data or MSA economic indicators.
Section III: Estimation of Bank Use and Intensity of Bank Use
IIIA: The Empirical Model
To find the determinants of bank use we estimate the following model:
ijststjimmsjtsjtstjimmistist concconcZXB ,543,21 * (1)
where i = household headed by individual i
j = region of origin
s = MSA
t = time
The outcome variable, istB , is the measure of bank use for a household headed by individual i in
msa s at time t. istX are household level controls, which include the gender, age, age squared,
ethnicity, and education of the household head, household income per capita, whether or not the
15
The FDIC provides information on all branches of FDIC insured institutions in the country as of June 30th
of each
year. We use data from 1994, the earliest year available, 1996 and 2001, which gives us the total number of bank
branches in every MSA for all years in our sample. Although we would like to control for the number of fringe
bank outlets such as check cashers or payday lenders, comprehensive historical data is not currently available. We
rely on MSA fixed effects as well as MSA-time varying characteristics, such as immigrant concentration, to pick up
most of the variation in location of these establishments.

14
home is owned, the number of children under 18, and the total number of adults age 18 to 64 in a
household.16
Household controls also include dummy variables to capture if the head of
household is an immigrant from a particular region j ( jimm, ), as well as a measure of time in the
U.S. and permanent residency status, our best proxy for immigrants’ legal status.17
stZ are time-varying MSA level characteristics, including number of bank branches, the
unemployment rate, and sjtconc , the concentration of immigrants from region j in MSA s at time
t. The general immigrant concentration measures, sjtconc , are key to our model, as they should
pick up other, unobservable MSA, time-specific factors that impact bank use. One example is
the supply of quasi banking services, such as check cashing, payday loans, money transfers and
pawnshops. If quasi banks are more likely to locate in areas where the concentration of
immigrants is high, both immigrants and natives in these areas may be less likely to have bank
accounts for reasons that are unrelated to social networks. The model also includes MSA fixed
effects ( s ) and year effects ( t ), thus shifting identification in the model to variation within
MSA over time.18
Furthermore, if immigrant concentration truly captures the effect of enclaves
rather than other MSA characteristics, what matters for immigrant bank use is the concentration
of immigrants from the same region of origin, rather than the overall concentration level.
The key variable of interest is the interaction of immigrant status with immigrant
concentration ( jimmsjtconc ,* ). The coefficient on this interaction term measures the differential
impact on bank use of being an immigrant living in an area with a higher concentration of
16
We do not include household wealth given the reverse causality problems with bank use. Including household
wealth does not change the estimates significantly. 17
For the immigrant dummy variables we use the three aggregated regions, Latin America, Asia and Other, given
the small number of immigrants from many of the regions. 18
Year fixed effects absorb factors common to all MSAs that may impact bank use or immigrant concentration. For
example, bank use will be lower and immigrant concentration higher in most MSAs in 2001 than in 1990, regardless
of other factors.

15
immigrants from the same region. If the hypothesized differential impact exists, the coefficient
on the interaction term will be negative.
We estimate equation (1) using a linear probability model.19
We first estimate equation
(1) without any controls for immigrant concentration to find conditional mean differences in
bank use across natives and immigrants. This will tell us if the nativity gap persists after we
account for observable individual and MSA level characteristics. Also, by including immigrant-
year interaction terms we can see if the increase in the nativity gap persists after we account for
observable changes in the socioeconomic characteristics of immigrants and native-born over
time. Finally, we estimate bank use on a sample that excludes Los Angeles. Los Angeles is a
key immigrant gateway city and an outlier due to the very high concentration of Latin American
and Asian immigrants. Thus we estimate the model without it to see if this skews the averages.
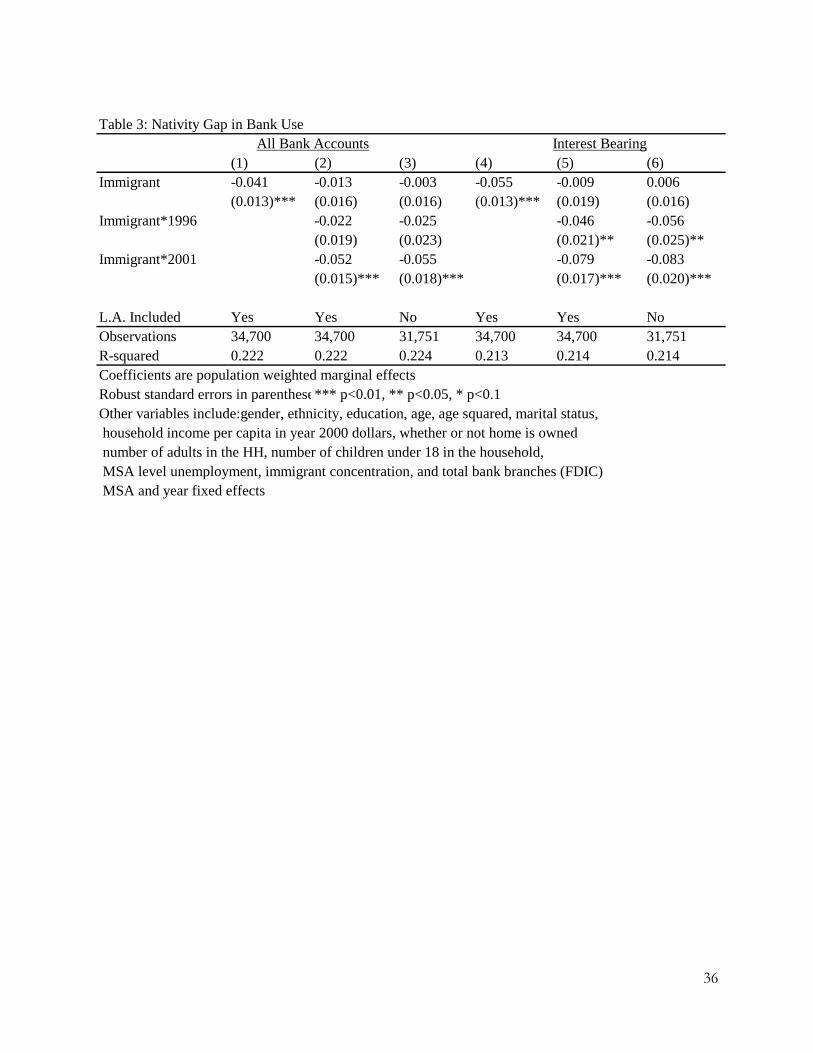
The estimates, presented in Table 3, show that the nativity gap in bank use persists after
we account for observable MSA level characteristics and socioeconomic characteristics. The
coefficient on the immigrant dummy is negative and significant at the 1% level for columns (1)
and (4), which means that after controlling for observable characteristics, immigrant households
are significantly less likely to hold bank accounts than natives. These effects, however, are
largely driven by year 2001. Once we include immigrant*year interaction terms, we find no
significant nativity gap in 1990, and a significant nativity gap only for interest bearing accounts
in 1996. Meanwhile, the year 2001 interaction terms are negative and significant in all cases.
This confirms the results from Figure 1, which showed a more acute nativity gap-concentration
19
We choose the linear probability over a logit or probit model due to the ease of interpreting interaction effects,
which are more complicated in non-linear models (Ai and Norton 2003). For robustness we also estimate logit
models. Results are available upon request.

16
relationship in 2001 than other years. It also confirms that the nativity gap was significantly
larger in 2001 than in 1990 or 1996, and thus has worsened over time.20
We next estimate equation (1) including controls for immigrant concentration. The
results are presented in Table 4. We report population weighted, average marginal effects.21
Robust standard errors, clustered at the MSA level, are shown in the parentheses. We first
estimate equation (1) without immigrant-concentration interaction terms to check the general
effects of immigrant concentration on overall bank use. Next we include the concentration
interaction. Finally we estimate with the full set of controls on the sample which excludes Los
Angeles, an outlier MSA in terms of immigrant concentration.
First, we find no effect of the concentration of immigrants on overall bank use. All direct
effects of immigrant concentration are insignificant except for a marginally significant positive
effect of the concentration of Asian immigrants on the probability of having interest bearing
bank account in two of the three models. This supports the hypothesis that it is specifically
immigrant networks that provide informal finance opportunities.
The next set of coefficients provides evidence that immigrant concentration plays a role
in determining the size and increasing severity of the nativity gap in bank use. There is a
differential impact of immigrant concentration on immigrants. The coefficients on the
interaction terms are negative in all of the estimations. Estimates are statistically significant for
interest bearing bank accounts and for all bank accounts when we include Los Angeles. Thus
20
We also estimate the nativity gap in subsamples of Hispanic and Asian households in case the nativity gap varies
by ethnicity, something that the ethnicity dummy variables would not capture. We find that not only does the
nativity gap hold, it is larger and increasing more severely in the subsamples of Hispanic and Asian households. For
example, Hispanic and Asian immigrants are 6.4% and 7.1% less likely, respectively, to have bank accounts than
Hispanic and Asian native households. These results are available upon request. 21
The results for the full set of controls are shown in the appendix. The signs and precision of the coefficients are
similar to those found in other studies (Cobb-Clark and Hildebrand 2006a; Osili and Paulson 2006a). For
households headed by individuals who are Black, Hispanic, less educated, unmarried, and have lower income and/or
are less likely to hold a bank account.

17
even after controlling for individual and MSA characteristics, immigrants living in MSAs with a
higher concentration of immigrants from their source region are significantly less likely to have a
bank account. For example, the coefficient on the interaction term for interest bearing bank
accounts (column 5) indicates that if the concentration of immigrants from a household’s source
region increases by 10%, the probability that the average immigrant household has a bank
account relative to similar natives and immigrants from different regions of origin falls by 3.2% .
Holding other factors constant, larger enclaves are significantly associated with lower bank use
among immigrants.22
The results have implications for changes in immigrant concentration over time. Our
results suggest that, even after controlling for changes in observable characteristics, as the
percentage of immigrants from certain source regions increases in a city the probability that
immigrants from that region have bank accounts falls. This is curious given that barriers to bank
use, such as lack of services in languages other than English and proximity of branches, are more
likely to fall as the concentration of immigrants from particular regions increase. Furthermore,
we find that these effects are largest for interest bearing bank accounts, which can have serious
repercussions for asset accumulation. While we attribute these enclave effects to informal
networks in immigrant communities, we recognize concerns that the effects may be attributable
to unobservable individual, cohort, or MSA level factors that are distinct from informal
networks. In the following section we address concerns regarding the endogeneity of the
immigrant concentration variable, which can lead to biased enclave effect estimates.
22
The effects are identified by changes within MSA, across time. Overall, we find that the MSA-level variation
carries the most weight as compared with time variation.

18
Section IV: Robustness Checks
In this section we examine the robustness of our main findings. The main concerns
surrounding our results are that unobservable factors at the MSA, household, or year of arrival
cohort level may drive the relationship between immigrant concentration and immigrant bank
use, leading to a spurious correlation between the two. In particular, this would threaten our
argument that the channel through which immigrant concentration impacts bank use is the
availability of informal networks. We address each concern in turn.
We start with concerns about unobserved MSA level characteristics. The problem is that
the concentration of immigrants from an individual’s source region may pick up unobservable
time varying, MSA characteristics which jointly determine immigrant bank use and immigrant
concentration. If this is the case, higher concentration is associated with lower bank use for
reasons that have nothing to do with informal networks. Note that our model includes both MSA
and year fixed effects as well as number of bank branches and unemployment rate which vary
within MSA over time. However, unobservables include the supply of banking services, other
economic shocks, and ethnic differences in bank use. We carry out robustness checks for each.
First, the supply of banking services, particularly quasi banking services like check
cashing, payday loans, money transfers and pawn shops, may not be captured by the number of
bank branches in a given area. In equation (1) we have attempted to control for these
characteristics by including the uninteracted concentration of Latin America, Asian, European
and other immigrants in an MSA, netting out the average effect of immigrant concentration on
bank use by MSA. The difficulty, however, is that the general concentration variable does not
pick up factors that impact natives and immigrants differently. For example, if quasi-banking
services locate more heavily in areas with a higher concentration of immigrants and if

19
immigrants use them more than natives, we could get a negative relationship between
concentration of immigrants and immigrant bank use. In this case the link with informal
networks becomes spurious, as the enclave effects would be entirely driven by the provision of
quasi banking services.
To account for the potential bias from quasi-banking services, we would like to include
data on the location and growth of quasi-banking services. However, comprehensive data over
the entire period of our study is not available. Instead we argue that if our specification does not
account for quasi-banking sector growth, the concentration of immigrants from regions other
than an individual’s source region should have similar effects as the concentration of immigrants
from an individual’s source region. If our story holds, the importance of immigrant
concentration lies in immigrants from the same region of origin living in an MSA, not in the
concentration of immigrants from other regions. For example, the bank use of an immigrant
from Europe should not be impacted by the concentration of immigrants from Asia living in their
MSA if it is the case that informal, source region-specific networks are a substitute for formal
banking.
To test this hypothesis we replace the original interaction term with one that interacts
immigrant status with the concentration of immigrants from regions other than an individual’s
source region ( jimmtjsconc ,)1( * ). If the hypothesis holds the sign on this interaction term
should be negative and significant. We re-estimate bank use with this interaction term, including
controls for permanent residency status and time in the U.S. Results are shown in the first panel
of Table 5. We find limited evidence to support the hypothesis that the concentration of
immigrants from other source regions impacts the bank use of immigrant households. In two
out of three cases the coefficients are insignificant. While the coefficients for interest bearing
20
bank accounts is marginally significant, the significance is much smaller than the corresponding
estimate in Table 4, so we take this as evidence that region-specific networks have, if anything, a
stronger effect than alternate source region networks. These results further support our argument
that the channel through which immigrant concentration impacts bank use is through the
availability of informal networks.
Second, unobservable economic shocks to MSAs may not be fully captured in our
unemployment rate control variable. These shocks could jointly determine immigrant bank use
and immigrant concentration and thus bias our findings. Thus we instrument for immigrant
concentration for the year in question using immigrant concentration in 1970. This instrumental
variable strategy exploits the chain-based migration patterns of immigrants to the US. Historical
patterns of settlement of immigrants are a strong predictor of current settlement within source
country groups (Cortes 2008). However, we expect the 1970 distribution of immigrants across
MSA to be unrelated to current economic shocks. To construct the IV, we essentially reallocate
immigrants in year t according to their distribution in 1970 as follows:
1970
1970
js
jt
j j
II
I
where I is the number of immigrants and s represents MSA. 1970 statistics are calculated from
the Decennial Census. Native-born are reallocated in the same fashion. The ratio of immigrant
to native plus immigrant within MSA instruments for our key variable of interest, jimmsjtconc ,* .
We estimate bank use using two stage least squares. First stage results, reported in the
Appendix, indicate a high degree of correlation between the instrument and variable of interest.
The results from the second stage are reported in the second panel of Table 5. The number of
observations in the IV estimation has fallen due to the absence of information on 1970 immigrant

21
concentration for several MSAs in the sample. Also, we omit the control variable sjtconc to
simplify the IV calculation and thus also present baseline OLS results omitting concentration
measures other than the interaction term and MSAs that have no 1970 Census data for
comparison. We find that instrumenting does not change the magnitude of our baseline results
much. The standard errors on the all bank account regression increase, but statistical
significance is maintained. These results lend confidence to the conclusion that our results are
not driven purely by economic shocks.
Third, we are concerned that immigrant concentration may be picking up ethnic
differentials in bank use rather than immigrant concentration effects. If immigrant
concentrations proxy for the ethnic concentration of cities and differences in banking preferences
for ethnic groups across cities, and if immigrant households mirror the banking preferences of
natives from similar ethnic backgrounds, the negative relationship between immigrant
concentration and bank use could be a story about different preferences regarding banks rather
than a story of immigrant enclaves. To address this concern we test if our measure of immigrant
informal networks is indeed specific to immigrants. If our proxy for immigrant networks is
valid, the variable should not explain bank use differentials among the native-born. For
example, if the immigrant enclave size in fact measures immigrant informal networks, immigrant
enclave size should have no power in explaining differences in bank use between native-born
whites and native-born Latinos (Borjas 1986). We test this by estimating bank use only on the
sample of native households and interacting concentration with Mexican-American natives, all
Latin American natives, and Asian American natives. These interaction terms tell us, for
example, if Mexican-American households living in MSAs with a higher concentration of
Mexican immigrants are more or less likely to have a bank account than comparable non-

22
Mexican American natives. The results, presented in the third panel of Table 5, show no
evidence that our measure of immigrant informal networks has a similar effect on natives of
similar ethnic backgrounds. The coefficients on the native-immigrant concentration terms are
either insignificant or positive and significant. This implies that Mexican-American native
households living in areas with a higher concentration of immigrants from Mexico and Central
America are more, rather than less, likely to have a bank account.
Next we move on to concerns that the classification of households in our analysis.
First, it is possible that we misclassify households comprised of native-immigrant couples,
leading to biased estimates of bank behavior. In our original analysis we classify households as
“immigrant” or “native” based on the nativity status of the head of household. Here we define
households more restrictively, considering couple immigrant households to be those in which
both partners are foreign born (following Cobb-Clark and Hildebrand 2006b) and couple native
households to be those in which both partners are native born.23
In doing this we remove
roughly 1,300 mixed couple headed households from the analysis. We re-estimate bank use on
this sample and find no significant change in the results. Results are available upon request.
Other concerns arise regarding immigrant legal status, which is notoriously difficult to
measure. There likely is heterogeneity in formal banking behavior between undocumented and
documented immigrants, and if undocumented immigrants comprise a large enough portion of
the immigrant sample and if they are more likely to locate in enclaves, we could get a negative
relationship between immigrant concentration and bank use only because undocumented
23
We define couple households where one spouse is native and the other immigrant as a mixed native-immigrant
household. We do not consider unmarried partners, as there was not a separate category for this status in 1990. In
1990 there are 382 mixed native-immigrant households in our sample. In 1996 there are 489 mixed households. In
2001 there are 495 mixed households.

23
immigrants are less likely to have a bank account. Furthermore, the increasing nativity gap
could simply reflect an increase in undocumented immigration relative to legal immigration.
While we cannot do much more to infer legal status, we can limit the sample to less
heterogeneous groups of immigrants. First we limit potential for undocumented immigrants to
bias our results by considering only those who report becoming naturalized US citizens. There is
likely misreporting in this variable, but we expect it to be less contaminated by undocumented
immigrants, since they would be more likely to report at most permanent residency. Second, we
try expand the sample that is more likely to be documented to include immigrants who report
permanent residency status. Finally, to narrow in on undocumented immigrants we run
estimations for the sample of immigrants who report non-permanent residence and have less than
a high school education, as these characteristics are found to be among the strongest predictors of
legal status (Orrenius and Zavodny 2005).24
Results are shown in the first panel of Table 6.
Overall, the results are in line with our expectations. For naturalized immigrants the
coefficient of interest is smaller and insignificant. For permanent residents, the coefficient is
negative, and significant for interest bearing accounts. Finally, for the group of most likely
undocumented immigrants, the coefficient are significantly larger than for the entire immigrant
sample. Due to the small sample, however, the level of precision falls greatly. While it would be
ideal to have larger samples of immigrants based on residency status, we are thus confident that
our results are are not being driven completely by one legal status group of immigrants and are
consistent with hypothesis on why enclaves matter in the financial behavior of immigrants..
There are additional concerns about length of time in the U.S., as immigrant
concentration may matter more for new immigrants. While we control for time in the U.S. in
24
Mexican birth along with education and young age are the strongest predictors of undocumented status. However,
restricting our sample along all three dimensions makes the SIPP sample so small that we cannot reliably estimate
the model. Thus, we use education and reported citizenship status as a reasonable proxy.

24
most of the estimations we do not separately interact it with concentration and thus do not pick
up a differential impact by tenure in the U.S. As a result we separately estimate bank use on sub-
samples that include natives and immigrants who have been in the U.S. less than 5 years, natives
and immigrants who have been in the U.S. between 6 and 10 years, and immigrants who have
been in the U.S. more than 10 years. Results are shown in the second half of Table 6. In
general the pattern of coefficients is in line with expectations, with larger effects for newer
immigrants than more established ones. Nevertheless, we still find a negative and significant
effect for immigrants with a tenure in the U.S. of 11 years or more, which means the effects are
not completely dominated by new immigrants.
Next, we are concerned with potential sorting into MSAs based on unobservable
individual characteristics also related to bank use. Self-selection into MSAs with a higher
concentration of immigrants from a similar region of origin is a concern given that both
immigrant and bank location choice, in most cases, is non-random. For example, more
industrious immigrants could be more likely to move to areas where immigrants from their
region have less of a presence, while less industrious immigrants are those who are more likely
to stay in concentrated areas (Bohn 2009). If industriousness is positively correlated with having
a bank account, then our coefficients of interest actually pick up immigrant ability rather than
informal networks. One could argue that this endogeneity goes in the other direction as well. If
lower ability immigrants are deflected from cities with high concentrations of immigrants in the
face of stiff labor market competition (Light 2006), then our estimates may be biased
downwards.
The ideal experiment would be to randomly assign individuals to cities and observe their
banking choices. Other authors have used similar quasi-experiments to examine enclave effects

25
on various labor market outcomes in Scandinavia (Damm 2009, Edin, Fredriksson and Aslund
2003). In the U.S. context however, we have few, if any, similar natural experiments to exploit.
A second-best strategy would be to exploit an instrumental variable, but we have not uncovered
one suitable here. The instrumental variable employed above, using historical immigration
patterns, would be suitable if one were to assume that the 1970 ethnic and unobserved ability
distribution of immigrants is unrelated to the same distribution now. Indeed it is very unlikely
that ability bias is constant across 20-30 years of immigrant arrival cohorts from the same region,
thereby making the proposed instrument orthogonal to the source of endogeneity in our model.
In this case, as Table 5 showed, there is no evidence for large biases in our baseline model.
However, given the lack of consensus in the literature on whether ethnic enclaves are related
positively or negatively to unobserved ability, we do not rely completely on the IV results.
Instead, we attempt to control for individual ability using a proxy available in the SIPP.
We use self employment to proxy for the industriousness/ability of individuals and re-estimate
bank use including a measure of self-employment in addition to all of the controls in the initial
estimation.25
Since our model includes MSA fixed effects, the key concern here is that changes
in bank use and location choice are ability biased. The results are in panel A of Table 7. We see
no significant changes in the results, as the coefficient on the interaction term is negative and
significant for both interest bearing bank accounts and all bank accounts. While we recognize
that self-employment may not completely control for skill, the fact that our estimates are robust
to the inclusion of viable proxy measures leads us to believe the concentration effects are not
completely a story of immigrant self-selection.
25
In the SIPP, self employment is best measured by ownership of businesses. We regard self employment broadly,
defined as anyone who reports owning at least 1 business. We would have liked to include language ability as well,
but this variable is not available until 2004 in the SIPP. .

26
A related concern regards the changing composition of the immigrant population over
time. While we control for tenure in the U.S., our estimations may fail to capture important,
unobservable information about differences in arrival cohorts. Cohort effects may bias our
estimates of the relationship between immigrant enclaves and bank use if the composition of
immigrants has changed over time, in ways not captured by our socioeconomic controls.26
To
examine the relationship between bank use and immigrant concentration by cohort, we hold the
arrival cohort constant by restricting our sample to immigrants who arrived between different
periods. We consider two year of arrival cohorts: immigrants who arrived between 1980 and
1985; and immigrants who arrived between 1985 and 1990. Consider, for example, the 1985-
1990 cohort. These immigrants were “new” in 1990, with 0-5 years tenure in the U.S. In 1996,
they had 6-11 years tenure, and in 2001, 11-16 years. The relationship between bank use and
immigrant concentration for this arrival cohort is not biased by unobservable skill that is time-
invariant. In the analysis we also restrict the age range of the natives in the sample to match
those of the restricted immigrant cohort group. The results are shown in the second panel of
Table 7. Overall we find no evidence that cohort effects bias our results. The coefficient for
interest bearing bank accounts and all bank accounts is negative and significant for the 1980-
1985 and the 1985-1990 cohorts.
Overall our results are robust to a variety of controls for heterogeneity at the MSA,
individual level and year of arrival cohort level. We recognize that we are limited in our ability
to perfectly control for the problem of self-selection, given the absence of a good instrument for
immigrant concentration. Nevertheless, the robustness of our results leads us to be confident that
the concentration effects are not purely a story of self-selection. We are therefore confident to
26
At present the literature is undecided on the changes in immigrant cohorts over the period of our study. While the
findings in Borjas (1985, 1995) suggested significant declines in unobservable skill of immigrant cohorts, recent
evidence finds otherwise (Bohn 2009b; Smith 2006).
27
conclude that there is a negative impact on banking participation for immigrants residing in
MSAs with higher concentrations of similar immigrants.
Section V: Conclusions
In this paper we propose a new demand side explanation for low bank use among
immigrants in the U.S. We hypothesize that immigrants living in areas with a higher
concentration of immigrants from their region of origin may be less banked due to the
availability of informal financing options. We test this theory using data from the SIPP, Census
and the FDIC and find evidence that immigrants living in concentrated immigrant areas are
significantly less likely to have a bank account. The effects we find are large, and can
potentially explain the persistence of the nativity gap in bank use as well as the increase in this
gap over time.
The findings in this paper are positive rather than normative. We recognize that the role
of bank accounts in the economic outcomes of immigrant households, such as wealth
accumulation, is unclear. An inverse link between bank use and enclave size may be troubling if
it indicates a low propensity among immigrants to save and thus progress economically. If, on
the other hand, informal financial services are good substitutes for formal ones, households may
make rational choices to remain unbanked. In this case, nativity gaps in bank use may not be
linked with different economic outcomes.
Our results have important implications for policymakers and financial institutions aiming to
increase bank use among immigrant households. Limited demand may play a major role in
deterring some immigrants from opening and maintaining back accounts, and understanding the
sources of muted demand is necessary for determining how to modify banking services to reach

28
underserved communities. Reliance on informal networks may help explain the persistence of
underserved communities and shed light on the limits of banking sector outreach to them.

29
REFERENCES
Ai, Chunrong, Norton, Edward.C., 2003. “Interaction Terms in Logit and Probit Models,”
Economics Letters 80, 123-129.
Andersson, Fredrik, Simon Burgess and Julia Lane, 2009. “Do as the Neighbors Do: The Impact
of Social Networks on Immigrant Employment”, IZA Discussion Paper No. 4423.
Banerjee, Abhijit and Andrew Newman (1993). “Occupational Choice and the Process of
Development,” Journal of Political Economy. 101: 274-298.
Bernanke, Ben (April 16, 2004). Speech given at the Financial Access for Immigrants: Learning
from Diverse Perspectives Conference, Federal Reserve Bank of Chicago.
Bertrand, Marianne, Erzo Luttmer, and Sendhil Mullainathan (2000). “Network Effects and
Welfare Cultures”, Quarterly Journal of Economics 115(3): pp. 1019-1055.
Bond, Philip and Robert Townsend (1996). “Formal and informal financing in a Chicago ethnic
neighborhood,” Economic Perspectives, Federal Reserve Bank of Chicago, July issue,
pgs 3-27.
Bohn, Sarah (2009). “New Patterns of Immigrant Settlement in California,” Public Policy
Institute of California.
Bohn, Sarah (2009b). “The Quantity and Quality of New Immigrants to the U.S.”, forthcoming
Review of Economics of the Household.
Borjas, George (1995). “Ethnicity, Neighborhoods, and Human-Capital Externalities”, American
Economic Review 85(3): pp. 365-390.
Borjas, George (1986). “The Self-Employment Experience of Immigrants”, Journal of Human
Resources 21(4): pp. 485-506.
Carney, Stacie and William Gale (2001). “Asset Accumulation among Low-Income
Households.” In Assets for the Poor, ed. Thomas Shapiro and Edward Wolff, pgs 165-
205. New York: Russell Sage Foundation.
Chiswick, Barry and Paul Miller (2005). “Do Enclaves Matter in Immigrant Adjustment”, City
& Community 4: pp.5-35.
Cobb-Clark, Deborah A. and Vincent A. Hildebrand (2006a). “The Wealth and Asset Holding of
U.S.-Born and Foreign-Born Households: Evidence from SIPP Data,” Review of Income
and Wealth. Vol. 52(1), pgs 17-42.
Cobb-Clark, Deborah A. and Vincent A. Hildebrand (2006b). “The Wealth of Mexican
Americans,” The Journal of Human Resources. Vol (4).
30
Cortes, Patricia (2008). “The Effect of Low-Skilled Immigration on US Prices: Evidence from
CPI Data,” Journal of Political Economy, Vol. 116(3).
Damm, Anna Piil (2009). “Ethnic Enclaves and Immigrant Labor Market Outcomes: Quasi-
Experimental Evidence,” Journal of Labor Economics, Vol 27(2).
Edin, Per-Anders, Peter Fredriksson, and Olof Aslund (2003). “Ethnic Enclaves and the
Economic Success of Immigrants—Evidence From a Natural Experiment,” Quarterly
Journal of Economics, Vol 118(1).
Haughney, Christine (2009). “City’s Poor Still Distrust Banks”, New York Times. 8/28/2009.
Hellerstein, Judith, Melissa McInerney, and David Neumark (2009). “Spatial Mismatch,
Immigrant Networks, and Hispanic Employment in the United States,” NBER Working
Paper No. 15398.
Light, Ivan (2006). Deflecting Migration: Networks, Markets and Regulation in Los Angeles.
New York: Russell Sage Foundation.
Light, Ivan and Zhong Deng (1995). “Gender Differences in ROSCA Participation within
Korean Business Households in Los Angeles.” In Money-Go-Rounds; The Importance of
Rotating Savings and Credit Associations for Women, ed. Shirley Ardener and Sandra
Burman for the Centre for Cross-Cultural Research on Women, Berg: University of
Oxford.
Orrenius, Pia and Madeline Zavodny (2005). “Self-selection among Undocumented Immigrants
from Mexico,” Journal of Development Economics Vol. 78(1), pgs 215-240.
Osili, Una Okonkwo and Anna Paulson (2006a). “What Can We Learn about Financial Access
from U.S. Immigrants?,” Working Paper Series WP 2006-25, Federal Reserve Bank of
Chicago Working Paper.
Osili, Una Okonkwo and Anna Paulson (2006b). “Immigrant-Native Differences in Financial
Market Participation” Working Paper Series WP 2004-18, Federal Reserve Bank of
Chicago Working Paper.
Osili, Una Okonkwo and Anna Paulson (2008). “Institutions and Financial Development:
Evidence from International Migrants in the United States.” Review of Economics and
Statistics, Vol. 90(3), 498-517.
Passel, Jeffrey and D’Vera Cohn (2008). “Trends in Unauthorized Immigration: Undocumented Inflow
Now Trails Legal Inflow,” Pew Hispanic Center Report.
Paulson, Anna and Sherrie L.W. Rhine (2008). “Financial Assimilation of an Immigrant Group:
Evidence on the Use of Checking and Savings Accounts.” Journal of Family and
Economic Issues, Vol.29 (4) (12).
31
Rhine, Sherrie L. W. and William H. Greene (2006). “The Determinants of Being Unbanked for
U.S. Immigrants.” The Journal of Consumer Affairs, Vol. 40 (1), pgs 21-40.
Rhine, Sherrie L.W., William H. Greene and Maude Toussaint-Comeau (2006). “The
Importance of Check-Cashing Businesses to the Unbanked: Racial/Ethnic Differences.”
The Review of Economics and Statistics, Vol.88(1), pgs 146-157.
Smith, James (2006). “Immigrants and the Labor Market”, Journal of Labor Economics Vol
24(2), pgs 203-233.
Washington, Ebonya (2006). “The Impact of Banking and Fringe Banking Regulation on the
Number of Unbanked Americans,” Journal of Human Resources, Vol. 41(1), pgs 106-
137.
32
TABLE AND FIGURES
Figure 1: Average Bank Use by MSA and Immigrant Concentration
Native
Immigrant
Native
Immigrant
Native
Immigrant
0.5
10
.51
0 .5
0 .5
1990 1996
2001
Native Households Native Fitted Value
Immigrant Households Immigrant Fitted Value
%H
Hs in M
SA
with a
Ban
k A
cco
un
t
% MSA Population that is Foreign Born
Slope coefficients & standard errors Natives: 1990 -.24 (.11)**, 1996 .05 (.11), 2001 .08 (.11) Immigrants: 1990 -.70 (.36)*, 1996 -.97 (.22)***, 2001 -.67 (.29)**
33
Figure 2: Distribution of Immigrant Concentration Across MSAs
05
10
15
20
25
Fre
qu
en
cy
0 .1 .2 .3 .4
% Population in MSA that are Immigrants from Latin America
1990 2000
Panel A. Concentration of Immigrants from Latin America
05
10
15
20
25
Fre
qu
en
cy
0 .1 .2 .3 .4
% Population in MSA that are Immigrants from Asia
1990 2000
Panel B. Concentration of Immigrants from Asia
MSAs included in 1990 and 2001 SIPP only

34
Table 1: Immigrants in Sample1
Region of Origin N
% Immigrants
in
Population2
Average
MSA
Concentration3
N
% Immigrants
in Population2
Average
MSA
Concentration3
N
% Immigrants
in
Population2
Average MSA
Concentration3
Latin America 496 33.2% 4.6% 796 39.6% 6.7% 785 40.0% 8.4%
Europe 222 19.0% 2.4% 302 16.3% 2.5% 278 14.8% 2.6%
Asia 296 24.9% 3.7% 520 27.6% 4.7% 538 29.1% 5.6%
Other 4
308 22.9% 2.2% 324 16.6% 2.7% 318 16.2% 3.1%
Total 1322 100.0% 12.9% 1942 100.0% 16.7% 1919 100.0% 19.8%
Time in U.S.
% with 0-5 years 188 14.2% 340 17.5% 305 15.9%
% with 6-10 years 305 23.1% 343 17.7% 284 14.8%
% with 11+ years 831 62.9% 1093 56.3% 1056 55.1%
Status
Naturalized Citizens 574 43.4% 771 39.8% 839 43.8%
Permanent Residents 5
- - 934 48.2% 770 40.2%
Non Permanent Residents 750 56.7% 234 12.1% 308 16.1%1 Region of Origin codes and data from the SIPP, MSA concentration data from the U.S. Census
2 Based on weighted percents from the sample to be representative of population rather than sample
3 MSA Concentration from 2000 Census. Weighted averages for all MSAs shown
4 Other includes the Caribbean, Africa, Oceania and other North America
5 Separate permanent residency status not available in 1990
1990 20011996

35
Table 2: Bank Use Summary Statistics
Population weighted
Bank Use, Full Sample Native Born Immigrant
% with any bank account
Year 1990 86.1% 78.1% 8.0% ***
Year 1996 83.5% 71.4% 12.1% ***
Year 2001 83.7% 69.8% 13.8% ***
% with interest bearing bank account
Year 1990 75.3% 67.5% 7.7% ***
Year 1996 72.3% 57.6% 14.6% ***
Year 2001 72.3% 55.7% 16.6% ***
Immigrant Households Only
Bank Use by Tenure 0-5 years 6-10 years 11+years
% with any bank account 67.1% 67.6% 76.3%
% with interst bearing account 51.0% 56.0% 63.5%
Bank Use by Status
Naturalized
Citizen
Permanent
Resident
Non Perm.
Res
% with any bank account 82.9% 65.5% 63.9%
% with int. bearing account 71.2% 50.0% 51.6%
Total Observations 26,231 4,423
Coefficients are population weighted averages
*** p<0.01, ** p<0.05, * p<0.1
Nativity Gap
36
Table 3: Nativity Gap in Bank Use
(1) (2) (3) (4) (5) (6)
Immigrant -0.041 -0.013 -0.003 -0.055 -0.009 0.006
(0.013)*** (0.016) (0.016) (0.013)*** (0.019) (0.016)
Immigrant*1996 -0.022 -0.025 -0.046 -0.056
(0.019) (0.023) (0.021)** (0.025)**
Immigrant*2001 -0.052 -0.055 -0.079 -0.083
(0.015)*** (0.018)*** (0.017)*** (0.020)***
L.A. Included Yes Yes No Yes Yes No
Observations 34,700 34,700 31,751 34,700 34,700 31,751
R-squared 0.222 0.222 0.224 0.213 0.214 0.214
Coefficients are population weighted marginal effects
Robust standard errors in parentheses*** p<0.01, ** p<0.05, * p<0.1
Other variables include:gender, ethnicity, education, age, age squared, marital status,
household income per capita in year 2000 dollars, whether or not home is owned
number of adults in the HH, number of children under 18 in the household,
MSA level unemployment, immigrant concentration, and total bank branches (FDIC)
MSA and year fixed effects
All Bank Accounts Interest Bearing

37
Table 4: Bank Use
(1) (2) (3) (4) (5) (6)
Head of HH is an immigrant from:
Latin America -0.035 0.002 0.000 -0.032 0.013 0.008
(0.030) (0.035) (0.042) (0.021) (0.020) (0.023)
Asia -0.024 -0.002 0.008 -0.071 -0.045 -0.038
(0.016) (0.021) (0.027) (0.023)*** (0.026)* (0.032)
Europe -0.011 -0.000 -0.003 -0.009 0.003 0.004
(0.013) (0.016) (0.019) (0.012) (0.014) (0.016)
Other 0.040 0.062 0.063 0.020 0.047 0.050
(0.018)** (0.020)*** (0.023)*** (0.015) (0.019)** (0.023)**
Concentration Immigrants
Latin America -0.244 -0.202 -0.437 -0.382 -0.331 -0.247
(0.280) (0.283) (0.352) (0.324) (0.324) (0.411)
Asia 1.320 1.345 1.419 1.564 1.593 1.573
(1.074) (1.080) (0.884) (0.876)* (0.877)* (0.890)*
Europe -3.594 -3.654 -3.796 -2.751 -2.825 -2.873
(2.501) (2.496) (2.581) (2.878) (2.846) (2.851)
Other 0.790 0.770 1.625 0.615 0.591 0.572
(0.875) (0.868) (1.132) (1.170) (1.147) (1.436)
ConcentrationImmigrants Region j* -0.262 -0.312 -0.321 -0.341
Immigrant Region j (0.138)* (0.240) (0.103)*** (0.170)**
L.A. Included Yes Yes No Yes Yes No
Observations 34,700 34,700 31,751 34,700 34,700 31,751
R-squared 0.224 0.224 0.225 0.215 0.216 0.215
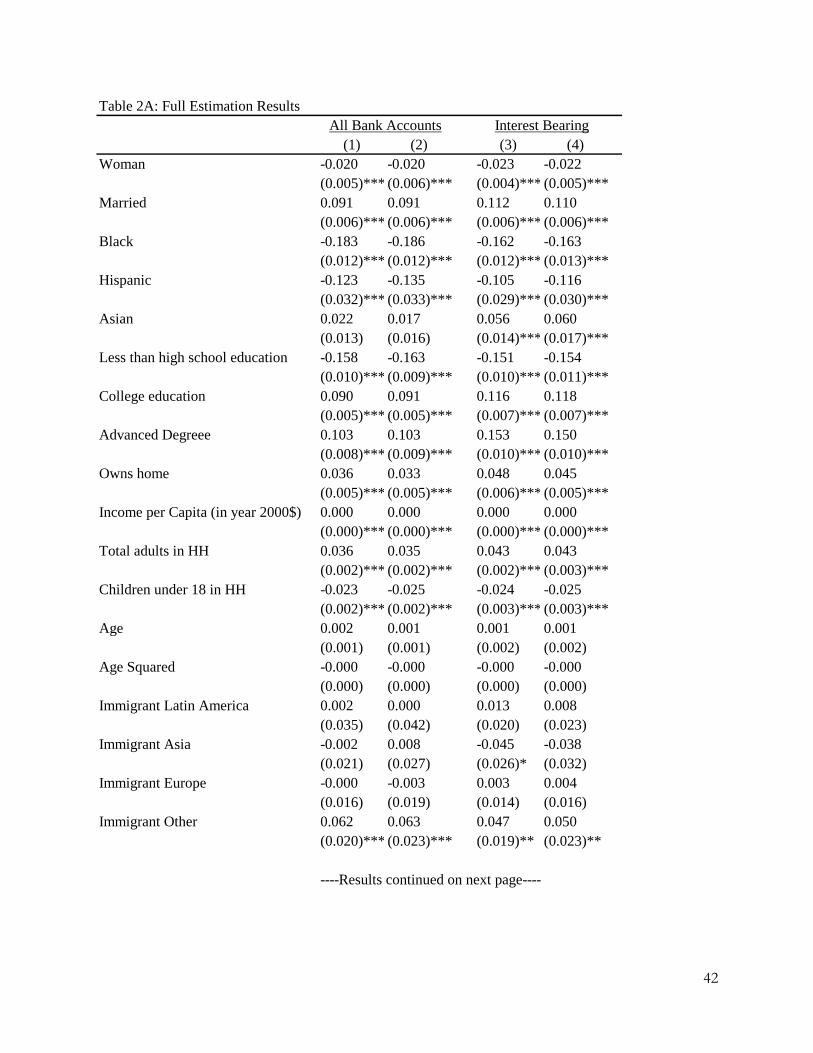
Coefficients are population weighted marginal effects
Robust standard errors in parentheses *** p<0.01, ** p<0.05, * p<0.1
Other variables include:gender, ethnicity, education, age, age squared, marital status, income per capita
in year 2000 dollars, whether or not home is owned, number of adults in the HH, number of children
under 18 in the household, MSA level unemployment and immigrant concentration, total bank branches
(FDIC), MSA and year fixed effects, and for immigrants, permanent residency status and time
in the U.S. Full estimation results in Appendix, Table 2A
Interest Bearing AccountsAll Bank Accounts

38
Table 5: Concentration of Immigrants from Other Regions & Concentration's Impact on Natives
Panel A: Concentration Immigrants Other
Regions of Origin All Accounts All Accounts
Interest
Bearing
Interest
Bearing
ConcentrationImmigrants Region j-1* -0.041 0.037 -0.192 -0.109
Immigrant (0.092) (0.102) (0.095)** (0.111)
L.A. included Yes No Yes No
Observations 34,700 31,751 34,700 31,751
R-squared 0.224 0.225 0.215 0.215
Panel B: IV All Accounts
Interest
Bearing All Accounts
Interest
Bearing
ConcentrationImmigrants Region j* -0.234 -0.355 -0.290 -0.477
Immigrant Region j (0.142) (0.117)** (0.168)* (0.209)**
Observations 33573 33573 33573 33573
R-squared 0.221 0.212 0.221 0.212
Panel C: ConcentrationImmigrants* Natives All Accounts
Interest
Bearing All Accounts
Interest
Bearing
ConcentrationImmigrantsMexico&CentralAmerica* 0.295 0.343
Mexican-American (0.176)* (0.152)**
ConcentrationImmigrantsLatinAmerica* 0.506 0.318
Hispanic (all Latin America) (0.161)*** (0.161)*
ConcentrationImmigrantsAsia* -0.289 -0.224 -0.290 -0.228
Asian-American (0.227) (0.282) (0.230) (0.282)
Observations 29,557 29,557 29,557 29,557
R-squared 0.220 0.209 0.220 0.2091 OLS results with no immigrant concentration other than interaction, for comparison
2 Second stage results. First stage results shown in the appendix
Coefficients are population weighted marginal effects
Robust standard errors in parentheses *** p<0.01, ** p<0.05, * p<0.1
Other variables include: gender, ethnicity, education, age, age squared, marital status,
household income per capita in year 2000 dollars, whether or not home is owned,
number of adults in the HH, number of children under 18 in the household,
MSA level unemployment and immigrant concentration, total bank branches (FDIC),
MSA and year fixed effects, permanent residency status and time in the U.S.
OLS 1
IV 2

39
Table 6: Sub-samples of Immigrant Households by Possible Legal Status & Time in U.S.
Panel A: Possible Legal Status
All Bank
Accounts
Interest
Bearing
All Bank
Accounts
Interest
Bearing
All Bank
Accounts
Interest
Bearing
ConcentrationImmigrants Region j* -0.062 -0.125 -0.144 -0.252 -0.629 -0.572
Immigrant Region j (0.108) (0.129) (0.126) (0.110)** (0.406) (0.411)
Observations 31,725 31,725 33,421 33,421 3,703 3,703
o/w Immigrant 2184 2184 3888 3888 519 519
Panel B: Time in U.S.
All Bank
Accounts
Interest
Bearing
All Bank
Accounts
Interest
Bearing
All Bank
Accounts
Interest
Bearing
ConcentrationImmigrants Region j* -0.219 -0.640 -0.434 -0.082 -0.264 -0.328
Immigrant Region j (0.350) (0.229)*** (0.242)* (0.242) (0.135)* (0.106)***
Observations 30,383 30,383 30,480 30,480 32,518 32,518
o/w Immigrant 833 833 932 932 2980 29801 Includes naturalized citizens
Coefficients are population weighted marginal effects
Robust standard errors in parentheses *** p<0.01, ** p<0.05, * p<0.1
Other variables include:gender, ethnicity, education, age, age squared, marital status, income per capita in year 2000 dollars
whether or not home is owned, number of adults in the HH, number of children under 18 in the household,
MSA level unemployment and immigrant concentration, total bank branches (FDIC), MSA and year fixed effects
Naturalized Citizens Permanent Residents 1
Likely Undocumented
0-5 years 6-11 years 11+ years

40
Table 7: Controls for Individual and Cohort Level Hetereogeneity
All Bank
Accounts
Interest
Bearing
ConcentrationImmigrants Region j* -0.262 -0.324
Immigrant Region j (0.138)* (0.103)***
Observations 34700 34700
R-squared 0.224 0.215
Cohort Fixed: Year of Arrival
All Bank
Accounts
Interest
Bearing
All Bank
Accounts
Interest
Bearing
ConcentrationImmigrants Region j* -0.541 -0.380 -0.145 -0.180
Immigrant Region j (0.188)*** (0.198)* (0.257) (0.185)
Observations 27,953 27,953 27,933 27,933
R-squared 0.218 0.208 0.222 0.211
Coefficients are population weighted marginal effects
Robust standard errors in parentheses *** p<0.01, ** p<0.05, * p<0.1
Other variables include:gender, ethnicity, education, age, age squared, marital status,
household income per capital in year 2000 dollars, whether or not home is owned
number of adults in the HH, number of children under 18 in the household,
MSA level unemployment and immigrant concentration, total bank branches (FDIC),
MSA and year fixed effects
Self Employment
1980-1985 1985-1990
41
APPENDIX
Table 1A. Immigrant Concentration for Sample of MSAs
Census Year
% of total population
Cen. Am. &
Mexico Asia
Cen. Am. &
Mexico Asia
Atlanta 0.71% 2.08% 4.70% 3.68%
Boston 0.72% 3.23% 1.45% 5.40%
Chicago 5.03% 3.26% 9.74% 4.92%
Dallas 5.58% 2.75% 13.02% 4.44%
Denver 1.68% 1.79% 7.61% 2.86%
Detroit 0.19% 2.12% 0.79% 4.08%
Houston 8.58% 3.69% 15.98% 5.54%
Las Vegas 3.88% 3.12% 13.07% 5.56%
Los Angeles 18.31% 9.02% 24.99% 11.52%
Miami 4.86% 1.48% 7.56% 2.22%
Minneapolis/St. Paul 0.16% 2.09% 1.59% 3.64%
New York 1.62% 5.33% 3.64% 8.35%
Phoenix 4.51% 1.53% 12.60% 2.66%
Seattle 0.38% 4.61% 2.04% 7.59%
San Francisco 5.85% 12.85% 10.26% 18.94%
Washington D.C. 1.60% 4.26% 3.82% 6.43%
1990 2000
42
Table 2A: Full Estimation Results
(1) (2) (3) (4)
Woman -0.020 -0.020 -0.023 -0.022
(0.005)*** (0.006)*** (0.004)*** (0.005)***
Married 0.091 0.091 0.112 0.110
(0.006)*** (0.006)*** (0.006)*** (0.006)***
Black -0.183 -0.186 -0.162 -0.163
(0.012)*** (0.012)*** (0.012)*** (0.013)***
Hispanic -0.123 -0.135 -0.105 -0.116
(0.032)*** (0.033)*** (0.029)*** (0.030)***
Asian 0.022 0.017 0.056 0.060
(0.013) (0.016) (0.014)*** (0.017)***
Less than high school education -0.158 -0.163 -0.151 -0.154
(0.010)*** (0.009)*** (0.010)*** (0.011)***
College education 0.090 0.091 0.116 0.118
(0.005)*** (0.005)*** (0.007)*** (0.007)***
Advanced Degreee 0.103 0.103 0.153 0.150
(0.008)*** (0.009)*** (0.010)*** (0.010)***
Owns home 0.036 0.033 0.048 0.045
(0.005)*** (0.005)*** (0.006)*** (0.005)***
Income per Capita (in year 2000$) 0.000 0.000 0.000 0.000
(0.000)*** (0.000)*** (0.000)*** (0.000)***
Total adults in HH 0.036 0.035 0.043 0.043
(0.002)*** (0.002)*** (0.002)*** (0.003)***
Children under 18 in HH -0.023 -0.025 -0.024 -0.025
(0.002)*** (0.002)*** (0.003)*** (0.003)***
Age 0.002 0.001 0.001 0.001
(0.001) (0.001) (0.002) (0.002)
Age Squared -0.000 -0.000 -0.000 -0.000
(0.000) (0.000) (0.000) (0.000)
Immigrant Latin America 0.002 0.000 0.013 0.008
(0.035) (0.042) (0.020) (0.023)
Immigrant Asia -0.002 0.008 -0.045 -0.038
(0.021) (0.027) (0.026)* (0.032)
Immigrant Europe -0.000 -0.003 0.003 0.004
(0.016) (0.019) (0.014) (0.016)
Immigrant Other 0.062 0.063 0.047 0.050
(0.020)*** (0.023)*** (0.019)** (0.023)**
----Results continued on next page----
All Bank Accounts Interest Bearing

43
Table 2A: Full Estimation Results, continued
(1) (2) (3) (4)
Non Permanent Resident -0.052 -0.030 -0.035 -0.004
(0.023)** (0.016)* (0.030) (0.016)
Time in U.S. 0-5 years -0.070 -0.064 -0.114 -0.122
(0.021)*** (0.025)** (0.024)*** (0.025)***
Time in U.S. 6-11 years -0.052 -0.045 -0.048 -0.044
(0.019)*** (0.023)* (0.013)*** (0.016)***
Concentration Immigrants:
Latin America -0.202 -0.437 -0.331 -0.247
(0.283) (0.352) (0.324) (0.411)
Asia 1.345 1.419 1.593 1.573
(1.080) (0.884) (0.877)* (0.890)*
Europe -3.654 -3.796 -2.825 -2.873
(2.496) (2.581) (2.846) (2.851)
Other 0.770 1.625 0.591 0.572
(0.868) (1.132) (1.147) (1.436)
MSA unemployment -0.003 -0.004 -0.002 -0.001
(0.003) (0.003) (0.004) (0.004)
MSA bank branches 0.000 0.000 0.000 0.000
(0.000) (0.000)** (0.000) (0.000)
Year 1996 -0.063 -0.065 -0.078 -0.077
(0.018)*** (0.017)*** (0.017)*** (0.017)***
Year 2001 -0.045 -0.044 -0.057 -0.056
(0.011)*** (0.011)*** (0.011)*** (0.011)***
ConcentrationImmigrants Region j* -0.262 -0.312 -0.321 -0.341
Immigrant Region j (0.138)* (0.240) (0.103)*** (0.170)**
L.A. Included Yes No Yes No
Observations 34,700 31,751 34,700 31,751
R-squared 0.224 0.225 0.216 0.215
Robust standard errors in parentheses
*** p<0.01, ** p<0.05, * p<0.1
Other controls include MSA fixed effects
All Bank Accounts Interest Bearing
Coefficients are population weighted marginal effects

44
Table 3A: First Stage Results
Outcome variable ConcentrationImmigrants Region j*
Immigrant Region j
ConcentrationImmigrants1970 Region j* 0.311
Immigrant Region j (0.109)***
Woman 0.000
(0.000)
Married 0.000
(0.000)
Black -0.000
(0.000)
Hispanic 0.004
(0.002)*
Asian 0.000
(0.002)
Less than high school education 0.001
(0.001)
College education -0.001
(0.000)***
Advanced Degreee -0.001
(0.000)**
Immigrant Latin America 0.069
(0.018)***
Immigrant Asia 0.048
(0.011)***
Immigrant Europe 0.024
(0.007)***
Immigrant Other 0.045
(0.018)**
Non Permanent Resident -0.003
(0.003)
Income per Capita -0.000
(0.000)
Home ownership -0.000
(0.000)
Observations 33,573
R-squared 0.892
Robust standard errors in parentheses
*** p<0.01, ** p<0.05, * p<0.1
Other controls include age, age squared, number of adults, time in U.S.,
number of children 18 & under, year and MSA fixed effects