Ethnic Concentration and Language Fluency of Immigrants ...
71
1 Ethnic Concentration and Language Fluency of Immigrants: Evidence from the Guest-Worker Placement in Germany Abstract This paper analyses the impact of regional ethnic concentration on the language proficiency and language use of immigrants. It solves the endogeneity of immigrants’ location choices by exploiting a peculiar episode of the German immigration history: the exogenous placement of guest-workers after WWII, one of the largest guest-worker programs on record. The econometric approach accounts for several sources of measurement error and provides a falsification exercise that hypothetically relocates the most language proficient immigrants into ethnic enclaves to test the extent of cross-regional sorting necessary to render the results purely spurious. The results show a robust negative effect of ethnic concentration on immigrants’ language ability which is driven by differences in contact rates with natives and not by differences in the willingness to integrate. Simple policy simulations suggest education-based entry restrictions as powerful tools for fostering language acquisition and the integration of immigrants. Keywords: Guest-worker program, enclave, ethnic concentration, human capital, immigrant, migrant sorting, integration, misclassification error, hypothetical relocation JEL Codes: J61, R23, F22
Transcript of Ethnic Concentration and Language Fluency of Immigrants ...

1
Ethnic Concentration and Language Fluency of Immigrants:
Evidence from the Guest-Worker Placement in Germany
Abstract
This paper analyses the impact of regional ethnic concentration on the language proficiency
and language use of immigrants. It solves the endogeneity of immigrants’ location choices by
exploiting a peculiar episode of the German immigration history: the exogenous placement of
guest-workers after WWII, one of the largest guest-worker programs on record. The
econometric approach accounts for several sources of measurement error and provides a
falsification exercise that hypothetically relocates the most language proficient immigrants into
ethnic enclaves to test the extent of cross-regional sorting necessary to render the results purely
spurious. The results show a robust negative effect of ethnic concentration on immigrants’
language ability which is driven by differences in contact rates with natives and not by
differences in the willingness to integrate. Simple policy simulations suggest education-based
entry restrictions as powerful tools for fostering language acquisition and the integration of
immigrants.
Keywords: Guest-worker program, enclave, ethnic concentration, human capital, immigrant,
migrant sorting, integration, misclassification error, hypothetical relocation
JEL Codes: J61, R23, F22

2
1. Introduction
Most developed countries' populations consist to a large degree of immigrants and their
descendants. Governments devote significant resources and efforts to the integration of
immigrants into their host country since failed integration bears substantial social costs as
evidenced in many cities of the industrialized world. An often articulated political concern
refers to immigrant groups forming self-sufficient enclaves characterised by poverty risk,
unemployment and cultural isolation which might ultimately exert negative externalities even
on immigrants who were willing and able to integrate. These local ethnic externalities can pass
inequalities and disadvantages down generations (Borjas, 1995; 1998; and Alba et al, 2002).
On the micro-level, failed integration is often reflected in the failure of immigrants to learn the
host country's language to a sufficient or desired degree. Language skills have been amply
shown to be important determinants of labor market outcomes (Grenier, 1984; Dustmann, 1994;
Dustmann and van Soest, 2001; 2002; Chiswick and Miller, 1995; 2002; Dustmann and Fabbri,
2003; Berman et al., 2003; Bleakley and Chin, 2004; Aldashev et al., 2009), but extend to many
areas outside the labor market, specifically relating to societal integration (e.g. participation in
the civil society; Danzer and Yaman, 2013).
This paper is the first one to analyze the causal effect of ethnic segregation on the
language proficiency and language use of immigrants by means of a quasi-experiment. Our
research question is: How large is the negative causal effect of exposure to an ethnic enclave
on language acquisition and language use—ruling out differences in language ability? What is
the political importance of anti-enclave policies, compared to alternatives? The application is
for the guest-worker recruitment in Germany during the 1960s and early 1970s. Guest-worker
programs have been used by US and Western European governments to actively recruit foreign
workers in times of labor shortages, and the German scheme is with more than 2 million guest-
3
workers one of the largest programs on record (Hansen, 1979; Castles 1986)1. Immigrants from
different home countries were exogenously placed in firms across West Germany, allowing us
to estimate the causal effect of own-ethnicity concentration on language proficiency. This
unique set-up allows identifying the enclave effect for regional entities of 135-500 thousand
inhabitants (Anpassungsschichten) from variation in contact rates with natives while ruling out
differences in immigrants’ willingness or ability to integrate and controlling for regional
differences in the incentives to learn a language. Hence, we rule out differences in economic
incentives and individual ability to explain the negative correlation between regional ethnic
concentration and immigrant language.
The contribution of this paper is fourfold: First, it complements the vast literature on the
negative labor markt consequences for immigrants of living in an ethnic enclave by directly
estimating one of the underlying human capital channels (proficiency in German). The
empirical analysis of the paper provides evidence of a small negative effect from ethnic
concentration on language fluency which is persistent across various immigrant subgroups.
This result survives a number of robustness checks, including those pertaining to measurement
error in the dependent and independent variables. Second, this paper is the first comprehensive
treatment of the guest-worker placement in Germany as quasi-experiment. By providing rich
details on the recruitment process and seriously addressing potential threats to identification,
this paper goes beyond earlier work on social networks and civic engagement of guest-workers
in Germany (like Danzer and Yaman, 2013). Third, in order to rule out the possibility of our
estimated enclave effects being driven by endogenous sorting of immigrants across regions, we
design a novel method providing extreme bounds. Specifically, we develop a falsification
exercise which simulates the extent of sorting needed to render the enclave effects purely
spurious. Fourth, the paper has a political dimension. It is informative about micro-level
1 The US Bracero program (1942-64) recruited around 4.5 million guest-workers.
4
consequences of the state’s recruitment activities in an international labor market. Living in an
enclave does causally aggravate language acquisition casting doubts on a widespread political
conviction that immigrants merely lack the willingness to integrate. Simple policy simulations
reveal the potential strength of selection criteria in the migration recruitment process on the
prospective integration of immigrants.
2. Literature and theoretical background
The literature on language acquisition of immigrants has distinguished between three
major determinants of language proficiency: 1) Economic incentives, 2) Exposure, 3)
Individual ability (see for example van Tubergen and Kalmijn, 2009; or Chiswick, Lee, and
Miller, 2005). Immigrants should learn the host country language better if the language
premium for earnings is higher (economic incentives), if they use and hear it more frequently
by either choice or necessity (exposure), and if they find it easier to learn for individual and
often unobserved reasons such as education and "being good with languages" (individual
ability). In practice disentangling these three factors has proven to be a challenging task, and in
most of the literature the exogeneity of the variable of interest – typically the share of
immigrants, or the share of inhabitants speaking the same first language as the immigrant in his
region of residence, henceforth denoted concentration or ethnic concentration – has simply
been assumed, and a negative relationship between the language proficiency and ethnic
concentration has been demonstrated in a variety of host countries and immigrant groups (for
the US Espenshade and Fu, 1997; Lazear, 1999; Chiswick and Miller, 2005; Cutler, Glaeser
and Vigdor, 2008; for Canada Chiswick and Miller, 2001; Warman, 2007; for Australia
Chiswick, Lee, and Miller, 2005; for the UK Dustmann and Fabbri, 2003; Dustmann and van
Soest, 2004; for Israel Mesch, 2003; for the Netherlands van Tubergen and Kalmijn, 2009;
Vervoort et al., 2012; for Belgium van Tubergen and Wierenga, 2011). The risk for biased
results however is high: if an immigrant who his not willing or capable to learn the host
5
country's language decides to live in a region that minimizes his exposure to it, and if this
willingness/capability cannot be observed, a regression of language proficiency on ethnic
concentration will attribute the low language proficiency to ethnic concentration even though
the estimate would be composed of an exposure effect and an individual ability effect. Indeed,
Bauer, Epstein, and Gang (2005) acknowledge this sorting effect and demonstrate that Mexican
immigrants to the US are more likely to move to regions of high ethnic concentration if their
English skills are initially poor. Moreover, it is equally conceivable that immigrants with high
ability will be more inclined to move to places which offer high language wage premia. If ethnic
concentrations correlate with language premia across regions the effect of ethnic concentration
will be even more confounded. Thus, isolating the exposure effect requires more than a simple
regression approach.
One such approach has been suggested by Lazear (1999) and also been followed by
Dustmann and van Soest (2004). In their papers they include an interaction between ethnic
concentration and years since migration. A zero result on this variable would indicate that no
learning takes place over time (sorting), while a negative coefficient would indicate that
immigrants in low ethnic concentration regions learn faster relative to immigrants in high
concentration areas (learning). Both papers support the sorting hypotheses for the USA and the
UK for recent immigrant cohorts. Another alternative has been pursued by Cutler et al. (2008)
who attempt to correct for the potential self-selection of immigrants into specific areas (ghettos)
by using an occupational instrument matrix; however, occupation, location and language choice
might in fact be parts of the same decision.
In this paper we follow a quasi-experimental approach that has been applied in studies
which have focused mostly on labor market outcomes.2 The approach consists of identifying an
immigration episode during which immigrants were distributed across different regions. The
2 Gould, Lavy, and Paserman (2004) and (2011) look at social and economic outcomes of immigrants placed in a
random fashion across Israel, though their focus is not on ethnic concentrations.
6
experimental ideal would consist in a random allocation. In practice the distribution strategy is
often dictated by constraints (housing availabilities, family considerations and sizes, etc.) so
that researchers have found cases in which the distribution strategy was arguably unrelated to
any unobserved characteristic that might have been itself contributing to a particular labor
market outcome. Thus, the resulting exposure for immigrants placed in such a framework can
be considered exogenous. The leading examples for the quasi-experimental approach in labor
markets are Damm (2009a), Edin, Frederiksson and Aslund (2003) for asylum-seekers in
Denmark and Sweden respectively, and Glitz (2012) for immigrant ethnic Germans from the
former Soviet Union in Germany.
The guest-worker program in Germany allows us to isolate the exposure effect on
language proficiency in a very similar fashion. Differences in average language learning ability
across regions are ruled out due to the initial exogenous placement of guest-workers into regions
(see below for a detailed description of the guest-worker program). Furthermore, differences in
economic incentives in terms of regional differences in the language premium for wages are
also controlled for by the inclusion of regional fixed effects in our empirical analysis. The effect
of ethnic concentration remains identified because of the presence of different immigrant
groups (with different exposures) within the same region. Any effect of linguistic distance is
controlled by the inclusion of country-of-origin fixed effects.
3. The Guest-Worker Program in West Germany 1955-73
The 1950s and 60s in Germany have become known as the time of the
Wirtschaftswunder (economic miracle), an episode of rapid post-war reconstruction and
economic growth. The miracle has been facilitated by the recruitment of guest-workers from
Southern Europe which began with the German-Italian Recruitment Treaty signed in December
1955 to meet the hunger for labor of the German economy. Subsequent treaties followed with
Greece and Spain in 1960, Turkey in 1961, Portugal in 1964, and Yugoslavia in 1968.
7
After a slow start recruitment gained momentum in the early 60s and increased steadily
until 1967 (Fig. B-1 in the Appendix). The brief recession in 1967 did not stop the further inflow
of foreign population. Within 13 years, the share of foreign employees rose from less than one
to twelve percent. Until 1969, more than 1.4 million guest-workers were exogenously placed
across German regions (see Appendix G for more details of the placement procedure).
Recruitment was halted in 1973 as a consequence of an economic recession; however, the
foreign population grew until 1975 and beyond due to family reunification. While Italians
constituted the largest foreign group in 1969, the Turkish population became most numerous in
1971 (see Fig. B-2).
Entering Germany for work after WWII was subject to the regulations of the Federal
Labor Code. It stipulated that every foreigner was required to hold a valid work permit
(Arbeitserlaubnisbescheinigung) before taking up work or employment. Foreigners residing
outside Germany had to apply for such a permit abroad. The bilateral guest-worker treaties were
intended to facilitate the process of acquiring such a work permit abroad in order to flexibly
satisfy the domestic demand for labor. In this respect, guest-workers received a preferential
treatment as long as they used the placement scheme. During the period of guest-worker
recruitment, the German Labor Office (Bundesanstalt für Arbeit) held the exclusive recruitment
monopoly and set up local branches in the recruitment countries3 which proceeded recruitment
requests from German employers and provided medical check-ups before emigration of the
guest-workers.
The recruitment offices assigned workers from an application pool to specific firms.
Employers received almost no information about the characteristics of the guest-worker they
hired. While a basic questionnaire detailed gender, age and place of origin, no useable
information was given regarding previous work experience, training, health conditions, the
3 Deutsche Kommission in Italy, Greece and Spain, Deutsche Verbindungsstelle in Turkey and Portugal as well
as the Deutsche Delegation in Yugoslavia.

8
ability to manage the future job or the willingness to adapt in Germany (general fitness was,
however, screened) (Voelker, 1976: 335).4 Recruitment costs for firms were non-negligible:
Employers incurred a 1000 DM recruitment fee (300 DM in the early years), the costs for the
train/air ticket from the German border to the place of employment, for medical check-ups, for
translation fees, for training as well as partly for accommodation. The process in Italy started
to differ slightly from the general procedure in 1962 when the European Economic Community
(EEC) granted Italian guest-workers relatively free labor mobility.5
On the migrant side, the German Labour Office advertised the guest-worker program in
the source countries through native-language leaflets and brief video clips in cinemas.
Individuals interested in working abroad applied at recruitment offices. Prospective guest-
workers provided some basic personal information and were screened to exclude illiterate
applicants. Applicants could not state a preference for a destination region or employer but
retained the right to refuse an allocated working place. However, this option was not used in
practice because applicants would not be offered another placement in the near future (Penninx
and Van Renselaar, 1976). Successful applicants received a work permit for a specific
employer, not for the German labor market in general (Feuser 1961) and signed one-year
contracts. They normally left their home country relatively quickly. Migrants were sent to
Germany on specific guest-worker trains (around 600 in 1968). Ports of entry were the city of
4 Recruitment instructions of the recruitment process, model contracts and translations of documents were widely
published at the time in handbooks or guidelines for employers (two widely used publications are Feuser (1961)
and Weber (1966)). Regarding the exogeneity of the placement procedure, Feuser (1961: 26) comments: “[…]
Every firm has to be aware of the fact that it will hire workers who have not been interviewed/inspected by a firm
representative beforehand” (own translation; emphasis in the German original). German employers signed blank
work contracts which were filled with details of the matched guest-workers by the branch of the German Labor
Office abroad.
5 Because of their difficulties in finding employment in Germany independently, Italians who entered Germany
without the service of the recruitment office were matched with employers through an internal recruitment
branch of the Labor Office for immigrants (Zentralstelle für Arbeitsvermittlung). Yugoslavia departed from the
general procedure in the 1970s by opening a ‘second track’ to Germany with visas directly issued by the German
embassy.
9
Cologne for trains from Spain/Portugal and the city of Munich for trains from
Italy/Greece/Yugoslavia/Turkey, where staff of the Federal Labor Office welcomed the arrivals
before accompanying them to their final destination. Monetary and administrative costs of the
application and the move were essentially zero for the guest-worker. As of 1966, 72% of the
foreign workforce comprised unskilled workers because of high labor demand in low-skilled
occupations and because several sending countries preferred emigration from underdeveloped
regions or disaster areas (Penninx and Van Renselaar, 1976: 10). Guest workers had no prior
knowledge of the German language.6 Most guest-workers became employed in manufacturing,
notably in the construction, mining, metal and ferrous industries.7 In the 1970s, recruitment by
name (namentliche Anforderung) became an alternative channel for hiring guest-workers.
Employers received the opportunity to request specific workers by submitting their name and
address, which however, accounted for only one tenth of placements.8
Although the initial placement in Germany was exogenous to the immigrants, they
became free to move after some time. In order to upgrade their work permit (Erweiterte
Arbeitserlaubnisbescheinigung) which granted free job choice, guest-workers had to stay with
the same employer for at least three years and within the same region and occupation for eight
years (Dahnen and Kozlowicz 1963; for more details see Appendix G). These were strong
incentives against moving across regional borders. Furthermore, geographic mobility in
6 In 1968, the Labor Office conducted a representative survey among guest-workers about their employment
relations and living conditions. The results indicate that the rate of language acquisition was relatively modest:
None of the interviewed guest-workers who lived in Germany for two years spoke German well while three
quarters did not speak German at all. The rate of contact between guest-workers and natives was low, because
many guest-workers lived in dormitories (Voelker, 1976).
7 After 1969 some German firms attempted to attract skilled workers. This included the possibility to co-
establish educational institutions in Yugoslavia (starting with 1,300 students in 1969).
8 Although this instrument was intended to ease recruitment, it was in fact time-consuming and unreliable
(foreign partner administrations were in charge of finding individuals). While many firms planned to utilize this
recruitment channel (26% in 1969-71) a non-negligible percentage of requests—38%—could not be fulfilled by
the administration because of wrong or incomplete addresses, lack of interest of the potential guest-worker,
failure to comply with health standards etc. Another 12% of requests were withdrawn by employers for various
reasons (Bundesanstalt für Arbeit, 1965-72).
10
Germany was generally very low during that time period and guest-workers were no exception.
The mobility among guest-workers in Germany was severely limited by legal and social
barriers. German cities and communities held the executive power to hinder guest-workers from
internal relocation (Drever, 2004). In the early period of the guest-worker recruitment, the
housing market did not have the capacities to absorb those guest-workers who wished to leave
(often constricted) employer provided accommodations. During the period of family
unification, the comparatively large migrant families had serious difficulties in finding
sufficiently large housing (Mushaben 1985: 134). As a result, the ethnic residential and
workplace concentration of immigrants remained quite stable in Germany between 1975 and
2008 (Glitz, 2014). In practice, immigrants renewed their contracts with their initial employers
in the period of high labor demand, or—in case they changed employers—followed labor
demand normally over very short distances (i.e., within region). Only when the economic
recession took hold in the mid-1970s, immigrants might have had more incentives to move, but
regional mobility remained relatively low, not least because the federal government was keen
to prevent the emergence of ethnically homogenous ghettos (Drever, 2004).
4. Methodology
4.1. Data
We combine different data sources to estimate the causal effect of ethnic concentration
on language fluency. The guest-worker sample of the German Socio-Economic Panel (SOEP)
was started in 1984 and provides detailed information on individual and household
characteristics including language ability (Wagner, Frick and Schupp, 2007). This sample
initially comprised households with either a Greek, Italian, Spanish, Turkish, or Yugoslavian
household head. Since the level of geographic disaggregation of the first SOEP wave (1984) is
insufficient for merging with other data sources, we identify the residence region of immigrants
for the 1985 wave. This wave comprises 2,346 immigrants from the five guest-worker
11
countries. We restrict our sample to individuals who have immigrated after their home country
had signed a guest-worker treaty with Germany, who have complete language information in
at least one of the waves 1984-87 and who are at least 18 years old in the survey year in order
to rule out that individuals’ schooling decisions are influenced by regional ethnic
concentrations. This leaves us with 2,216 first-generation immigrants in our baseline sample.9
The main outcome of interest is language ability (Appendix A presents the survey
questions). Like the previous literature we use an indicator of self-assessed language fluency
which the SOEP measures on a five-category ordinal Likert-scale ranging from “not speaking
at all” (lowest category) to “speaking very well” (highest category).10 For most of the analysis,
we use a binary variable for language fluency which is coded one if the median of language
fluency over the four survey years 1984-87 is greater than three, and zero otherwise.11 Inter-
temporal improvements in language ability during this observation period should be modest
given that our data are collected on average 14 years after immigration. We choose this outcome
variable in order to reduce time-varying measurement error in the dependent variable. In order
to reduce time-persistent measurement error we complement our main analysis with an array of
other outcome measures: (i) the four-year average 1984-87, (ii) the full ordinal measure for the
year 1985 only (these do not solve time-persistent measurement error), (iii) a dummy indicating
9 The sample contains only two German citizens.
10 Representative objective language measures are unavailable in Germany until today. The federal office for
Migration and Integration initiated an “integration panel” in 2007 with a focus on the effect of language course
participation on language ability. Again, no objective language evaluation was implemented (Rother, 2008).
11 It might at first seem unusual to voluntarily discard exploitable variation in the dependent variable. However,
our binary approach combines two insights: First, it makes the subjective language judgments robust against
year-specific measurement error by exploiting the median over four years. Second, it is based on the idea of a
threshold above which people are consistently able to speak the language well. In fact, the distinction between
speaking German “very well” and “well” might be blurred. However, not speaking German at all can be easily
assessed. More difficult again is the distinction between having serious or some troubles in communication
(“poorly” or “fairly”). Hence, we consider a threshold between category 3 and 4 the most natural boundary to
separate speakers and non-speakers. Finally, the effect of ethnic concentration in the linear probability model can
be directly interpreted as the marginal effect on the probability to speak German well or very well (rather than
having a separate marginal effect for each category in the ordinal models). This procedure delivers results which
are fully consistent with results using the ordinal scale (see Table B-7).

12
whether respondents usually speak German in Germany (available for the year 1996) and (iv)
a dummy indicating whether individuals read newspapers predominantly in German language
or not (available for the year 1988). Note that measures (iii) and (iv) refer to behavioural
outcomes that were measured 3 and 11 years after the immigrants’ personal characteristics.
While writing abilities are generally an important component of human capital, we will mainly
focus on speaking abilities as guest-workers predominantly worked in manual low-skilled
occupations which did not require writing skills.12 As a consequence, we suspect that
immigrants not only acquired few German writing skills, but also have a relatively poor self-
assessment of their writing abilities leading to potential serious misclassification which cannot
be addressed with our misclassification model.13 Less than half of the sample claimed to speak
or write German at least well in 1985.
Demographic information comprises gender, marital status, country of origin, age at
migration, years since migration, years of schooling dummies, a dummy for education abroad,
interactions between school years and education abroad and a dummy indicating the presence
of children in the household, all as measured in 1985. Guest-workers entered Germany at
relatively young age (23 years). Educational attainments are rather low and were mostly
acquired in the home country.
Given the scope of the guest-worker program it is surprising that the German
government never collected detailed information on where guest-workers were placed and for
how long they stayed, leaving us with general data sources to generate ethnic concentration
measures—our independent variable of interest.14 We use all individuals observed in 1985 in
the IAB Beschäftigtenstichprobe, a two percent administrative sample of all persons with social
12 We present results for writing skills in appendix B, Table B-5.
13 Our misclassification model relies on the assumption that misclassification is not extreme.
14 Ethnic concentration measures exist for the late 1960s, but cannot be merged with SOEP due to territorial
reforms. See Fig. B-3 for maps of ethnic concentrations across German regions.
13
security insurance in Germany, including the entire employee population plus recipients of
social transfers like unemployment benefits. Individuals are registered mandatorily, so that they
can be tracked through their social security number over their entire working life.15 The ethnic
concentration measures are computed for five ethnicities (Greek, Italian, Spanish, Turkish, and
Yugoslav) in each destination region and assigned to individual guest-workers in the SOEP
based on their place of residence in 1985. Thus, the independent variable of interest is the ethnic
concentration to which an immigrant was exposed in his 1985 region of residence. The IAB
Beschäftigtenstichprobe is the largest data source in Germany that covers country of origin of
immigrants at sufficient levels of regional disaggregation for the time period. Following the
demand-driven nature of the guest-worker program, ethnic minorities were more equally
distributed across German regions than one would have expected under labor supply driven
arrangements. As such, the extent of measurement error is probably not correlated with
characteristics of the region other than size and thus should be of little concern in our estimation.
Nevertheless, we address potential measurement error with an instrumental variable approach
(details in Appendix D).
4.2. Identification
We use the quasi-experiment of the guest-worker program in order to establish a causal
link between ethnic area composition and individual ability to speak German. Given the
placement procedure, the initial job location was exogenous to the guest-workers. From the
perspective of family members who later moved to Germany for family reunification, the
location was also exogenous. Identification stems from a comparison of immigrants from
different countries of origin who were placed in areas with different ethnic compositions and
thus with different incentives and costs to learn German. Those confronted with a high regional
15 The IAB data do not cover civil servants and self-employed; however, guest-workers were not strongly
represented in these two groups during and after the recruitment.
14
density of non-Germans will be less likely to require a good command of the host country
language for daily interaction. At the same time, they have fewer opportunities to learn from
the interaction with German speakers. The natural counterfactual for a person living in a cluster
with a high concentration of own ethnic co-residents is a person of the same ethnicity and with
the same characteristics in a low-concentration area. Such a within-ethnicity analysis rules out
any potential bias stemming from linguistic distances between languages.
The ideal set-up for our investigation would require objective language measures for
randomly distributed guest-workers who would never change their initial place of residence.
Reality comes reasonably close to this ideal. We will discuss the issues of inter-regional
mobility and measurement error in language measures below but are confident to identify the
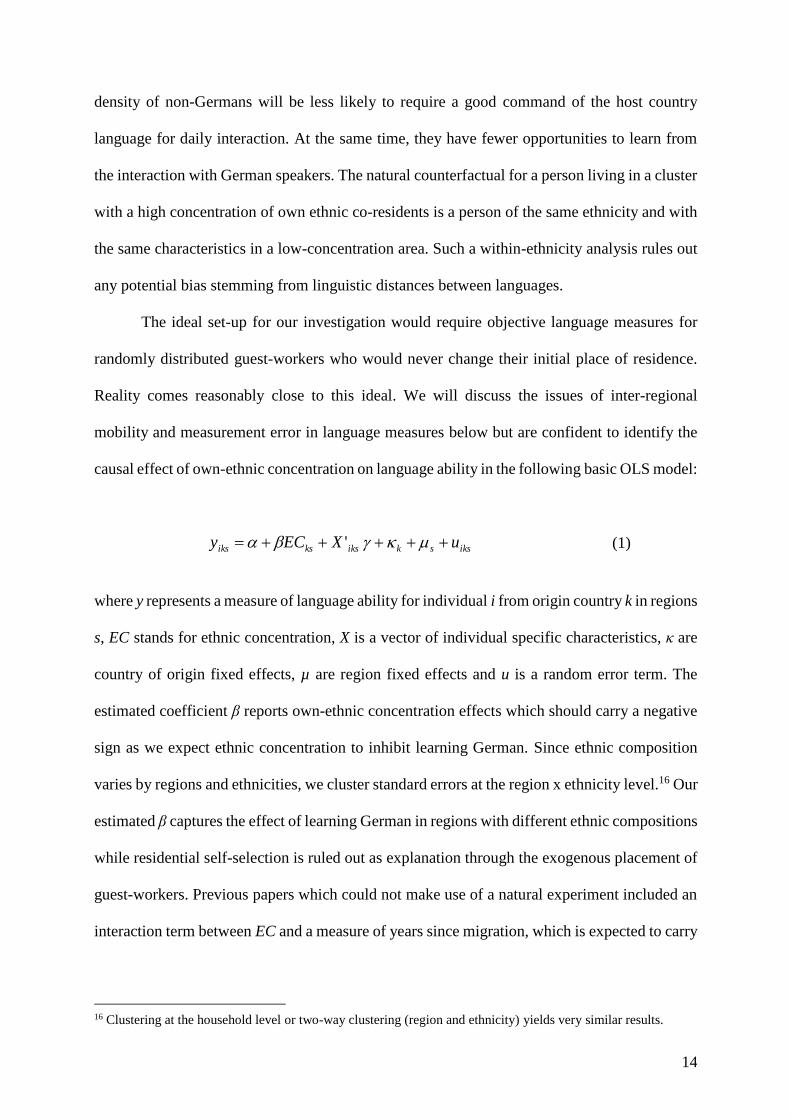
causal effect of own-ethnic concentration on language ability in the following basic OLS model:
iksskiksksiks uXECy ' (1)
where y represents a measure of language ability for individual i from origin country k in regions
s, EC stands for ethnic concentration, X is a vector of individual specific characteristics, κ are
country of origin fixed effects, µ are region fixed effects and u is a random error term. The
estimated coefficient β reports own-ethnic concentration effects which should carry a negative
sign as we expect ethnic concentration to inhibit learning German. Since ethnic composition
varies by regions and ethnicities, we cluster standard errors at the region x ethnicity level.16 Our
estimated β captures the effect of learning German in regions with different ethnic compositions
while residential self-selection is ruled out as explanation through the exogenous placement of
guest-workers. Previous papers which could not make use of a natural experiment included an
interaction term between EC and a measure of years since migration, which is expected to carry
16 Clustering at the household level or two-way clustering (region and ethnicity) yields very similar results.
15
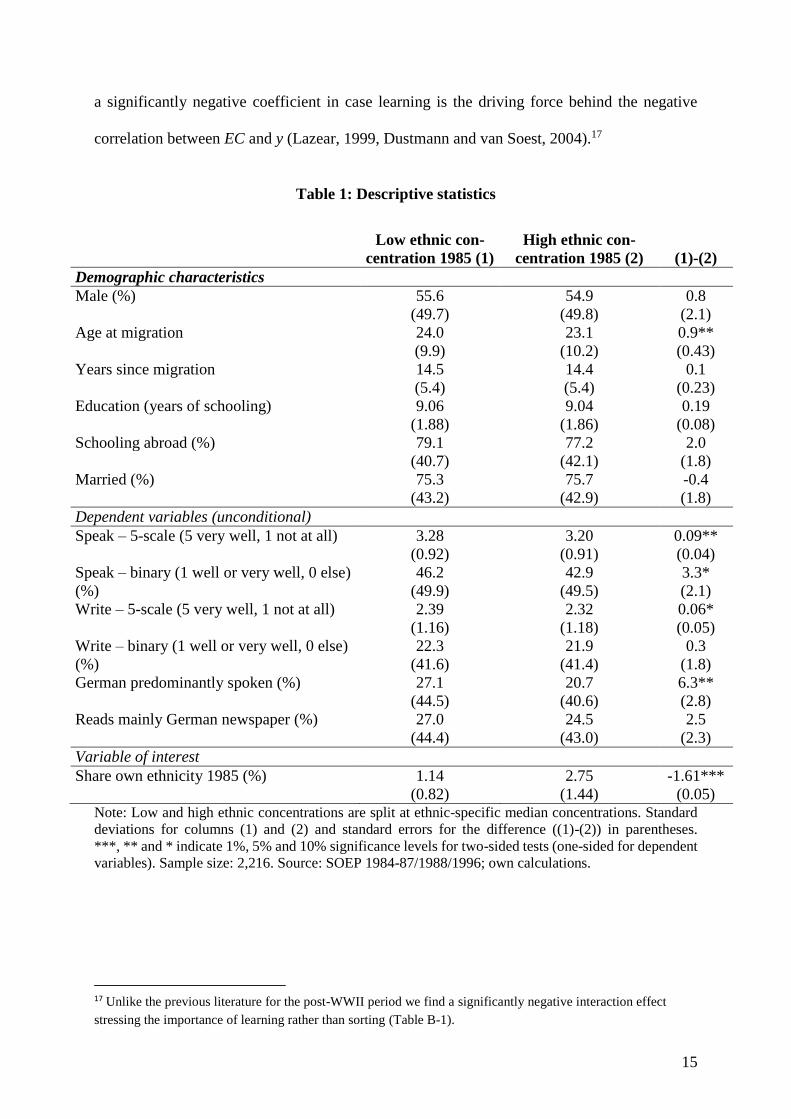
a significantly negative coefficient in case learning is the driving force behind the negative
correlation between EC and y (Lazear, 1999, Dustmann and van Soest, 2004).17
Table 1: Descriptive statistics
Low ethnic con-
centration 1985 (1)
High ethnic con-
centration 1985 (2) (1)-(2)
Demographic characteristics
Male (%) 55.6 54.9 0.8
(49.7) (49.8) (2.1)
Age at migration 24.0 23.1 0.9**
(9.9) (10.2) (0.43)
Years since migration 14.5 14.4 0.1
(5.4) (5.4) (0.23)
Education (years of schooling) 9.06 9.04 0.19
(1.88) (1.86) (0.08)
Schooling abroad (%) 79.1 77.2 2.0
(40.7) (42.1) (1.8)
Married (%) 75.3 75.7 -0.4
(43.2) (42.9) (1.8)
Dependent variables (unconditional)
Speak – 5-scale (5 very well, 1 not at all) 3.28 3.20 0.09**
(0.92) (0.91) (0.04)
Speak – binary (1 well or very well, 0 else) 46.2 42.9 3.3*
(%) (49.9) (49.5) (2.1)
Write – 5-scale (5 very well, 1 not at all) 2.39 2.32 0.06*
(1.16) (1.18) (0.05)
Write – binary (1 well or very well, 0 else) 22.3 21.9 0.3
(%) (41.6) (41.4) (1.8)
German predominantly spoken (%) 27.1 20.7 6.3**
(44.5) (40.6) (2.8)
Reads mainly German newspaper (%) 27.0 24.5 2.5
(44.4) (43.0) (2.3)
Variable of interest
Share own ethnicity 1985 (%) 1.14 2.75 -1.61***
(0.82) (1.44) (0.05) Note: Low and high ethnic concentrations are split at ethnic-specific median concentrations. Standard
deviations for columns (1) and (2) and standard errors for the difference ((1)-(2)) in parentheses.
***, ** and * indicate 1%, 5% and 10% significance levels for two-sided tests (one-sided for dependent
variables). Sample size: 2,216. Source: SOEP 1984-87/1988/1996; own calculations.
17 Unlike the previous literature for the post-WWII period we find a significantly negative interaction effect
stressing the importance of learning rather than sorting (Table B-1).

16
The freedom to change employers after the initial placement in Germany could pose a
threat to our identification as migrants who are less able or willing to learn German could self-
select into ethnic clusters in order to reduce the costs of absent language skills. Yet, we find no
evidence for significant demographic differences between guest-workers residing in high vs.
low concentration areas in the year 1985 (differentiated by the median of ethnicity specific
concentrations) (Table 1, top panel).18 The only difference in demographics exists for age at
immigration which is a mechanical artefact of the mass immigration as regions with the greatest
labor demand recruited immigrants for longer periods, while arriving guest-workers became
younger over time. The lack of qualitative differences between regions suggests that migrant
sorting up to 1985 was at most very limited—and cannot explain the significant differences
found for language skills and use (Table 1, lower panel). Using the longitudinal component of
the IAB data we also analyse individual mobility patterns of guest-workers between 1975 and
1985 explicitly: Using IAB data, we construct a dependent variable DIFF defined as the
difference in the ethnic concentration between an immigrant's current (1985) region of
residence and the ethnic concentration he would be exposed to had he not moved since 1975.19
DIFF is then regressed on educational attainment, age, age squared, nationality dummies, as
well as ability. The last variable is the individual fixed effect stemming from a 10-year (1975-
1985) panel Mincer regression20 which captures time-invariant unobservable characteristics
such as language ability. If low ability individuals were moving into ethnic enclaves, we would
18 We also compare guest-workers’ 1985 characteristics between regions that contained low vs. high ethnic
concentrations in 1975 with very similar results. Up to the late 1990s, the IAB data did not contain information on
place of residence, but on the workplace only. In the 2000s, with interregional mobility that far exceeded that of
the 1950s-70s, four of five respondents lived and worked in the same region. This fraction was higher for
immigrants.
19 For example, if a Turk lived in Munich in 1975 and in Berlin in 1985, DIFF would be the concentration of Turks
in Berlin in 1985 minus the concentration of Turks in Munich in 1985. The mean of DIFF is 0.0036 suggesting on
average no change in ethnic compositions over this ten year period. The kernel density of DIFF is displayed in
figure B-4. 20 A fixed effects regression of guest-worker men with log wages regressed on quadratic polynomials of
experience and age, on year dummies, firm size, and sector and state dummies.
17
expect significant correlations between observables/individual fixed effects and sorting into
more concentrated areas. However, none of the covariates supports the sorting story (and the
significant dummies indicating Turkish and Yugoslavian origin pose no problem as we employ
ethnicity fixed effects in the estimation). We conclude that sorting of guest-workers has been
absent or very modest between 1975 and 1985 (Table B-2).
4.3. Return migration
Since we observe only immigrants who were still resident in Germany in 1984/5 our
estimates might be potentially biased due to selective return migration. From a policy
perspective this seems unproblematic as the enclave effect on returnees might not be the
preferred measure of interest. Furthermore, return migration became significant only in the late
1980s (Dustmann, 1996). Also, the return of immigrants with poor language skills will render
our main results more conservative: Following Lazear (1999) these immigrants tend to live in
ethnic enclaves, implying relatively strong return migration from highly concentrated areas.
This may introduce two sources of upward bias. First, we observe too few immigrants with poor
language skills in ethnically concentrated regions. Second, for those immigrants who have
remained in the country and live in enclaves, we observe ethnic concentrations that are too low,
since the ethnic concentrations in their regions of residence must have been higher before the
returnees had left.21
To test for return migration empirically we estimate hazard models of the probability to
permanently leave Germany, conditional on having lived in Germany in 1984. Detailed results
and discussions can be found in Appendix C, but the overall conclusion from this analysis is
that immigrants with poor language skills and immigrants in high-concentration areas are more
likely to return. Importantly, the effect of ethnic concentration on the return hazard is higher for
21 This will lead to ∆𝐶𝑜𝑣(𝑦, 𝐸𝐶) ≥ ∆𝑉𝑎𝑟(𝐸𝐶).
18
immigrants with poor than with good language skills, reinforcing our conjecture that return
migration will—if anything—bias our estimates towards zero.
4.4. Choice of the regional level of aggregation
Ideally, the effect of ethnic concentration on language proficiency should be measured
within geographic units containing people’s daily life context. This is often impossible due to
data limitations. Additionally, there is a qualitative trade-off between small units of aggregation
that closely reflect the idea of ethnic neighbourhoods (e.g., census tracts in the US with three
to five thousand inhabitants; Cutler and Glaeser, 1997; or municipalities in Sweden with a
median population size of 16,000 inhabitants; Edin et al., 2003) and larger units, that circumvent
the potential bias from self-selection into specific neighborhoods (e.g., metropolitan level data
(CMA); Warman, 2007; Cutler et al., 2008). The latter approach assumes that the problematic
self-selection of individuals into ethnic enclaves mainly takes place within cities rather than
across. Results from various studies show consistently that negative enclave effects on wages
and language abilities are stronger in less aggregated areal units. This finding is consistent with
the fact that immigrants who are less willing or able to learn a foreign language sort into local
ethnic neighborhoods and introduce a downward bias in studies based on small geographic
units. Approaches using larger regions produce more conservative estimates.
In Germany, a reasonable level of aggregation contains cities with their economically
integrated suburban areas or counties containing on average 100 to 350 thousand inhabitants .
Unlike within American cities, the degree of ethnic and social segregation is much lower in
Germany (Musterd, 2005). Hence, small units like census tracts would not sufficiently reflect
individuals’ space of interaction. Our analysis is based on so-called Anpassungsschichten,
which are regional units comprising a larger city and the economically linked hinterland. In
West Germany including West Berlin, there were 110 Anpassungsschichten in 1985 with an
average population size between 135 and 500 thousand inhabitants, though some regions
19
contain metropolitan areas with larger populations such as Berlin, Hamburg, or Munich.22 The
broad regional aggregation has the advantage of decreasing (though not eliminating) the degree
of measurement error resulting from population projections. Furthermore, under the hypothesis
of a negative effect of concentration on language, our regional aggregation underestimates the
(negative) covariance between language and ethnic concentration more than it underestimates
the variance of ethnic concentration.23 Since both effects bias our estimate towards zero, our
estimated coefficient should be regarded as very conservative. By including Anpassungsschicht
and country of origin fixed effects, we exploit only variation in ethnic concentrations that is not
systematic across ethnicities or across regions.
We also explicitly show that the regional own-ethnic concentration facing a guest-
worker is unrelated to her personal mobility experience. Based on information about the year
of moving to the current place of residence, we define a subsample of individuals who have
never moved apartments/houses after arrival in Germany. It should be noted that this is an
extremely restrictive definition which applies to only 16% of the full sample—clearly not a
random subsample. When regressing the percentage of own-ethnics in a person’s region in 1985
on the standard set of control variables and a dummy indicating whether a person has moved
houses, we find no evidence that movers select into regions with significantly higher or lower
shares of ethnic fellows (Table 2).
Table 2: Correlates of the share of own ethnicity
22 We had to aggregate some regional units because the data from which we project ethnic concentrations did not
contain the same regional depth. In particular we had to aggregate 7 districts of Hamburg into one region, and
the city and county of Hanover into one district.
23 Using a higher aggregation level (eleven German Länder) delivers smaller effects (see Table D-1). We discuss
the effect of regional aggregation on our estimates in Appendix D.

20
Dependent variable Percentage of own ethnicity in region
Estimate Std.error
Never moved flat 0.092 (0.088)
Male -0.013 (0.033)
Age at migration -0.007 (0.013)
Age at migration squ. 0.008 (0.025)
Years since migration 0.009 (0.006)
Schooling abroad 0.117 (0.116)
Married -0.000 (0.076)
Children in household -0.065 (0.088)
Education dummies Yes
Education dummies*schooling
abroad
Yes
Country of origin and region FE Yes
Observations 2,216
R-squared 0.467
Note: Standard errors clustered by regions by country of origin in parentheses. *** p<0.01, ** p<0.05,
* p<0.1. Source: SOEP 1985 and IAB 1985; authors’ calculations.
5. Results
5.1. Ethnic concentration and language skills
Fig. 1 gives an initial idea of the correlation between ethnic concentration in the location
of immigrants (in percent) and their average language fluency in German (as a share of
immigrants who speak German well or very well). The correlation between the two variables
of interest is negative—with substantial variance across regions. Evidently, more populous
regions tend to contain higher ethnic concentrations.
Living in an area with higher own-ethnic concentration significantly reduces the
probability that guest-workers speak German well or very well also at the micro-level (Table
3). When including control variables, the coefficient becomes more pronounced at -0.053.24 In
other words, living in a region with 1%-point higher own-ethnic concentration reduces the
propensity to be fluent in the host country language by 5.3%-points. If the ethnic concentration
increases by one standard deviation, the probability that a person is fluent in
24 Fifty (Thirty-nine) percent of the effect stem from variation across regions (ethnicities).

21
Fig. 1: Correlation between ethnic concentration and average speaking ability of
immigrants at the regional level (Anpassungsschichten)
Source: SOEP 1985, IAB 1985; authors’ calculations.
German decreases by 3.8%-points. Although the effect of own-ethnic concentration may
initially seem small, other authors have found similar effects at comparable high levels of
aggregation for the USA (Chiswick and Miller, 2005) or Canada (Warman, 2007). The table
further reports results for two subsamples, of which column 3 contains perfectly immobile
individuals who never moved flat while column 4 refers to flat movers (which, however, will
in most cases not involve moves across regional boundaries). The coefficient for the non-mover
sample is roughly twice as large as for the mover sample but with relatively low precision due
to limited sample size. In fact, one cannot reject the equality of the coefficients for the mover
and non-mover sample (as shown by the insignificant coefficient of the interaction term ECks ×
nomover in a pooled regression (p=0.816)). This supports our assumption that enclave effects
are not spuriously produced by endogenous selection into specific areas.
Table B-5 in the Appendix reports results from the same estimations using writing
fluency as the dependent variable. As we have argued before, writing ability is expected to
.2.4
.6.8
1
Spe
aki
ng
Germ
an w
ell
or
very
we
ll, s
ha
re
0 1 2 3 4 5Own-ethnic concentration
Regional ethnicity cell, weighted by population Fitted values

22
matter less for guest-workers and seems to be measured with error. Although we do find a
negative effect of ethnic concentration on writing skills, it is less precisely estimated.
Table 3: Determinants of speaking ability
(1) (2) (3) (4)
Full sample Full sample Sample: never
moved flat
Sample: moved
flat
Dependent variable Speaking well: German (Median 1984-87)
Percentage own ethnicity in
region
-0.042*** -0.053*** -0.119** -0.051***
(0.014) (0.012) (0.048) (0.012)
Male 0.112*** 0.158*** 0.103***
(0.017) (0.059) (0.017)
Age at migration -0.035*** -0.025** -0.036***
(0.004) (0.011) (0.004)
Age at migration squ. 0.031*** 0.021 0.031***
(0.006) (0.015) (0.008)
Years since migration 0.008*** 0.011* 0.008***
(0.002) (0.006) (0.002)
Schooling abroad -0.025 0.060 -0.027
(0.030) (0.092) (0.035)
Married -0.079*** -0.159* -0.046
(0.026) (0.084) (0.029)
Children in household -0.013 0.011 -0.022
(0.020) (0.058) (0.024)
Education dummies No Yes Yes Yes
Education × schooling abroad No Yes Yes Yes
Country of origin FE Yes Yes Yes Yes
Region FE Yes Yes Yes Yes
Observations 2,216 2,216 361 1,855
R-squared 0.101 0.413 0.559 0.414 Note: Dependent variable: Binary variable of speaking ability, generated from the median of the
speaking ability variable for the years 1984-7 (Speaking very good or good = 1, speaking fair, poor or
not at all = 0). Standard errors clustered by regions by country of origin in parentheses. *** p<0.01, **
p<0.05, * p<0.1. Source: SOEP 1984-7 and IAB 1985; authors’ calculations.
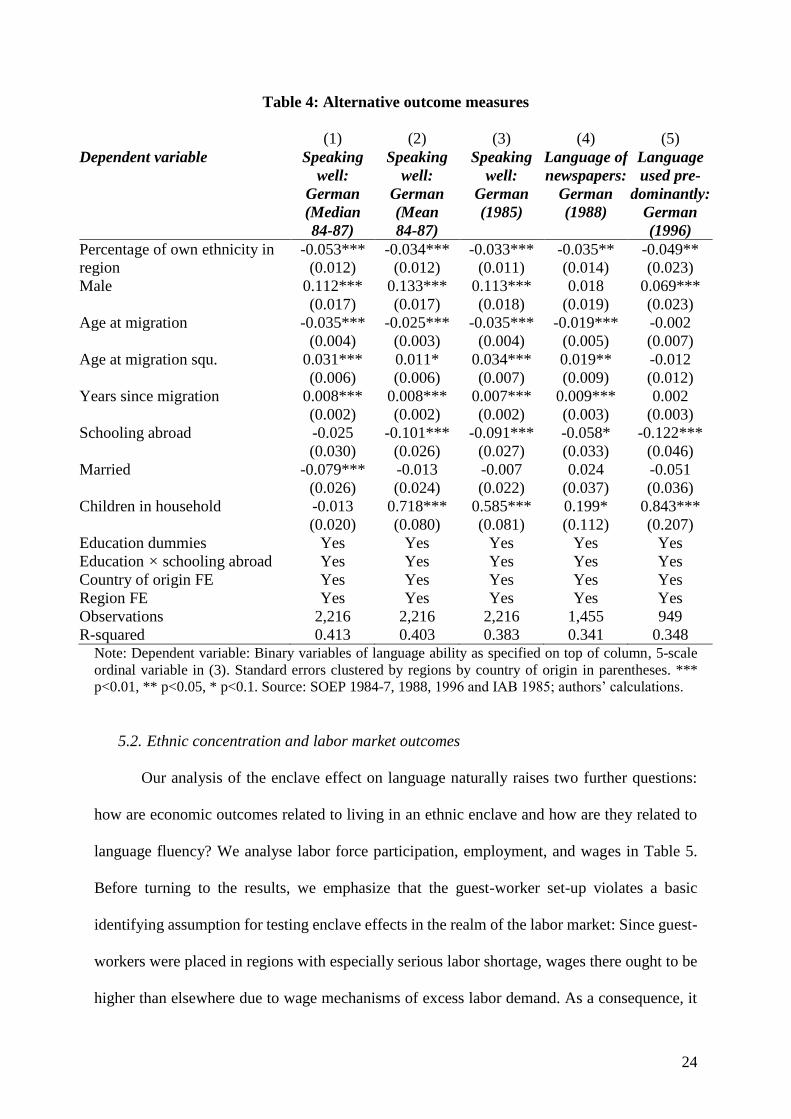
The negative enclave effect is also significant for alternative outcome measures (Table
4).25 Column 2 refers to contemporaneous speaking ability which is defined as a binary
25 For completeness, Table B-6 reports OLS results using an ordered dependent variable with values ranging
between 1 and 5 and Table B-7 reports ordered probit and ordered logit results with 9 language proficiency
categories. These results exploit more variation in the dependent variable. They fully confirm our previous
findings. Since results involving ordered dependent variables are less intuitively to interpret, we present the
linear probability model in the paper. Table B-8 shows that our results also hold when using absolute or log
guest-worker frequencies instead of shares.
23
indicator of speaking German good or very good derived from the mean of the five-point Likert
scale over four consecutive years 1984-87. Column 3 reports the results for a language measure
generated from the year 1985 only. Both outcomes show a highly significant negative effect of
living among own-ethnic fellows on the self-assessed language fluency. Columns 4 and 5
provide evidence on medium- and long-run language skill effects with outcomes being
measured after the year 1985 in the SOEP. Note that the outcomes used in the last two columns
shed light on the actual usage of the German language rather than self-assessed language ability
and hence complement the previous analysis from a behavioral perspective. Regarding the
language of newspapers, guest-workers in enclaves are significantly less likely to read in
German. Similarly, immigrants in enclaves are less likely to use German for their daily
communication.26 If the sample in the last two columns was selected in a way that less
successful migrants started moving back to their countries of origins in the late 1980s
(Dustmann, 1996) our results intriguingly show that enclave effects can even be found among
the more successful migrant population.
26 Note the smaller samples for the latter two variables which stem from attrition (and from not reading
newspapers in column 4) and can explain the relatively imprecisely measured estimates.
24
Table 4: Alternative outcome measures
(1) (2) (3) (4) (5)
Dependent variable Speaking
well:
German
(Median
84-87)
Speaking
well:
German
(Mean
84-87)
Speaking
well:
German
(1985)
Language of
newspapers:
German
(1988)
Language
used pre-
dominantly:
German
(1996)
Percentage of own ethnicity in
region
-0.053*** -0.034*** -0.033*** -0.035** -0.049**
(0.012) (0.012) (0.011) (0.014) (0.023)
Male 0.112*** 0.133*** 0.113*** 0.018 0.069***
(0.017) (0.017) (0.018) (0.019) (0.023)
Age at migration -0.035*** -0.025*** -0.035*** -0.019*** -0.002
(0.004) (0.003) (0.004) (0.005) (0.007)
Age at migration squ. 0.031*** 0.011* 0.034*** 0.019** -0.012
(0.006) (0.006) (0.007) (0.009) (0.012)
Years since migration 0.008*** 0.008*** 0.007*** 0.009*** 0.002
(0.002) (0.002) (0.002) (0.003) (0.003)
Schooling abroad -0.025 -0.101*** -0.091*** -0.058* -0.122***
(0.030) (0.026) (0.027) (0.033) (0.046)
Married -0.079*** -0.013 -0.007 0.024 -0.051
(0.026) (0.024) (0.022) (0.037) (0.036)
Children in household -0.013 0.718*** 0.585*** 0.199* 0.843***
(0.020) (0.080) (0.081) (0.112) (0.207)
Education dummies Yes Yes Yes Yes Yes
Education × schooling abroad Yes Yes Yes Yes Yes
Country of origin FE Yes Yes Yes Yes Yes
Region FE Yes Yes Yes Yes Yes
Observations 2,216 2,216 2,216 1,455 949
R-squared 0.413 0.403 0.383 0.341 0.348 Note: Dependent variable: Binary variables of language ability as specified on top of column, 5-scale
ordinal variable in (3). Standard errors clustered by regions by country of origin in parentheses. ***
p<0.01, ** p<0.05, * p<0.1. Source: SOEP 1984-7, 1988, 1996 and IAB 1985; authors’ calculations.
5.2. Ethnic concentration and labor market outcomes
Our analysis of the enclave effect on language naturally raises two further questions:
how are economic outcomes related to living in an ethnic enclave and how are they related to
language fluency? We analyse labor force participation, employment, and wages in Table 5.
Before turning to the results, we emphasize that the guest-worker set-up violates a basic
identifying assumption for testing enclave effects in the realm of the labor market: Since guest-
workers were placed in regions with especially serious labor shortage, wages there ought to be
higher than elsewhere due to wage mechanisms of excess labor demand. As a consequence, it
25
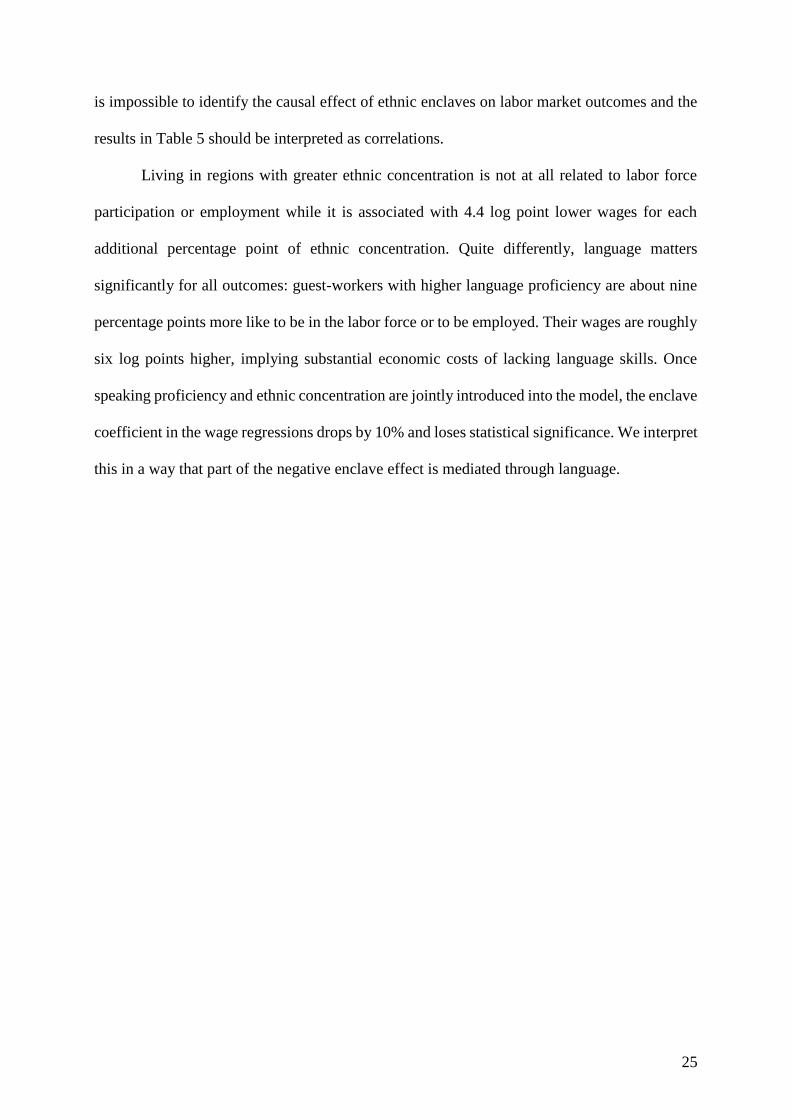
is impossible to identify the causal effect of ethnic enclaves on labor market outcomes and the
results in Table 5 should be interpreted as correlations.
Living in regions with greater ethnic concentration is not at all related to labor force
participation or employment while it is associated with 4.4 log point lower wages for each
additional percentage point of ethnic concentration. Quite differently, language matters
significantly for all outcomes: guest-workers with higher language proficiency are about nine
percentage points more like to be in the labor force or to be employed. Their wages are roughly
six log points higher, implying substantial economic costs of lacking language skills. Once
speaking proficiency and ethnic concentration are jointly introduced into the model, the enclave
coefficient in the wage regressions drops by 10% and loses statistical significance. We interpret
this in a way that part of the negative enclave effect is mediated through language.
26
Table 5: Correlates of labor force participation, employment and wage
Dependent variable Labor force participation
(1 yes, 0 no)
Employed
(1 yes, 0 no)
Log of hourly wage
(1) (2) (3) (4) (5) (6) (7) (8) (9)
German speaking 0.085*** 0.085*** 0.090*** 0.089*** 0.059** 0.056**
proficiency (1-5) (0.014) (0.014) (0.015) (0.015) (0.025) (0.025)
Percentage of own -0.004 0.003 -0.008 -0.000 -0.044* -0.040
ethnicity in region (0.011) (0.011) (0.011) (0.011) (0.024) (0.025)
Observations 2,151 2,151 2,151 2,151 2,151 2,151 1,373 1,373 1,373
R-squared 0.235 0.315 0.235 0.285 0.270 0.285 0.255 0.253 0.257
Note: Dependent variable: Binary variable of being in labor force (columns 1-3), being employed (columns 4-6) or natural log of the hourly wage (columns 7-9).
The speaking proficiency is the median of the speaking ability variable for the years 1984-7 (5 very good, 1 not at all). Control variables like in Table 3, column 2.
Standard errors clustered by regions by country of origin in parentheses. *** p<0.01, ** p<0.05, * p<0.1. Source: SOEP 1984-7 and IAB 1985; authors’ calculations.

27
6. Sensitivity analysis
We illustrate the robustness of our results by (i) investigating treatment heterogeneity across
subgroups, (ii) applying restrictive sample definitions, (iii) accounting for measurement error in
the language and ethnic concentration measures and, finally, (iv) designing a novel falsification
test.
To detect differences in enclave effects we split the sample by gender, education and age
groups, but cannot reject the hypothesis that treatment effects are identical across subgroups (Table
6). Interestingly, the results also hardly vary across ethnic groups (Tables B-3 and B-4).27
Table 6: Determinants of speaking ability, across demographic subgroups
(1) (2) (3) (4) (5) (6)
Sample Male Female Education
>=10 yrs
Education
<10yrs
Age>25 Age<=25
Dependent variable Speaking well: German (Median 1984-87)
Percentage of own -
0.046***
-0.059*** -0.064*** -0.047*** -0.038** -0.060***
ethnicity in region (0.013) (0.016) (0.024) (0.013) (0.018) (0.015)
Observations 1,224 992 598 1,618 894 1,322
R-squared 0.401 0.473 0.407 0.391 0.323 0.389
Note: Dependent variable: Binary variable of speaking ability, generated from the median of the variable
for the years 1984-87 (Speaking very good or good = 1, speaking fair, poor or not at all = 0). Full set of
controls as in Table 3. Standard errors clustered by regions by country of origin in parentheses. *** p<0.01,
** p<0.05, * p<0.1. Source: SOEP 1984-7 and IAB 1985; authors’ calculations.
One caveat with our baseline sample could be that the results are driven by persons who
were not personally placed in Germany in the recruitment process, because they entered Germany
using either the namentliche Anforderung scheme or the framework of family reunification.
Therefore we create a restricted robustness sample which drops all guest-workers who entered
Germany being younger than 18 or who arrived after 1969 when the recruitment by name became
27 We have also run a regression where we interact the ethnic concentration variable with a dummy for immigrants
with at least 10 years of education. In accordance with columns 3 and 4 in Table 6, we find that the better educated
immigrants are affected more adversely by ethnic concentration.
28
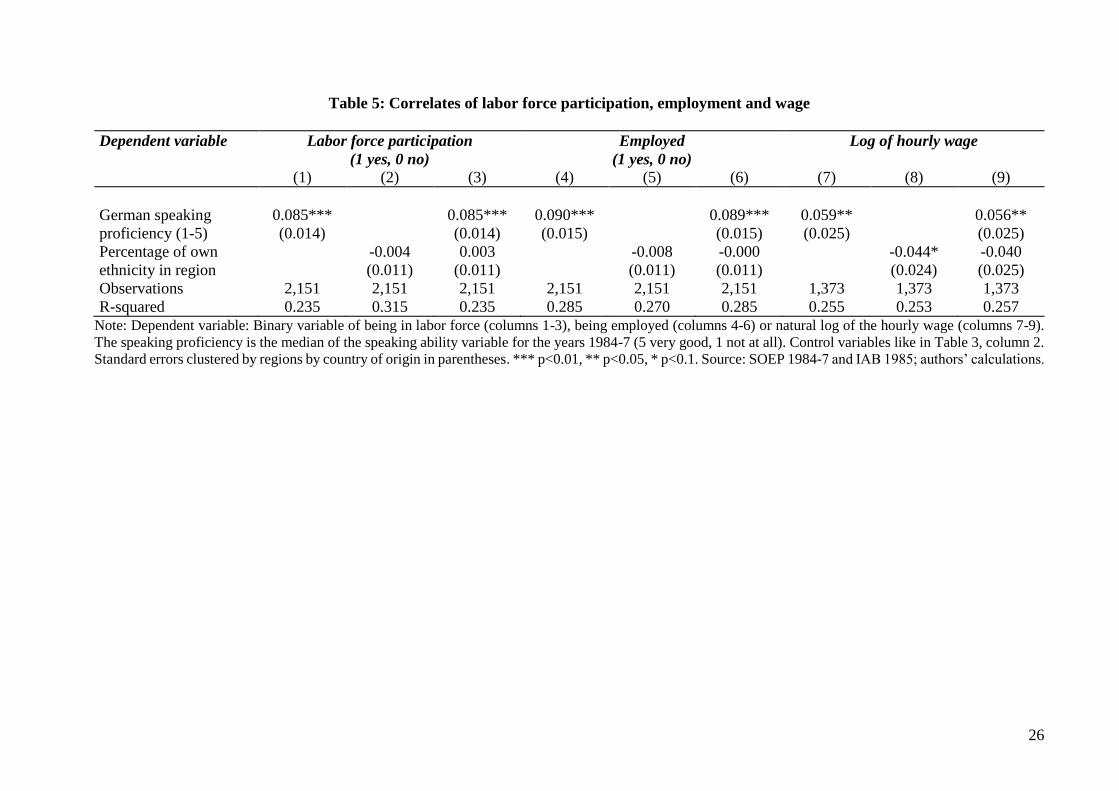
significant or who entered Germany from Italy after the establishment of the EEC.28 Table 7
illustrates that even very restrictive sample configurations which exclude later and younger arrivals
as well as Italian guest-workers produce almost identical results.
We correct measurement error in ethnic concentration measures using an IV strategy (laid
out in greater detail in Appendix D) and in the dependent language variable using a
misclassification model proposed by Hausman, Abrevaya and Scott-Morton (1998) (described in
Appendix E). While we refer interested readers to the Appendices for technicalities, we can confirm
that our results are robust to both sources of bias. In fact, both model corrections suggest that our
main results are rather conservative and that the true enclave effects might actually be larger than
estimated: the IV model indicates (very) weak attenuation bias, while the misclassification model
indicates some modest upward bias (closer to zero) (Table E-1). The corrected coefficients are,
however, not statistically distinguishable from the main results.
Table 7: Main results, restricted samples
(1) (2) (3) (4) (5)
Dependent variable Speaking well: German (Median 1984-87)
Sample Full sample + Excluding
Italians
+ Excluding
arrivals after
1968
+ Excluding
arrivals
younger than
18
Only arrivals
up to 5 years
after bilateral
treaty
Percentage of own
ethnicity in region
-0.053*** -0.046*** -0.065*** -0.050** -0.064**
(0.012) (0.012) (0.024) (0.025) (0.025)
Observations 2,216 1,799 702 578 597
R-squared 0.413 0.421 0.472 0.384 0.453 Dependent variable: Binary variable of speaking ability, generated from the median of the variable for the
years 1984-87 (Speaking very good or good = 1, speaking fair, poor or not at all = 0). Full set of controls as
in Table 3. Standard errors clustered by regions by country of origin in parentheses. *** p<0.01, ** p<0.05,
* p<0.1. Source: SOEP 1984-7 and IAB 1985; authors’ calculations.
28 Alternatively, focusing on guest-workers who arrived within five years after their home country had signed a
recruitment treaty with Germany produces again identical results (Table B-3).
29
Finally, we rule out that our results are driven by inter-regional mobility of guest-workers
after their initial placement—a second-order selection problem which remained unresolved in
previous papers that used natural placement experiments in Sweden or Germany. Therefore we
construct a statistical test which measures the extent of interregional mobility necessary to produce
a purely spurious negative correlation between language ability and ethnic concentrations (detailed
in Appendix F). For this test we have to assume that contemporary language patterns are
exclusively produced by regional sorting after initial placement and that learning or social
interaction have no causal impact on language acquisition. Using stepwise artificial sample
modifications (in which we experimentally relocate individuals with better language skills into
ethnic enclaves in order to simulate their outward mobility behaviour) we construct an extreme
falsification bound on our estimate which answers the question: How large is the extent of post-
placement sorting necessary to produce the observed language pattern and how does this compare
to the actual level of interregional mobility after placement (15%; Danzer and Yaman, 2013)? The
relocation simulation suggests that 45% of guest-workers must be extremely self-selected in order
to explain the enclave effect—a mobility level that far exceeds the true interregional migration of
guest-workers.
7. Policy implications
Which policy options are available to governments to increase immigrants’ language
proficiency? Ex-post language courses and education are expensive options: When the German
government liberalized its citizenship law in 2005, Integrationskurse (integration courses) were set
up containing citizenship education as well as 600 hours of German language courses for each
participant. According to the Federal Office for Migration and Refugees (BAMF) the costs per
participant amount to €1,764. The number of migrants who should be enrolled can be estimated at
2.17 mio. given that 35% of immigrants responded in a recent poll that they spoke German less

30
than reasonably well, which was confirmed by their German interviewers (RAM, 2006/07).29
Hence a simple back-of-the-envelope calculation reveals a tremendous cost of €3.8 bln.
But what level of language proficiency would prevail if the German government at the time
of recruitment had been able to place immigrants in regions such as to equalize their distribution
across space? Or, if guest-worker applicants had been screened by their level of education? We
answer these questions using simulation scenarios which we derive from baseline specification
(1).30 The benchmark model explains the actual language ability levels in the observational data
(44.5% of immigrants). In the first scenario we simulate the effect of an equal ethnic distribution
across space implying a replacement of actual regional concentrations by the West-German
average. In the second case we simulate the effect of increasing each immigrant’s education by one
year. An equal distribution of immigrants across Germany induces a positive, albeit moderate effect
on language proficiency (Table 8). Substantially more sizeable is the improvement in German
proficiency in the increased education scenario (plus 5.5 pp). This suggests that educational
screening may be a powerful tool to foster ex-post integration.
Table 8: Effect of selecting/distributing immigrants on language knowledge
(1) (2) (3)
Benchmark
Equal
distribution
One more year of
education
Percentage of German
speakers
44.5% 47.5% 50.0%
(0.7) (0.9) (1.0) Note: Delta-method standard errors in parentheses.
8. Conclusion
29 Note that the survey overestimates the true extent of language knowledge by focussing on the largest immigrant
groups (which have been longer in Germany on average).
30 We assume perfectly elastic foreign labor supply and perfectly elastic domestic labor demand.
31
This paper estimates the causal effect of own-ethnic regional concentration on the language
ability of labor immigrants. We contribute to the literature by shedding light on the question
whether a lack of contact with natives might be responsible for poor language skills which reflect
an important integration outcome. Using the quasi-experiment of guest-workers in Germany who
were paired with German firms exogenously, we can rule out differences in the willingness or
ability to learn German among migrants in different regions of Germany and find small but
negative effects from living among co-ethnics. We discuss and account for several sources of
measurement error and conduct a falsification exercise where we relocate migrants with good
language skills hypothetically into ethnic enclaves in order to simulate the effect of migrant sorting.
The negative enclave effect is robust to all these sensitivity tests. Given the level of aggregation
used in the analysis, our ethnic concentration effects are conservative estimates. Research on more
disaggregated ethnic enclaves might be desirable in order to better reflect immigrants’ daily life
context; however, the lack of highly disaggregated data in Germany prevents more profound
investigations.
The results indicate that poor language skills can be the result of a lack of social interaction
with natives—even among immigrants who are potentially willing and able to learn the host
country language. Our complementary research exploits measures of social interaction and civil
participation suggesting that the lack of language skills in ethnic enclaves can indeed be traced
back to insufficient contacts with natives (Danzer and Yaman, 2013). Clearly, integration policies
cannot force immigrants and natives to interact; however, suitable policies exist and should be
applied to equip migrants with proper language knowledge of the host country. Most effective for
the linguistic integration of immigrants might be educational screening procedures upon arrival, as
suggested by our policy experiments. Put differently, our research suggests that governments need
to take an active role in integration policy rather than shifting the blame for integration failures to
the immigrants. This is especially relevant since sorting into ethnic enclaves is of high relevance

32
in most immigration countries today (Bauer, Epstein and Gang, 2005; Damm, 2009b), implying
negative externalities for integration and labor market outcomes of future immigrant generations
and their descendants. Forty years after the original guest-worker program and as a consequence
of the Great Recession, Germany is again turning into a migration magnet in Europe, putting
integration back on the political agenda.
33
References
Alba, Richard, Logan, John, Lutz, Amy, Stults, Brian 2002. Only English by the Third Generation?
Loss and Preservation of the Mother Tongue among the Grandchildren of Contemporary
Immigrants. Demography 39, no. 3: 467-484.
Aldashev, Alisher, Gernandt, Johannes, Thomsen, Stephan L. 2009. Language usage, participation,
employment and earnings - Evidence for foreigners in West Germany with multiple sources
of selection. Labour Economics 16, no. 3: 330-341.
Bauer, Thomas K., Epstein, Gil S., Gang, Ira N. 2005. Enclaves, Language, and the Location
Choice of Migrants. Journal of Population Economics 18, no. 4: 649-662.
Berman, Eli, Lang, Kevin, Siniver, Erez 2003. Language-skill complementarity: returns to
immigrant language acquisition. Labour Economics 10, no. 3: 265-290.
Bleakley, Hoyt, Chin, Aimee, 2004. Language Skills and Earnings: Evidence from Childhood
Immigrants. Review of Economics and Statistics 86, no. 2: 481-496.
Borjas, George J. 1995. Ethnicity, Neighbourhoods, and Human-Capital Externalities. American
Economic Review 85, no. 3: 365-390.
Borjas, George J. 1998. To Ghetto or not to Ghetto: Ethnicity and Residential Segregation. Journal
of Urban Economics 44, no. 2: 228-253.
Bundesanstalt für Arbeit (various years). Ausländische Arbeitnehmer. Beschäftigung, Anwerbung,
Vermittlung [Foreign workers. Employment, recruitment, placement]. Bundesanstalt für
Arbeit: Nuremberg.
Castles, Stephen 1986. The Guest-Worker in Western Europe - An Obituary. International
Migration Review 20, no. 4: 761-78.
Chiswick, Barry R., Lee, Yew L., Miller, Paul W. 2005. Family matters: the role of the family in
immigrants' destination language acquisition. Journal of Population Economics 18, no. 4:
631-647.
Chiswick, Barry R., Miller, Paul W. 1995. The Endogeneity between Language and Earnings:
International Analyses. Journal of Labor Economics 13, no. 2: 246-288.
Chiswick, Barry R., Miller, Paul W. 2001. A model of destination-language acquisition:
Application to male immigrants in Canada. Demography 38, no. 3: 391-409.
34
Chiswick, Barry R., Miller, Paul W. 2002. Immigrant Earnings: Language Skills, Linguistic
Concentrations and the Business Cycle. Journal of Population Economics 15, no. 1: 31-57.
Chiswick, Barry R., Miller, Paul W. 2005. Do Enclaves Matter in Immigrant Adjustment? City &
Community 4, no. 1: 5-36.
Cutler, David M., Glaeser, Edward L. 1997. Are Ghettos Good or Bad? Quarterly Journal of
Economics 112, no. 3: 827-872.
Cutler, David M., Glaeser, Edward L., Vigdor, Jacob L. 2008. When are Ghettos Bad? Lessons
from Immigrant Segregation in the US. Journal of Urban Economics 63, no. 3: 759-774.
Dahnen, Josef and Werner Kozlowicz 1963. Ausländische Arbeitnehmer in der Bundesrepublik.
Sozialpolitik in Deutschland. W. Kohlhammer Verlag: Stuttgart.
Damm, Anna P. 2009a. Ethnic Enclaves and Immigrant Labor Market Outcomes: Quasi-
Experimental Evidence. Journal of Labor Economics 27, no. 2: 281-314.
Damm, Anna P. 2009b. Determinants of recent immigrants’ location choices: quasi-experimental
evidence. Journal of Population Economics 22: 145-174.
Danzer, Alexander M., Yaman, Firat 2013. Do Ethnic Enclaves Impede Immigrants’ Integration?
Evidence from a Quasi-Experimental Social-Interaction Approach. Review of International
Economics 21, no. 2: 311-325.
Drever, Anita I. 2004. Separate Spaces, Separate Outcomes? Neighbourhood Impacts on Minorities
in Germany. Urban Studies 41, no. 8: 1423-1439.
Dustmann, Christian 1994. Speaking Fluency, Writing Fluency and Earnings of Migrants. Journal
of Population Economics 7, no. 2: 133-156.
Dustmann, Christian 1996. Return migration – The European Experience. Economic Policy 11, no.
22: 214-250.
Dustmann, Christian, Fabbri, Francesca 2003. Language Proficiency and Labor Market
Performance of Immigrants in the UK. Economic Journal 113, no.489: 695-717.
Dustmann, Christian, van Soest, Arthur 2001. Language Fluency and Earnings: Estimation with
Misclassified Language Indicators. Review of Economics and Statistics 83, no. 4: 663-674.
Dustmann, Christian, van Soest, Arthur 2002. Language and the Earnings of Immigrants. Industrial
and Labor Relations Review 55, no. 3: 473-492.

35
Dustmann, Christian, van Soest, Arthur 2004. An Analysis of Speaking Fluency of Immigrants
Using Ordered Response Models With Classification Errors. Journal of Business &
Economic Statistics 22, no. 3: 312-321.
Edin, Per-Anders, Fredriksson, Peter, Aslund, Olof 2003. Ethnic Enclaves and the Economic
Success of Immigrants - Evidence from a Natural Experiment. Quarterly Journal of
Economics 118, no. 1: 329-357.
Espenshade, Thomas J, Fu, Haishan 1997. An Analysis of English-Language Proficiency among
U.S. Immigrants. American Sociological Review 62, no. 2: 288-305.
Feuser, Günther 1961. Ausländische Mitarbeiter im Betrieb [Foreign workers in the firm]. Verlag
Moderne Industrie: Munich.
Glitz, Albrecht 2012. The Labor Market Impact of Immigration: A Quasi-Experiment Exploiting
Immigrant Location Rules in Germany. Journal of Labor Economics 30, no.1: 175-213.
Glitz, Albrecht 2014. Ethnic Segregation in Germany. Labour Economics 29: Pages 28-40.
Gould, Eric D., Lavy, Victor, Paserman, M. Daniele 2004. Immigrating to Opportunity: Estimating
the Effect of School Quality Using a Natural Experiment on Ethiopians in Israel. Quarterly
Journal of Economics 119, no. 2: 489-526.
Gould, Eric D., Lavy, Victor, Paserman, M. Daniele 2011. Sixty Years after the Magic Carpet Ride:
The Long-Run Effect of the Early Childhood Environment on Social and Economic
Outcomes. Review of Economic Studies 78, no. 3: 938-973.
Grenier, Gilles 1984. The Effects of Language Characteristics on the Wages of Hispanic-American
Males. Journal of Human Resources 19, no. 1: 35-52.
Hansen, Niels 1979. Europe’s Guest Worker Policies and Mexicans in the United States. Growth
and Change 10, no 2: 2–8.
Hausman, Jerry A., Abrevaya, Jason, Scott-Morton, Fiona M. 1998. Misclassification of the
Dependent Variable in a Discrete-Response Setting. Journal of Econometrics 87: 239-269.
Lazear, Edward P. 1999. Culture and Language. Journal of Political Economy 107, no. 6: S95-126.
Mesch, Gustavo S. 2003. Language Proficiency among New Immigrants: The Role of Human
Capital and Societal Conditions: The Case of Immigrants from the Fsu in Israel. Sociological
Perspectives 46, no. 1: 41-58.

36
Mushaben, Joyce M. 1985. A crisis of culture: Isolation and integration among Turkish
guestworkers in the German Federal Republic. In Turkish Workers in Europe: An
Interdisciplinary Study, ed. Başgöz, İlhan and Norman Furniss. Bloomington: Indiana
University Turkish Studies.
Musterd, Sako 2005. Social and Ethnic Segregation in Europe: Levels, Causes, and Effects. Journal
of Urban Affairs 27, no. 3: 331-348.
Penninx, Rinus, Van Renselaar, Herman 1976. Evolution of Turkish migration before and during
the current European recession. In Migration and development: a study of the effects of
international labor migration on Bogazliyan district, ed. Abadan-Unat, Nermin, Keles,
Rusan, Penninx, Rinus, Velzen Lv, Yenisey L. Ankara: Ajans Türk Press.
RAM (2006/2007). Ausgewählte Migrantengruppen in Deutschland 2006/2007. Representative
survey by the Federal Office for Migration and Refugees. Nuremberg.
Rother, Nina 2008. Das Integrationspanel. Ergebnisse zur Integration von Teilnehmern zu Beginn
ihres Integrationskurses. WP 19, Bundesamt für Migration und Flüchtlinge, Nürnberg.
van Tubergen, Frank, Kalmijn, Matthijs 2009. A Dynamic Approach to the Determinants of
Immigrants’ Language Proficiency: The United States, 1980-2000. International Migration
Review 43, no. 3: 519-543.
van Tubergen, Frank, Wierenga, Menno 2011. The Language Acquisition of Male Immigrants in
a Multilingual Destination: Turks and Moroccans in Belgium. Journal of Ethnic and
Migration Studies 37, no. 7: 1039-1057.
Vervoort, Miranda, Dagevos, Jaco, Flap, Henk 2012. Ethnic concentration in the neighbourhood
and majority and minority language: A study of first and second-generation immigrants.
Social Science Research 41, no. 3: 555-569.
Voelker, Gottfried E. 1976. More Foreign Workers – Germany's Labour Problem No. 1. In Turkish
Workers in Europe 1960-1975, ed. Abadan-Unat, Nermin. Leiden: E J Brill-Leiden.
Wagner, Gert, Frick, Joachim, Schupp, Jürgen 2007. The German Socio-Economic Panel Study
(SOEP) - Scope, Evolution and Enhancements. Schmollers Jahrbuch 127, no. 1: 139-169.
Warman, Casey 2007. Ethnic Enclaves and Immigrant Earnings Growth. Canadian Journal of
Economics 40, no. 2: 401-422.

37
Weber, Rolf (ed.) 1966. Beschäftigung ausländischer Arbeitnehmer. Heft 2: Praktische Hilfen zur
Ausländerbeschäftigung [Employment of foreign workers. Issue 2: Practical guide for the
recruitment of foreigners]. Walter Stutz Verlag: Munich.
38
Ethnic Concentration and Language Fluency of Immigrants.
Evidence from the Guest-Worker Placement in Germany
Appendix
Not intended for publication.

39
Appendix A. Survey questions in SOEP
These are the most important questions in SOEP from which our dependent variables are
constructed. The questions are translated from the German version of the SOEP 1985, 1988 and
1996.
Question BP89A (SOEP 1985): What is your nationality? (Foreigners only)
Turk
Yugoslav
Greek
Italian
Spanish
other, fill in here __________
Questions BP91A01 and BP91A02 (SOEP 1985): Foreigners who come to Germany find
learning German difficult. In your case: (Foreigners only)
How well do you speak and write German?
Speaking
BP91A01
Writing
BP91A02
very well _____ _____
Good _____ _____
Fair _____ _____
Poorly _____ _____
not at all _____ _____

40
Question EP79A (SOEP 1988): What newspapers do you normally read? (Foreigners only)
only newspapers from my native country
mostly newspapers from my native country
about half German and half from my native country
mostly German newspapers
only German newspapers
does not apply as I read newspapers infrequently
Question MP96A (SOEP 1996): What language do you normally speak here in Germany?
mostly German
mostly my native language
both
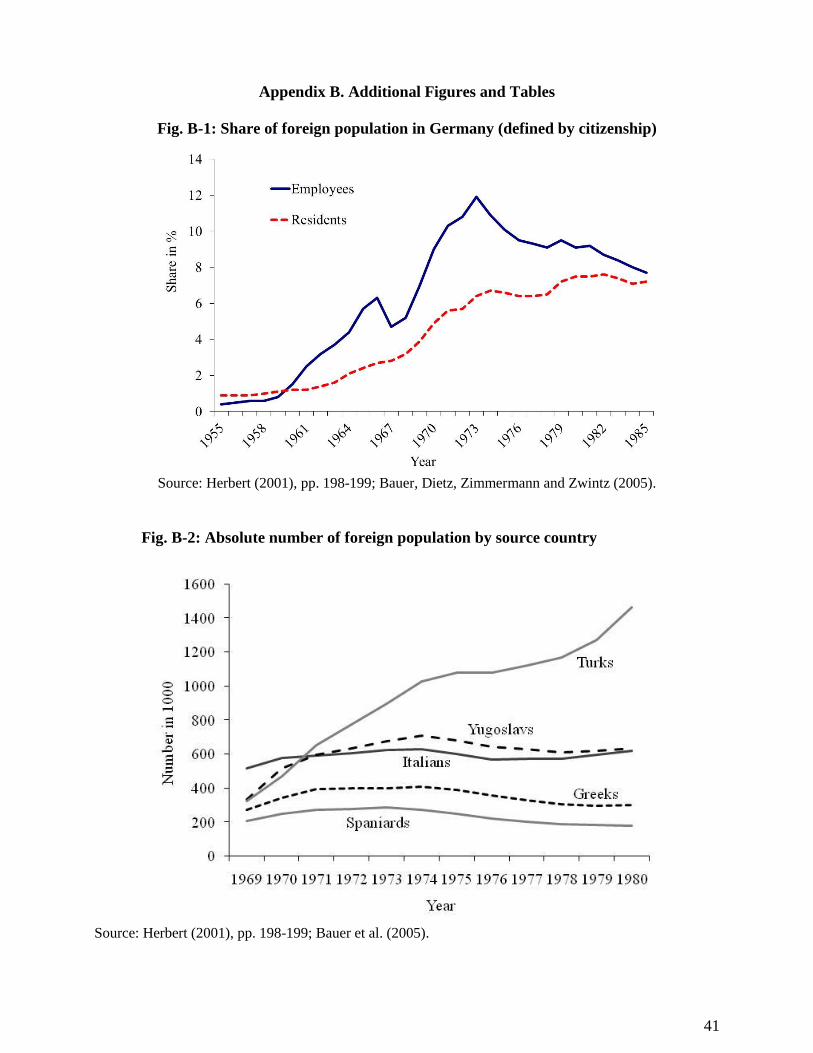
41
Appendix B. Additional Figures and Tables
Fig. B-1: Share of foreign population in Germany (defined by citizenship)
Source: Herbert (2001), pp. 198-199; Bauer, Dietz, Zimmermann and Zwintz (2005).
Fig. B-2: Absolute number of foreign population by source country
Source: Herbert (2001), pp. 198-199; Bauer et al. (2005).
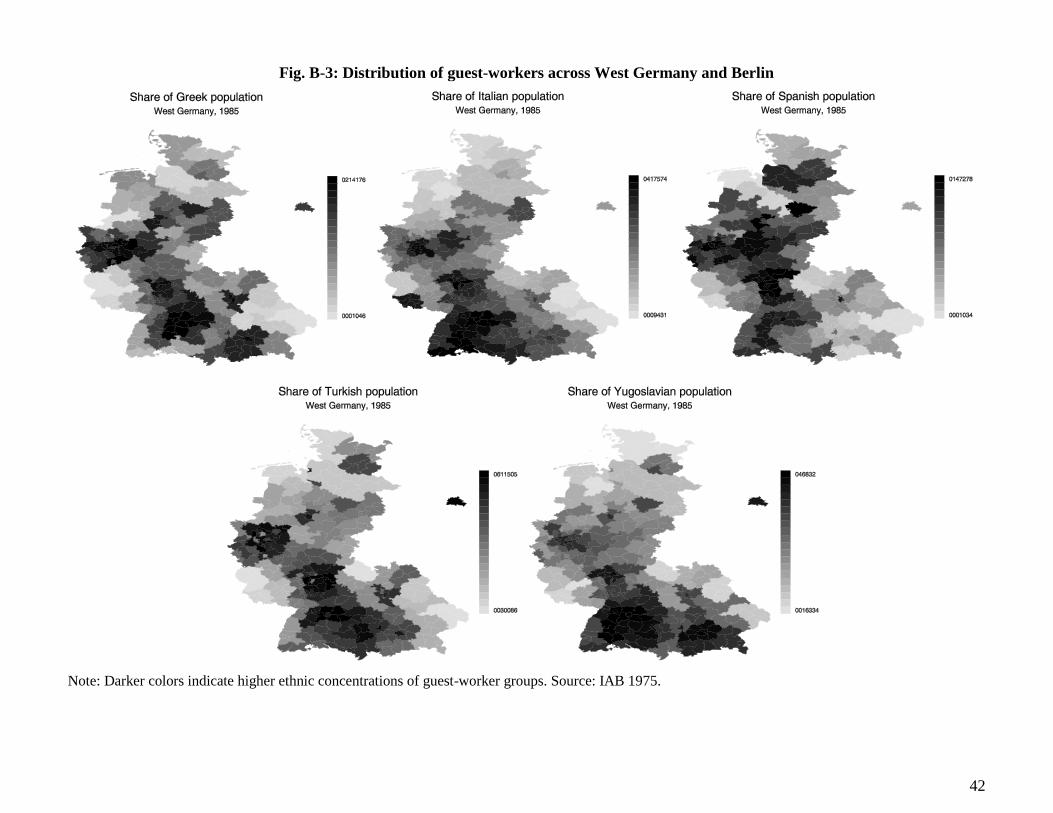
42
Fig. B-3: Distribution of guest-workers across West Germany and Berlin
Note: Darker colors indicate higher ethnic concentrations of guest-worker groups. Source: IAB 1975.
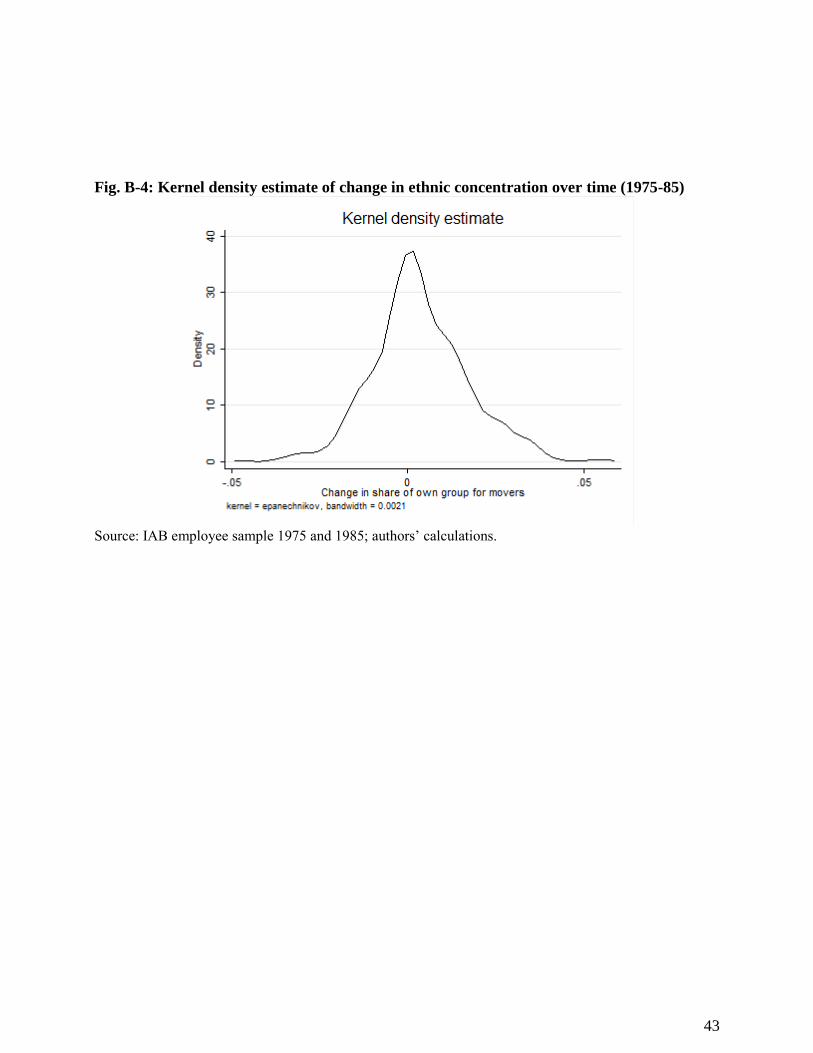
43
Fig. B-4: Kernel density estimate of change in ethnic concentration over time (1975-85)
Source: IAB employee sample 1975 and 1985; authors’ calculations.
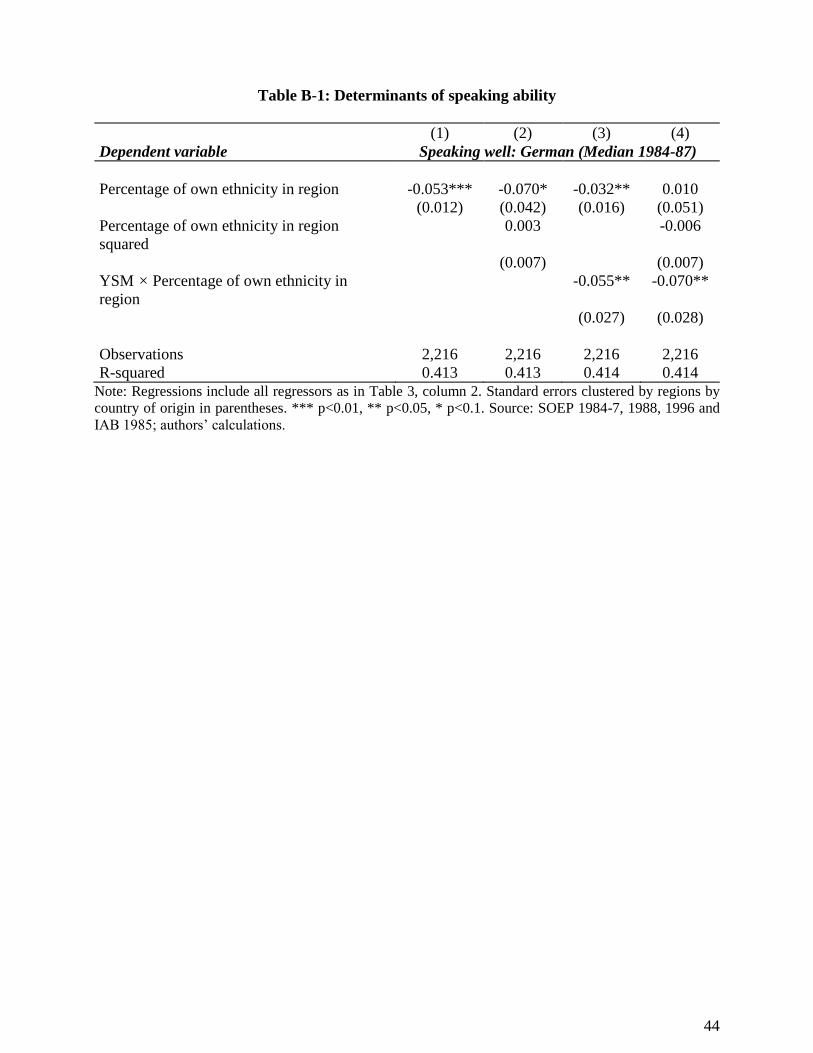
44
Table B-1: Determinants of speaking ability
(1) (2) (3) (4)
Dependent variable Speaking well: German (Median 1984-87)
Percentage of own ethnicity in region -0.053*** -0.070* -0.032** 0.010
(0.012) (0.042) (0.016) (0.051)
Percentage of own ethnicity in region
squared
0.003 -0.006
(0.007) (0.007)
YSM × Percentage of own ethnicity in
region
-0.055** -0.070**
(0.027) (0.028)
Observations 2,216 2,216 2,216 2,216
R-squared 0.413 0.413 0.414 0.414
Note: Regressions include all regressors as in Table 3, column 2. Standard errors clustered by regions by
country of origin in parentheses. *** p<0.01, ** p<0.05, * p<0.1. Source: SOEP 1984-7, 1988, 1996 and
IAB 1985; authors’ calculations.

45
Table B-2: Determinants of changes in regional ethnic concentration 1975-85 (DIFF)
(1) (2) (3) (4) (5) (6)
Sample All guest-
workers
Italians Greeks Spaniards Turks Yugoslavians
Ability -0.002 -0.002 -0.002 0.003 -0.001 -0.003
(0.002) (0.003) (0.003) (0.002) (0.003) (0.003)
Educ 2 -0.000 -0.000 -0.001 0.000 0.001 -0.002**
(0.001) (0.001) (0.001) (0.001) (0.001) (0.001)
Educ 3 -0.002 -0.002
(0.014) (0.010)
Educ 4 0.004 0.001 0.007 -0.003 0.006 0.005
(0.005) (0.007) (0.006) (0.004) (0.011) (0.008)
Educ 5 -0.000 -0.010 -0.003 0.012 -0.005
(0.005) (0.010) (0.005) (0.011) (0.008)
Educ 6 -0.005 -0.002 0.004 0.001 -0.020***
(0.003) (0.010) (0.003) (0.005) (0.006)
Age 0.000 -0.000 -0.000 0.001 -0.000 0.001
(0.000) (0.001) (0.001) (0.000) (0.001) (0.001)
Age squared -0.000 -0.000 0.000 -0.000 -0.000 -0.000
(0.000) (0.000) (0.000) (0.000) (0.000) (0.000)
Turkish 0.002*
(0.001)
Yugoslavian 0.004***
(0.001)
Italian 0.000
(0.001)
Spanish -0.001
(0.002)
Constant 0.001 0.004 0.014 -0.017* 0.003 -0.016
(0.008) (0.012) (0.012) (0.010) (0.014) (0.017)
Observations 2,852 323 152 84 1,214 1,079
R-squared 0.014 0.006 0.036 0.056 0.003 0.025
Note: OLS regressions. Dependent variable: DIFF = difference in ethnic concentration of individual specific
region of residence between 1975 and 1985. Omitted categories: Educ 1 and Greek nationals. Robust
standard errors in parentheses. *** p<0.01, ** p<0.05, * p<0.1; Source: IAB 1975/1985; authors’
calculations.
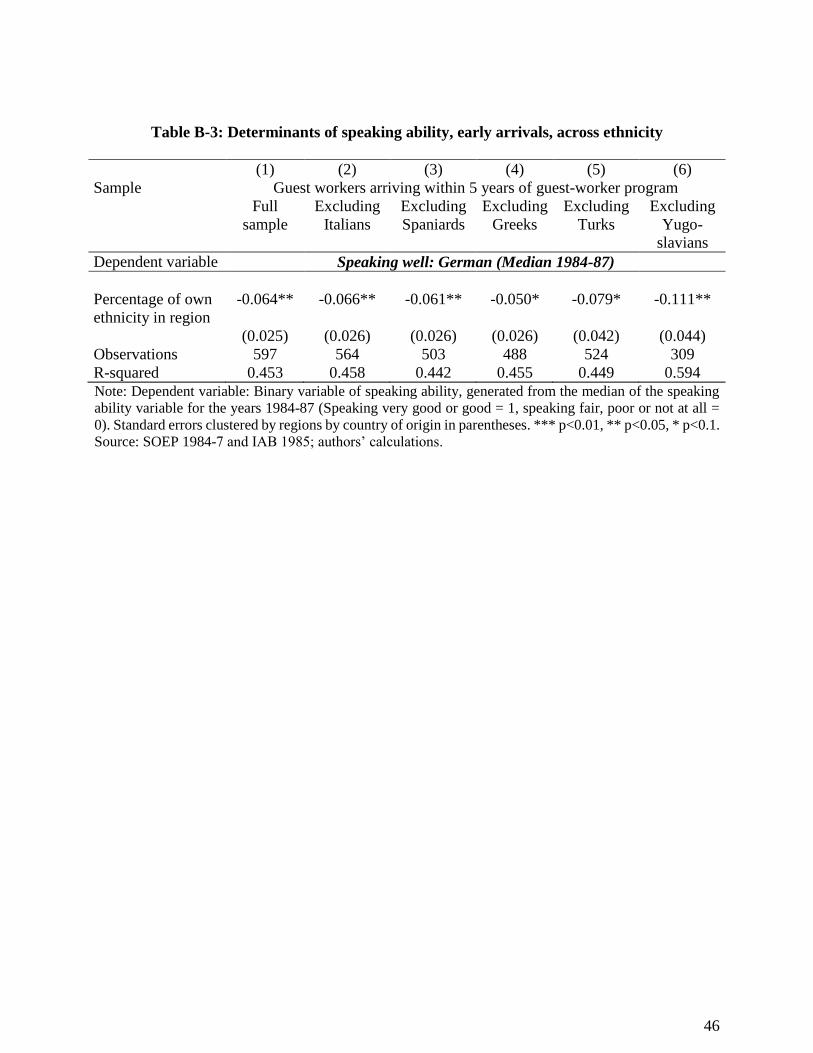
46
Table B-3: Determinants of speaking ability, early arrivals, across ethnicity
(1) (2) (3) (4) (5) (6)
Sample Guest workers arriving within 5 years of guest-worker program
Full
sample
Excluding
Italians
Excluding
Spaniards
Excluding
Greeks
Excluding
Turks
Excluding
Yugo-
slavians
Dependent variable Speaking well: German (Median 1984-87)
Percentage of own
ethnicity in region
-0.064** -0.066** -0.061** -0.050* -0.079* -0.111**
(0.025) (0.026) (0.026) (0.026) (0.042) (0.044)
Observations 597 564 503 488 524 309
R-squared 0.453 0.458 0.442 0.455 0.449 0.594
Note: Dependent variable: Binary variable of speaking ability, generated from the median of the speaking
ability variable for the years 1984-87 (Speaking very good or good = 1, speaking fair, poor or not at all =
0). Standard errors clustered by regions by country of origin in parentheses. *** p<0.01, ** p<0.05, * p<0.1.
Source: SOEP 1984-7 and IAB 1985; authors’ calculations.
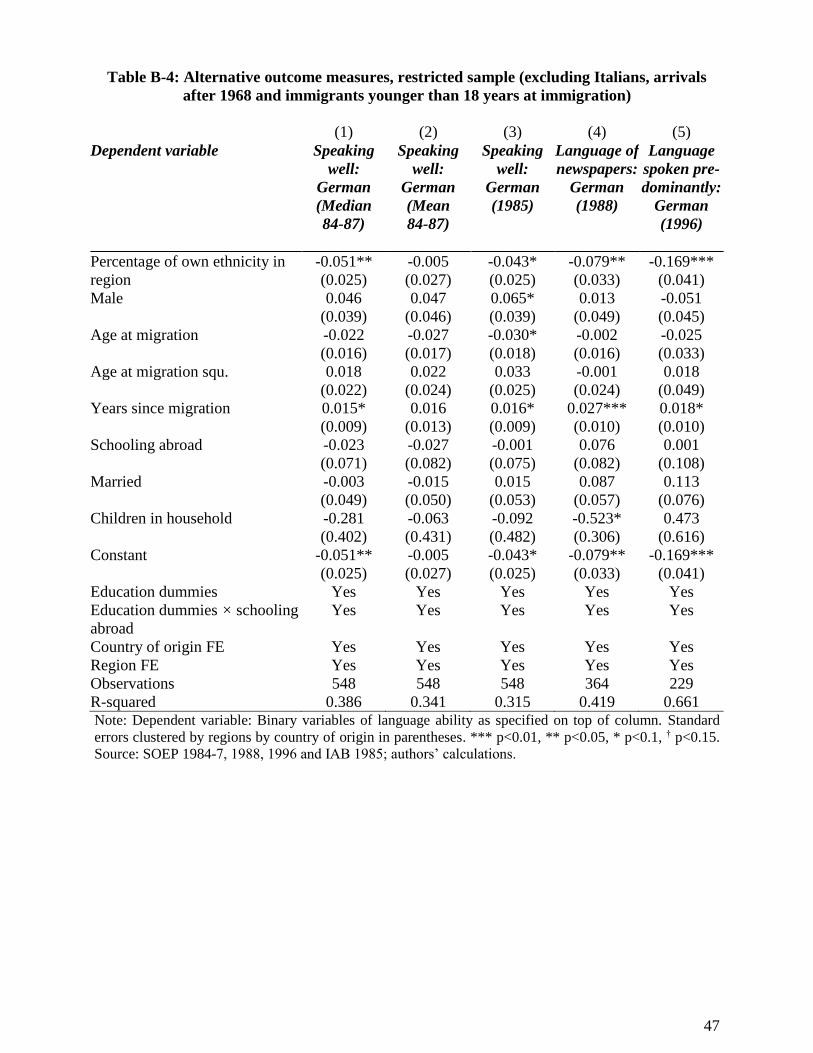
47
Table B-4: Alternative outcome measures, restricted sample (excluding Italians, arrivals
after 1968 and immigrants younger than 18 years at immigration)
(1) (2) (3) (4) (5)
Dependent variable Speaking
well:
German
(Median
84-87)
Speaking
well:
German
(Mean
84-87)
Speaking
well:
German
(1985)
Language of
newspapers:
German
(1988)
Language
spoken pre-
dominantly:
German
(1996)
Percentage of own ethnicity in
region
-0.051** -0.005 -0.043* -0.079** -0.169***
(0.025) (0.027) (0.025) (0.033) (0.041)
Male 0.046 0.047 0.065* 0.013 -0.051
(0.039) (0.046) (0.039) (0.049) (0.045)
Age at migration -0.022 -0.027 -0.030* -0.002 -0.025
(0.016) (0.017) (0.018) (0.016) (0.033)
Age at migration squ. 0.018 0.022 0.033 -0.001 0.018
(0.022) (0.024) (0.025) (0.024) (0.049)
Years since migration 0.015* 0.016 0.016* 0.027*** 0.018*
(0.009) (0.013) (0.009) (0.010) (0.010)
Schooling abroad -0.023 -0.027 -0.001 0.076 0.001
(0.071) (0.082) (0.075) (0.082) (0.108)
Married -0.003 -0.015 0.015 0.087 0.113
(0.049) (0.050) (0.053) (0.057) (0.076)
Children in household -0.281 -0.063 -0.092 -0.523* 0.473
(0.402) (0.431) (0.482) (0.306) (0.616)
Constant -0.051** -0.005 -0.043* -0.079** -0.169***
(0.025) (0.027) (0.025) (0.033) (0.041)
Education dummies Yes Yes Yes Yes Yes
Education dummies × schooling
abroad
Yes Yes Yes Yes Yes
Country of origin FE Yes Yes Yes Yes Yes
Region FE Yes Yes Yes Yes Yes
Observations 548 548 548 364 229
R-squared 0.386 0.341 0.315 0.419 0.661 Note: Dependent variable: Binary variables of language ability as specified on top of column. Standard
errors clustered by regions by country of origin in parentheses. *** p<0.01, ** p<0.05, * p<0.1, † p<0.15.
Source: SOEP 1984-7, 1988, 1996 and IAB 1985; authors’ calculations.
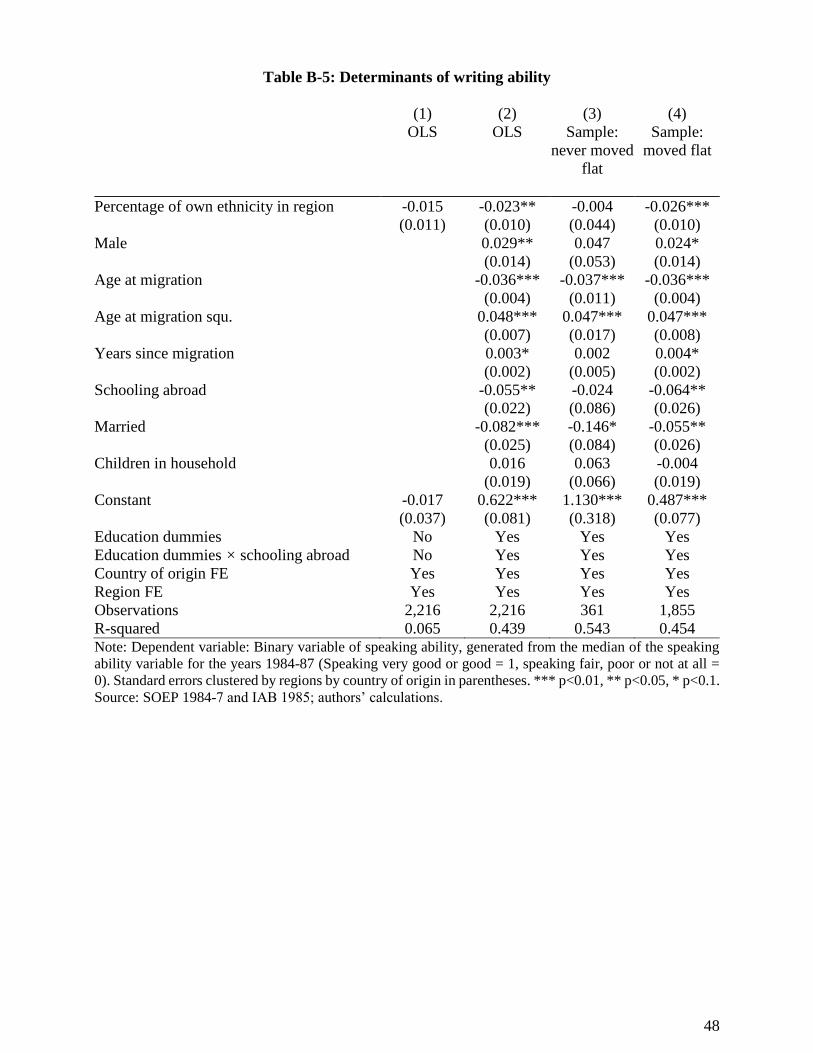
48
Table B-5: Determinants of writing ability
(1) (2) (3) (4)
OLS OLS Sample:
never moved
flat
Sample:
moved flat
Percentage of own ethnicity in region -0.015 -0.023** -0.004 -0.026***
(0.011) (0.010) (0.044) (0.010)
Male 0.029** 0.047 0.024*
(0.014) (0.053) (0.014)
Age at migration -0.036*** -0.037*** -0.036***
(0.004) (0.011) (0.004)
Age at migration squ. 0.048*** 0.047*** 0.047***
(0.007) (0.017) (0.008)
Years since migration 0.003* 0.002 0.004*
(0.002) (0.005) (0.002)
Schooling abroad -0.055** -0.024 -0.064**
(0.022) (0.086) (0.026)
Married -0.082*** -0.146* -0.055**
(0.025) (0.084) (0.026)
Children in household 0.016 0.063 -0.004
(0.019) (0.066) (0.019)
Constant -0.017 0.622*** 1.130*** 0.487***
(0.037) (0.081) (0.318) (0.077)
Education dummies No Yes Yes Yes
Education dummies × schooling abroad No Yes Yes Yes
Country of origin FE Yes Yes Yes Yes
Region FE Yes Yes Yes Yes
Observations 2,216 2,216 361 1,855
R-squared 0.065 0.439 0.543 0.454 Note: Dependent variable: Binary variable of speaking ability, generated from the median of the speaking
ability variable for the years 1984-87 (Speaking very good or good = 1, speaking fair, poor or not at all =
0). Standard errors clustered by regions by country of origin in parentheses. *** p<0.01, ** p<0.05, * p<0.1.
Source: SOEP 1984-7 and IAB 1985; authors’ calculations.
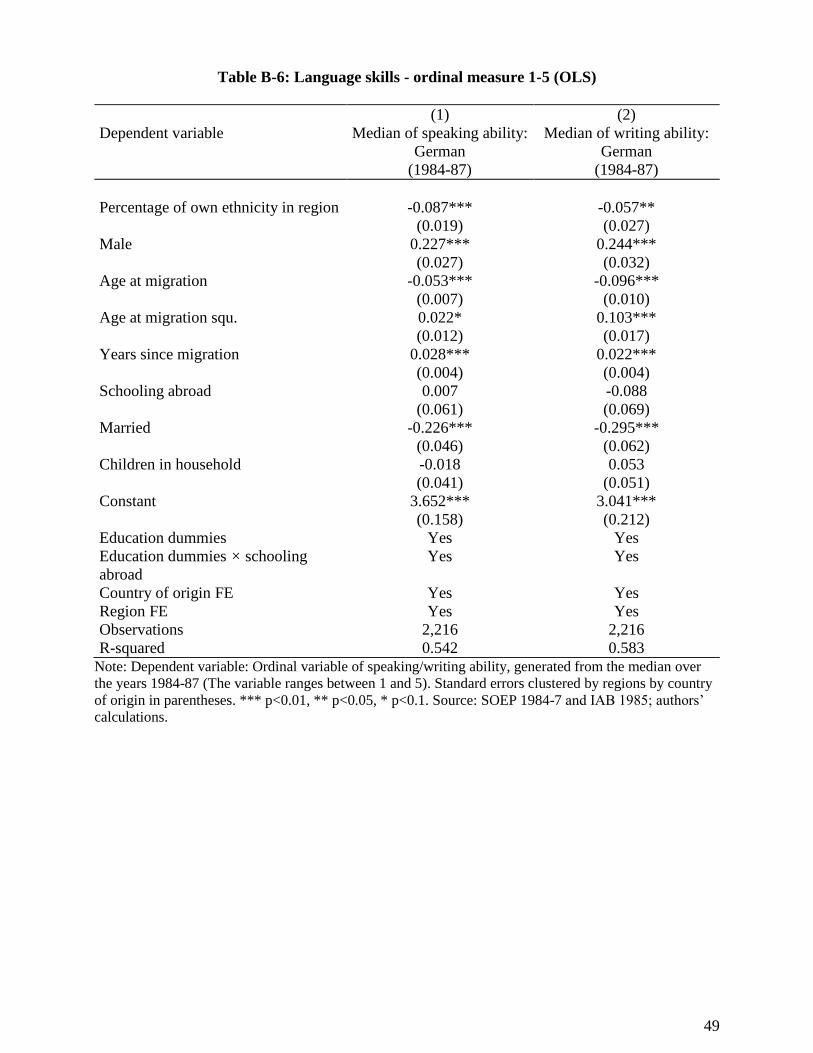
49
Table B-6: Language skills - ordinal measure 1-5 (OLS)
(1) (2)
Dependent variable Median of speaking ability:
German
(1984-87)
Median of writing ability:
German
(1984-87)
Percentage of own ethnicity in region -0.087*** -0.057**
(0.019) (0.027)
Male 0.227*** 0.244***
(0.027) (0.032)
Age at migration -0.053*** -0.096***
(0.007) (0.010)
Age at migration squ. 0.022* 0.103***
(0.012) (0.017)
Years since migration 0.028*** 0.022***
(0.004) (0.004)
Schooling abroad 0.007 -0.088
(0.061) (0.069)
Married -0.226*** -0.295***
(0.046) (0.062)
Children in household -0.018 0.053
(0.041) (0.051)
Constant 3.652*** 3.041***
(0.158) (0.212)
Education dummies Yes Yes
Education dummies × schooling
abroad
Yes Yes
Country of origin FE Yes Yes
Region FE Yes Yes
Observations 2,216 2,216
R-squared 0.542 0.583
Note: Dependent variable: Ordinal variable of speaking/writing ability, generated from the median over
the years 1984-87 (The variable ranges between 1 and 5). Standard errors clustered by regions by country
of origin in parentheses. *** p<0.01, ** p<0.05, * p<0.1. Source: SOEP 1984-7 and IAB 1985; authors’
calculations.
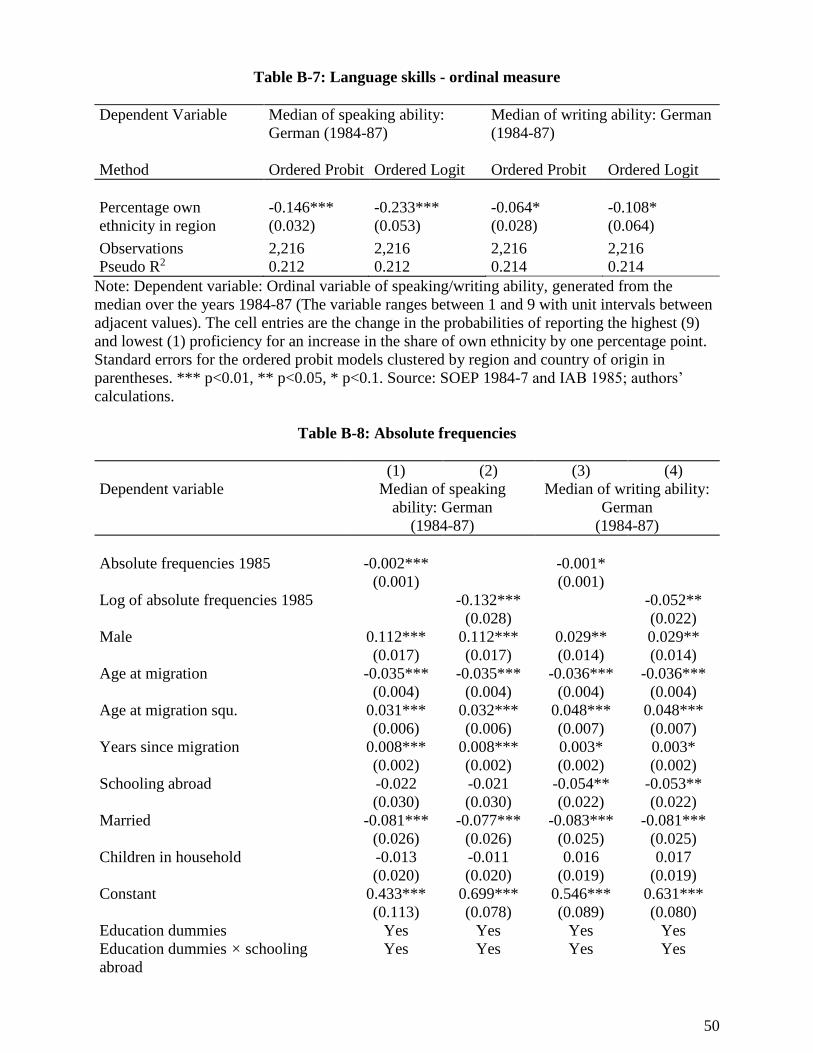
50
Table B-7: Language skills - ordinal measure
Dependent Variable Median of speaking ability:
German (1984-87)
Median of writing ability: German
(1984-87)
Method Ordered Probit Ordered Logit Ordered Probit Ordered Logit
Percentage own -0.146*** -0.233*** -0.064* -0.108*
ethnicity in region (0.032) (0.053) (0.028) (0.064)
Observations 2,216 2,216 2,216 2,216
Pseudo R2 0.212 0.212 0.214 0.214
Note: Dependent variable: Ordinal variable of speaking/writing ability, generated from the
median over the years 1984-87 (The variable ranges between 1 and 9 with unit intervals between
adjacent values). The cell entries are the change in the probabilities of reporting the highest (9)
and lowest (1) proficiency for an increase in the share of own ethnicity by one percentage point.
Standard errors for the ordered probit models clustered by region and country of origin in
parentheses. *** p<0.01, ** p<0.05, * p<0.1. Source: SOEP 1984-7 and IAB 1985; authors’
calculations.
Table B-8: Absolute frequencies
(1) (2) (3) (4)
Dependent variable Median of speaking
ability: German
(1984-87)
Median of writing ability:
German
(1984-87)
Absolute frequencies 1985 -0.002*** -0.001*
(0.001) (0.001)
Log of absolute frequencies 1985 -0.132*** -0.052**
(0.028) (0.022)
Male 0.112*** 0.112*** 0.029** 0.029**
(0.017) (0.017) (0.014) (0.014)
Age at migration -0.035*** -0.035*** -0.036*** -0.036***
(0.004) (0.004) (0.004) (0.004)
Age at migration squ. 0.031*** 0.032*** 0.048*** 0.048***
(0.006) (0.006) (0.007) (0.007)
Years since migration 0.008*** 0.008*** 0.003* 0.003*
(0.002) (0.002) (0.002) (0.002)
Schooling abroad -0.022 -0.021 -0.054** -0.053**
(0.030) (0.030) (0.022) (0.022)
Married -0.081*** -0.077*** -0.083*** -0.081***
(0.026) (0.026) (0.025) (0.025)
Children in household -0.013 -0.011 0.016 0.017
(0.020) (0.020) (0.019) (0.019)
Constant 0.433*** 0.699*** 0.546*** 0.631***
(0.113) (0.078) (0.089) (0.080)
Education dummies Yes Yes Yes Yes
Education dummies × schooling
abroad
Yes Yes Yes Yes

51
Country of origin FE Yes Yes Yes Yes
Region FE Yes Yes Yes Yes
Observations 2,216 2,216 2,216 2,216
R-squared 0.412 0.414 0.439 0.439
Note: Dependent variable: Binary variable of speaking ability, generated from the median of the speaking
ability variable for the years 1984-87 (Speaking very good or good = 1, speaking fair, poor or not at all =
0). Standard errors clustered by regions by country of origin in parentheses. *** p<0.01, ** p<0.05, * p<0.1.
Source: SOEP 1984-7 and IAB 1985; authors’ calculations.
References
Bauer, Thomas K., Dietz, Barbara, Zimmermann, Klaus F., Zwintz, Eric 2005. German Migration:
Development, Assimilation, and Labor Market Effects. In European Migration, What Do We
Know?, ed. Zimmermann, Klaus F. Oxford: Oxford University Press.
Herbert, Ulrich 2001. Geschichte der Ausländerpolitik in Deutschland – Saisonarbeiter,
Zwangsarbeiter, Gastarbeiter, Flüchtlinge. Munich: C.H.Beck.
52
Appendix C. The hazard of return migration
For straightforward interpretation we report results for an exponential hazard model with
𝑃(𝑇𝑖 = 𝑡|𝑇𝑖 ≥ 𝑡) = exp(𝑋𝑖′𝛽), (C-1)
where Ti denotes the time of return of immigrant i, Xi is a column vector of individual
characteristics and β the coefficient vector (Table C-1; the results are robust to using different
survival time distributions and to the inclusion of unobserved heterogeneity distributions). All
regressions include the usual set of individual control variables. The upper panel of Table C-1
illustrates results for a model where we consider an immigrant to be at risk of returning to his
country of origin since immigration, while the lower panel considers an immigrant to be at risk
after 1984. The two specifications yield very similar results. Without controlling for ethnic
concentration (column 1) immigrants who speak German well seem to be 25% less likely to return
at any given point of time. After adding ethnic concentration (column 2) we conclude that those
who speak poorly and those who live in more concentrated regions are more likely to return (albeit
the latter result is not significant at conventional levels). The results in column 3 include an
interaction between language ability and ethnic concentration and show that immigrants in more
concentrated regions tend to be more likely to return (by 8% when ethnic concentration increases
by one percentage point), but that those living in concentrated regions and speaking German well
offset this effect. This result is robust to the inclusion of dummy variables indicating the stated
intention to return or to stay at least five more years in Germany as answered in the survey years
1984 and 1985 (column 4). In order to illustrate the robustness of our baseline results to return
migration we estimate specification (1) with an indicator for return intent, which does not change
our findings (Table C-2).
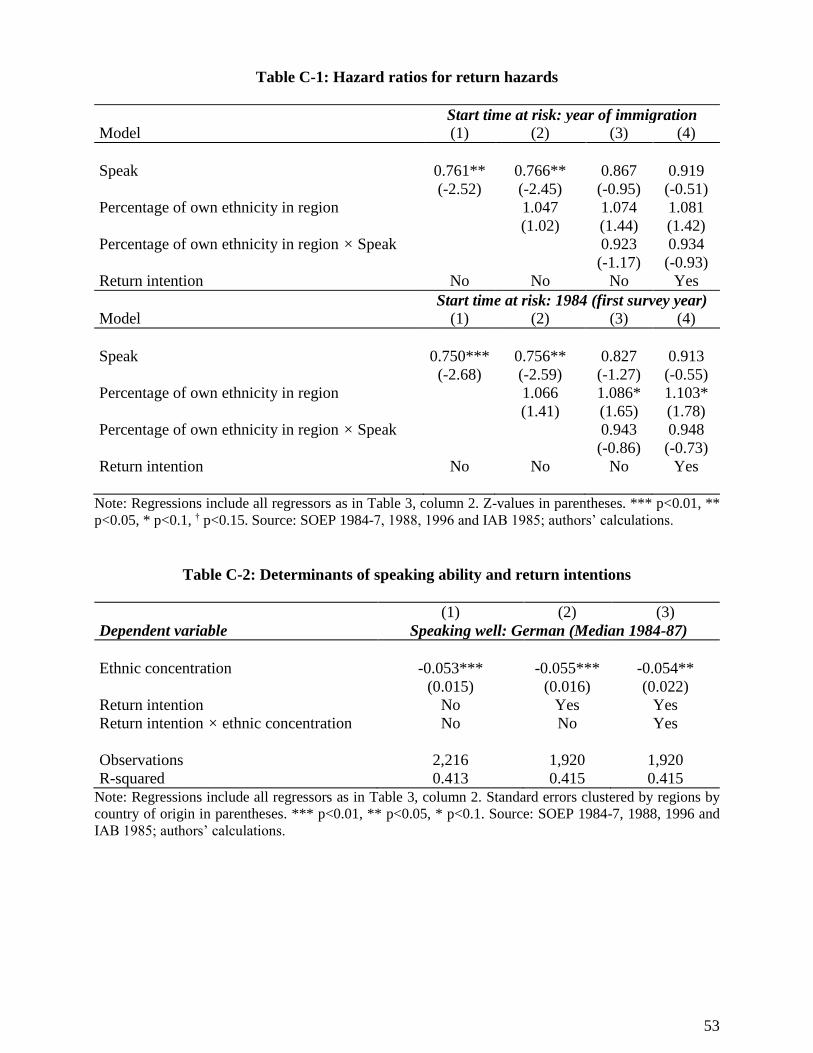
53
Table C-1: Hazard ratios for return hazards
Start time at risk: year of immigration
Model (1) (2) (3) (4)
Speak 0.761** 0.766** 0.867 0.919
(-2.52) (-2.45) (-0.95) (-0.51)
Percentage of own ethnicity in region 1.047 1.074 1.081
(1.02) (1.44) (1.42)
Percentage of own ethnicity in region × Speak 0.923 0.934
(-1.17) (-0.93)
Return intention No No No Yes
Start time at risk: 1984 (first survey year)
Model (1) (2) (3) (4)
Speak 0.750*** 0.756** 0.827 0.913
(-2.68) (-2.59) (-1.27) (-0.55)
Percentage of own ethnicity in region 1.066 1.086* 1.103*
(1.41) (1.65) (1.78)
Percentage of own ethnicity in region × Speak 0.943 0.948
(-0.86) (-0.73)
Return intention No No No Yes
Note: Regressions include all regressors as in Table 3, column 2. Z-values in parentheses. *** p<0.01, **
p<0.05, * p<0.1, † p<0.15. Source: SOEP 1984-7, 1988, 1996 and IAB 1985; authors’ calculations.
Table C-2: Determinants of speaking ability and return intentions
(1) (2) (3)
Dependent variable Speaking well: German (Median 1984-87)
Ethnic concentration -0.053*** -0.055*** -0.054**
(0.015) (0.016) (0.022)
Return intention No Yes Yes
Return intention × ethnic concentration No No Yes
Observations 2,216 1,920 1,920
R-squared 0.413 0.415 0.415
Note: Regressions include all regressors as in Table 3, column 2. Standard errors clustered by regions by
country of origin in parentheses. *** p<0.01, ** p<0.05, * p<0.1. Source: SOEP 1984-7, 1988, 1996 and
IAB 1985; authors’ calculations.
54
Appendix D. Measurement error in ethnic concentration measures
We have to consider three sources of potential bias: 1) Sorting bias, 2) Attenuation bias, 3)
Aggregation bias. Sorting bias arises if immigrants with poor language skills move to places with
high concentrations of their own ethnicity. We argue in this paper that the choice of our regional
aggregate together with the guest-worker placement largely eliminates this bias. We assume that
any sorting is likely to happen within but not across regions. Attenuation bias is caused by an
imprecise projection of the true ethnic concentrations due to sampling error (see Aydemir and
Borjas (2011) for an application to the wage impact of immigration) This is known to bias
coefficients on the ethnic concentration variable towards zero. Under our hypothesis that the true
effect is negative, attenuation bias should deliver a conservative estimate of the ethnic
concentration effect. Smaller regional aggregates would aggravate this bias, since the projections
would be based on even smaller regional sample sizes. Aggregation bias occurs because the spatial
radius in which the immigrants perform their daily interactions is very likely to be much smaller
than our level of aggregation. Under our hypothesis, the "true" ethnic concentration of a non-
speaker is likely to be higher than the concentration we measure for the region. Note that this is
distinct from a sorting bias. Aggregation bias would arise even if all immigrants were exogenously
placed and had always stayed in their initial residence. This measurement error is likely to
underestimate the (negative) covariance between ethnic concentration and language ability, but
also to underestimate the variance of ethnic concentration, so that the combined effect on the
coefficient in a univariate regression of language on concentration cannot be unambiguously
signed. However, we have numerically verified that with our sample characteristics an under-
estimation of ethnic concentrations for non-speakers also results in a bias towards zero, that is, a
smaller regional aggregation should deliver stronger ethnic concentration effects. To get an
intuition for this, consider two Italian immigrants who live in region A, one of whom speaks

55
German and the other does not. Consider also two Turks who live in the same region, one of whom
speaks German and the other does not. Since the concentration of Italians and Turks would be
different in the region, but both ethnicities have the same share of German-speakers, the
concentration coefficient would be zero. However, if the Italian and the Turk who do not speak
German are in fact living in areas within the region with a higher share of own-ethnic fellows
compared to their German speaking counterpart (as would be the case under our working
hypothesis), we should obtain a negative concentration coefficient.
Thus, we eliminate sorting bias, and attenuation together with aggregation bias
underestimate the true concentration effect. Going from our to a higher aggregate would reduce
attenuation but increase aggregation bias (and vice versa for using smaller aggregates).
To gauge the combined effect of these biases we employ two robustness tests: instrumenting
the ethnic concentration variable, and estimating our model for higher regional aggregates.
Ourinstrumental variable approach estimates the following system of equations:
ikssk
j
jsks
iksskksiks
eXECrankEC
uXECy
')(
'
4
1
(D-1)
where j ≠ k. The basic idea is to rank regions according to ethnic concentration for each
country of origin and use the concentration rank of other ethnicities as instruments for the share of
own-ethnic peers in one’s residential region. This approach seems promising because guest-
workers were de facto randomly allocated across West Germany, implying that there should be
little distributional imbalance with respect to countries of origin across regions. In other words,
although there were many more Turkish than Greek guest-workers in German regions, the
allocation scheme did not deliberately produce regional Turkish and Greek clusters but high-
immigration vs. low-immigration regions depending on regional labour demand (with jointly more

56
vs. fewer guest-workers of all ethnicities). Indeed, the correlation coefficients between regional
ethnic concentrations are all strongly positive and highly significant.
We construct a rank of ECj for each ECk such that each ethnicity in a region is instrumented
with the nationwide ranking of the very same region with respect to another ethnicity. The
percentage of Greek immigrants in the city of Bremerhaven (1%) is, for instance, instrumented
with Bremerhaven’s rank with respect to the percentage of the Spanish population in Germany
(rank 73). The instruments are clearly relevant (i.e., Cov(z, x) ≠ 0) as will be seen by the large first
stage F-statistics and partial R2. The instruments also satisfy the requirement that the measurement
errors for ECj and ECk are uncorrelated (e.g. oversampling Greeks in one area is not informative
about over- or undersampling other ethnicities, see Wooldridge, 2008, p. 525-527). The results are
reported in Table E-1, column 2.
In addition we compare our estimates based on regional ethnic concentrations with
estimates at a much higher level of aggregation: the 11 states of Germany in 1985. Attenuation bias
should be lower at this level of aggregation. However the covariance between language and ethnic
concentration is much lower and pulls the estimates towards zero. The results with state level
concentrations are reported in Table D-1. The concentration coefficient an all outcomes is smaller
in absolute value compared to our benchmark results. With all due caution, the best we can infer
from this result is that a higher aggregation has resulted in smaller estimates, suggesting that
smaller regions might result in larger estimates.
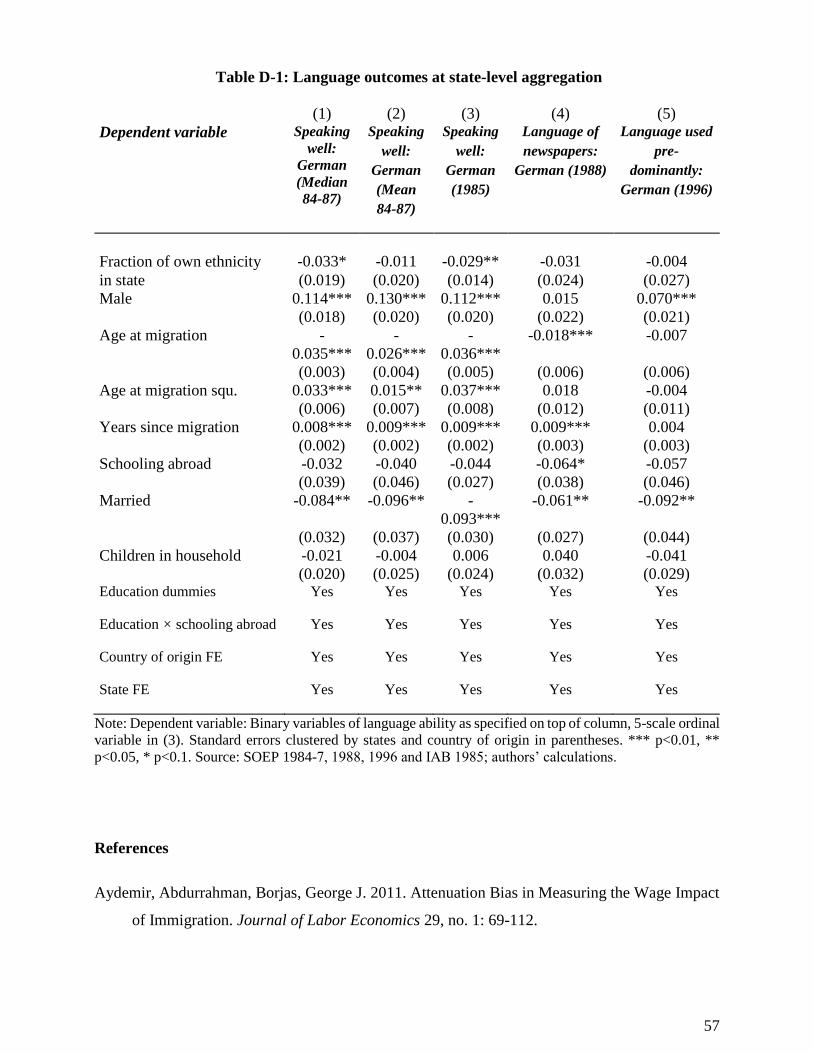
57
Table D-1: Language outcomes at state-level aggregation
(1) (2) (3) (4) (5)
Dependent variable Speaking
well:
German
(Median
84-87)
Speaking
well:
German
(Mean
84-87)
Speaking
well:
German
(1985)
Language of
newspapers:
German (1988)
Language used
pre-
dominantly:
German (1996)
Fraction of own ethnicity -0.033* -0.011 -0.029** -0.031 -0.004
in state (0.019) (0.020) (0.014) (0.024) (0.027)
Male 0.114*** 0.130*** 0.112*** 0.015 0.070***
(0.018) (0.020) (0.020) (0.022) (0.021)
Age at migration -
0.035***
-
0.026***
-
0.036***
-0.018*** -0.007
(0.003) (0.004) (0.005) (0.006) (0.006)
Age at migration squ. 0.033*** 0.015** 0.037*** 0.018 -0.004
(0.006) (0.007) (0.008) (0.012) (0.011)
Years since migration 0.008*** 0.009*** 0.009*** 0.009*** 0.004
(0.002) (0.002) (0.002) (0.003) (0.003)
Schooling abroad -0.032 -0.040 -0.044 -0.064* -0.057
(0.039) (0.046) (0.027) (0.038) (0.046)
Married -0.084** -0.096** -
0.093***
-0.061** -0.092**
(0.032) (0.037) (0.030) (0.027) (0.044)
Children in household -0.021 -0.004 0.006 0.040 -0.041
(0.020) (0.025) (0.024) (0.032) (0.029) Education dummies Yes Yes Yes Yes Yes
Education × schooling abroad Yes Yes Yes Yes Yes
Country of origin FE Yes Yes Yes Yes Yes
State FE Yes Yes Yes Yes Yes
Note: Dependent variable: Binary variables of language ability as specified on top of column, 5-scale ordinal
variable in (3). Standard errors clustered by states and country of origin in parentheses. *** p<0.01, **
p<0.05, * p<0.1. Source: SOEP 1984-7, 1988, 1996 and IAB 1985; authors’ calculations.
References
Aydemir, Abdurrahman, Borjas, George J. 2011. Attenuation Bias in Measuring the Wage Impact
of Immigration. Journal of Labor Economics 29, no. 1: 69-112.

58
Wooldridge, Jeffrey M. 2008. Introductory Econometrics: A Modern Approach. Fourth edition.
Mason, OH: South-Western.
59
Appendix E. The misclassification model
Models using language ability as an explanatory variable (e.g., in wage regressions) have
discussed the measurement error inherent to self-assessed language knowledge (Dustmann and van
Soest, 2001; Bleakley and Chin, 2004). Survey respondents might generally misjudge their
language ability, and the deviation of self-assessed from “objective” fluency might be correlated
with level of education (i.e., better educated might have a better idea of their true language ability)
and level of language ability (i.e., those in the upper part of the fluency distribution less likely over-
estimate their ability with the reverse being true for the bottom part of the fluency distribution).
While these data issues may be present in our study, measurement error will in this case affect the
dependent variable. Binary or multinomial models will yield inconsistent estimates if some
immigrants misjudge their German skills or have different standards as to what constitutes a good
or very good command of the language (Hausman et al., 1998). Although we use the median in
reported German skills over the survey years 1984-87 as dependent variable (to reduce time-
varying measurement error), time-invariant measurement error might remain. To test for such
misclassification error we apply a parametric maximum likelihood estimation similar to Hausman
et al. (1998) that accounts for the possibility that an immigrant who speaks German is misclassified
as a non-speaker and vice versa.
Assume that the true language skill can be measured continuously (we subsume all
covariates—including ethnic concentrations—under x) and is given by:
𝑦𝑖∗ = 𝑥𝑖
′𝛽 + 𝜀𝑖. (E-1)
An immigrant can be classified as speaking German well or very well if
𝑦𝑖∗ > 0 (E-2)
The true language skill in binary form is
�̃�𝑖 = 1(𝑦𝑖∗ > 0)

60
Both 𝑦𝑖∗and �̃�𝑖 are unobserved. Defining yi as the stated or recorded language skill, the two
misclassification probabilities are
α0 = Pr(𝑦𝑖 = 1|�̃�𝑖 = 0) and α1 = Pr(𝑦𝑖 = 0|�̃�𝑖 = 1)
where α0 is the ethnicity-specific probability of recording a non-speaker as a speaker and α1 is the
ethnicity-specific probability of recording a speaker as a non-speaker, with monotonicity
assumption α0 + α1 < 1. If 𝜀𝑖 is standard normal we can write the expected value of the observed
outcome as
E(𝑦𝑖|𝑥𝑖) = Pr(𝑦𝑖 = 1|𝑥𝑖) = α0 + (1 − α0 − α1)Φ(𝑥𝑖′𝛽) (E-3)
where Φ is the cdf of 𝜀𝑖.
We maximize the following maximum likelihood function where α0 (α1)is the ethnicity-
specific probability of recording a non-speaker (speaker) as a speaker (non-speaker).
ℒ(α0, α1, 𝑏) = 𝑛−1∑{𝑦𝑖 ln(α0 + (1 − α0 − α1)Φ(𝑥𝑖′𝑏))
𝑛
𝑖=1
+ (1 − 𝑦𝑖) ln(1 − α0 − (1 − α0 − α1)Φ(𝑥𝑖′𝑏))}(3)
Unfortunately the likelihood function is not globally concave. In order to find a global maximum
we have maximized the likelihood function using the global optimization routine of simulated
annealing.31 We repeated the optimization several times and always found the same optimum (or
optima in a very close neighborhood to each other).
Note that in the probit version of our model (1) some dummies predict the outcome perfectly
and therefore we lose some observations in column 3 of Table E-1 (however, the OLS coefficient
with this smaller sample remains exactly the same). Accounting for misclassification does not alter
our result, because only a small fraction of observations appear to be misclassified (column 4).
31 This algorithm searches a wide range of the likelihood surface before it narrows down the area over which it moves
to the nearest maximum. See Goffe (1996) and Li and Smith (2010) for an application for duration models.
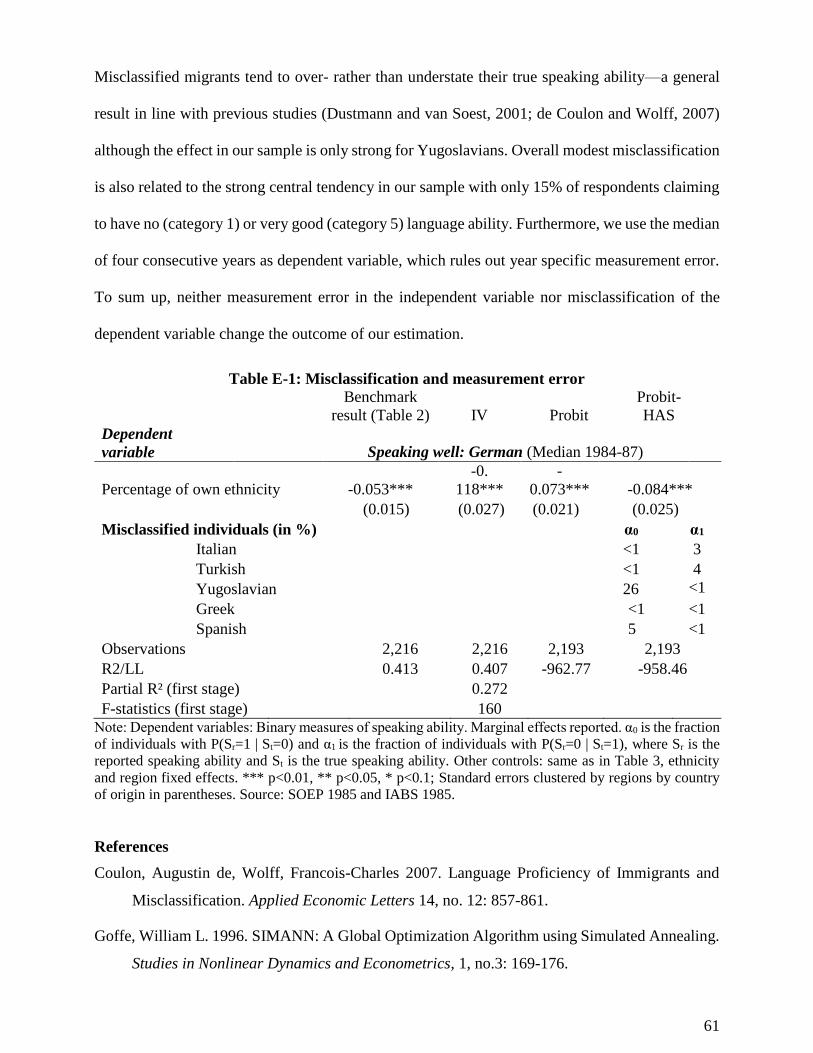
61
Misclassified migrants tend to over- rather than understate their true speaking ability—a general
result in line with previous studies (Dustmann and van Soest, 2001; de Coulon and Wolff, 2007)
although the effect in our sample is only strong for Yugoslavians. Overall modest misclassification
is also related to the strong central tendency in our sample with only 15% of respondents claiming
to have no (category 1) or very good (category 5) language ability. Furthermore, we use the median
of four consecutive years as dependent variable, which rules out year specific measurement error.
To sum up, neither measurement error in the independent variable nor misclassification of the
dependent variable change the outcome of our estimation.
Table E-1: Misclassification and measurement error
Benchmark
result (Table 2) IV Probit
Probit-
HAS
Dependent
variable Speaking well: German (Median 1984-87)
Percentage of own ethnicity -0.053***
-0.
118***
-
0.073*** -0.084***
(0.015) (0.027) (0.021) (0.025)
Misclassified individuals (in %) α0 α1
Italian <1 3
Turkish <1 4
Yugoslavian 26 <1
Greek <1 <1
Spanish 5 <1
Observations 2,216 2,216 2,193 2,193
R2/LL 0.413 0.407 -962.77 -958.46
Partial R² (first stage) 0.272
F-statistics (first stage) 160
Note: Dependent variables: Binary measures of speaking ability. Marginal effects reported. α0 is the fraction
of individuals with P(Sr=1 | St=0) and α1 is the fraction of individuals with P(Sr=0 | St=1), where Sr is the
reported speaking ability and St is the true speaking ability. Other controls: same as in Table 3, ethnicity
and region fixed effects. *** p<0.01, ** p<0.05, * p<0.1; Standard errors clustered by regions by country
of origin in parentheses. Source: SOEP 1985 and IABS 1985.
References
Coulon, Augustin de, Wolff, Francois-Charles 2007. Language Proficiency of Immigrants and
Misclassification. Applied Economic Letters 14, no. 12: 857-861.
Goffe, William L. 1996. SIMANN: A Global Optimization Algorithm using Simulated Annealing.
Studies in Nonlinear Dynamics and Econometrics, 1, no.3: 169-176.

62
Li, Xianghong, Smith, Barry 2010. Diagnostic Analysis and Computational Strategies for
Estimating Discrete Time Duration Models - A Monte Carlo Study. Mimeo.
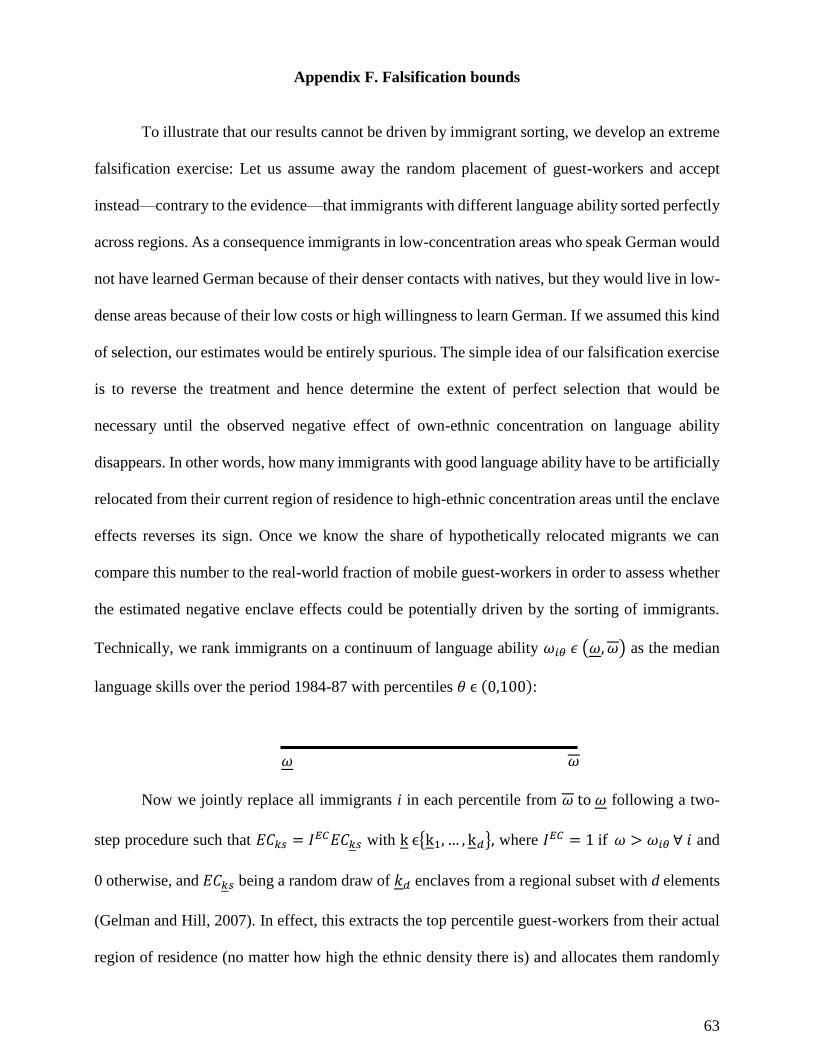
63
Appendix F. Falsification bounds
To illustrate that our results cannot be driven by immigrant sorting, we develop an extreme
falsification exercise: Let us assume away the random placement of guest-workers and accept
instead—contrary to the evidence—that immigrants with different language ability sorted perfectly
across regions. As a consequence immigrants in low-concentration areas who speak German would
not have learned German because of their denser contacts with natives, but they would live in low-
dense areas because of their low costs or high willingness to learn German. If we assumed this kind
of selection, our estimates would be entirely spurious. The simple idea of our falsification exercise
is to reverse the treatment and hence determine the extent of perfect selection that would be
necessary until the observed negative effect of own-ethnic concentration on language ability
disappears. In other words, how many immigrants with good language ability have to be artificially
relocated from their current region of residence to high-ethnic concentration areas until the enclave
effects reverses its sign. Once we know the share of hypothetically relocated migrants we can
compare this number to the real-world fraction of mobile guest-workers in order to assess whether
the estimated negative enclave effects could be potentially driven by the sorting of immigrants.
Technically, we rank immigrants on a continuum of language ability 𝜔𝑖𝜃𝜖(𝜔,𝜔) as the median
language skills over the period 1984-87 with percentiles 𝜃ϵ(0,100):
𝜔 𝜔
Now we jointly replace all immigrants i in each percentile from 𝜔to𝜔 following a two-
step procedure such that 𝐸𝐶𝑘𝑠 = 𝐼𝐸𝐶𝐸𝐶𝑘𝑠 with kϵ{k1, … , k𝑑}, where 𝐼𝐸𝐶 = 1if𝜔 > 𝜔𝑖𝜃∀𝑖 and
0 otherwise, and 𝐸𝐶𝑘𝑠 being a random draw of 𝑘𝑑 enclaves from a regional subset with d elements
(Gelman and Hill, 2007). In effect, this extracts the top percentile guest-workers from their actual
region of residence (no matter how high the ethnic density there is) and allocates them randomly

64
into the d enclaves with the highest own-ethnic concentrations. In the next steps we move down
the ranking and relocate each percentile accordingly, until all guest-workers with the same level of
language ability are relocated to the most concentrated ethnic enclaves. In three different
specifications we use as target enclaves k (to which migrants are implanted) the d = {3, 6, 9} regions
with the highest fraction of guest-workers. Finally, we re-estimate our basic regression (1) on the
artificial new sample. We resample this procedure 1000 times. We wish to obtain one point
estimate 𝛽 for these samples with 𝛽 = 𝑚−1∑ �̂�𝑚𝑀𝑚=1 . The variance estimate contains within and
between variance of the imputations and is defined as
𝑉𝛽 = 𝑚−1∑ 𝑠𝑚2𝑀
𝑚=1 + (1 +𝑚−1)1
𝑚−1∑ (�̂�𝑚 − �̂�)
2𝑀𝑚=1 . (2)
This method creates worst possible outcome bounds with deterministic imputation in random
enclaves (Manski, 1989). Quite differently, relocating guest-workers into random regions (rather
than enclaves) should not significantly alter �̂�.
Table F-1 presents the results from our falsification exercise in which guest-workers with
the best language knowledge were experimentally relocated to those ethnic enclaves which contain
the largest immigrant shares: This test uses an artificial sample modification to investigate whether
post-placement sorting of guest-workers could realistically explain the observed pattern of
language abilities among immigrants. Immigrants have been relocated according to a cut-off of
language ability reported in column 1 of Table 6 implying that we relocate all guest-workers up to
the same level of language ability. Columns 2-4 report regression results after the most fluent
immigrants have been relocated to the 3, 6 or 9 enclaves with the largest immigrant share. Column
5 illustrates that a hypothetical relocation of German speakers to 9 random regions would never
lead to diminishing enclave effects. The percentage of the total sample that has been affected by
replacement is reported in column 6. After relocating the 8% of guest-workers who report to be
fully proficient in German (hence they report the highest level on the scale ranging from one to
five), the treatment effect is almost identical to the one reported in Table 2; however, the treatment

65
effects approach zero as we relocate more and more immigrants. Nevertheless, the enclave effect
remains quite robust for a large fraction of relocated individuals. In fact, it would be necessary to
falsely relocate far more than 35% of all immigrants until the significantly negative enclave effect
disappears. Such a high level of hypothetical mobility among guest-workers contradicts the fact
that inter-regional migration in Germany was very low and that at most 15% of the guest-workers
moved regions in administrative data (Danzer and Yaman, 2013). Given our extreme relocation
assumption our enclave effect would be purely spurious only if all immigrants who score at least
3.5 on the language scale (i.e. between fair and good language knowledge) had left their originally
allocated high-concentration regions in order to settle in areas with much lower own-ethnic
concentration.32 The sorting explanation also contradicts the factual mobility pattern of guest-
workers according to our strict definition of not having moved flat/house since immigration: We
find that immigrants with better language skills (3.5 on the language scale and above) were exactly
as mobile as immigrants with poorer language skills (everybody up to 3.5). In both subgroups,
almost exactly 16% of guest-workers stayed in their initial housing. Hence, we conclude that our
estimated enclave effects are robust to the possibility of sorting.
32 Also note, that Fig. B-4 objects the falsification assumption that the mobility of migrants was one-directional only
(i.e. out of ethnic enclaves).

66
Table F-1: Falsification exercise:
Treatment effects after replacing immigrants with the highest German fluency
(1) (2) (3) (4) (5) (6)
Dependent variable Speaking well: German (Median 84-87)
Number of destination
regions with highest
share of guest-workers
3 6 9 Relocation
to 9 random
regions
Language ability cut-
off for relocation
according to scale
ranging from 1
(lowest) to 5 (highest)
Treatment effect
(coefficient on percentage of own ethnicity in region)
Percentage
of sample
relocated
5 -0.054 -0.054 -0.054 -0.053 8%
(0.015)*** (0.015)*** (0.015)*** (0.012)***
{0.014}*** {0.021}*** {0.007}*** {0.016}***
[0.399] [0.399] [0.399] [0.401]
4.5 -0.038 -0.040 -0.042 -0.074 11%
(0.013)*** (0.013)*** (0.013)*** (0.012)***
{0.012}*** {0.012}*** {0.017}** {0.014}***
[0.398] [0.398] [0.398] [0.410]
4 -0.028 -0.035 -0.037 -0.093 35%
(0.013)** (0.012)*** (0.013)*** (0.013)***
{0.013}** {0.013}*** {0.012}*** {0.014}***
[0.397] [0.397] [0.397] [0.420]
3.5 -0.004 -0.028 -0.017 -0.054 45%
(0.012) (0.012)** (0.011) (0.015)***
{0.009} {0.013}** {0.010} {0.010}***
[0.395] [0.397] [0.396] [0.401]
3 0.012 -0.015 -0.010 -0.070 74%
(0.013) (0.013) (0.012) (0.012)***
{0.015} {0.017} {0.012} {0.012}***
[0.395] [0.396] [0.399] [0.410]
Observations 2,216 2,216 2,216 2,216 Note: Dependent variable: Binary variable of speaking ability, generated from the median of the speaking
ability variable for the years 1984-7 (Speaking very good or good = 1, speaking fair, poor or not at all = 0).
Standard errors clustered by regions by country of origin in parentheses. Bootstrapped standard errors (1000
reps) in curly brackets. Goodness-of-fit values (R-squared) in brackets. *** p<0.01, ** p<0.05, * p<0.1.
Source: SOEP 1984-7 and IAB 1985; authors’ calculations.
References
Gelman, Andrew, Hill, Jennifer 2007. Data Analysis Using Regression and Multilevel/Hierarchical
Models. Cambridge: Cambridge University Press.
Manski, Charles F. 1989. Anatomy of the selection problem. Journal of Human Resources, 24, no.
3: 343-360.
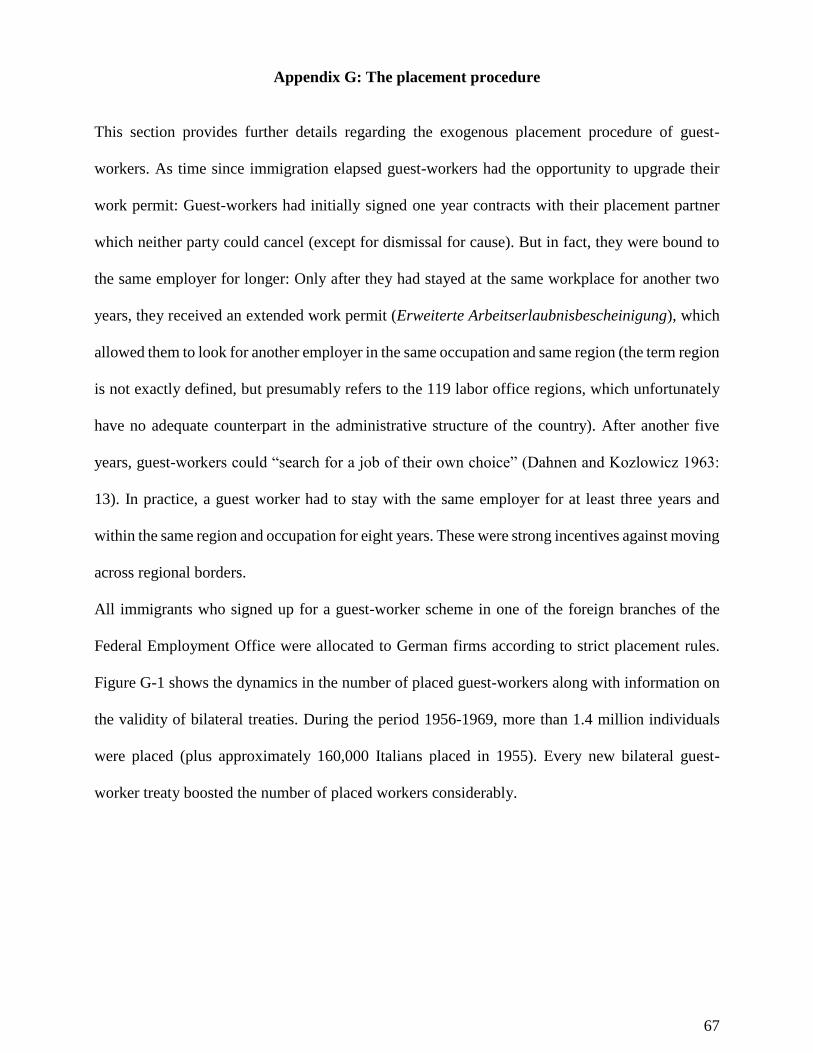
67
Appendix G: The placement procedure
This section provides further details regarding the exogenous placement procedure of guest-
workers. As time since immigration elapsed guest-workers had the opportunity to upgrade their
work permit: Guest-workers had initially signed one year contracts with their placement partner
which neither party could cancel (except for dismissal for cause). But in fact, they were bound to
the same employer for longer: Only after they had stayed at the same workplace for another two
years, they received an extended work permit (Erweiterte Arbeitserlaubnisbescheinigung), which
allowed them to look for another employer in the same occupation and same region (the term region
is not exactly defined, but presumably refers to the 119 labor office regions, which unfortunately
have no adequate counterpart in the administrative structure of the country). After another five
years, guest-workers could “search for a job of their own choice” (Dahnen and Kozlowicz 1963:
13). In practice, a guest worker had to stay with the same employer for at least three years and
within the same region and occupation for eight years. These were strong incentives against moving
across regional borders.
All immigrants who signed up for a guest-worker scheme in one of the foreign branches of the
Federal Employment Office were allocated to German firms according to strict placement rules.
Figure G-1 shows the dynamics in the number of placed guest-workers along with information on
the validity of bilateral treaties. During the period 1956-1969, more than 1.4 million individuals
were placed (plus approximately 160,000 Italians placed in 1955). Every new bilateral guest-
worker treaty boosted the number of placed workers considerably.
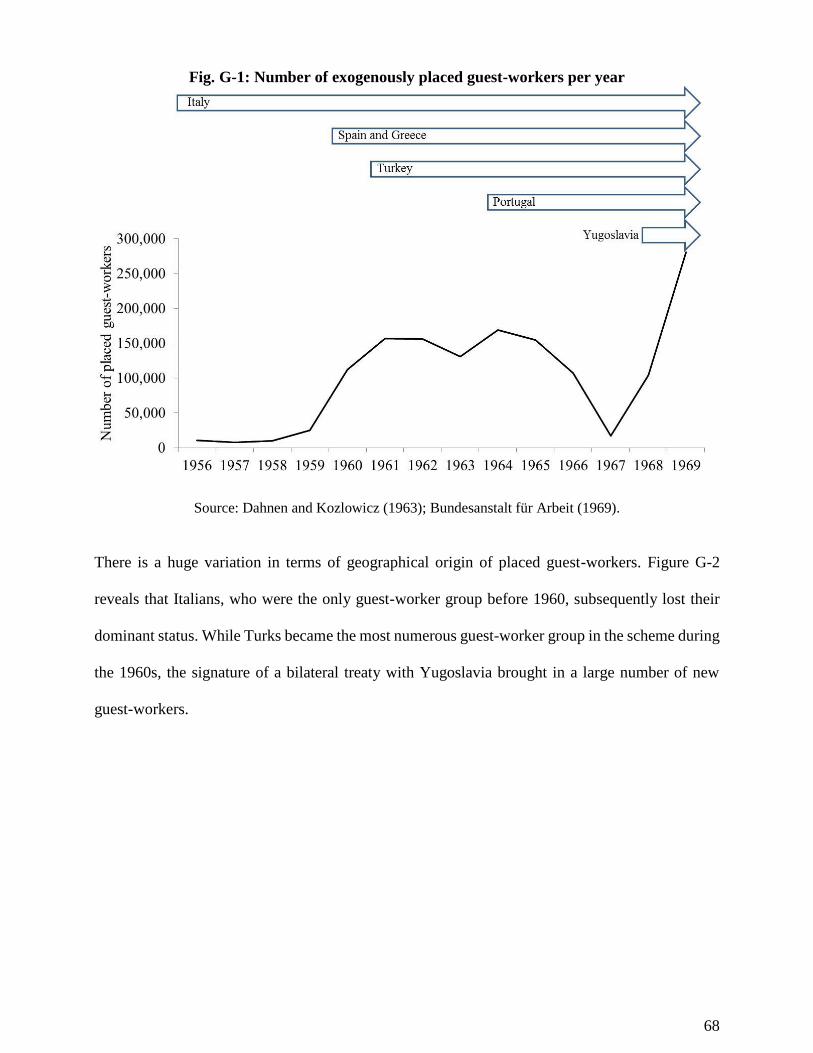
68
Fig. G-1: Number of exogenously placed guest-workers per year
Source: Dahnen and Kozlowicz (1963); Bundesanstalt für Arbeit (1969).
There is a huge variation in terms of geographical origin of placed guest-workers. Figure G-2
reveals that Italians, who were the only guest-worker group before 1960, subsequently lost their
dominant status. While Turks became the most numerous guest-worker group in the scheme during
the 1960s, the signature of a bilateral treaty with Yugoslavia brought in a large number of new
guest-workers.

69
Fig. G-2: Origin countries of guest-workers in different years
Source: Dahnen and Kozlowicz (1963); Bundesanstalt für Arbeit (various years).
Table G-1 reveals that most of the immigrants who entered Germany in 1969 indeed arrived within
the guest-worker placement scheme. Between 80% and 90% of immigrants from guest-worker
countries were paired with their employer by the Federal Labor Office. The notable exception is
Italy due to the European Economic Community which granted citizens greater freedom of
movement. Nevertheless, more than one quarter of immigrants used the placement scheme, not
least due to its implicit “job guarantee”. Still, why were fewer than 100% of guest-workers placed
by the Federal Labor Office (for the countries outside the EEC)? The remaining migrants comprise
different backgrounds:
Delegates of foreign firms or states (this group of people did not require a work permit for
stays of specified, limited duration; Dahnen and Kozlowicz (1963)).
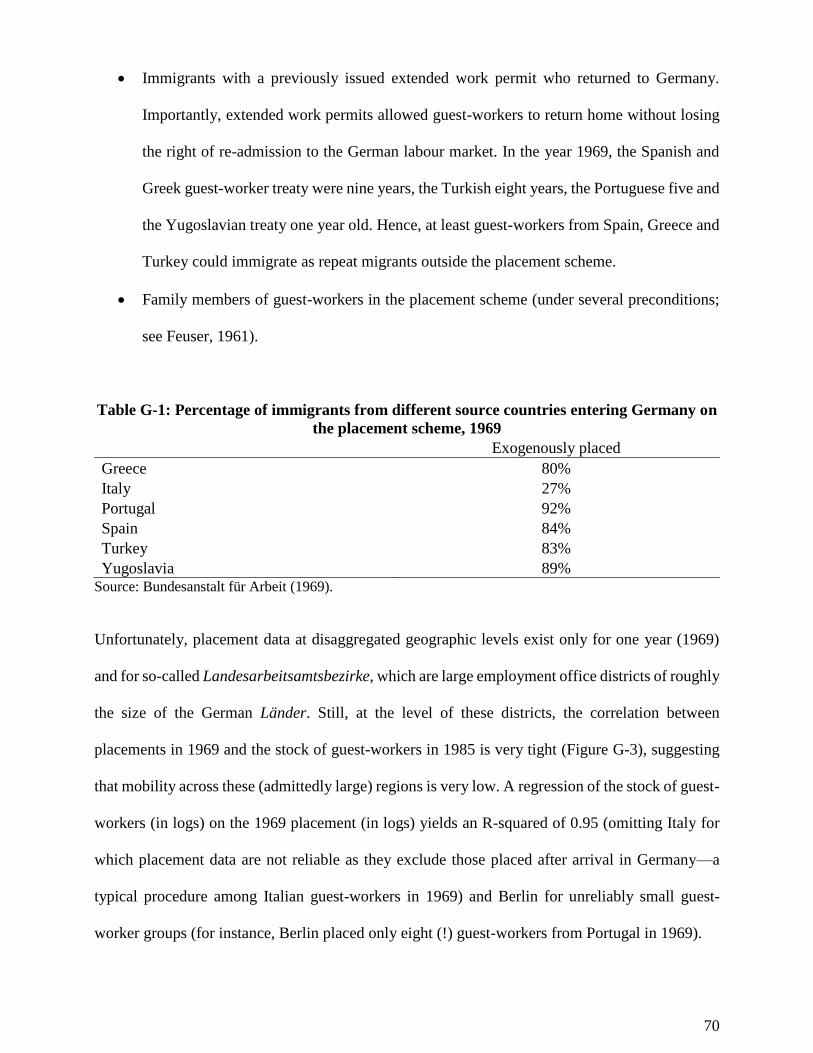
70
Immigrants with a previously issued extended work permit who returned to Germany.
Importantly, extended work permits allowed guest-workers to return home without losing
the right of re-admission to the German labour market. In the year 1969, the Spanish and
Greek guest-worker treaty were nine years, the Turkish eight years, the Portuguese five and
the Yugoslavian treaty one year old. Hence, at least guest-workers from Spain, Greece and
Turkey could immigrate as repeat migrants outside the placement scheme.
Family members of guest-workers in the placement scheme (under several preconditions;
see Feuser, 1961).
Table G-1: Percentage of immigrants from different source countries entering Germany on
the placement scheme, 1969
Exogenously placed
Greece 80%
Italy 27%
Portugal 92%
Spain 84%
Turkey 83%
Yugoslavia 89% Source: Bundesanstalt für Arbeit (1969).
Unfortunately, placement data at disaggregated geographic levels exist only for one year (1969)
and for so-called Landesarbeitsamtsbezirke, which are large employment office districts of roughly
the size of the German Länder. Still, at the level of these districts, the correlation between
placements in 1969 and the stock of guest-workers in 1985 is very tight (Figure G-3), suggesting
that mobility across these (admittedly large) regions is very low. A regression of the stock of guest-
workers (in logs) on the 1969 placement (in logs) yields an R-squared of 0.95 (omitting Italy for
which placement data are not reliable as they exclude those placed after arrival in Germany—a
typical procedure among Italian guest-workers in 1969) and Berlin for unreliably small guest-
worker groups (for instance, Berlin placed only eight (!) guest-workers from Portugal in 1969).
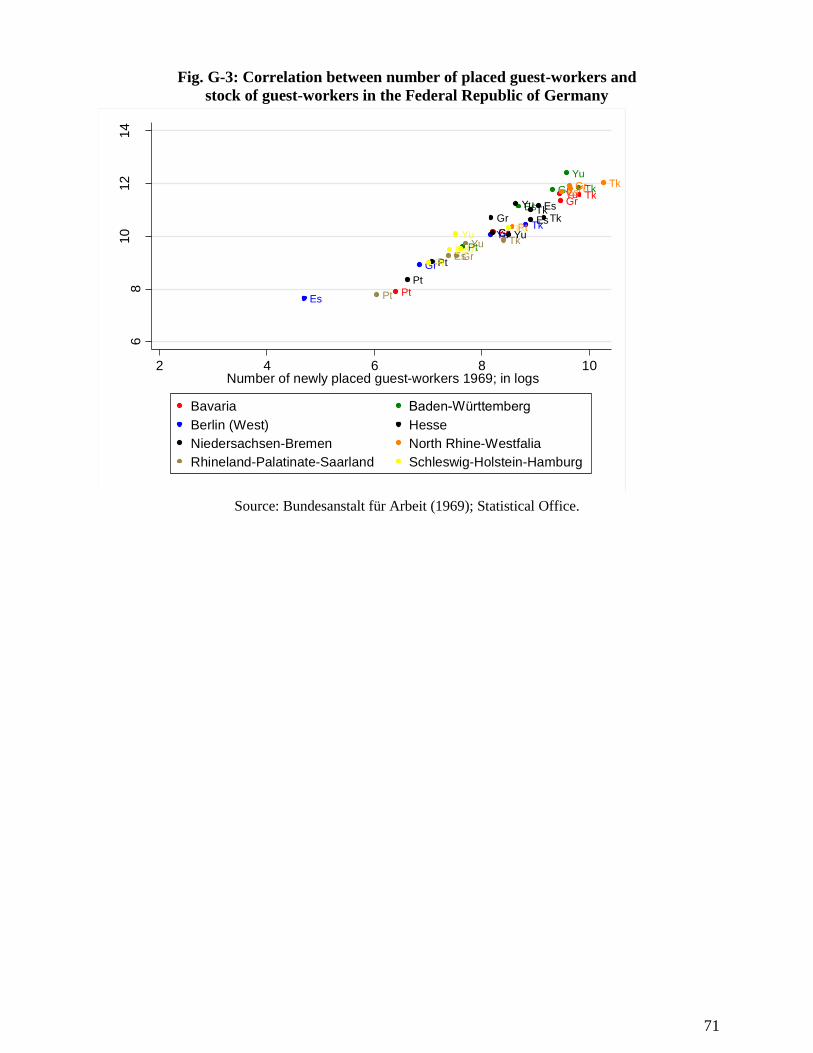
71
Fig. G-3: Correlation between number of placed guest-workers and
stock of guest-workers in the Federal Republic of Germany
Source: Bundesanstalt für Arbeit (1969); Statistical Office.
Gr
Es
Tk
Pt
YuGr
Es
Tk
Pt
Yu
Gr
Es
TkYu
GrEsTk
Pt
Yu
Gr
EsTk
Pt
Yu
GrEs
Tk
Pt
Yu
GrEs
Tk
Pt
YuGrEs
Tk
Pt
Yu
68
10
12
14
Sto
ck o
f gu
est-
wo
rkers
in 1
985
; in
log
s
2 4 6 8 10Number of newly placed guest-workers 1969; in logs
Bavaria Baden-Württemberg
Berlin (West) Hesse
Niedersachsen-Bremen North Rhine-Westfalia
Rhineland-Palatinate-Saarland Schleswig-Holstein-Hamburg