EPSU Equal Pay Survey EPSU-ETUI Equal Pay Seminar 16-18 November 2011.
Page 1 of 19
The University of Manchester
Equal Pay Audit 2019
Page 2 of 19
Equal Pay Audit 2019 Executive Summary
1. Introduction
1.1 Mandatory Gender Pay Gap (GPG) and voluntary Ethnicity Pay Gap (EPG) Reporting
1.2 Distinction between Pay Gap Reporting and Equal Pay Audits
2. The University’s Approach
2.1 Scope
2.2 Methodology
2.3 Data Collection
2.4 Method for Calculating the Pay Gap
3. Findings
3.1 Headline Findings – Gender
3.2 Headline Findings – Ethnicity
3.3 Headline Findings – Disability
3.4 Overall Pay Gaps
4. Summary Findings
4.1 Pay Gaps by Gender
4.2 Pay Gaps by Ethnicity
4.3 Pay Gaps by Disability
5. Conclusion
Page 3 of 19
Executive Summary This is the fourth equal pay review undertaken by the University of Manchester, with previous reports published for 2013, 2015 and 2017. Equal pay reviews compare the of pay of individuals doing work of equal value and set out to establish any pay inequities arising within grades that are associated with gender, ethnicity or disability. The scope of the audit, in line with the previous audits, includes staff up to and including Grade 9 and covers all non-clinical employees of the University of Manchester. Pay gaps for gender, ethnicity and disability were analysed at each grade, providing direct comparison of jobs that have been determined to be of equal value. The audit was conducted in accordance with guidance recommended by both the Equality and Human Rights Commission (EHRC) and the Joint Negotiating Committee for Higher Education Staff (JNCHES). In accordance with JNCHES guidance, this means that where a pay differential is less than 3%, the University would consider no action is necessary. Where the difference is 3% or more, but less than 5%, the position will be regularly monitored and for pay gaps of 5% or more, immediate action would be required to address the issue in order to seek to reduce the gaps. A positive gap means higher pay in favour of men, non-BAME or non-disabled staff, while a negative gap means higher pay in favour of women, BAME or disabled staff (see section 2.4 for further discussion). The 2019 audit revealed that there were no significant pay gaps (i.e. 5% or more) at any grade by gender, ethnicity or disability for staff paid within grades 1 – 8 on the University of Manchester’s pay scale. Among staff paid at Grade 9, four significant pay gaps were identified. The samples sizes for three of these areas were very small (less than or equal to five people in a particular group) so the outcomes should be treated with caution. The area where the sample size was larger and where a significant gap was identified was a positive gap favouring Non-BAME staff among professors in one of the highest pay zones :
Category Grade Headcount Pay Gap
Ethnicity Grade 9 Professorial Zone B 50 Non-BAME 7 BAME ≤5 Unknown 5.3%
The audit also revealed eight instances of pay gaps of between 3.0 and 4.9%. Again, three of these areas had very small sample sizes. The table below contains details of the five instances with larger sample sizes. This shows a differential favouring women in the Grade 9 Professorial entry Zone E and BAME staff in the higher Grade 9 Professorial Zone C; while non-BAME staff have higher pay among those in Grade 6 and in the Professorial entry zone (Zone E) and non-disabled staff among those in Grade 9 Professorial Zone D. In accordance with the JNCHES guidance, the University will monitor these gaps regularly.
Category Grade Headcount Pay Gap
Gender Grade 9 Professorial Zone E 102 Men 62 Women 0 Unknown -3.7%
Ethnicity Grade 6 2090 Non-BAME 577 BAME 104 Unknown 4.0%
Ethnicity Grade 9 Professorial Zone C 151 Non-BAME 12 BAME 0 Unknown -3.4%
Ethnicity Grade 9 Professorial Zone E 139 Non-BAME 23 BAME ≤5 Unknown 3.4%
Disability Grade 9 Professorial Zone D 335 Disabled 7 Disabled ≤5 Unknown 3.3%
Page 4 of 19
The results indicate that the University continues to provide equal pay for equal work through the implementation and application of the Higher Education Role Analysis (HERA) job evaluation scheme and the associated pay structures as the framework for establishing pay differentials. The University therefore continues to meet its obligations in this area under the provisions of the Equality Act.
1. Introduction This report contains the results of the University of Manchester’s fourth equal pay audit and is based on pay data as at 1 May 2019. The scope of the audit, in line with the previous two audits, includes staff up to and including Grade 9 and covers all non-clinical employees of the University of Manchester. An Equal Pay Audit, and a commitment to address any issues it identifies, fulfils the University’s statutory equality duties under the Equality Act, and underpins the University’s commitment to equality, diversity and inclusion. This commitment is re-stated and reinforced in the new Vision and Strategic Plan, which identifies equality, diversity and inclusion as key priorities for the organisation over the next five years. The plan expresses the University’s ambition to “be committed to equality and diversity, and to equal opportunities for all”, and the benefits that this will bring: “Equality, diversity and inclusion. Our students and staff will be representative of the diversity of talent in our communities. Equality, diversity and inclusion strengthen our University and will be at the heart of our core activities. We will create an inclusive and supportive environment led by effective leaders so that everyone can participate fully and reach their full potential”. This commitment is also underlined in the University’s published equality and diversity objectives in its commitment to, “improve the representation of women and black and minority ethnic (BAME) staff in senior leadership, academic and professional support positions”and to “take action to further understand and improve the experience of disabled staff”. The University promotes and celebrates all achievements and milestones in seeking to promote a diverse and inclusive workforce. The University is a member of the Athena SWAN charter and had its bronze award renewed in 2018. It holds six silver and eight bronze awards at School/Department level. Additionally, the University has retained its Top 50 position in the latest Stonewall Workplace Equality Index, was successful in gaining reaccreditation of the Race Equality Charter Mark and is preparing an application for the Disability Standard. This review has been conducted in accordance with guidance provided by the EHRC and JNCHES (see Section 2.2). The next equal pay review is planned for 2021. The purpose of the equal pay review is to:
Provide a comparison of the pay of individuals doing equal work
Establish any pay inequities associated with gender, ethnicity or disability
Analyse the nature and causes of any inequities
Define action required to address any pay inequities
Enable ongoing monitoring of equal pay for work of equal value.
Page 5 of 19
1.1 Mandatory Gender Pay Gap (GPG) and voluntary Ethnicity Pay Gap (EPG) Reporting The Equality Act 2010 (Specific Duties and Public Authorities) Regulations 2017 came into force on 6 April 2017. The regulations make it mandatory for all organisations with more than 250 employees to report their GPG on an annual basis. In line with all public sector organisations, the data is based on hourly pay rates as at 31 March for and for bonuses paid between 1 April and 31 March each year. All relevant organisations are required to report their:
i. mean gender pay gap ii. median gender pay gap
iii. mean bonus pay gap iv. median bonus pay gap v. proportion of men and women receiving a bonus payment
vi. proportion of men and women on each pay quartile The data includes information relating to all relevant employees, which is defined as anyone employed by the University on the 31 March of each year. This includes casuals, apprentices, overseas workers, clinicians and those personally contracted to do work. There are no statutory guidelines for reporting on EPG given there is no mandatory requirement to do so. Therefore, the data presented in the University’s annual EPG reports is gathered and analysed using the same approach as for the Gender Pay Gap reporting, but with reference to ethnicity rather than gender. We have focussed on a comparison of staff using their self-classification, “White”, “BAME” or “Unknown” (“Unknown” also includes staff who have refused to classify themselves by ethnicity). The University’s Gender and Ethnicity Pay Gap reports are presented to the Human Resources Sub-Committee and are openly accessible via the University’s website. 1.2 Distinction between Pay Gap Reporting and Equal Pay Audits The GPG and the EPG are distinct from equal pay, though that distinction is often confused. ACAS provides the following definitions using the example of the Gender Pay Gap: “Equal pay deals with the pay differences between men and women who carry out the same jobs, similar jobs or work of equal value. It is unlawful to pay people unequally because they are a man or a woman.” “The gender pay gap shows the differences in the average pay between men and women.” The GPG measures differences in pay between men and women across an entire range of pay, which includes jobs of different size and level. Any gap is not a key measure of equal pay for work of equal value, but, more often, a reflection of the lower representation of women at higher grades/levels. In other words, any pay gap will be reduced by progress towards the University’s headline equality and diversity objectives to achieve greater gender balance at higher grades and senior levels where women are currently underrepresented. The scope of the audit, in line with the previous two audits, includes staff up to and including Grade 9 and covers all non-clinical employees of the University of Manchester. The focus of the equal pay audit is to examine whether there are pay differences within grades based on
three categories: gender, ethnicity and disability. The data underpinning The University of Manchester’s
Page 6 of 19
equal pay audit includes basic pay for each relevant employee and excludes any additional payments such
as market supplements and acting-up allowances.
In recognition of the common misunderstandings relating to the differentiation between equal pay auditing
and GPG reporting, and to aid comparison with the outcomes of the previous equal pay audits, the
University of Manchester continues to produce and publish equal pay audits and the mandatory GPG
reports as separate documents.
The University now also publishes an annual Ethnicity Pay Gap (EPG). This is undertaken in line with the
methodology outlined for the mandatory GPG analysis and uses the same base data.
2. The University’s Approach 2.1 Scope The scope of the audit, in line with the previous audits, includes staff up to and including Grade 9 and
covers all non-clinical employees of the University of Manchester. It does not include employees on clinical
grades (e.g. Allied Health Professionals, Academic Clinical Lecturers, GPs and Consultants), those employed
by wholly owned subsidiary companies of the University, the small number of Professors in the highest pay
zone (zone A) and those engaged on a casual basis who were not deemed employees.
2.2 Methodology
The 2019 audit was conducted in accordance with guidance recommended by both the EHRC and JNCHES.
This approach examines the pay difference within grades based on three categories: gender, ethnicity and disability. As the audit seeks to establish whether pay is equal for work of equal value, its focus is to examine pay differences within grades for these categories.
In accordance with JNCHES guidance, this means that where a pay differential is less than 3%, the University would consider no action is necessary. Where the difference is 3% or more, but less than 5%, the position will be regularly monitored and for pay gaps of 5% or more, immediate action would be required to address the issue in order to seek to reduce the gaps. A positive gap means higher pay in favour of men, non-BAME or non-disabled staff, while a negative gap means higher pay in favour of women, BAME or disabled staff. 2.3 Data Collection Data was taken from the University’s HR System, ResourceLink, as at 1 May 2019 covering the pay of all non-clinical employees (Grades 1-9) broken down by gender, ethnicity and disability. This pay data includes only basic pay and excludes any additional payments (e.g. market supplements, acting up allowances etc.), overtime and shift allowance payments.
Page 7 of 19
2.4 Method for Calculating the Pay Gap The percentage pay gap within each grade is determined by calculating the average pay for each group (i.e. women, BAME and disabled members of staff) and dividing it by the average pay for the equivalent men, non-BAME and non-disabled members of staff respectively, as illustrated below: Pay gap for Gender = Average salary for men – Average salary for women Average salary for men +ive = in favour of men Pay gap for Ethnicity = Average salary for non-BAME staff – Average staff for BAME staff Average salary for non-BAME staff +ive = in favour of non-BAME staff Pay gap for Disability = Average salary for non-disabled staff – Average staff for disabled staff Average salary for non-disabled staff +ive = in favour of non-disabled staff
Within some grades, the number of individuals within scope of this review is very small. Account should also be taken of individuals who have not reported their ethnicity or disability status. These are categorised as ‘not known’ throughout the report.
3. Findings
The headline findings of the University’s Equal Pay Review 2019 are outlined here for ease of reference. The summary findings data are reported in Section 4. 3.1 Headline Findings – Gender Grades 1-8 (See Section 4.1 Table A) There is no gap greater than 1.3% within grades 1-8. This gap, within Grade 2, has increased from 0.9% in 2017 but is still reassuringly small. The pay gap at Grade 8 has continued to narrow and is now 1.2%, compared with 1.8% in 2017. At Grade 7, the pay gap has also narrowed to 0.8% from 1.2% in 2017. In accordance with JNCHES guidance, no action is therefore required. When the data is disaggregated for academic and PS staff in grades 1-8 the results are, again, very reassuring. The largest reported pay gap, 2.0%, relates to Grade 6 PS staff; this compares with 1.5% in 2017. In relation to academic staff, the largest pay gap is 1.7% at Grade 8. This figure is steadily narrowing (from 2.1% in 2017 and 2.7% in 2015). Further analysis on pay gaps for full-time and part-time academic and PS staff at grades 1-8 was also undertaken. All pay gaps for full-time academic staff are below 3%. The most notable gender discrepancy is among part-time academic staff at Grade 8, where the gap in favour of men has increased to 19.1% from 4.2% in 2017. This change is accompanied by an increase in the numbers of part-time women to 54 from 48 and a decrease in the numbers of part-time men from 25 to 20. Further analysis is required to understand the reason for the notable increase.
Page 8 of 19
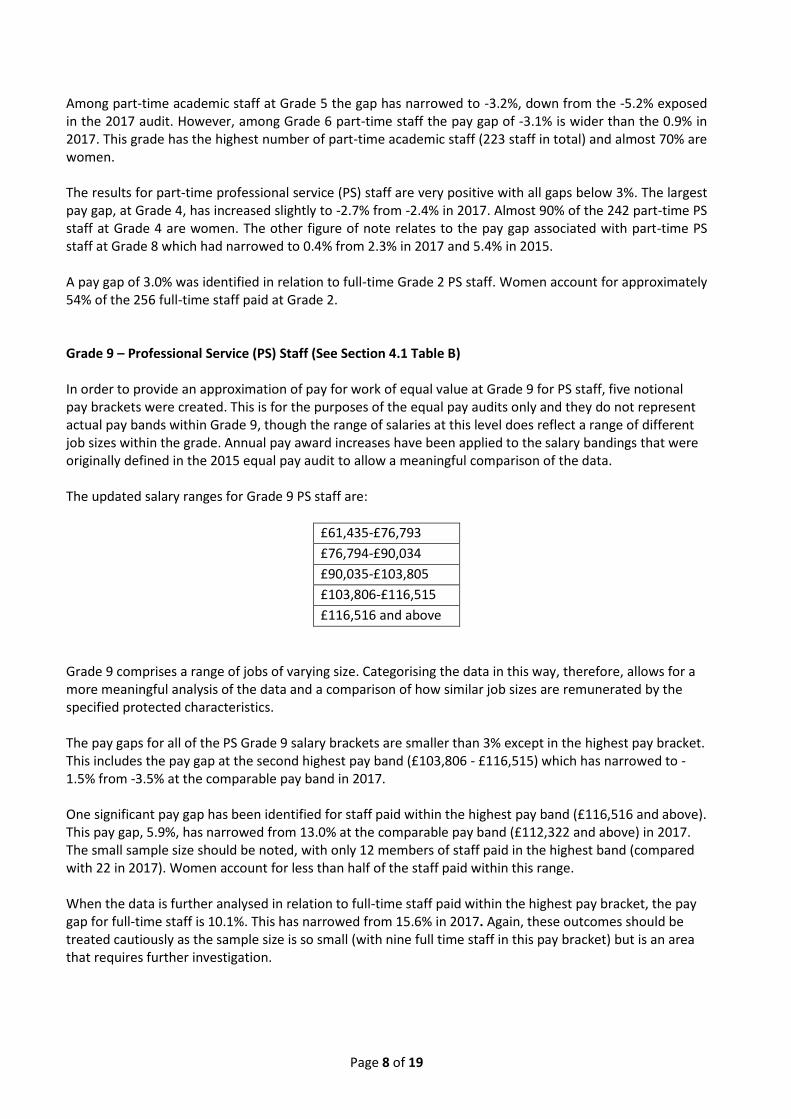
Among part-time academic staff at Grade 5 the gap has narrowed to -3.2%, down from the -5.2% exposed in the 2017 audit. However, among Grade 6 part-time staff the pay gap of -3.1% is wider than the 0.9% in 2017. This grade has the highest number of part-time academic staff (223 staff in total) and almost 70% are women. The results for part-time professional service (PS) staff are very positive with all gaps below 3%. The largest pay gap, at Grade 4, has increased slightly to -2.7% from -2.4% in 2017. Almost 90% of the 242 part-time PS staff at Grade 4 are women. The other figure of note relates to the pay gap associated with part-time PS staff at Grade 8 which had narrowed to 0.4% from 2.3% in 2017 and 5.4% in 2015. A pay gap of 3.0% was identified in relation to full-time Grade 2 PS staff. Women account for approximately 54% of the 256 full-time staff paid at Grade 2. Grade 9 – Professional Service (PS) Staff (See Section 4.1 Table B) In order to provide an approximation of pay for work of equal value at Grade 9 for PS staff, five notional pay brackets were created. This is for the purposes of the equal pay audits only and they do not represent actual pay bands within Grade 9, though the range of salaries at this level does reflect a range of different job sizes within the grade. Annual pay award increases have been applied to the salary bandings that were originally defined in the 2015 equal pay audit to allow a meaningful comparison of the data. The updated salary ranges for Grade 9 PS staff are:
£61,435-£76,793
£76,794-£90,034
£90,035-£103,805
£103,806-£116,515
£116,516 and above
Grade 9 comprises a range of jobs of varying size. Categorising the data in this way, therefore, allows for a more meaningful analysis of the data and a comparison of how similar job sizes are remunerated by the specified protected characteristics. The pay gaps for all of the PS Grade 9 salary brackets are smaller than 3% except in the highest pay bracket. This includes the pay gap at the second highest pay band (£103,806 - £116,515) which has narrowed to -1.5% from -3.5% at the comparable pay band in 2017. One significant pay gap has been identified for staff paid within the highest pay band (£116,516 and above). This pay gap, 5.9%, has narrowed from 13.0% at the comparable pay band (£112,322 and above) in 2017. The small sample size should be noted, with only 12 members of staff paid in the highest band (compared with 22 in 2017). Women account for less than half of the staff paid within this range. When the data is further analysed in relation to full-time staff paid within the highest pay bracket, the pay gap for full-time staff is 10.1%. This has narrowed from 15.6% in 2017. Again, these outcomes should be treated cautiously as the sample size is so small (with nine full time staff in this pay bracket) but is an area that requires further investigation.
Page 9 of 19
Of the 90 Grade 9 PS staff, only 11 work part-time and approximately one third of these staff are women. Sample sizes are therefore very small. A pay gap of 3.9% was identified in relation to the £76,794-£90,034 pay bracket, and this will be monitored accordingly. Grade 9 – Professorial Staff Zones B - E (See Section 4.1 Table C) The data was analysed by Professorial salary zones, B to E. Zone A staff were excluded due to the very small numbers of employees paid within this zone. It is reassuring to see that the pay gaps for each of the zones have narrowed when compared to 2017. Although the pay gap at Zone E continues to be the largest at -3.7%, this has reduced from -5.5% in 2017 and is therefore no longer categorised as a significant gap. This will continue to be monitored. The most notable shift is in relation to Zone B. The pay gap is now 0%, compared with 4.7% in 2017. When the data is further analysed in relation to full-time staff, there are now no pay gaps greater than 3% in relation to full-time staff. Reassuringly, the gap for full-time staff at Zone B has narrowed to -0.9% from 6.2% in 2017. A pay gap of 4.0% has been identified for part-time staff within Zone D. This has increased from -2.3% in 2017. Overall, there are 30 fewer staff within Zone D though numbers of part-time staff have increased slightly to 56 (from 50 in 2017). Women now account for 27.4% of the Grade 9 Professorial staff Zones B – E population. This is a modest increase from 25.2% in 2017. Under-representation of women at this level is a long-standing issue that is being addressed via a number of initiatives, including the University’s Athena Swan Charter and associated School-level action plans. 3.2 Headline Findings - Ethnicity Grade 1-8 (See Section 4.2 Table D) Overall, the pay gap at each grade is very small. However, there has been a slight increase at grade 6 to 4.0% from 3.4% in 2017. In line with JNCHES guidance, this pay gap will be monitored by the University. The number of staff paid within Grades 1-8 has increased by 237 overall and Grade 6 has the largest increase with an additional 113 staff (an additional 58 BAME and 61 white staff). The 2019 audit has 68 fewer staff reporting as “Not Known” overall. This is positive as it means the quality of the data available has improved. Disaggregating the data to look at academic and PS staff separately, a pay gap of 3.2% was identified for Grade 6 academic staff (up from 2.7% in 2017). In relation to PS staff the only gap larger than 3% is in Grade 7. The 3.2% gap has narrowed slightly from 3.3% in 2017. Both of these gaps will be monitored. Breaking down the data further by part-time and full-time status for academic and PS staff separately, there are a number of changes compared with 2017. This applies particularly to part-time academic members of staff. Among part-timers in Grade 6, the gap of 5.5% has increased from 3.6% in 2017. At Grade 8 the pay gap among part-time academic staff has also increased to 5.0% from -3.2%, as has the gap
Page 10 of 19
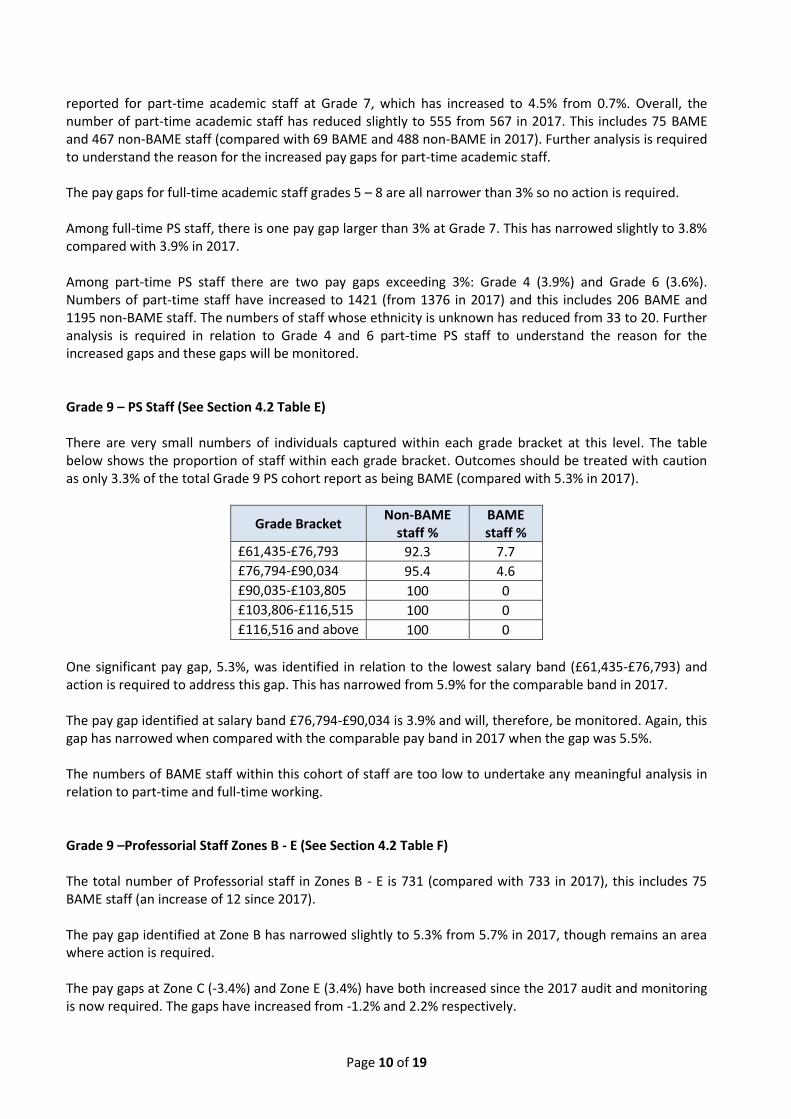
reported for part-time academic staff at Grade 7, which has increased to 4.5% from 0.7%. Overall, the number of part-time academic staff has reduced slightly to 555 from 567 in 2017. This includes 75 BAME and 467 non-BAME staff (compared with 69 BAME and 488 non-BAME in 2017). Further analysis is required to understand the reason for the increased pay gaps for part-time academic staff. The pay gaps for full-time academic staff grades 5 – 8 are all narrower than 3% so no action is required. Among full-time PS staff, there is one pay gap larger than 3% at Grade 7. This has narrowed slightly to 3.8% compared with 3.9% in 2017. Among part-time PS staff there are two pay gaps exceeding 3%: Grade 4 (3.9%) and Grade 6 (3.6%). Numbers of part-time staff have increased to 1421 (from 1376 in 2017) and this includes 206 BAME and 1195 non-BAME staff. The numbers of staff whose ethnicity is unknown has reduced from 33 to 20. Further analysis is required in relation to Grade 4 and 6 part-time PS staff to understand the reason for the increased gaps and these gaps will be monitored. Grade 9 – PS Staff (See Section 4.2 Table E) There are very small numbers of individuals captured within each grade bracket at this level. The table below shows the proportion of staff within each grade bracket. Outcomes should be treated with caution as only 3.3% of the total Grade 9 PS cohort report as being BAME (compared with 5.3% in 2017).
Grade Bracket Non-BAME
staff % BAME staff %
£61,435-£76,793 92.3 7.7
£76,794-£90,034 95.4 4.6
£90,035-£103,805 100 0
£103,806-£116,515 100 0
£116,516 and above 100 0
One significant pay gap, 5.3%, was identified in relation to the lowest salary band (£61,435-£76,793) and action is required to address this gap. This has narrowed from 5.9% for the comparable band in 2017. The pay gap identified at salary band £76,794-£90,034 is 3.9% and will, therefore, be monitored. Again, this gap has narrowed when compared with the comparable pay band in 2017 when the gap was 5.5%. The numbers of BAME staff within this cohort of staff are too low to undertake any meaningful analysis in relation to part-time and full-time working. Grade 9 –Professorial Staff Zones B - E (See Section 4.2 Table F) The total number of Professorial staff in Zones B - E is 731 (compared with 733 in 2017), this includes 75 BAME staff (an increase of 12 since 2017). The pay gap identified at Zone B has narrowed slightly to 5.3% from 5.7% in 2017, though remains an area where action is required. The pay gaps at Zone C (-3.4%) and Zone E (3.4%) have both increased since the 2017 audit and monitoring is now required. The gaps have increased from -1.2% and 2.2% respectively.
Page 11 of 19
When broken down further by part-time and full-time working, sample sizes are of insufficient size on which to base sound conclusions about pay gaps. 3.3 Headline Findings – Disability (See Section 4.3 Table G) Grade 1-8 The analysis in relation to disability for staff at Grades 1-8 is very encouraging with no gap greater than 2%. No action is therefore required. Disabled staff account for 6.4% of the overall Grade 1 – 8 staff population. Numbers of disabled staff have increased to 593 from 514 in 2017. The number of staff where the disability classification is unknown has reduced since 2017 to 66. This equates to 0.7% of staff within grades 1-8, compared with 2.9% in 2017. This means the available data is more comprehensive and reflects positively on efforts across the University to encourage members of staff to ensure their personal details are up-to-date. When the data is disaggregated to look at academic and PS staff separately all pay gaps are, again, narrower than 3% so no action is required. Breaking down the data further to look at part-time and full-time academic and PS staff as separate groups, there is a pay gap among Grade 6 academic part-time staff of 3.3%. This has narrowed from 5.7% in 2017. All other gaps for academic staff, both full and part-time, are narrower than 3%. In relation to full-time PS staff, all pay gaps are narrower than 3%. This includes the gap of -2.2% at Grade 8, which has narrowed from -3.2% in 2017. Two pay gaps of between 3 and 5 % were identified for part-time PS staff at Grade 2 and Grade 8. The gap at Grade 2 has increased to 3.7% from -2.1% in 2017 and at Grade 8 to -4.4% from -0.5%. However, as disabled staff account for only 8.6% of the part-time PS staff cohort, outcomes should be treated with caution. Grade 9 – PS Staff (See Section 4.3 Table H) Disabled staff account for just 4.4% of the Grade 9 PS staff cohort and outcomes should therefore be treated cautiously. A pay gap of 5.3% was identified in relation to the lowest salary band (£61,435 - £76,793). This gap has narrowed slightly from a gap of 5.9% was reported at the comparable band in 2017 but action is still required. In addition, a pay gap of 3.2% is reported at the £90,035 - £103,805 salary band. This has increased from -1.2% for the comparable band in 2017 and will be monitored. The pay gap reported for the £76,794 - £90,034 band has narrowed to 2.3% from -3.3% for the comparable band in 2017. Grade 9 – Professorial Staff Zones B-E (See Section 4.3 Table I) Analysis of the data shows a narrowing of the pay gap at each zone compared with 2017, and each of the gaps is now below 5%. The largest gap relates to Zone B and this has narrowed to 4.5% from 5.3%. This gap will be monitored accordingly.
Page 12 of 19
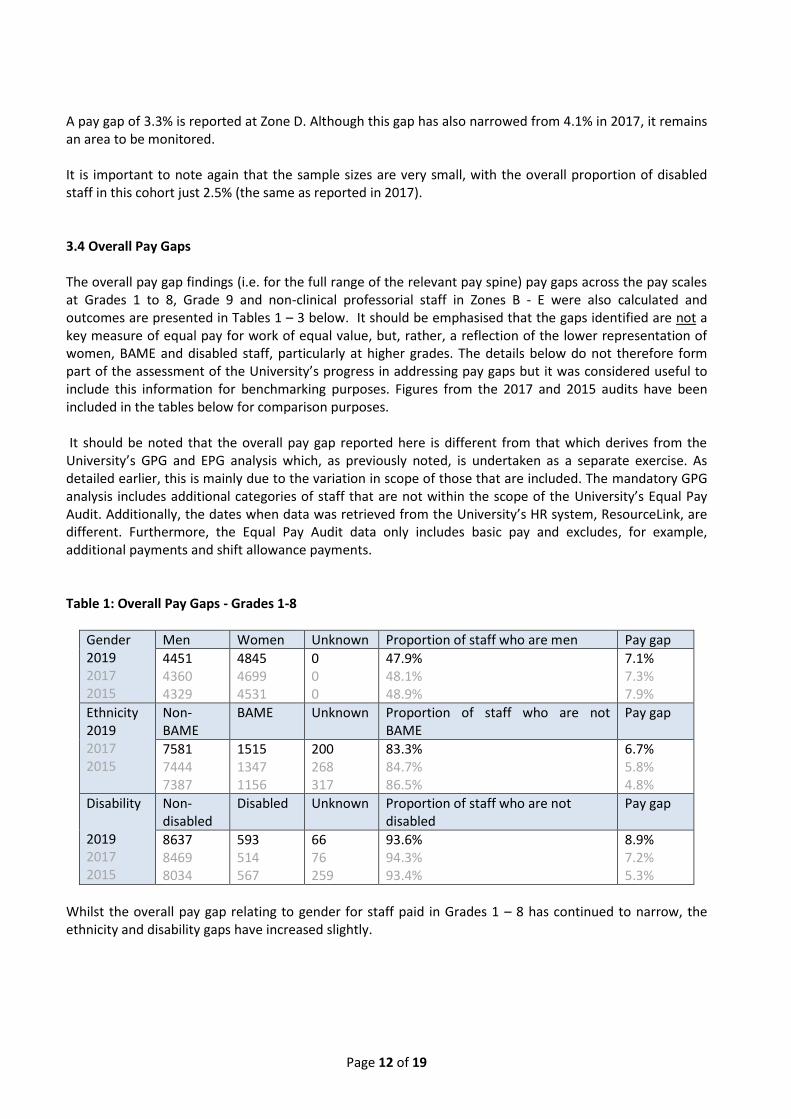
A pay gap of 3.3% is reported at Zone D. Although this gap has also narrowed from 4.1% in 2017, it remains an area to be monitored. It is important to note again that the sample sizes are very small, with the overall proportion of disabled staff in this cohort just 2.5% (the same as reported in 2017). 3.4 Overall Pay Gaps The overall pay gap findings (i.e. for the full range of the relevant pay spine) pay gaps across the pay scales at Grades 1 to 8, Grade 9 and non-clinical professorial staff in Zones B - E were also calculated and outcomes are presented in Tables 1 – 3 below. It should be emphasised that the gaps identified are not a key measure of equal pay for work of equal value, but, rather, a reflection of the lower representation of women, BAME and disabled staff, particularly at higher grades. The details below do not therefore form part of the assessment of the University’s progress in addressing pay gaps but it was considered useful to include this information for benchmarking purposes. Figures from the 2017 and 2015 audits have been included in the tables below for comparison purposes. It should be noted that the overall pay gap reported here is different from that which derives from the University’s GPG and EPG analysis which, as previously noted, is undertaken as a separate exercise. As detailed earlier, this is mainly due to the variation in scope of those that are included. The mandatory GPG analysis includes additional categories of staff that are not within the scope of the University’s Equal Pay Audit. Additionally, the dates when data was retrieved from the University’s HR system, ResourceLink, are different. Furthermore, the Equal Pay Audit data only includes basic pay and excludes, for example, additional payments and shift allowance payments. Table 1: Overall Pay Gaps - Grades 1-8
Gender 2019 2017 2015
Men Women Unknown Proportion of staff who are men Pay gap
4451 4360 4329
4845 4699 4531
0 0 0
47.9% 48.1% 48.9%
7.1% 7.3% 7.9%
Ethnicity 2019 2017 2015
Non-BAME
BAME Unknown Proportion of staff who are not BAME
Pay gap
7581 7444 7387
1515 1347 1156
200 268 317
83.3% 84.7% 86.5%
6.7% 5.8% 4.8%
Disability 2019 2017 2015
Non-disabled
Disabled Unknown Proportion of staff who are not disabled
Pay gap
8637 8469 8034
593 514 567
66 76 259
93.6% 94.3% 93.4%
8.9% 7.2% 5.3%
Whilst the overall pay gap relating to gender for staff paid in Grades 1 – 8 has continued to narrow, the ethnicity and disability gaps have increased slightly.
Page 13 of 19
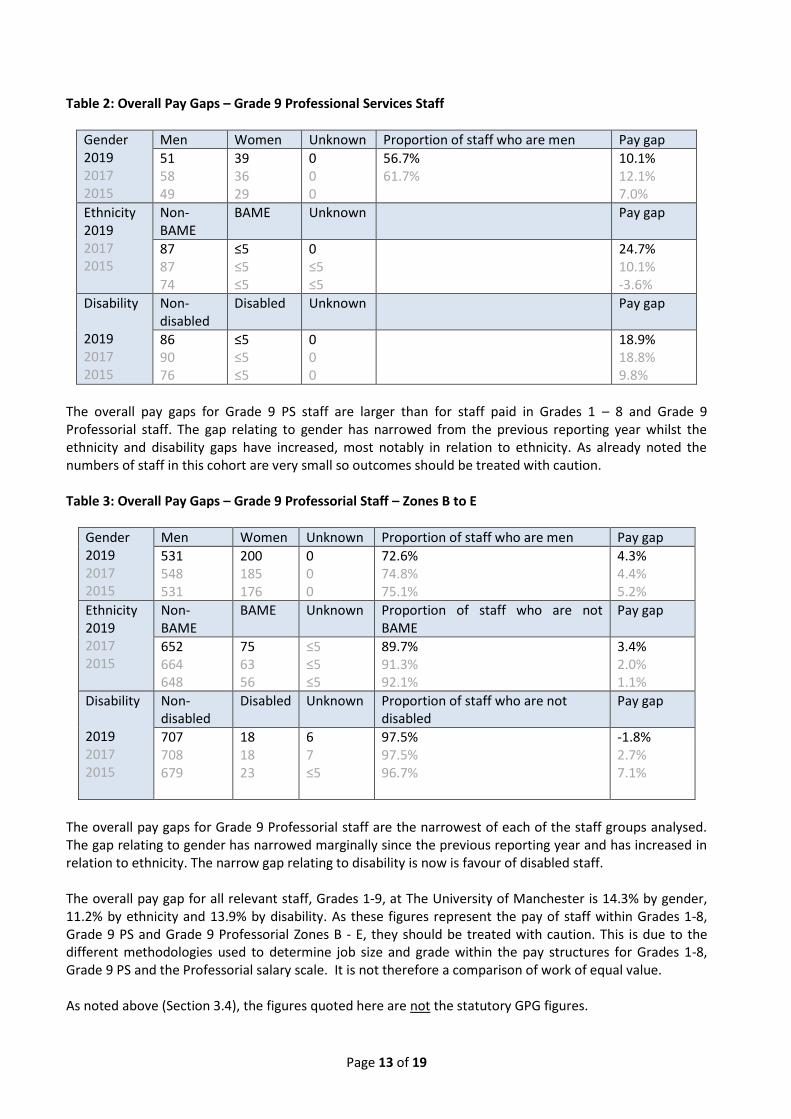
Table 2: Overall Pay Gaps – Grade 9 Professional Services Staff
Gender 2019 2017 2015
Men Women Unknown Proportion of staff who are men Pay gap
51 58 49
39 36 29
0 0 0
56.7% 61.7%
10.1% 12.1% 7.0%
Ethnicity 2019 2017 2015
Non-BAME
BAME Unknown Pay gap
87 87 74
≤5 ≤5 ≤5
0 ≤5 ≤5
24.7% 10.1% -3.6%
Disability 2019 2017 2015
Non-disabled
Disabled Unknown Pay gap
86 90 76
≤5 ≤5 ≤5
0 0 0
18.9% 18.8% 9.8%
The overall pay gaps for Grade 9 PS staff are larger than for staff paid in Grades 1 – 8 and Grade 9 Professorial staff. The gap relating to gender has narrowed from the previous reporting year whilst the ethnicity and disability gaps have increased, most notably in relation to ethnicity. As already noted the numbers of staff in this cohort are very small so outcomes should be treated with caution. Table 3: Overall Pay Gaps – Grade 9 Professorial Staff – Zones B to E
Gender 2019 2017 2015
Men Women Unknown Proportion of staff who are men Pay gap
531 548 531
200 185 176
0 0 0
72.6% 74.8% 75.1%
4.3% 4.4% 5.2%
Ethnicity 2019 2017 2015
Non-BAME
BAME Unknown Proportion of staff who are not BAME
Pay gap
652 664 648
75 63 56
≤5 ≤5 ≤5
89.7% 91.3% 92.1%
3.4% 2.0% 1.1%
Disability 2019 2017 2015
Non-disabled
Disabled Unknown Proportion of staff who are not disabled
Pay gap
707 708 679
18 18 23
6 7 ≤5
97.5% 97.5% 96.7%
-1.8% 2.7% 7.1%
The overall pay gaps for Grade 9 Professorial staff are the narrowest of each of the staff groups analysed. The gap relating to gender has narrowed marginally since the previous reporting year and has increased in relation to ethnicity. The narrow gap relating to disability is now is favour of disabled staff. The overall pay gap for all relevant staff, Grades 1-9, at The University of Manchester is 14.3% by gender, 11.2% by ethnicity and 13.9% by disability. As these figures represent the pay of staff within Grades 1-8, Grade 9 PS and Grade 9 Professorial Zones B - E, they should be treated with caution. This is due to the different methodologies used to determine job size and grade within the pay structures for Grades 1-8, Grade 9 PS and the Professorial salary scale. It is not therefore a comparison of work of equal value. As noted above (Section 3.4), the figures quoted here are not the statutory GPG figures.
Page 14 of 19
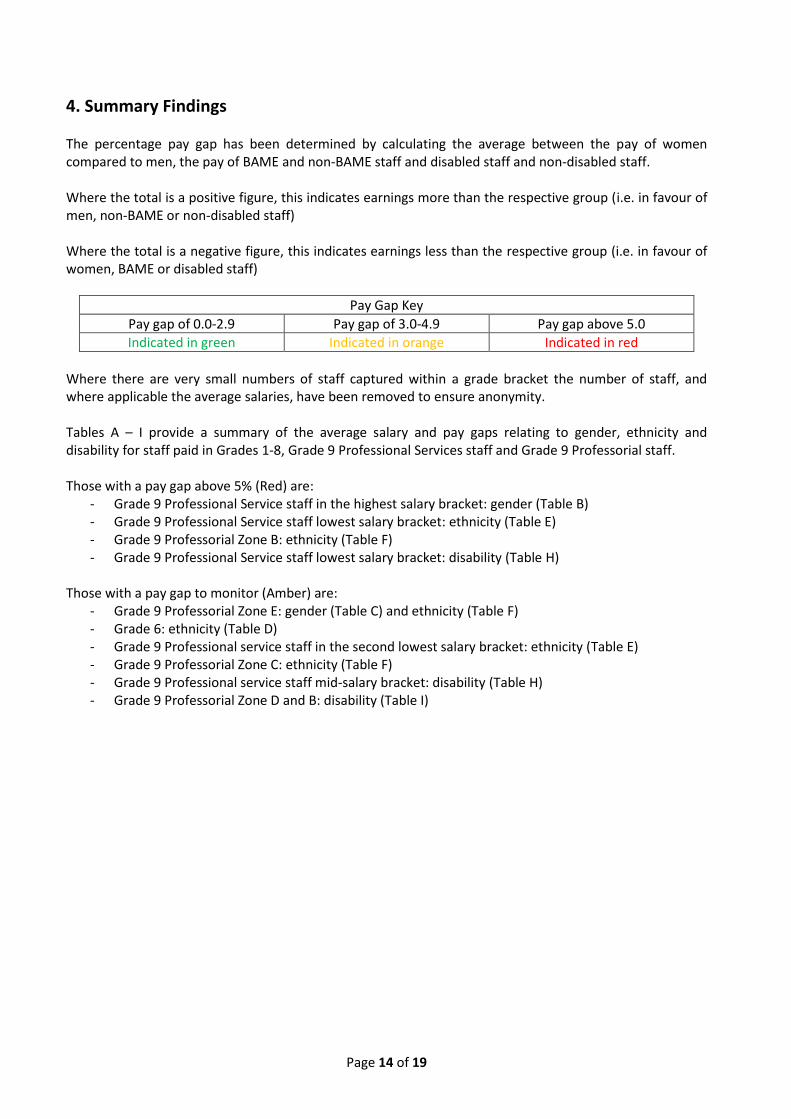
4. Summary Findings The percentage pay gap has been determined by calculating the average between the pay of women compared to men, the pay of BAME and non-BAME staff and disabled staff and non-disabled staff. Where the total is a positive figure, this indicates earnings more than the respective group (i.e. in favour of men, non-BAME or non-disabled staff) Where the total is a negative figure, this indicates earnings less than the respective group (i.e. in favour of women, BAME or disabled staff)
Pay Gap Key
Pay gap of 0.0-2.9 Pay gap of 3.0-4.9 Pay gap above 5.0
Indicated in green Indicated in orange Indicated in red
Where there are very small numbers of staff captured within a grade bracket the number of staff, and where applicable the average salaries, have been removed to ensure anonymity. Tables A – I provide a summary of the average salary and pay gaps relating to gender, ethnicity and disability for staff paid in Grades 1-8, Grade 9 Professional Services staff and Grade 9 Professorial staff. Those with a pay gap above 5% (Red) are:
- Grade 9 Professional Service staff in the highest salary bracket: gender (Table B) - Grade 9 Professional Service staff lowest salary bracket: ethnicity (Table E) - Grade 9 Professorial Zone B: ethnicity (Table F) - Grade 9 Professional Service staff lowest salary bracket: disability (Table H)
Those with a pay gap to monitor (Amber) are:
- Grade 9 Professorial Zone E: gender (Table C) and ethnicity (Table F) - Grade 6: ethnicity (Table D) - Grade 9 Professional service staff in the second lowest salary bracket: ethnicity (Table E) - Grade 9 Professorial Zone C: ethnicity (Table F) - Grade 9 Professional service staff mid-salary bracket: disability (Table H) - Grade 9 Professorial Zone D and B: disability (Table I)
Page 15 of 19
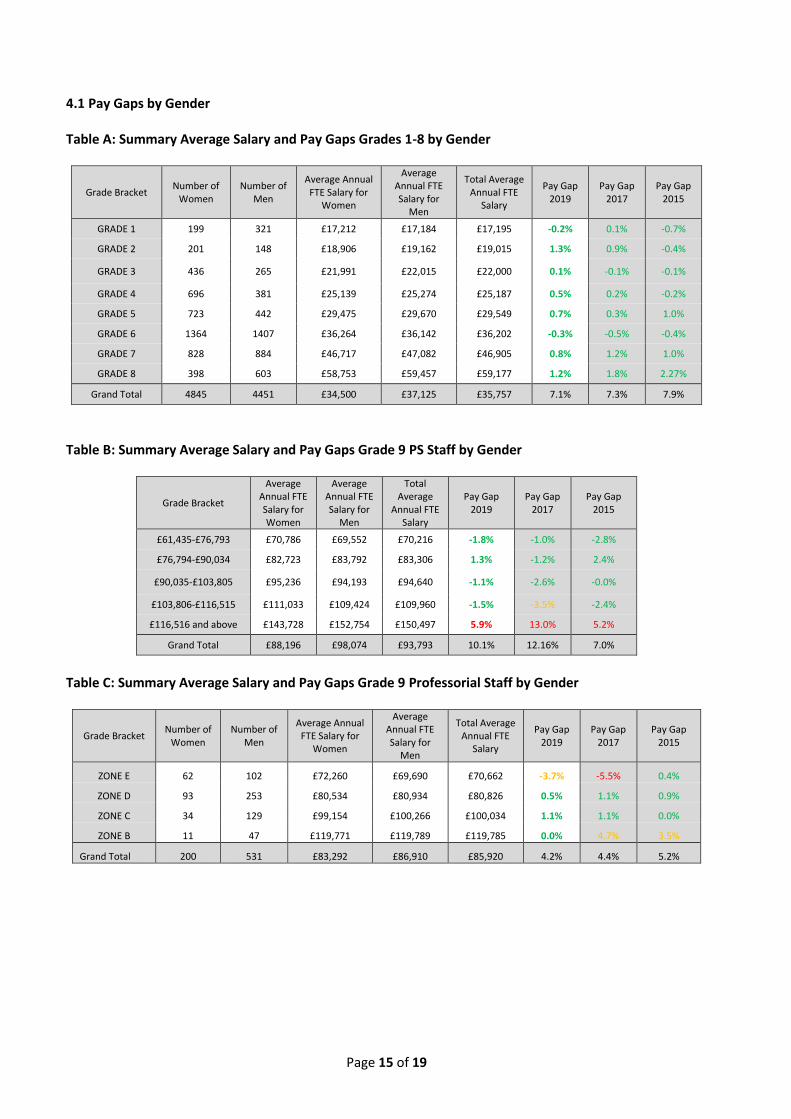
4.1 Pay Gaps by Gender Table A: Summary Average Salary and Pay Gaps Grades 1-8 by Gender
Grade Bracket Number of
Women Number of
Men
Average Annual FTE Salary for
Women
Average Annual FTE Salary for
Men
Total Average Annual FTE
Salary
Pay Gap 2019
Pay Gap 2017
Pay Gap 2015
GRADE 1 199 321 £17,212 £17,184 £17,195 -0.2% 0.1% -0.7%
GRADE 2 201 148 £18,906 £19,162 £19,015 1.3% 0.9% -0.4%
GRADE 3 436 265 £21,991 £22,015 £22,000 0.1% -0.1% -0.1%
GRADE 4 696 381 £25,139 £25,274 £25,187 0.5% 0.2% -0.2%
GRADE 5 723 442 £29,475 £29,670 £29,549 0.7% 0.3% 1.0%
GRADE 6 1364 1407 £36,264 £36,142 £36,202 -0.3% -0.5% -0.4%
GRADE 7 828 884 £46,717 £47,082 £46,905 0.8% 1.2% 1.0%
GRADE 8 398 603 £58,753 £59,457 £59,177 1.2% 1.8% 2.27%
Grand Total 4845 4451 £34,500 £37,125 £35,757 7.1% 7.3% 7.9%
Table B: Summary Average Salary and Pay Gaps Grade 9 PS Staff by Gender
Grade Bracket
Average Annual FTE Salary for Women
Average Annual FTE Salary for
Men
Total Average
Annual FTE Salary
Pay Gap 2019
Pay Gap 2017
Pay Gap 2015
£61,435-£76,793 £70,786 £69,552 £70,216 -1.8% -1.0% -2.8%
£76,794-£90,034 £82,723 £83,792 £83,306 1.3% -1.2% 2.4%
£90,035-£103,805 £95,236 £94,193 £94,640 -1.1% -2.6% -0.0%
£103,806-£116,515 £111,033 £109,424 £109,960 -1.5% -3.5% -2.4%
£116,516 and above £143,728 £152,754 £150,497 5.9% 13.0% 5.2%
Grand Total £88,196 £98,074 £93,793 10.1% 12.16% 7.0%
Table C: Summary Average Salary and Pay Gaps Grade 9 Professorial Staff by Gender
Grade Bracket Number of
Women Number of
Men
Average Annual FTE Salary for
Women
Average Annual FTE Salary for
Men
Total Average Annual FTE
Salary
Pay Gap 2019
Pay Gap 2017
Pay Gap 2015
ZONE E 62 102 £72,260 £69,690 £70,662 -3.7% -5.5% 0.4%
ZONE D 93 253 £80,534 £80,934 £80,826 0.5% 1.1% 0.9%
ZONE C 34 129 £99,154 £100,266 £100,034 1.1% 1.1% 0.0%
ZONE B 11 47 £119,771 £119,789 £119,785 0.0% 4.7% 3.5%
Grand Total 200 531 £83,292 £86,910 £85,920 4.2% 4.4% 5.2%
Page 16 of 19
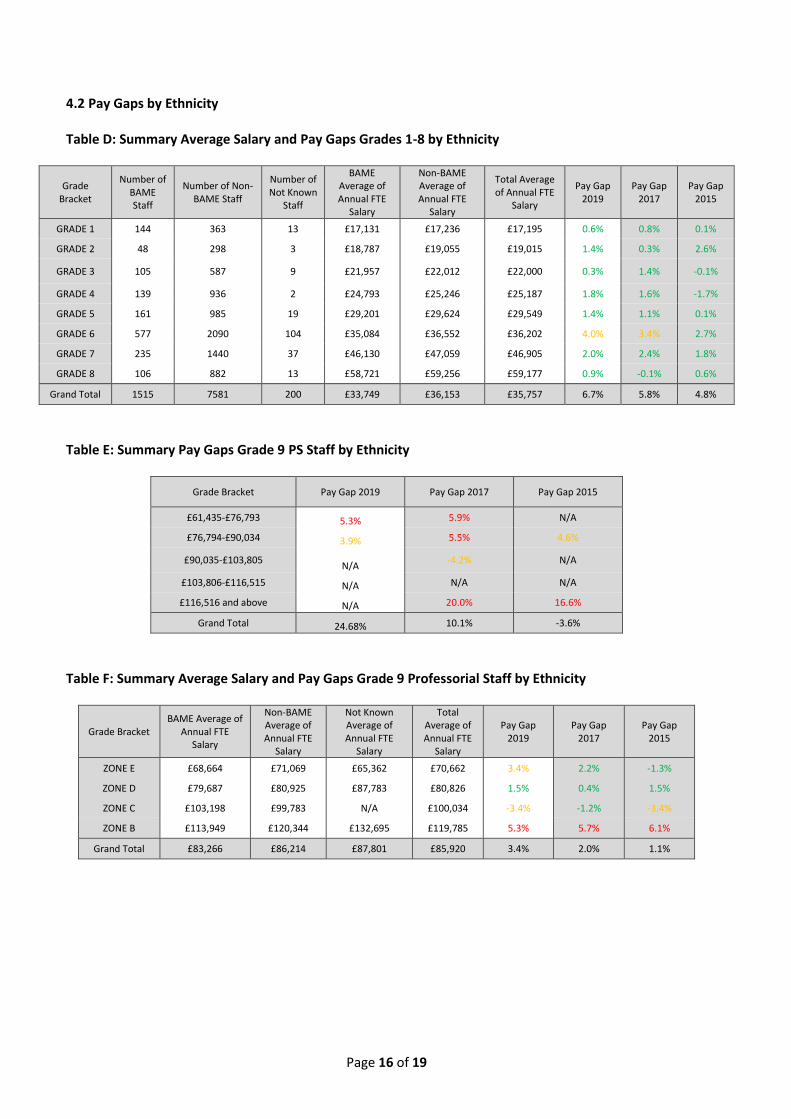
4.2 Pay Gaps by Ethnicity Table D: Summary Average Salary and Pay Gaps Grades 1-8 by Ethnicity
Grade Bracket
Number of BAME Staff
Number of Non-BAME Staff
Number of Not Known
Staff
BAME Average of Annual FTE
Salary
Non-BAME Average of Annual FTE
Salary
Total Average of Annual FTE
Salary
Pay Gap 2019
Pay Gap 2017
Pay Gap 2015
GRADE 1 144 363 13 £17,131 £17,236 £17,195 0.6% 0.8% 0.1%
GRADE 2 48 298 3 £18,787 £19,055 £19,015 1.4% 0.3% 2.6%
GRADE 3 105 587 9 £21,957 £22,012 £22,000 0.3% 1.4% -0.1%
GRADE 4 139 936 2 £24,793 £25,246 £25,187 1.8% 1.6% -1.7%
GRADE 5 161 985 19 £29,201 £29,624 £29,549 1.4% 1.1% 0.1%
GRADE 6 577 2090 104 £35,084 £36,552 £36,202 4.0% 3.4% 2.7%
GRADE 7 235 1440 37 £46,130 £47,059 £46,905 2.0% 2.4% 1.8%
GRADE 8 106 882 13 £58,721 £59,256 £59,177 0.9% -0.1% 0.6%
Grand Total 1515 7581 200 £33,749 £36,153 £35,757 6.7% 5.8% 4.8%
Table E: Summary Pay Gaps Grade 9 PS Staff by Ethnicity
Grade Bracket Pay Gap 2019 Pay Gap 2017 Pay Gap 2015
£61,435-£76,793 5.3% 5.9% N/A
£76,794-£90,034 3.9% 5.5% 4.6%
£90,035-£103,805 N/A
-4.2% N/A
£103,806-£116,515 N/A N/A N/A
£116,516 and above N/A 20.0% 16.6%
Grand Total 24.68% 10.1% -3.6%
Table F: Summary Average Salary and Pay Gaps Grade 9 Professorial Staff by Ethnicity
Grade Bracket BAME Average of
Annual FTE Salary
Non-BAME Average of Annual FTE
Salary
Not Known Average of Annual FTE
Salary
Total Average of Annual FTE
Salary
Pay Gap 2019
Pay Gap 2017
Pay Gap 2015
ZONE E £68,664 £71,069 £65,362 £70,662 3.4% 2.2% -1.3%
ZONE D £79,687 £80,925 £87,783 £80,826 1.5% 0.4% 1.5%
ZONE C £103,198 £99,783 N/A £100,034 -3.4% -1.2% -3.4%
ZONE B £113,949 £120,344 £132,695 £119,785 5.3% 5.7% 6.1%
Grand Total £83,266 £86,214 £87,801 £85,920 3.4% 2.0% 1.1%
Page 17 of 19
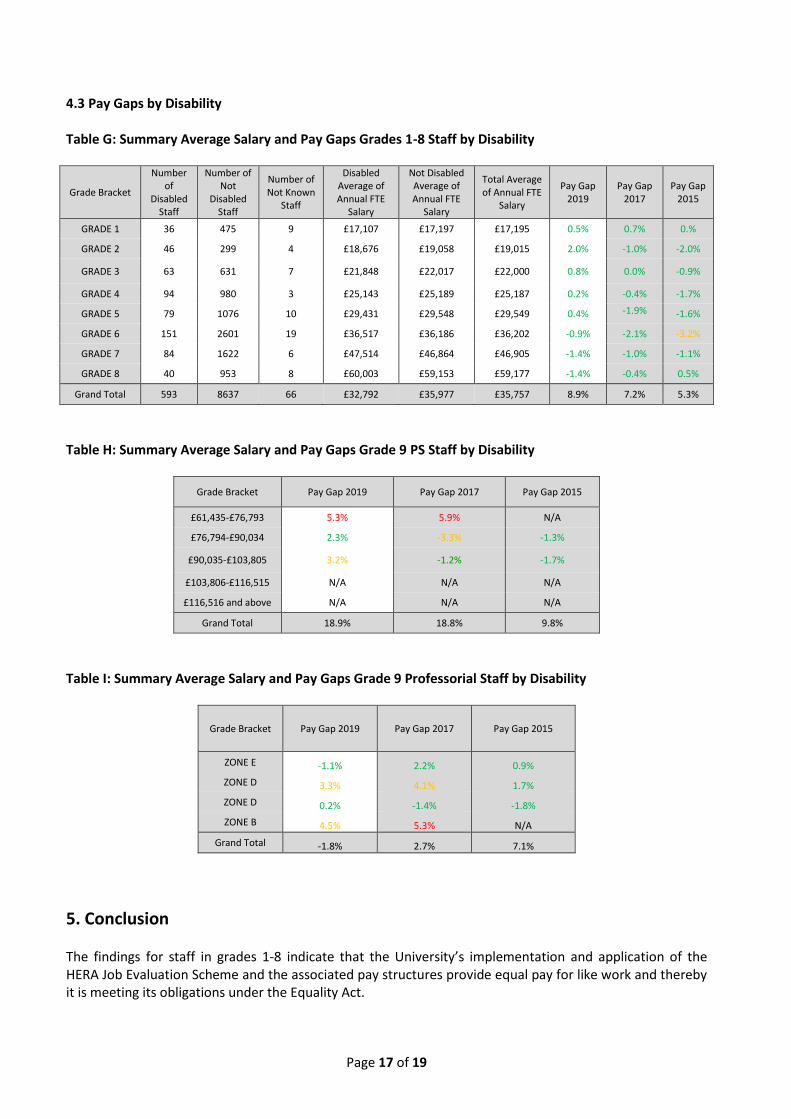
4.3 Pay Gaps by Disability Table G: Summary Average Salary and Pay Gaps Grades 1-8 Staff by Disability
Grade Bracket
Number of
Disabled Staff
Number of Not
Disabled Staff
Number of Not Known
Staff
Disabled Average of Annual FTE
Salary
Not Disabled Average of Annual FTE
Salary
Total Average of Annual FTE
Salary
Pay Gap 2019
Pay Gap 2017
Pay Gap 2015
GRADE 1 36 475 9 £17,107 £17,197 £17,195 0.5% 0.7% 0.%
GRADE 2 46 299 4 £18,676 £19,058 £19,015 2.0% -1.0% -2.0%
GRADE 3 63 631 7 £21,848 £22,017 £22,000 0.8% 0.0% -0.9%
GRADE 4 94 980 3 £25,143 £25,189 £25,187 0.2% -0.4% -1.7%
GRADE 5 79 1076 10 £29,431 £29,548 £29,549 0.4% -1.9% -1.6%
GRADE 6 151 2601 19 £36,517 £36,186 £36,202 -0.9% -2.1% -3.2%
GRADE 7 84 1622 6 £47,514 £46,864 £46,905 -1.4% -1.0% -1.1%
GRADE 8 40 953 8 £60,003 £59,153 £59,177 -1.4% -0.4% 0.5%
Grand Total 593 8637 66 £32,792 £35,977 £35,757 8.9% 7.2% 5.3%
Table H: Summary Average Salary and Pay Gaps Grade 9 PS Staff by Disability
Grade Bracket Pay Gap 2019 Pay Gap 2017 Pay Gap 2015
£61,435-£76,793 5.3% 5.9% N/A
£76,794-£90,034 2.3% -3.3% -1.3%
£90,035-£103,805 3.2% -1.2% -1.7%
£103,806-£116,515 N/A N/A N/A
£116,516 and above N/A N/A N/A
Grand Total 18.9% 18.8% 9.8%
Table I: Summary Average Salary and Pay Gaps Grade 9 Professorial Staff by Disability
Grade Bracket Pay Gap 2019 Pay Gap 2017 Pay Gap 2015
ZONE E -1.1% 2.2% 0.9%
ZONE D 3.3% 4.1% 1.7%
ZONE D 0.2% -1.4% -1.8%
ZONE B 4.5% 5.3% N/A
Grand Total -1.8% 2.7% 7.1%
5. Conclusion
The findings for staff in grades 1-8 indicate that the University’s implementation and application of the HERA Job Evaluation Scheme and the associated pay structures provide equal pay for like work and thereby it is meeting its obligations under the Equality Act.
Page 18 of 19
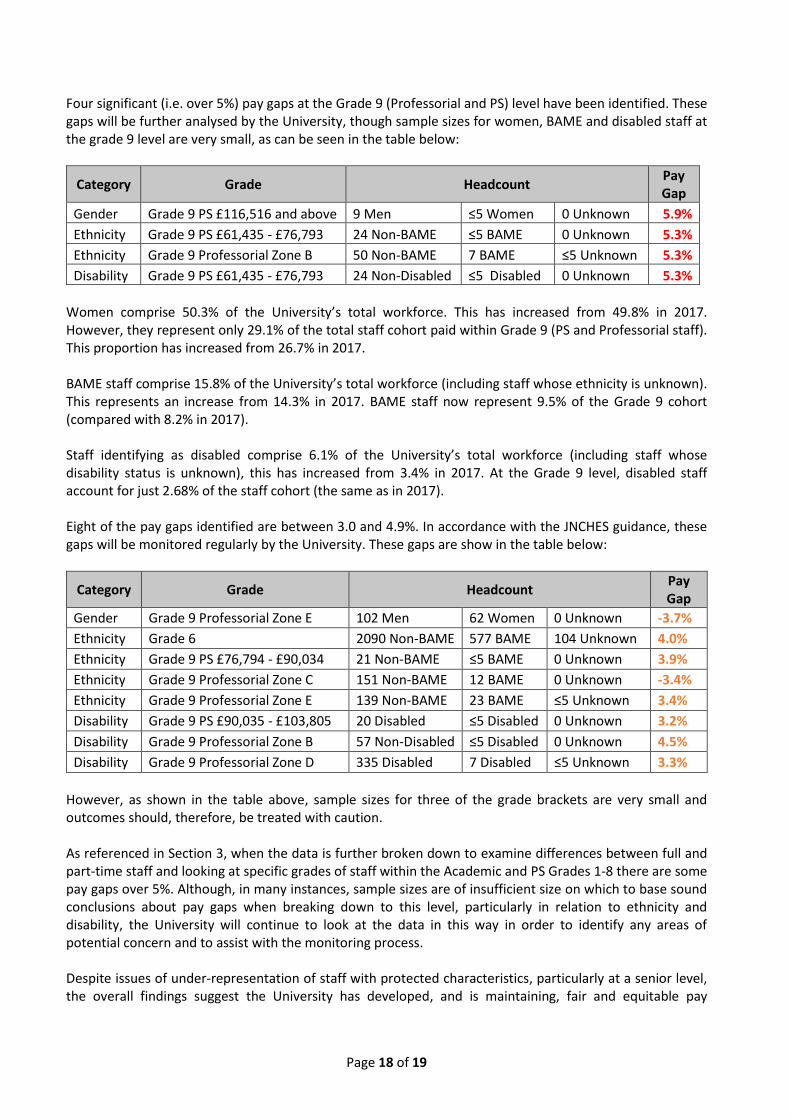
Four significant (i.e. over 5%) pay gaps at the Grade 9 (Professorial and PS) level have been identified. These gaps will be further analysed by the University, though sample sizes for women, BAME and disabled staff at the grade 9 level are very small, as can be seen in the table below:
Category Grade Headcount Pay Gap
Gender Grade 9 PS £116,516 and above 9 Men ≤5 Women 0 Unknown 5.9%
Ethnicity Grade 9 PS £61,435 - £76,793 24 Non-BAME ≤5 BAME 0 Unknown 5.3%
Ethnicity Grade 9 Professorial Zone B 50 Non-BAME 7 BAME ≤5 Unknown 5.3%
Disability Grade 9 PS £61,435 - £76,793 24 Non-Disabled ≤5 Disabled 0 Unknown 5.3%
Women comprise 50.3% of the University’s total workforce. This has increased from 49.8% in 2017. However, they represent only 29.1% of the total staff cohort paid within Grade 9 (PS and Professorial staff). This proportion has increased from 26.7% in 2017. BAME staff comprise 15.8% of the University’s total workforce (including staff whose ethnicity is unknown). This represents an increase from 14.3% in 2017. BAME staff now represent 9.5% of the Grade 9 cohort (compared with 8.2% in 2017). Staff identifying as disabled comprise 6.1% of the University’s total workforce (including staff whose disability status is unknown), this has increased from 3.4% in 2017. At the Grade 9 level, disabled staff account for just 2.68% of the staff cohort (the same as in 2017). Eight of the pay gaps identified are between 3.0 and 4.9%. In accordance with the JNCHES guidance, these gaps will be monitored regularly by the University. These gaps are show in the table below:
Category Grade Headcount Pay Gap
Gender Grade 9 Professorial Zone E 102 Men 62 Women 0 Unknown -3.7%
Ethnicity Grade 6 2090 Non-BAME 577 BAME 104 Unknown 4.0%
Ethnicity Grade 9 PS £76,794 - £90,034 21 Non-BAME ≤5 BAME 0 Unknown 3.9%
Ethnicity Grade 9 Professorial Zone C 151 Non-BAME 12 BAME 0 Unknown -3.4%
Ethnicity Grade 9 Professorial Zone E 139 Non-BAME 23 BAME ≤5 Unknown 3.4%
Disability Grade 9 PS £90,035 - £103,805 20 Disabled ≤5 Disabled 0 Unknown 3.2%
Disability Grade 9 Professorial Zone B 57 Non-Disabled ≤5 Disabled 0 Unknown 4.5%
Disability Grade 9 Professorial Zone D 335 Disabled 7 Disabled ≤5 Unknown 3.3%
However, as shown in the table above, sample sizes for three of the grade brackets are very small and outcomes should, therefore, be treated with caution. As referenced in Section 3, when the data is further broken down to examine differences between full and part-time staff and looking at specific grades of staff within the Academic and PS Grades 1-8 there are some pay gaps over 5%. Although, in many instances, sample sizes are of insufficient size on which to base sound conclusions about pay gaps when breaking down to this level, particularly in relation to ethnicity and disability, the University will continue to look at the data in this way in order to identify any areas of potential concern and to assist with the monitoring process. Despite issues of under-representation of staff with protected characteristics, particularly at a senior level, the overall findings suggest the University has developed, and is maintaining, fair and equitable pay

Page 19 of 19
structures and reward systems and, in so doing, is supporting its equality objectives in a critical and measurable way.


![Equal Pay Statement 2020[2]](https://static.fdocuments.us/doc/165x107/6266fd5334071508b3380bc9/equal-pay-statement-20202.jpg)