Economic Indicators and Quality of Life in Southern New … · Economic Indicators and Quality of...
57
Economic Indicators and Quality of Life in Southern New Jersey Kelly E. Sloane Public Policy Researcher William J. Hughes Center for Public Policy Stockton University PhD. Candidate, Temple University 101 Vera King Farris Drive Galloway, NJ 08205 May 2015
Transcript of Economic Indicators and Quality of Life in Southern New … · Economic Indicators and Quality of...

Economic Indicators and
Quality of Life in
Southern New Jersey
Kelly E. SloanePublic Policy Researcher
William J. Hughes Center for Public PolicyStockton University
PhD. Candidate, Temple University101 Vera King Farris Drive
Galloway, NJ 08205
May 2015

ECONOMIC INDICATORS AND QUALITY OF LIFE 2
Economic Indicators and Quality of Life in Southern New Jersey
Even though economic inequality has been growing in Western nations since the 1970s, the
“Great Recession” of 2008-2010 has inspired frequent and increasingly urgent debates about
income, wages, and wealth in the United States. Recent analyses of economic inequality leave
little doubt that since the Carter administration, there has been an upward shift in the distribution
of resources and concentration of power and wealth (Picketty & Goldhammer 2014; Stiglitz
2012; Noah 2008). When compared with other states, New Jersey is quite affluent and enjoyed
the third highest median household income after Maryland and Alaska in 2013. With a median
household income of $70,000, New Jersey soars above the U.S. average of $52,000. New Jersey
is also home to two counties which currently rank in the top ten for county-level median
household incomes in the United States (Van Riper 2014). And, it is home to several counties
with some of the “worst income mobility” trends for children in the Northeastern U.S. (Aisch,
Buth, Bloch, Cox, & Quealy 2015).
In addition to discourse regarding concentrated wealth and the “ninety-nine percent”,
important post-recession debates about inequality have also brought greater attention to place
and differences between and within states, counties and communities. In the state of New Jersey,
there is a considerable amount of income and wealth inequality within North and Central Jersey
counties with large cities like Newark, Paterson and Jersey City. There is also significant income
inequality between the Northern, Central and Southern New Jersey counties. The William J.
Hughes Center for Public Policy (“Hughes Center”) and the Stockton University Polling Institute
define the Central, North and Southern geographic regions by county in Table 1 and Figure 1
maps the county clusters.
ECONOMIC INDICATORS AND QUALITY OF LIFE 3
Historically, there has been a tendency to treat the uneven distribution of incomes, wages
and wealth between the Northern, Central and Southern New Jersey counties as a natural
outcome associated with labor markets and place. The more affluent counties in the North and
Central regions of the state are attached to the New York metro’s higher-wage, higher-skill
knowledge and financial occupational sectors. Similarly, the Southern counties are linked with
the Philadelphia metro and Southern Jersey shore; South Jersey residents “logically” have lower
incomes because the dominant employment sectors in this region are low-skill, low-wage
agriculture, gaming and tourism.1
There is mounting evidence illustrating that incomes, wages, and wealth are highly
correlated with “quality of life” which includes education access and attainment, safe
neighborhoods, economic mobility, regional development, rates of civic engagement as well as
concentrated affluence, poverty and individual life outcomes. As a recent New York Times web
feature made plain: “Where Income is Higher, Life Spans Are Longer” (Lowrey 2014). When
comparing New Jersey’s twenty-one counties, six of the eight Southern New Jersey counties
rank in the bottom ten for median household income, percentage of households living in poverty,
rates of unemployment, educational attainment levels, and health outcomes. Considering the
relationship between these indicators, life outcomes and prospects for development, these
rankings should give Southern New Jersey policy makers pause.
This exploratory research is concerned with ranking and visualizing differences between
New Jersey counties and understanding why the variables cited are important indicators of
quality of life in Southern New Jersey. The paper is divided into two parts. In the first section,
1 The Philadelphia-metro is formally defined by the Census Bureau as the Philadelphia-Camden-
Wilmington (PA-NJ-DE) metropolitan statistical area and includes the South Jersey counties of Salem,
Gloucester, Camden and Burlington.

ECONOMIC INDICATORS AND QUALITY OF LIFE 4
the key variables noted above are described, ranked and mapped to illustrate county-level
differences throughout the state. Because the Hughes Center mission is, in part, “to serve as a
catalyst for research on public policy and economic issues facing Southern New Jersey”, the
second section offers profiles for the South Jersey counties with more context including county-
level demographics and details about the population, education attainment and household income
trends (Hughes Center for Public Policy, William J. n.d.). We also incorporate the most recent
health outcomes rankings from the Robert Wood Johnson Foundation as well as the New Jersey
Department of Labor occupational sector projections for each of the Southern counties. The
conclusion summarizes this exploratory project’s findings and future Hughes Center
programming and research related to economic inequality.
Table 1
County Clusters
County Region
Bergen North
Essex North
Hudson North
Morris North
Passaic North
Sussex North
Union North
Warren North
Hunterdon Central
Mercer Central
Middlesex Central
Monmouth Central
Somerset Central
Atlantic South
Burlington South
Camden South
Cape May South
Cumberland South
Gloucester South
Ocean South
Salem South

ECONOMIC INDICATORS AND QUALITY OF LIFE 5
Figure 1. New Jersey County Clusters.

ECONOMIC INDICATORS AND QUALITY OF LIFE 6
Economic Indicators and County-Level Data Visualization
Measuring Inequality
There are many ways to measure economic inequality between and within the counties
and regions of the state of New Jersey (Desilva 2013). For example, the New Jersey Department
of Labor and Workforce Development produces reports like the Data for Decision Making Series
(2014) which uses county-level data to make projections about occupational sectors. Another
long-term research project conducted by the Legal Services of New Jersey Poverty Research
Institute (2013) seeks to better understand inequality, cost of living and the economic strain
many New Jersey families endure. There are also projects like Stockton University’s The South
Jersey Economic Review (2014), an electronic publication produced by Dr. Oliver Cooke that
trains a critical lens on labor, development and the region’s economic futures. These research
projects illustrate the importance and utility of data-driven research and analysis.
Some of the most popular (and valuable) public policy research published today begins
with the collection and analysis of data because such projects help researchers and policy makers
recognize patterns and relationships in particular geographies and among specific constituencies.
Fostering insight about social and economic conditions, data collection and analysis can also
confirm suspicions, lessen bias, and provide evidence to support policy initiatives and
recommendations. This exploratory project considers economic variables at the New Jersey
county-level that are regularly used by social scientists to gauge quality of life in particular
places. Looking at key indicators including median household income, unemployment, rates of
poverty and educational attainment at the county-level will help the Hughes Center and others

ECONOMIC INDICATORS AND QUALITY OF LIFE 7
concerned with the future of the Southern counties recognize patterns of inequality that are
detrimental to the welfare, quality of life and future of many South Jersey children and families.2
Economic Indicators
Median Household Income. Median household income includes the income of the
householder(s) and others in a given residence age fifteen years and above. The American
Community Survey explains that this measure: “divides the income distribution into two equal
parts: one-half of the cases falling below the median income and one-half above the median”
(quickfacts.census.gov).3 In New Jersey, the median household income in 2013 was roughly
$70,000 and the range of median household incomes at the county-level was between $105,000
and $49,000. In a pattern that will be repeated as we observe each economic indicator, in Table 2
six of the eight Southern New Jersey counties rank in the bottom ten of the median household
income rankings.
Atlantic, Camden, Cape May, Cumberland, Ocean and Salem counties had median
household incomes ranging between approximately $49,000 and $60,000 in 2013, well below the
state average. Among all the counties, Cumberland County had the lowest median household
income ($48,700) while the Central counties of Hunterdon and Somerset boast some of the
highest county-level median incomes in the United States. Figure 2 illustrates the median
household income distribution. The 2013 median household income for Hunterdon County was
$105,950 and, according to Forbes it was the “sixth richest county” in the United States in 2014
2 Interactive maps can be found at:
https://public.tableau.com/views/EconomicIndicatorsandQualityofLifeinSouthernNewJerseyTableauPubli
c/EconomicIndicatorsandQualityofLifeinSouthernNJ?:embed=y&:showTabs=y&:display_count=yes 3 As the Missouri Census Data Center explains, median household income is “perhaps the most widely
used measure of income in the census.” The preference for a median household measure over the per
capita measure is due to the fact that per capita “does not take into account “economies of scale” involved
when people share a household.” http://mcdc.missouri.edu/allabout/measures_of_income

ECONOMIC INDICATORS AND QUALITY OF LIFE 8
(Van Riper 2014). The “tenth wealthiest county” in 2014 was Somerset where the median
household income was $98,401 in 2013, close to thirty thousand dollars higher than New
Jersey’s average ($70,324) and approaching twice the national average of $52,176 (Van Riper
2014). The two Southern counties that rank in the upper half of the county-level median
household income distribution are Burlington and Gloucester. These counties recorded median
household incomes just above the New Jersey state average ($73,000 and $77,000) according to
the American Community Survey 3 Year Estimates (2011-2013). As noted in the introduction,
social science demonstrates that higher incomes are associated with an array of quality of life
factors ranging from intergenerational wealth and concentrated poverty to educational attainment
and civic engagement.

ECONOMIC INDICATORS AND QUALITY OF LIFE 9
Table 2
Median Household Income
COUNTY REGION RANK MEDIAN
HOUSEHOLD
INCOME
Hunterdon Central 1 $105,950
Somerset Central 2 $ 98,401
Morris North 3 $ 96,438
Sussex North 4 $ 87,342
Monmouth Central 5 $ 82,962
Bergen North 6 $ 82,650
Middlesex Central 7 $ 77,729
Burlington South 8 $ 76,998
Gloucester South 9 $ 73,259
Mercer Central 10 $ 71,471
Warren North 11 $ 67,909
Union North 12 $ 65,872
Ocean South 13 $ 60,156
Camden South 14 $ 59,778
Salem South 15 $ 59,202
Passaic North 16 $ 58,057
Hudson North 17 $ 57,378
Cape May South 18 $ 57,168
Essex North 19 $ 52,762
Atlantic South 20 $ 52,646
Cumberland South 21 $ 48,694
New Jersey $ 70,324
United States $ 52,176
Note: Data from the American Community Survey 3 Year Estimates, 2011-2013.

ECONOMIC INDICATORS AND QUALITY OF LIFE 10
Figure 2. Median household income, New Jersey counties.

ECONOMIC INDICATORS AND QUALITY OF LIFE 11
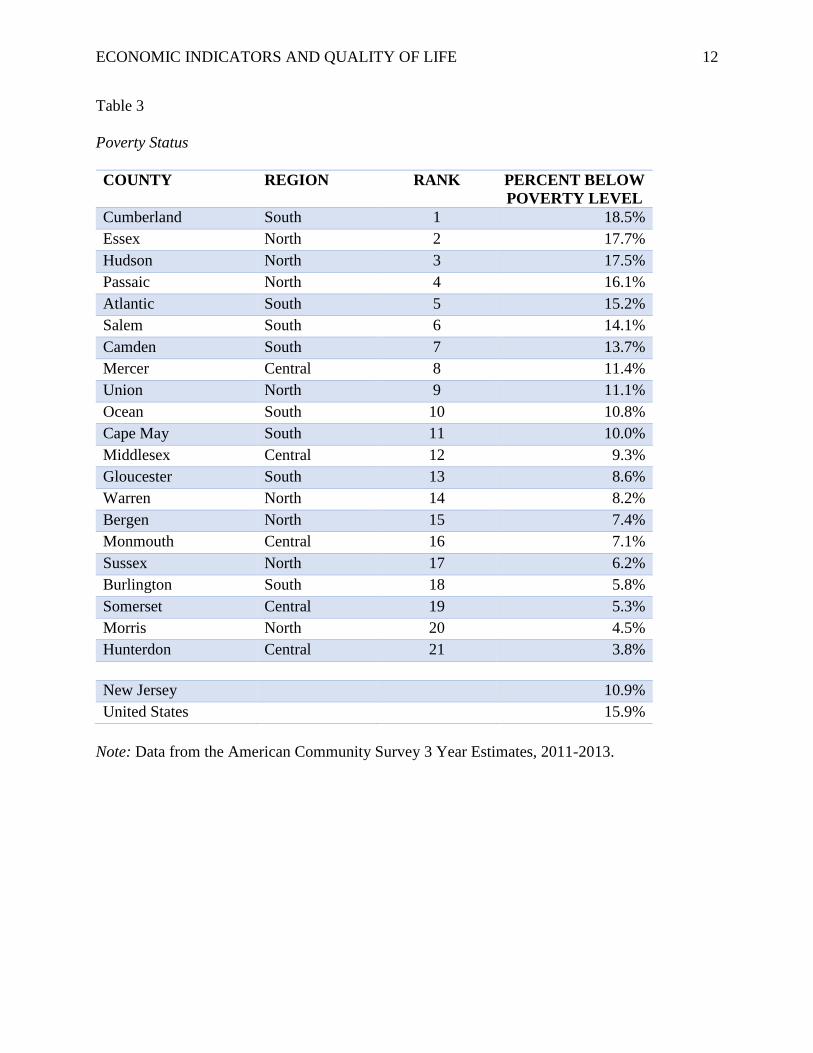
Poverty Status. Another important income measure calculated by the Census Bureau
each year is the federal poverty level. The American Community Survey defines the poverty
threshold as a set dollar value that varies by family composition but not geography or the cost of
living in a particular place. Cost of living adjustments are made annually based on the Consumer
Price Index to create national poverty threshold figures (quickfacts.census.gov). In this report,
poverty refers to households living below the poverty threshold in 2013. The percentage of
households living below the federal poverty threshold in the state of New Jersey was 10.9%
while the United States average was 15.9% in 2013. As Table 3 clarifies, Atlantic, Camden,
Cape May, Cumberland, Ocean, and Salem are ranked among the bottom ten for poverty status
among the twenty-one New Jersey counties. These six Southern counties have some of the
highest rates of poverty in the state of New Jersey including 18.5% in Cumberland County, 15%
in Atlantic County and 14% in both Camden and Salem counties. Gloucester and Burlington
once again prove exceptions to patterns of economic hardship among the Southern counties with
rates of poverty status at 8.6% and 5.8% respectively. As suggested in the median household
income section, low income households face an array of burdens related to lower quality of life
and life outcomes. Figure 3 maps the rate of poverty by county and the South-county profiles
will further illustrate that high concentrations of poverty are related to limited job prospects, low
educational attainment and poor health outcomes.
ECONOMIC INDICATORS AND QUALITY OF LIFE 12
Table 3
Poverty Status
COUNTY REGION RANK PERCENT BELOW
POVERTY LEVEL
Cumberland South 1 18.5%
Essex North 2 17.7%
Hudson North 3 17.5%
Passaic North 4 16.1%
Atlantic South 5 15.2%
Salem South 6 14.1%
Camden South 7 13.7%
Mercer Central 8 11.4%
Union North 9 11.1%
Ocean South 10 10.8%
Cape May South 11 10.0%
Middlesex Central 12 9.3%
Gloucester South 13 8.6%
Warren North 14 8.2%
Bergen North 15 7.4%
Monmouth Central 16 7.1%
Sussex North 17 6.2%
Burlington South 18 5.8%
Somerset Central 19 5.3%
Morris North 20 4.5%
Hunterdon Central 21 3.8%
New Jersey 10.9%
United States 15.9%
Note: Data from the American Community Survey 3 Year Estimates, 2011-2013.

ECONOMIC INDICATORS AND QUALITY OF LIFE 13
Figure 3. Percentage of households below the federal poverty level, New Jersey counties.

ECONOMIC INDICATORS AND QUALITY OF LIFE 14
Asset Limited, Income Constrained, Employed (“ALICE”). Some social scientists and
policy makers believe the federal poverty threshold is not the best measure of household
economic duress. In pursuit of a more meaningful measure, the United Way of Northern New
Jersey project “ALICE” crafted what can be described as a measure of household vulnerability
(Halpin 2012). According to the author, “ALICE is a household with income above the [federal
poverty level] but below a basic survival threshold” [emphasis added] (Halpin 2012, 5). The
ALICE income threshold goes beyond the federal measure by including the cost of basic
necessities like housing, child care, food, transportation, and health care. Halpin argues that the
high cost of living and concentrated affluence in some New Jersey counties conceals the reality
that “the top 20 percent of New Jersey’s population earns almost half of all income earned in the
state; the bottom 20 percent earns only 3 percent” (Halpin 2012, 5).
We know the working poor in the United States are economically vulnerable when
hardship strikes a family; they are also less likely to benefit from intergenerational wealth
transfers and more apt to have children with constrained economic mobility (Aisch, Buth, Bloch,
Cox, & Quealy 2015). Based on the geographic trends we see, it is possible to argue that the low
cost of living, low wages, and concentrated poverty in many of the South counties similarly
masks deep inequalities between North, Central and South New Jersey. All of the Southern New
Jersey counties except Camden are among the top ten in terms of percentage of households
Halpin defines as “asset limited, income constrained, employed” (Halpin 2012). Table 4 features
the complete ALICE rankings and Figure 4 maps the county level distribution of the measure.

ECONOMIC INDICATORS AND QUALITY OF LIFE 15
Table 4
Asset Limited, Income Constrained, Employed (“ALICE”)
COUNTY REGION RANK
(ALICE)
2010 HOUSEHOLDS
LIVING IN
POVERTY
2010
HOUSEHOLDS
LIVING IN
ALICE
Union North 1 10% 18%
Morris North 2 5% 18%
Monmouth Central 3 7% 21%
Middlesex Central 4 7% 21%
Camden South 5 12% 22%
Somerset Central 6 4% 23%
Hunterdon Central 7 4% 23%
Bergen North 8 8% 23%
Warren North 9 8% 24%
Mercer Central 10 11% 24%
Hudson North 11 16% 25%
Gloucester South 12 8% 25%
Burlington South 13 5% 25%
Essex North 14 17% 26%
Atlantic South 15 12% 26%
Sussex North 16 5% 27%
Salem South 17 11% 29%
Passaic North 18 15% 30%
Cumberland South 19 15% 32%
Ocean South 20 9% 33%
Cape May South 21 10% 33%
Note: The ALICE rankings, data and analysis are from Halpin, S. H. (2012). ALICE : Asset
Limited, Income Constrained, Employed: A study of financial hardship in New Jersey. Cedar
Knolls, NJ: United Way of Northern New Jersey.
http://www.unitedwaynnj.org/ourwork/alice_nj.php

ECONOMIC INDICATORS AND QUALITY OF LIFE 16
Figure 4. Percentage of households Asset Limited, Income Constrained, Employed, New Jersey
counties. Data ranking and analysis conducted by Halpin 2012.

ECONOMIC INDICATORS AND QUALITY OF LIFE 17
Unemployment. The unemployment statistics cited in this paper are based on data
collected through the U.S. Department of Labor’s monthly Current Population Survey and
ranked in Table 5. This data is collected from more than one hundred thousand American survey
respondents each month to determine, among other variables, the “extent of unemployment” in
the United States. According to the Bureau of Labor Statistics, an individual is unemployed if
she/he is “jobless, looking for a job, and available for work” (www.bls.gov). The Bureau reports
that Atlantic, Burlington, Camden, Cape May, Cumberland, Gloucester, and Ocean rank among
the counties with the highest rates of unemployment as of January 2015. Notably, the rate of
unemployment for the state of New Jersey was 6.4% while the national average was a little lower
at 5.8% for the same period.
When comparing the county unemployment rates mapped in Figure 5, the percentage
unemployed ranges between 5.3% and 10.9%. Hunterdon has the lowest unemployment rate
(5.3%) followed by Morris (5.7%), Warren (5.8%) and Somerset (5.9%). The Southern counties
of Cape May (9.9%), Cumberland (10.7%), and Atlantic (10.9%) have the highest rates of
unemployment in the state. Salem appears to be an outlier in this category with only 6.7%
unemployment on record in January 2015. It is very possible that like many Americans, a
considerable number of New Jersey residents are no longer calculated as “unemployed” because
they have stopped seeking employment. While unemployment is certainly correlated with rates
of poverty and low incomes, it also shares an increasingly predictive relationship with
educational attainment.

ECONOMIC INDICATORS AND QUALITY OF LIFE 18
Table 5
Unemployment Status
COUNTY REGION RANK PERCENTAGE UNEMPLOYED
Hunterdon Central 1 5.3%
Morris North 2 5.7%
Warren North 3 5.8%
Somerset Central 4 5.9%
Mercer Central 5 6.2%
Bergen North 6 6.5%
Sussex North 7 6.6%
Salem South 8 6.7%
Monmouth Central 9 6.8%
Middlesex Central 10 7.0%
Burlington South 11 7.4%
Union North 12 7.6%
Ocean South 13 7.7%
Gloucester South 14 7.8%
Camden South 15 8.4%
Hudson North 16 8.5%
Passaic North 17 8.8%
Essex North 18 9.0%
Cape May South 19 9.9%
Cumberland South 20 10.7%
Atlantic South 21 10.9%
New Jersey 6.4%
United States 5.8%
Note: County level data source is U.S. Department of Labor. (2014). Labor force data by county,
not seasonally adjusted, October 2013-November 2014. Washington, D.C.: Bureau of Labor
Statistics. http://www.bls.gov/lau/ 7 January 2015. State level data is from U.S. Department of
Labor. (2014). Unemployment rates for states, monthly rankings, seasonally adjusted.
Washington, D.C.: Bureau of Labor Statistics. http://www.bls.gov/web/laus/laumstrk.htm 7
January 2015. U.S. data source is U.S. Department of Labor. (2015). United States Labor force
statistics from the Current Population Survey. Washington, D.C.: Bureau of Labor Statistics.
http://data.bls.gov/timeseries/LNS14000000 7 January 2015.

ECONOMIC INDICATORS AND QUALITY OF LIFE 19
Figure 5. Percentage unemployed, New Jersey counties.

ECONOMIC INDICATORS AND QUALITY OF LIFE 20
Educational Attainment. The American Community Survey captures the highest level
of education completed by American adults. In this paper, educational attainment is reported for
adults age 25 and older unless other populations and/or age groups are referenced in the
narrative. The report emphasizes: (1) the percentage of adults age 25 and older who earned a
high school diploma or higher level of education attainment; (2) the percentage of adults age 25
and older who reported earning a bachelor’s degree or higher level of education attainment; and,
(3) the highest educational attainment levels reported categorically by adults age 25 and older
(https://www.census.gov/hhes/socdemo/education/about/).
High School Diploma and Higher Educational Attainment. The first variable we
consider is the percentage of adults who reported attaining a high school diploma or higher
education. In Table 6, among the New Jersey counties, the percentages range from a high of 95%
in Hunterdon County to a low of 78% in Cumberland County. For the sake of perspective, the
New Jersey state average is 88.3%, slightly higher than the United States average of 86.3%. As
occurs with the other indicators in this paper, Figure 6 illustrates a persistent geographic pattern
as six Southern counties are in the bottom of the rankings for this measure. Of the two remaining
Southern counties, Gloucester ranks 8th with 91.3% and Burlington ranks 6th with 92.1%.

ECONOMIC INDICATORS AND QUALITY OF LIFE 21
Table 6
Percentage High School Graduate or Higher
COUNTY REGION RANK PERCENT HS GRAD
OR HIGHER
Hunterdon Central 1 94.5%
Sussex North 2 93.9%
Somerset Central 3 93.7%
Morris North 4 93.5%
Monmouth Central 5 92.5%
Burlington South 6 92.1%
Bergen North 7 91.5%
Gloucester South 8 91.3%
Warren North 9 89.9%
Ocean South 10 89.8%
Cape May South 11 89.7%
Middlesex Central 12 88.6%
Mercer Central 13 87.6%
Camden South 14 87.5%
Salem South 15 86.2%
Union North 16 85.7%
Essex North 17 83.7%
Atlantic South 18 83.6%
Hudson North 19 82.5%
Passaic North 20 82.0%
Cumberland South 21 77.7%
United States 86.3%
New Jersey 88.3%
Note: U.S. Census Bureau. (2013). Educational attainment (S1501), 2011-2013 American
Community Survey, 3-Year Survey [Data File]. Retrieved from http://factfinder.census.gov.
Percent high school graduate or higher (includes equivalency) for the population 25 years and
over.

ECONOMIC INDICATORS AND QUALITY OF LIFE 22
Figure 6. Percentage high school graduate and higher, New Jersey counties.

ECONOMIC INDICATORS AND QUALITY OF LIFE 23
Bachelor’s Degree or Higher Educational Attainment. While the percentage of adults
age twenty-five and older who reported earning a bachelor’s degree or higher in the United
States was 29% in 2013, in New Jersey, the state average is even higher at 36%. When looking at
county-level data, there are considerable differences for this measure between North, South and
Central Jersey. While the disparities between New Jersey counties for high school graduate and
higher attainment is relatively small, see Table 7 as the range for the percentage of residents
reporting they’d earned a bachelor’s degree or higher in 2013 included a low of 15% and a high
of 51% at the county-level. As we have seen with the other economic indicators, most of the
Southern New Jersey counties have poor rankings for this measure.
Seven of eight South Jersey counties – Atlantic, Camden, Cape May, Cumberland,
Gloucester, Ocean and Salem counties – are ranked in the bottom ten for bachelor degree “plus”
attainment when compared with the other New Jersey counties. The percentage of Southern
county residents reporting a bachelor’s degree or higher range from a low of 14.7% in
Cumberland County to a high of 35% in Burlington County. Conversely, Figure 7 highlights the
geographic pattern of the Northern and Central counties of Somerset (51.4%), Morris (49.9%),
Hunterdon (47.6%) and Bergen (46.7%) boasting education attainment levels well above New
Jersey and United States averages.
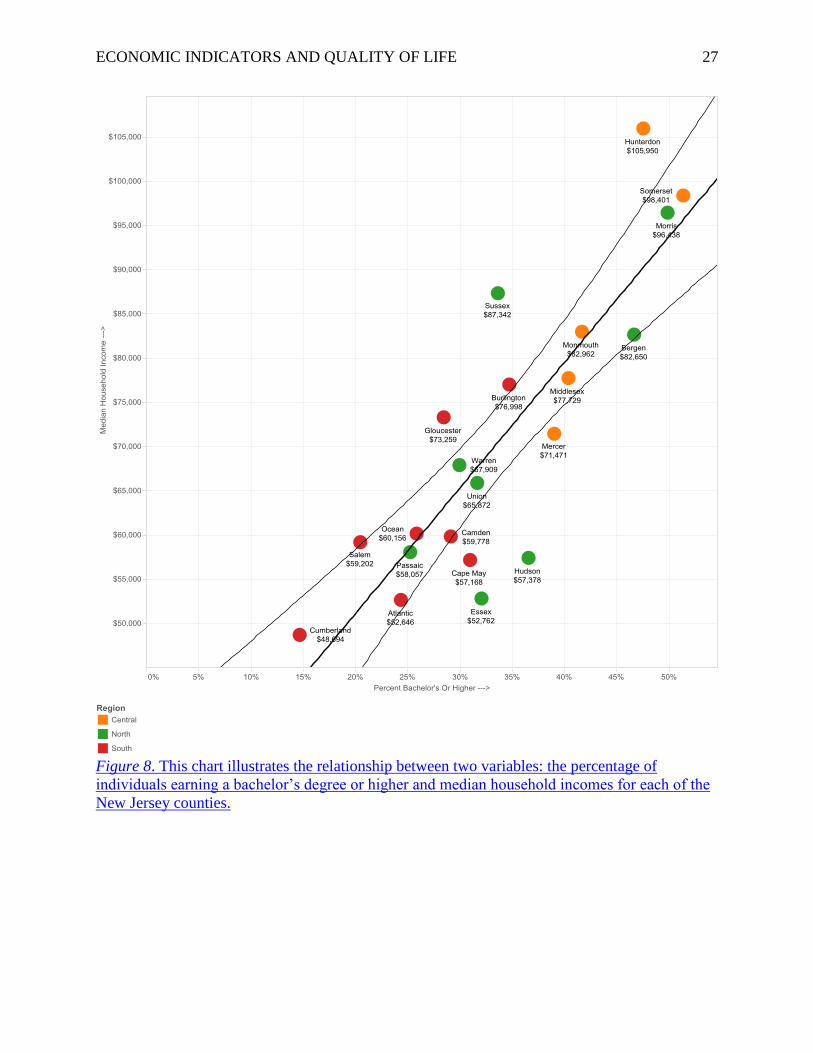
Notably, the relationship between labor force attachment, earnings and educational
attainment has only grown in significance since the Great Recession (Carnevale and Rose 2015).
Reflecting this new economic climate, the Pew Research Center for Social and Demographic
Trends recently tallied stark income disparities among millennials between the ages of 25 and 32
(Taylor, Fry & Oates 2014). Pew researchers calculate that millennials holding a “bachelor’s
degree or higher” earn a median income of $45,500 while the average millennial high school

ECONOMIC INDICATORS AND QUALITY OF LIFE 24
graduate earns a median income of $28,000. With regard to labor attachment, recent college
graduates also have considerably lower rates of unemployment of 3.8% compared with the
millennial American high school graduate rate of 12.2% unemployment in March 2013 (Taylor,
Fry & Oates 2014). Further, 21.8% of high school graduates were living in poverty in 2013
compared with only 5.8% of millennial college graduates (Taylor, Fry & Oates 2014). Without
making claims about causation or weighting the effects of migration patterns and within-county
disparities, when we look at the linear relationship between the percentage of bachelor’s degree
plus earners in New Jersey compared with median household incomes at the county-level in
Figure 8, there is a positive relationship between the two variables.

ECONOMIC INDICATORS AND QUALITY OF LIFE 25
Table 7
Percentage Bachelor’s Degree or Higher
COUNTY REGION RANK PERCENT
BACHELOR'S OR
HIGHER
Somerset Central 1 51.4%
Morris North 2 49.9%
Hunterdon Central 3 47.6%
Bergen North 4 46.7%
Monmouth Central 5 41.7%
Middlesex Central 6 40.4%
Mercer Central 7 39.1%
Hudson North 8 36.6%
Burlington South 9 34.8%
Sussex North 10 33.7%
Essex North 11 32.1%
Union North 12 31.7%
Cape May South 13 31.0%
Warren North 14 30.0%
Camden South 15 29.2%
Gloucester South 16 28.5%
Ocean South 17 25.9%
Passaic North 18 25.3%
Atlantic South 19 24.4%
Salem South 20 20.5%
Cumberland South 21 14.7%
United States 29.1%
New Jersey 36.1%
Note: U.S. Census Bureau. (2013). Educational attainment (S1501), 2011-2013 American
Community Survey, 3-Year Survey [Data File]. Retrieved from http://factfinder.census.gov.
Percent bachelor’s degree or higher for the population 25 years and over.

ECONOMIC INDICATORS AND QUALITY OF LIFE 26
Figure 7. Percentage Bachelor’s degree and higher, New Jersey counties.
ECONOMIC INDICATORS AND QUALITY OF LIFE 27
Figure 8. This chart illustrates the relationship between two variables: the percentage of
individuals earning a bachelor’s degree or higher and median household incomes for each of the
New Jersey counties.
ECONOMIC INDICATORS AND QUALITY OF LIFE 28
Southern New Jersey County Snapshots
In this section, we take a look at individual Southern New Jersey county demographics,
population statistics and detailed educational attainment data. In addition to the key economic
variables previously addressed, this section of the report includes several additional data points
that help flesh out quality of life in Southern New Jersey counties.
Additional Variables
Race, Ethnicity and National Origin. Similar to the Decennial Census, the American
Community Survey asks survey respondents about their racial and ethnic identity in addition to
questions about citizenship and national origin. In this report, the racial categories were defined
by the 2010 Decennial Census and include: white; black or African American; American Indian
and Alaska Native; Asian; Native Hawaiian and Other Pacific Islander; and, Two or more races.
The Census Bureau notes “percentages for the various categories add up to 100 percent, and
should not be combined with the percent Hispanic”
(http://quickfacts.census.gov/qfd/meta/long_RHI125213.htm).
Ethnicity. In addition to the racial categories noted, the American Community Survey
includes a narrow set of questions related to Hispanic or Latino “ethnicity” and that data can be
associated with or distinguished from racial categories. For example, it is possible for a
respondent to be white and Hispanic or Latino
(http://www.census.gov/prod/cen2010/briefs/c2010br-04.pdf). Data regarding Hispanic or Latino
origin is not included in this project. In this paper, data regarding origins is limited to identifying
the percentage of foreign born residents by county.

ECONOMIC INDICATORS AND QUALITY OF LIFE 29
Median Age: The Census Bureau defines median age as: “The age which divides the
population into two numerically equal groups; that is, half the people are younger than this age
and half are older” (https://www.census.gov/popest/about/terms/national.html).
Real Cost of Living (“RCL”). Similar to Halpin 2012, researchers at the Poverty
Research Institute use a methodology designed to measure “income adequacy” called the “Self-
sufficiency Standard” to calculate the cost of living in each New Jersey county. (Poverty
Research Institute 2013, 3). The researchers explain that the cost of living in New Jersey is
among the highest in the nation which means that middle- and lower-income New Jersey
families are especially vulnerable because they are “most likely to have fewer or no reserves, to
have fewer or no other places to turn, and to spend all or nearly all of their income on the most
basic necessities, especially housing” (Poverty Research Institute 2013, 8). Like Halpin’s ALICE
measure (2012), the cost of transportation, housing, healthcare and childcare define the RCL
measure.
County Profiles
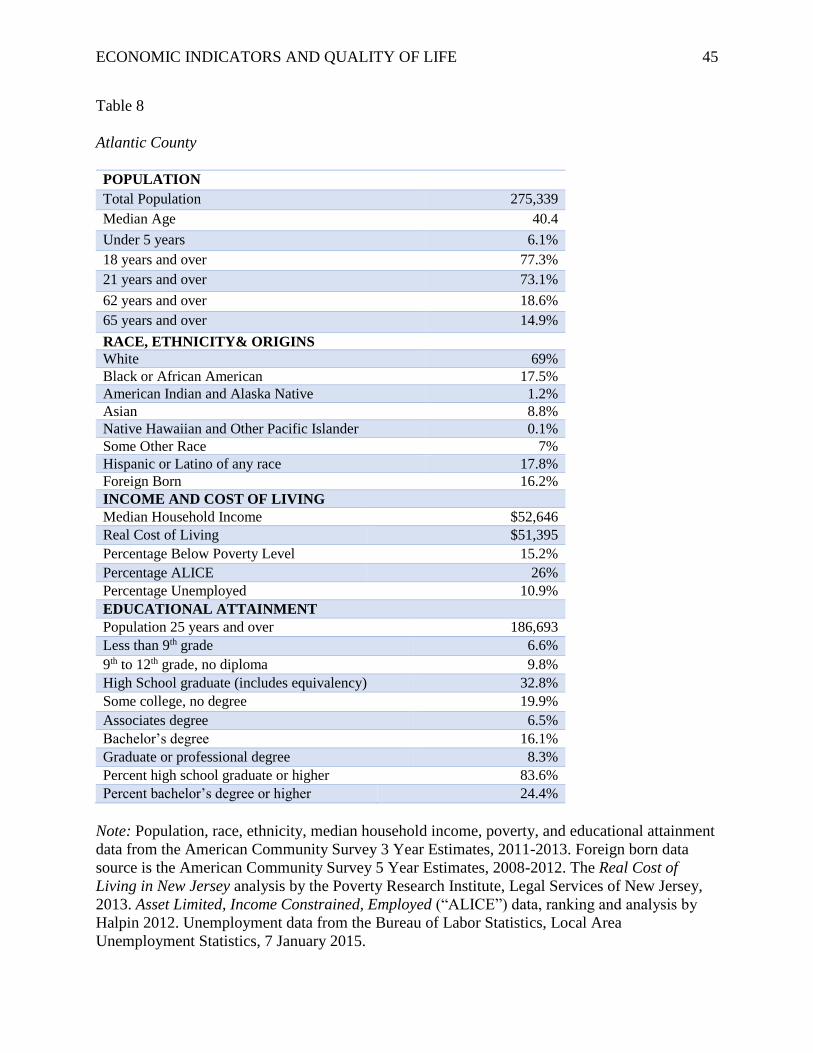
Atlantic County. Atlantic, Camden and Cumberland have the most racially and
ethnically diverse populations among the Southern New Jersey counties. Sixty-nine percent of
Atlantic County residents identified as white, nearly 18% black or African American, and close
to 9% as Asian American in 2013. Approximately 16% of Atlantic County residents were born
outside of the United States while 18% of individuals surveyed reported Hispanic or Latino
ethnicity. Notably, Atlantic and Cumberland counties are also ranked in the bottom five for each
of the primary indicators this report explores including income, poverty, unemployment status
and educational attainment. In addition to the indicators explored in the first section of this
paper, the Robert Wood Johnson Foundation (“RWJF”) ranks Atlantic County 20th among the

ECONOMIC INDICATORS AND QUALITY OF LIFE 30
twenty-one New Jersey counties for health outcomes (County Health Rankings 2015). The study
found that Atlantic County residents have some of the lowest health ratings in the state for
indicators including clinical care, socioeconomics, health behaviors and health outcomes
including life expectancy (County Health Rankings 2015).
The 2013 median household income for Atlantic County residents was $52,646 while the
real cost of living calculation by the Poverty Research Institute (2013) was $51,395. Thirteen
percent of residents live in rural communities and 17% are uninsured (County Health Rankings
2015). The high percentage of residents living below both the federal poverty measure (15.2%)
and ALICE threshold (26%) (Halpin 2012) speaks to the economic vulnerability of Atlantic
County residents. In 2013, the average income for the top 20% of Atlantic County residents was
4.8 times the average income of the bottom 20% (County Health Rankings 2015).
As of January 2015, the unemployment rate for Atlantic County was 10.9% compared
with the New Jersey state unemployment rate of 6.4%. According to the New Jersey Department
of Labor, the dominant labor sectors in the county are accommodation and food services; retail
trade; health care and social assistance; construction; administrative and support and waste
management and remediation services; and, construction (New Jersey Department of Labor
2014). The largest employment sectors in the county are (1) leisure and hospitality; (2) trade,
transportation, and utilities; and, (3) education and health services (New Jersey Department of
Labor 2014). Atlantic County is projected to see an increase of 3,850 jobs (2.8% growth)
between 2012 and 2022. For the sake of comparison, the rate of increase for the state of New
Jersey during the same period is 7.5% (New Jersey Department of Labor 2014). While the
percentage of New Jersey adults age twenty-five and older reportedly attaining a bachelor’s
degree or higher is 36.1% and the U.S. average is 29%, Atlantic County lags behind. In 2013,
ECONOMIC INDICATORS AND QUALITY OF LIFE 31
high school diploma, GED or higher educational attainment percentages for adults reached 84%;
however, only 24.4% of residents reported earning a bachelor’s degree or higher. Many of the
new jobs projected for the county are in sectors where a high percentage of opportunities are
limited to low-skill, low-educated workers (New Jersey Department of Labor 2014).
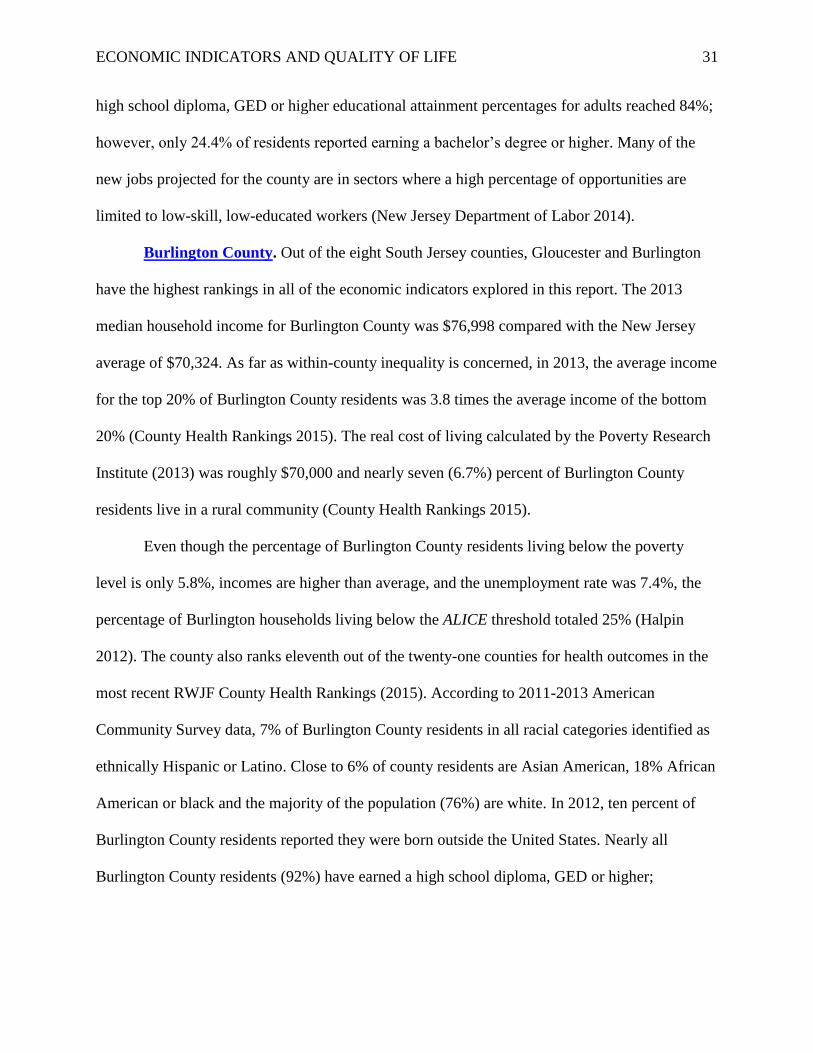
Burlington County. Out of the eight South Jersey counties, Gloucester and Burlington
have the highest rankings in all of the economic indicators explored in this report. The 2013
median household income for Burlington County was $76,998 compared with the New Jersey
average of $70,324. As far as within-county inequality is concerned, in 2013, the average income
for the top 20% of Burlington County residents was 3.8 times the average income of the bottom
20% (County Health Rankings 2015). The real cost of living calculated by the Poverty Research
Institute (2013) was roughly $70,000 and nearly seven (6.7%) percent of Burlington County
residents live in a rural community (County Health Rankings 2015).
Even though the percentage of Burlington County residents living below the poverty
level is only 5.8%, incomes are higher than average, and the unemployment rate was 7.4%, the
percentage of Burlington households living below the ALICE threshold totaled 25% (Halpin
2012). The county also ranks eleventh out of the twenty-one counties for health outcomes in the
most recent RWJF County Health Rankings (2015). According to 2011-2013 American
Community Survey data, 7% of Burlington County residents in all racial categories identified as
ethnically Hispanic or Latino. Close to 6% of county residents are Asian American, 18% African
American or black and the majority of the population (76%) are white. In 2012, ten percent of
Burlington County residents reported they were born outside the United States. Nearly all
Burlington County residents (92%) have earned a high school diploma, GED or higher;

ECONOMIC INDICATORS AND QUALITY OF LIFE 32
similarly, close to 35% of Burlington County residents have attained a bachelor’s degree or
higher including 12% who reported earning a professional or graduate degree.
According the New Jersey Department of Labor, Burlington County is projected to see a
6.7% increase in jobs (+ 13,700) between 2012 and 2022 (New Jersey Department of Labor
2014). The dominant Burlington County industrial sectors include: retail trade; administrative
and support and waste management and remediation services; health care and social assistance;
accommodation and food services; and, finance and insurance (New Jersey Department of Labor
2014). The largest employment sectors include: (1) trade, transportation, and utilities; (2)
professional and business services; (3) education and health services; and, (4) financial activities
(New Jersey Department of Labor 2014).
Camden County. The median household income for Camden County was very close to
$60,000 in 2013. While the Poverty Research Institute (2013) calculated the cost of living for
this county as roughly $58,966, the percentage of households living under the ALICE threshold
was 22% (Halpin 2012). Approximately 13.7% of Camden County households were living below
the poverty threshold in 2013 and ranks 19th in the RWJF County Health Rankings for 2015. The
county ranks low in terms of health outcomes, health behaviors and a high rate of violent crime4
(County Health Rankings 2015). Between 2012 and 2022, it is projected that Camden County
will see a job increase of 5.6% or 11,250 jobs (New Jersey Department of Labor 2014).
Dominant industrial sectors in the county are: healthcare and social assistance; retail trade,
administrative and support and waste management and remediation services; accommodation
and food service; and, professional, scientific and technical services (New Jersey Department of
Labor 2014). Primary employment sectors (most numerous jobs) are: (1) education and health
4 Violent crime is measured by the number of violent offenses per one hundred thousand residents
(County Health Rankings 2015).

ECONOMIC INDICATORS AND QUALITY OF LIFE 33
services; (2) trade, transportation, and utilities; and, (3) professional and business services (New
Jersey Department of Labor 2014). The unemployment rate for Camden County (8.4%) was
above both the New Jersey and United States averages as of January 2015.
Camden, Atlantic, and Cumberland have the most racially and ethnically diverse
populations among the Southern New Jersey counties. Twenty-two percent of Camden County
residents are black or African American, 6% are Asian, and 66% reported they were white in
2013. Regardless of racial category, 15% of residents identified Hispanic or Latino ethnicity and
among the entire county’s population, 10% reported they were born outside the United States.
With regard to educational attainment, 87.5% of residents have earned a high school diploma,
GED or higher and 29% of adults age 25 and older have earned a bachelor’s degree or higher. As
far as within-county inequality is concerned, in 2013, the average income for the top 20% of
Camden County residents was 5.0 times the average income of the bottom 20% (County Health
Rankings 2015).
Cape May County. With regard to racial categories, 93% of Cape May residents are
white, 6% reported they were black or African American, and 1.3% Asian American in 2013.
Only 4.8% of the population was born outside the United States while 6.7% of residents of all
races claimed Hispanic or Latino ethnicity. Notably, 23% of Cape May County’s 96,000
residents are 65 years of age and over; and, the median age is 48.1. A significant number of Cape
May County residents (17.5%) lived in rural communities in 2013 (County Health Rankings
2015). As for within-county income inequality, the average income for the top 20% of Cape May
County residents was 4.4 times the average income of the bottom 20% in 2013 (County Health
Rankings 2015). The dominant labor sectors of Cape May County include: accommodation/food
service; retail trade; healthcare and social assistance; arts, entertainment and recreation; and,

ECONOMIC INDICATORS AND QUALITY OF LIFE 34
construction (New Jersey Department of Labor 2014). The major employment sectors include:
(1) leisure and hospitality; (2) trade, transportation, and utilities; and, (3) education and health
services (New Jersey Department of Labor 2014). Between 2012 and 2022, the New Jersey
Department of Labor (2014) projects limited job growth of 3.3% or an increase of 1,350 jobs.
The 2013 median household income for Cape May was $57,168 while the real cost of
living calculated in 2011 dollars averaged $58,134 (Poverty Research Institute 2013). According
to American Community Survey data, 10% of Cape May County households were living below
the federal poverty threshold in 2013 and a large number (33%) were calculated living below the
ALICE threshold in 2010 (Halpin 2012). A high percentage of Cape May County adults (31%)
have attained a bachelor’s or higher degree; and, 10.6% of those hold a professional or graduate
degree. Similarly, nearly 90% of county residents reported earning a high school degree, GED or
higher level of schooling. Based on multiple indicators, the Robert Wood Johnson Foundation
ranks Cape May County fifteenth out of twenty-one counties for health outcomes. Contributing
to the poor health ranking are higher than average rates of premature death, poor health
behaviors, and below average social and environmental factors (County Health Rankings 2015).
Cumberland County. Cumberland is the poorest county in the state of New Jersey. With
a population totaling 157,658 in 2013, the median age of Cumberland County residents was 36.
While only 2% of residents identified as Asian American, 23% of Cumberland County citizens
are African American or black and 64% are white. Seven percent of the population identified as
Hispanic or Latino of any race while close to 10% reported they were born outside the United
States. Cumberland County experienced the lowest median household income of all New Jersey
counties with $48,694 in 2013 and, notably the real cost of living calculated in 2011 dollars
averaged $60,415 (Poverty Research Center 2013). Close to 19% of Cumberland County

ECONOMIC INDICATORS AND QUALITY OF LIFE 35
residents live below the federal poverty level and according to Halpin (2012), 32% of households
lived below the ALICE threshold. With the second highest unemployment rate (10.7% in January
2015) among all New Jersey counties, only 77.7% of Cumberland County residents have earned
a high school diploma, GED or higher. As well, this county has the lowest percentage of
residents attaining a bachelor’s degree or higher at 14.7%.
In the 2015 RWJF County Health Rankings, Cumberland County is ranked 21st among
the twenty-one New Jersey counties (County Health Rankings 2015). Twenty-three percent of
residents live in rural communities and, as far as within-county inequality is concerned, in 2013,
the average income for the top 20% of Cumberland County residents was 5.0 times the average
income of the bottom 20% (County Health Rankings 2015). The county’s dismal health ranking
is attributed to poor health outcomes, behaviors, clinical care, and socioeconomics (County
Health Rankings 2015).
The most dominant labor sectors in Cumberland County are: health care and social
assistance; manufacturing; retail trade; accommodation and food service; and, administrative and
support and waste management, remediation services (New Jersey Department of Labor 2014).
The top three employers in Cumberland County include (1) trade, transportation and utilities; (2)
education and health care; and, (3) manufacturing (New Jersey Department of Labor 2014). As
far as growth is concerned, Cumberland County will see an increase in jobs between 2012 and
2022 particularly in the health care and social service sector. The New Jersey Department of
Labor projects the county will gain 4.9% or 2,850 new jobs (New Jersey Department of Labor
2014).
Gloucester County. In Gloucester County, 84% of residents identify as white, close to
12% as black or African American and 3% as Asian American. Only 5% of Gloucester County

ECONOMIC INDICATORS AND QUALITY OF LIFE 36
residents reported Hispanic or Latino ethnicity; and, 5% of residents reported being born outside
of the United States. Eight percent of Gloucester County residents lived in rural communities in
2013 and the median household income was approximately $73,000 (County Health Rankings
2015). As far as within-county inequality is concerned, the average income for the top 20% of
Gloucester County residents was 4.1 times the average income of the bottom 20% in 2013
(County Health Rankings 2015).
According to the Poverty Research Institute’s analysis (2013), the real cost of living in
Gloucester County was $61,700 in 2011. Similarly, is it estimated that a quarter of Gloucester
County households lived below the ALICE threshold and should therefore considered
economically vulnerable (Halpin 2012). The rate of poverty in the county is 8.6% while the
unemployment rate is higher than both the New Jersey and United States averages at 7.8% as of
January 2015. Gloucester was ranked by RWJF sixteenth out of twenty-one counties for health
outcomes (County Health Rankings 2015).
Ninety one percent of adults age 25 and older hold a high school diploma, GED or higher
and close to 29% reported attaining a bachelor’s degree or higher. The dominant labor sectors in
Gloucester County include: retail trade; health care and social assistance; accommodation and
food services; construction; and administrative and support and waste management and
remediation services (New Jersey Department of Labor 2014). The greatest number of jobs are in
the industry sectors: (1) trade, transportation and utilities; (2) education and health services; (3)
leisure and hospitality; and, (4) professional and business services (New Jersey Department of
Labor 2014). Between 2012 and 2022, it is projected that Gloucester County will gain 6,700
jobs, a 6.7% increase (New Jersey Department of Labor 2014).
ECONOMIC INDICATORS AND QUALITY OF LIFE 37
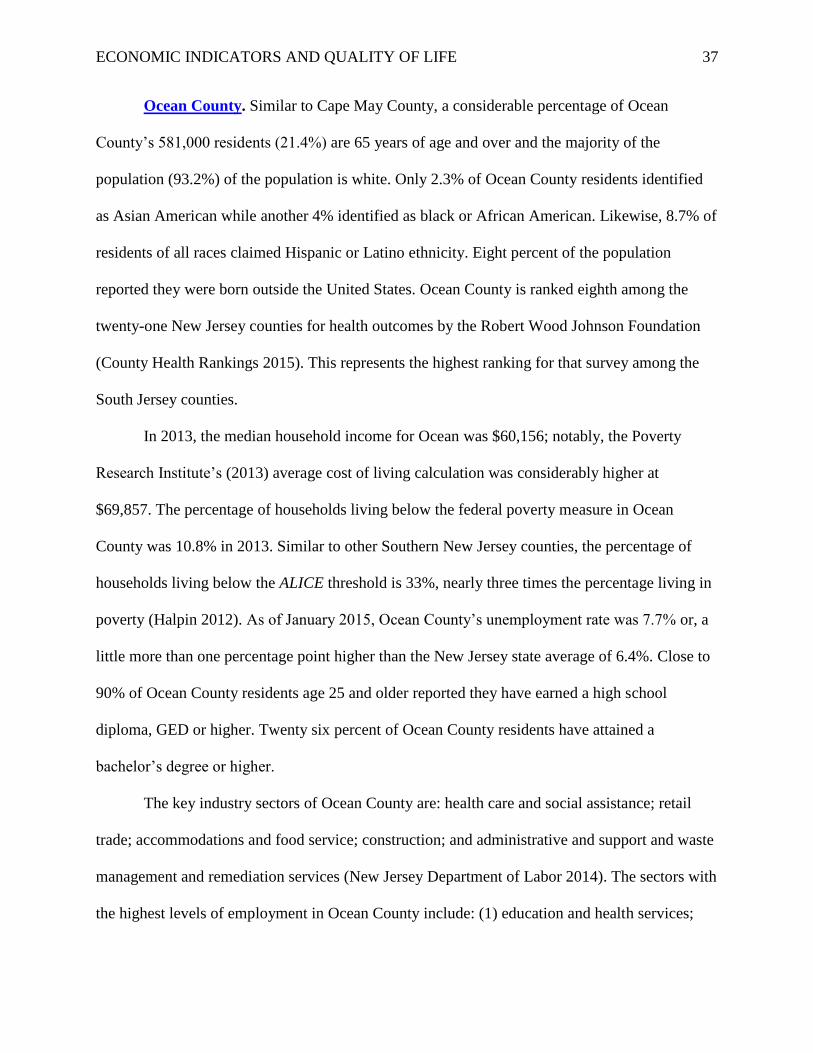
Ocean County. Similar to Cape May County, a considerable percentage of Ocean
County’s 581,000 residents (21.4%) are 65 years of age and over and the majority of the
population (93.2%) of the population is white. Only 2.3% of Ocean County residents identified
as Asian American while another 4% identified as black or African American. Likewise, 8.7% of
residents of all races claimed Hispanic or Latino ethnicity. Eight percent of the population
reported they were born outside the United States. Ocean County is ranked eighth among the
twenty-one New Jersey counties for health outcomes by the Robert Wood Johnson Foundation
(County Health Rankings 2015). This represents the highest ranking for that survey among the
South Jersey counties.
In 2013, the median household income for Ocean was $60,156; notably, the Poverty
Research Institute’s (2013) average cost of living calculation was considerably higher at
$69,857. The percentage of households living below the federal poverty measure in Ocean
County was 10.8% in 2013. Similar to other Southern New Jersey counties, the percentage of
households living below the ALICE threshold is 33%, nearly three times the percentage living in
poverty (Halpin 2012). As of January 2015, Ocean County’s unemployment rate was 7.7% or, a
little more than one percentage point higher than the New Jersey state average of 6.4%. Close to
90% of Ocean County residents age 25 and older reported they have earned a high school
diploma, GED or higher. Twenty six percent of Ocean County residents have attained a
bachelor’s degree or higher.
The key industry sectors of Ocean County are: health care and social assistance; retail
trade; accommodations and food service; construction; and administrative and support and waste
management and remediation services (New Jersey Department of Labor 2014). The sectors with
the highest levels of employment in Ocean County include: (1) education and health services;

ECONOMIC INDICATORS AND QUALITY OF LIFE 38
trade, transportation, and utilities; and, (3) leisure and hospitality (New Jersey Department of
Labor 2014). Employment projections for Ocean County between 2012 and 2022 exceed the
7.5% rate of growth anticipated by the state of New Jersey. The New Jersey Department of
Labor (2014) projects a 9.2% job increase or approximately 14,350 jobs. It is anticipated that the
majority of these new jobs will be in the health care and social services sectors.
Salem County. While 7% of Salem County residents claimed they are ethnically
Hispanic or Latino in 2013, 4% of the population reported they were born outside the United
States. Eighty two percent of Salem County residents are white, 15% are African American or
black, and approximately 1% are Asian American. In 2013, the median household income was
$59,202 and it is estimated that 29% of Salem County households were living below the ALICE
threshold (Halpin 2012). Fifteen percent of households were living below the federal poverty
level in 2013 and the unemployment rate was 6.7% as of January 2015, close to the New Jersey
average of 6.4%. According to the American Community Survey, there is a relatively low rate of
postsecondary educational attainment as 86% of Salem County residents have obtained a high
school diploma, GED or higher but only 20.5% of county residents have earned a bachelor’s
degree or higher. The smallest of the Southern counties with a population of 65,651,
approximately 16% of Salem County residents are 65 years of age or older.
Forty-five percent (45.3%) of this county’s residents live in rural communities and,
within-county inequality is high as the average income for the top 20% of Salem County
residents was 4.9 times the average income of the bottom 20% (County Health Rankings 2015).
Salem County residents experience high rates of poor health behaviors, weaker clinical care and
lower life expectancy. The rate of premature deaths is improving but still above national and
state averages (County Health Rankings 2015). Among the twenty-one New Jersey counties,

ECONOMIC INDICATORS AND QUALITY OF LIFE 39
Salem County is ranked 18th for the 2015 RWJF health outcomes (County Health Rankings
2015).
The dominant labor sectors in Salem County include: health care and social assistance;
retail trade; transportation and warehousing; accommodation and food services; and construction
(New Jersey Department of Labor 2014). The most jobs are located in sectors including: (1)
trade, transportation and utilities; (2) manufacturing; and, (3) professional and business services
(New Jersey Department of Labor 2014). It is projected that Salem County will see a 5.2% gain
(1,100 jobs) between 2012 and 2022 (New Jersey Department of Labor 2014).
Conclusion
As stated in the introduction, the purpose of this paper was to gather, rank and visualize
data to gain a better understanding of differences between the North, Central and South New
Jersey counties. This data allows us to consider how the Southern counties rank in terms of
common indicators used to gauge quality of life including median household income, rates of
unemployment and poverty and educational attainment. Summing up a new study on human
development in the United States, Richard Florida reminds us that, “America’s economic divide
registers not just in what we can afford to buy, but in the education we have the opportunity to
attain and most basically, in how much time we have to live” (Florida 2015). In addition to
compilations of current socioeconomic data, this project highlights geographically concentrated
inequality that may be detrimental to the long term welfare and quality of life of many South
Jersey children and families.
The importance of “place” in social science research reveals that beyond historic patterns
of racial and ethnic segregation, affluence and poverty in the U.S. also tend to be concentrated
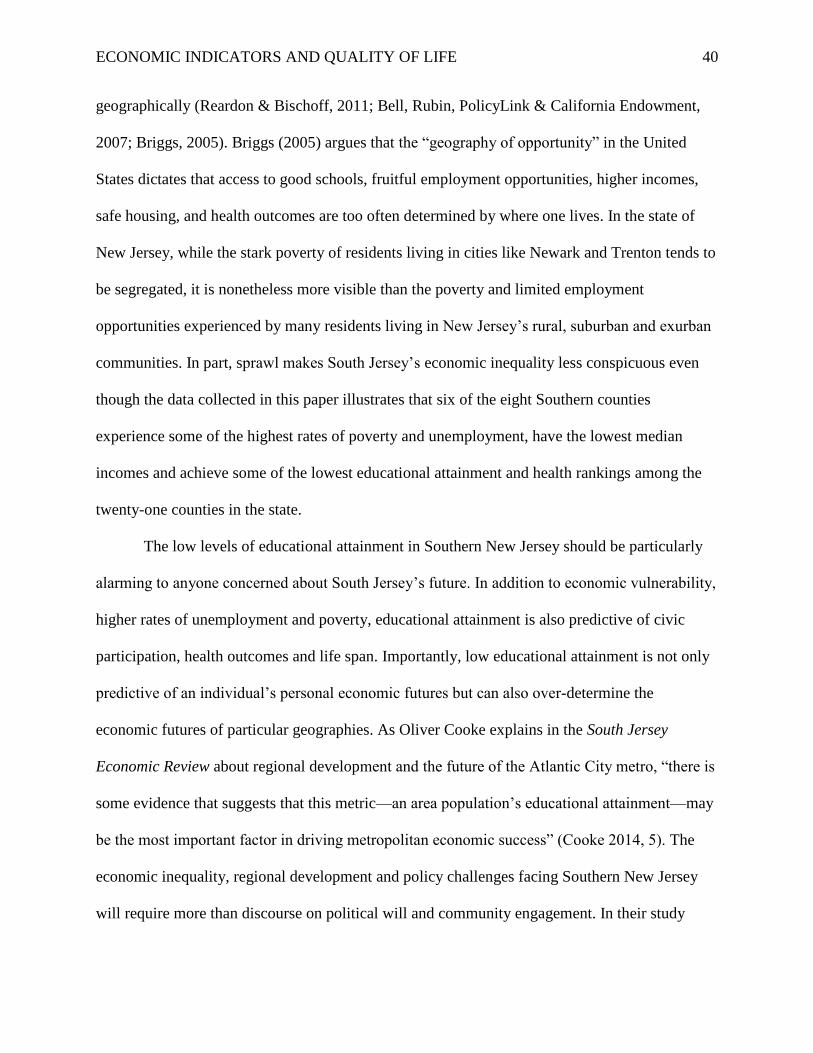
ECONOMIC INDICATORS AND QUALITY OF LIFE 40
geographically (Reardon & Bischoff, 2011; Bell, Rubin, PolicyLink & California Endowment,
2007; Briggs, 2005). Briggs (2005) argues that the “geography of opportunity” in the United
States dictates that access to good schools, fruitful employment opportunities, higher incomes,
safe housing, and health outcomes are too often determined by where one lives. In the state of
New Jersey, while the stark poverty of residents living in cities like Newark and Trenton tends to
be segregated, it is nonetheless more visible than the poverty and limited employment
opportunities experienced by many residents living in New Jersey’s rural, suburban and exurban
communities. In part, sprawl makes South Jersey’s economic inequality less conspicuous even
though the data collected in this paper illustrates that six of the eight Southern counties
experience some of the highest rates of poverty and unemployment, have the lowest median
incomes and achieve some of the lowest educational attainment and health rankings among the
twenty-one counties in the state.
The low levels of educational attainment in Southern New Jersey should be particularly
alarming to anyone concerned about South Jersey’s future. In addition to economic vulnerability,
higher rates of unemployment and poverty, educational attainment is also predictive of civic
participation, health outcomes and life span. Importantly, low educational attainment is not only
predictive of an individual’s personal economic futures but can also over-determine the
economic futures of particular geographies. As Oliver Cooke explains in the South Jersey
Economic Review about regional development and the future of the Atlantic City metro, “there is
some evidence that suggests that this metric—an area population’s educational attainment—may
be the most important factor in driving metropolitan economic success” (Cooke 2014, 5). The
economic inequality, regional development and policy challenges facing Southern New Jersey
will require more than discourse on political will and community engagement. In their study
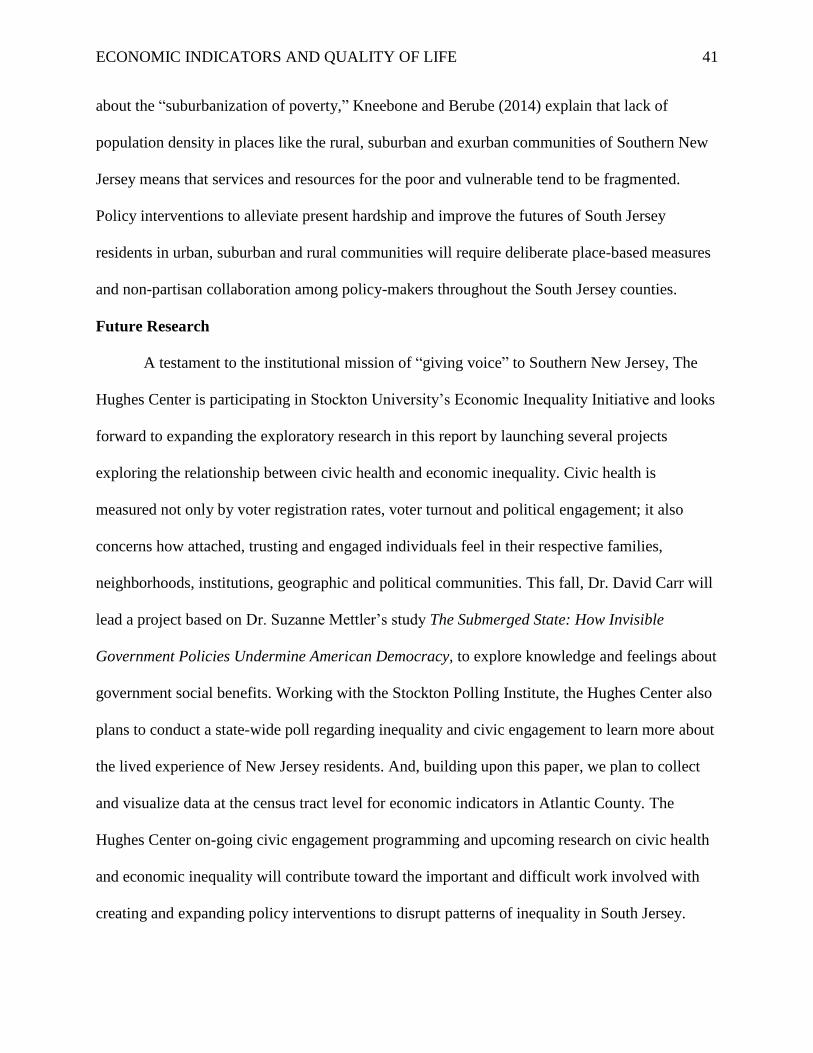
ECONOMIC INDICATORS AND QUALITY OF LIFE 41
about the “suburbanization of poverty,” Kneebone and Berube (2014) explain that lack of
population density in places like the rural, suburban and exurban communities of Southern New
Jersey means that services and resources for the poor and vulnerable tend to be fragmented.
Policy interventions to alleviate present hardship and improve the futures of South Jersey
residents in urban, suburban and rural communities will require deliberate place-based measures
and non-partisan collaboration among policy-makers throughout the South Jersey counties.
Future Research
A testament to the institutional mission of “giving voice” to Southern New Jersey, The
Hughes Center is participating in Stockton University’s Economic Inequality Initiative and looks
forward to expanding the exploratory research in this report by launching several projects
exploring the relationship between civic health and economic inequality. Civic health is
measured not only by voter registration rates, voter turnout and political engagement; it also
concerns how attached, trusting and engaged individuals feel in their respective families,
neighborhoods, institutions, geographic and political communities. This fall, Dr. David Carr will
lead a project based on Dr. Suzanne Mettler’s study The Submerged State: How Invisible
Government Policies Undermine American Democracy, to explore knowledge and feelings about
government social benefits. Working with the Stockton Polling Institute, the Hughes Center also
plans to conduct a state-wide poll regarding inequality and civic engagement to learn more about
the lived experience of New Jersey residents. And, building upon this paper, we plan to collect
and visualize data at the census tract level for economic indicators in Atlantic County. The
Hughes Center on-going civic engagement programming and upcoming research on civic health
and economic inequality will contribute toward the important and difficult work involved with
creating and expanding policy interventions to disrupt patterns of inequality in South Jersey.

ECONOMIC INDICATORS AND QUALITY OF LIFE 42
References
Aisch, G., Buth, E., Bloch, M., Cox, A., & Quealy, K. The Best and Worst Areas to Grow Up:
How Your Area Compares. The New York Times.
http://www.nytimes.com/interactive/2015/05/03/upshot/the-best-and-worst-places-to-
grow-up-how-your-area-compares.html?emc=eta1&abt=0002&abg=0
Bell, J. E., Rubin, V., PolicyLink (Organization), & California Endowment. (2007). Why place
matters: building a movement for healthy communities. Oakland, CA: PolicyLink.
http://policylink.org/find-resources/library/why-place-and-race-matter
Carnevale, A., & Rose, S. (2015). The economy goes to college: The hidden promise of higher
education in the post-industrial service economy. Washington, D.C.: Georgetown
University Center on Education and the Workforce, McCourt School of Public Policy.
Comey, J., Narducci, C., & Taian, P.A. (2010) State of Washington, D.C.’s neighborhoods 2010.
Washington, D.C.: The Urban Institute. http://www.urban.org/publications/412333.html
Cooke, O.D. (2014). The diversification premium. The South Jersey Economic Review, 7, 2, 1-7.
Briggs, X. N. de Souza (2005). The geography of opportunity: Race and housing choice in
metropolitan America. Washington D.C: Brookings Institution Press.
Desilva, D. (2013). The many ways to measure economic inequality. Washington, D.C.: Pew
Research Center.
Florida, R. (2015). The geography of well-being. The Atlantic CityLab.
http://www.citylab.com/work/2015/04/the-geography-of-well-being/391188/
Grawe, N. (2008). Wealth and Economic Mobility. Washington, D.C.: The Urban Institute and
the Pew Charitable Trusts Economic Mobility Project.
http://www.pewtrusts.org/en/archived-projects/economic-mobility-project
Halpin, S. H. (2012). ALICE: Asset Limited, Income Constrained, Employed: A study of financial
hardship in New Jersey. Cedar Knolls, NJ: United Way of Northern New Jersey.
http://www.unitedwaynnj.org/ourwork/alice_nj.php
Hughes Center for Public Policy, William J. (n.d.). Mission Statement. Galloway, NJ: The
Richard Stockton College of New Jersey.
http://intraweb.stockton.edu/eyos/page.cfm?siteID=135&pageID=9
Kahn, C., Kingsley, T., & Taylor, G. (2012). National Neighborhood Indicators Partnership
(NNIP) – Shared Indicators System Framework. Washington, D.C.: The Urban Institute.
http://www.neighborhoodindicators.org/library/catalog/nnip-shared-indicators-system-
draft-framework
Kneebone, E., & Berube, A. (2013). Confronting suburban poverty in America. Washington,
D.C.: Brookings Institution Press.
Lowrey, A. (2014). Income gap, meet the longevity map. New York Times.
http://www.nytimes.com/2014/03/16/business/income-gap-meet-the-longevity-gap.html
and http://www.nytimes.com/interactive/2014/03/15/business/higher-income-longer-
lives.html
Metropolitan Philadelphia Indicators Project. (2010). Where we stand: Community indicators for
metropolitan Philadelphia 2010. Philadelphia: Temple University.
http://mpip.temple.edu/
Metropolitan Philadelphia Indicators Project. (2008). Rating the region’s quality of life.
Philadelphia: Temple University. http://mpip.temple.edu/
Missouri Census Data Center. (n.d.) Measures of income in the census. http://mcdc.missouri.edu

ECONOMIC INDICATORS AND QUALITY OF LIFE 43
New Jersey Department of Labor and Workforce Development. Data for decision making series:
Key industries in New Jersey’s counties. Trenton: Bureau of Labor Market Information.
www.nj.gov/labor
Noah, T. (2012). The great divergence: America’s growing inequality crisis and what we can do
about it. New York: Bloomsbury.
The Pew Charitable Trusts. (2014). Philadelphia: The state of the city, a 2014 update.
Philadelphia: The Pew Charitable Trusts Philadelphia Research Initiative.
http://www.pewtrusts.org/en/research-and-analysis/reports/2014/04/05/philadelphia-the-
state-of-the-city-a-2014-update
Picketty, T., & Goldhammer, A. (2014). Capital in the twenty-first century. Cambridge, MA:
The Belknap Press of Harvard University Press.
Poverty Research Institute. (2013). The real cost of living in New Jersey: What it takes to make
basic needs and avoid deprivation. Edison, NJ: Legal Services of New Jersey.
www.lsnj.org
Reardon, S. F., & Bischoff, K. (January 01, 2011). Income inequality and income segregation.
American Journal of Sociology, 116, 4, 1092-153.
Robert Wood Johnson Foundation, & the University of Wisconsin Population Health Institute,
School of Medicine and Public Health. (2015). County Health Rankings.
http://www.countyhealthrankings.org/
Steele, A. (2015). Camden gains “Promise Zone status to leverage federal aid. The Philadelphia
Inquirer. http://www.philly.com/philly/news/new_jersey/
20150429_Camden_gains__Promise_Zone__status_to_leverage_federal_aid.html
Stiglitz, J. (2012). The price of inequality: how today’s divided society endangers our future.
New York: W.W. Norton & Company.
Taylor, P., Fry, R., & Oates, R. (2014). The rising cost of not going to college. Washington,
D.C.: Pew Research Center. http://www.pewsocialtrends.org/2014/02/11/the-rising-cost-
of-not-going-to-college/
U.S. Census Bureau. (2013). Educational attainment (S1501), 2011-2013 American Community
Survey, 3-Year Survey [Data File]. Retrieved from http://factfinder.census.gov
U.S. Census Bureau. (2013). Median household income in the past 12 months (in 2013 inflation
–adjusted dollars) (B1501), 2011-2013 American Community Survey, 3-Year Survey [Data File].
Retrieved from http://factfinder.census.gov
U.S. Census Bureau. (2013). Poverty status in the past 12 months (S1701), 2011-2013 American
Community Survey, 3-Year Survey [Data File]. Retrieved from
http://factfinder.census.gov
U.S. Census Bureau. (2012). Demographic Characteristics, 2008-2012 American Community
Survey, 5-Year Survey [Data File]. Retrieved from http://factfinder.census.gov
U.S. Department of Labor. (2015). Labor force data by county, not seasonally adjusted, October
2013-November 2014. Washington, D.C.: Bureau of Labor Statistics. Retrieved from
http://www.bls.gov/lau/
U.S. Department of Labor. (2015). Unemployment rates for states, monthly rankings, seasonally
adjusted. Washington, D.C.: Bureau of Labor Statistics. Retrieved from
http://www.bls.gov/web/laus/laumstrk.htm
U.S. Department of Labor. (2015). United States Labor force statistics from the Current
Population Survey. Washington, D.C.: Bureau of Labor Statistics. Retrieved from
http://data.bls.gov/timeseries/LNS14000000

ECONOMIC INDICATORS AND QUALITY OF LIFE 44
Van Riper, T. (2014). “America’s Richest Counties 2014.” Forbes. http://www.forbes.com
/sites/tomvanriper/2014/04/01/americas-richest-counties-2014/
______________________________________________________________________________
Correspondence concerning this paper should be addressed to [email protected]
ECONOMIC INDICATORS AND QUALITY OF LIFE 45
Table 8
Atlantic County
POPULATION
Total Population 275,339
Median Age 40.4
Under 5 years 6.1%
18 years and over 77.3%
21 years and over 73.1%
62 years and over 18.6%
65 years and over 14.9%
RACE, ETHNICITY& ORIGINS
White 69%
Black or African American 17.5%
American Indian and Alaska Native 1.2%
Asian 8.8%
Native Hawaiian and Other Pacific Islander 0.1%
Some Other Race 7%
Hispanic or Latino of any race 17.8%
Foreign Born 16.2%
INCOME AND COST OF LIVING
Median Household Income $52,646
Real Cost of Living $51,395
Percentage Below Poverty Level 15.2%
Percentage ALICE 26%
Percentage Unemployed 10.9%
EDUCATIONAL ATTAINMENT
Population 25 years and over 186,693
Less than 9th grade 6.6%
9th to 12th grade, no diploma 9.8%
High School graduate (includes equivalency) 32.8%
Some college, no degree 19.9%
Associates degree 6.5%
Bachelor’s degree 16.1%
Graduate or professional degree 8.3%
Percent high school graduate or higher 83.6%
Percent bachelor’s degree or higher 24.4%
Note: Population, race, ethnicity, median household income, poverty, and educational attainment
data from the American Community Survey 3 Year Estimates, 2011-2013. Foreign born data
source is the American Community Survey 5 Year Estimates, 2008-2012. The Real Cost of
Living in New Jersey analysis by the Poverty Research Institute, Legal Services of New Jersey,
2013. Asset Limited, Income Constrained, Employed (“ALICE”) data, ranking and analysis by
Halpin 2012. Unemployment data from the Bureau of Labor Statistics, Local Area
Unemployment Statistics, 7 January 2015.

ECONOMIC INDICATORS AND QUALITY OF LIFE 46
Table 9
Burlington County
POPULATION
Total Population 451,071
Median Age 40.9
Under 5 years 5.6%
18 years and over 77.5%
21 years and over 73.9%
62 years and over 18%
65 years and over 14.7%
RACE, ETHNICITY & ORIGINS
White 75.9%
Black or African American 18.1%
American Indian and Alaska Native 0.9%
Asian 5.6%
Native Hawaiian and Other Pacific Islander 0.2%
Some Other Race 3.2%
Hispanic or Latino of any race 7.1%
Foreign Born 9.5%
INCOME AND COST OF LIVING
Median Household Income $76,998
Real Cost of Living $70,224
Percentage Below Poverty Level 5.8%
Percentage ALICE 25%
Percentage Unemployed 7.4%
EDUCATIONAL ATTAINMENT
Population 25 years and over 310,702
Less than 9th grade 2.6%
9th to 12th grade, no diploma 5.4%
High School graduate (includes equivalency) 30.3%
Some college, no degree 19.2%
Associates degree 7.7%
Bachelor’s degree 22.6%
Graduate or professional degree 12.2%
Percent high school graduate or higher 92.1%
Percent bachelor’s degree or higher 34.8%
Note: Population, race, ethnicity, median household income, poverty, and educational attainment
data from the American Community Survey 3 Year Estimates, 2011-2013. Foreign born data
source is the American Community Survey 5 Year Estimates, 2008-2012. The Real Cost of
Living in New Jersey analysis by the Poverty Research Institute, Legal Services of New Jersey,
2013. Asset Limited, Income Constrained, Employed (“ALICE”) data, ranking and analysis by
Halpin 2012. Unemployment data from the Bureau of Labor Statistics, Local Area
Unemployment Statistics, 7 January 2015.

ECONOMIC INDICATORS AND QUALITY OF LIFE 47
Table 10
Camden County
POPULATION
Total Population 513,404
Median Age 38.2
Under 5 years 6.40%
18 years and over 76.2%
21 years and over 72.3%
62 years and over 16.8%
65 years and over 13.5%
RACE, ETHNICITY & ORIGINS
White 65.9%
Black or African American 21.6%
American Indian and Alaska Native 1%
Asian 6.1%
Native Hawaiian and Other Pacific Islander 0.1%
Some Other Race 8.9%
Hispanic or Latino of any race 15.1%
Foreign Born 10.4%
INCOME AND COST OF LIVING
Median Household Income $59,778
Real Cost of Living $58,966
Percentage Below Poverty Level 13.7%
Percentage ALICE 22%
Percentage Unemployed 8.4%
EDUCATIONAL ATTAINMENT
Population 25 years and over 345,316
Less than 9th grade 4.8%
9th to 12th grade, no diploma 7.7%
High School graduate (includes equivalency) 31.6%
Some college, no degree 19.3%
Associates degree 7.5%
Bachelor’s degree 18.8%
Graduate or professional degree 10.4%
Percent high school graduate or higher 87.5%
Percent bachelor’s degree or higher 29.2%
Note: Population, race, ethnicity, median household income, poverty, and educational attainment
data from the American Community Survey 3 Year Estimates, 2011-2013. Foreign born data
source is the American Community Survey 5 Year Estimates, 2008-2012. The Real Cost of
Living in New Jersey analysis by the Poverty Research Institute, Legal Services of New Jersey,
2013. Asset Limited, Income Constrained, Employed (“ALICE”) data, ranking and analysis by
Halpin 2012. Unemployment data from the Bureau of Labor Statistics, Local Area
Unemployment Statistics, 7 January 2015.

ECONOMIC INDICATORS AND QUALITY OF LIFE 48
Table 11
Cape May County
Note: Population, race, ethnicity, median household income, poverty, and educational attainment data
from the American Community Survey 3 Year Estimates, 2011-2013. Foreign born data source is the
American Community Survey 5 Year Estimates, 2008-2012. The Real Cost of Living in New Jersey
analysis by the Poverty Research Institute, Legal Services of New Jersey, 2013. Asset Limited, Income
Constrained, Employed (“ALICE”) data, ranking and analysis by Halpin 2012. Unemployment data from
the Bureau of Labor Statistics, Local Area Unemployment Statistics, 7 January 2015. “An 'N' entry in the
estimate and margin of error columns [Native Hawaiian] indicates that data for this geographic area
cannot be displayed because the number of sample cases is too small” (American Community Survey, 3
Year Estimates, 2011-2013).
POPULATION
Total Population 96,305
Median Age 48.1
Under 5 years 4.7%
18 years and over 81.7%
21 years and over 77.7%
62 years and over 27.5%
65 years and over 22.7%
RACE, ETHNICITY & ORIGINS
White 92.6%
Black or African American 5.6%
American Indian and Alaska Native 0.9%
Asian 1.3%
Native Hawaiian and Other Pacific Islander N
Some Other Race 1.7%
Hispanic or Latino of any race 6.7%
Foreign Born 4.8%
INCOME AND COST OF LIVING
Median Household Income $57,168
Real Cost of Living $58,134
Percentage Below Poverty Level 10%
Percentage ALICE 33%
Percentage Unemployed 9.9%
EDUCATIONAL ATTAINMENT
Population 25 years and over 70,965
Less than 9th grade 3%
9th to 12th grade, no diploma 7.2%
High School graduate (includes equivalency) 34.4%
Some college, no degree 17.4%
Associates degree 6.9%
Bachelor’s degree 20.4%
Graduate or professional degree 10.6%
Percent high school graduate or higher 89.7%
Percent bachelor’s degree or higher 31%

ECONOMIC INDICATORS AND QUALITY OF LIFE 49
Table 12
Cumberland County
POPULATION
Total Population 157,658
Median Age 36.7
Under 5 years 6.9%
18 years and over 76.2%
21 years and over 72.7%
62 years and over 16.2%
65 years and over 13%
RACE, ETHNICITY & ORIGINS
White 64%
Black or African American 23.1%
American Indian and Alaska Native 2.1%
Asian 1.7%
Native Hawaiian and Other Pacific Islander .2%
Some Other Race 13.1%
Hispanic or Latino of any race 6.7%
Foreign Born 10.3%
INCOME AND COST OF LIVING
Median Household Income $48,694
Real Cost of Living $60,415
Percentage Below Poverty Level 18.5%
Percentage ALICE 32%
Percentage Unemployed 10.7%
EDUCATIONAL ATTAINMENT
Population 25 years and over 105,480
Less than 9th grade 9.3%
9th to 12th grade, no diploma 13%
High School graduate (includes equivalency) 39.8%
Some college, no degree 17.5%
Associates degree 5.7%
Bachelor’s degree 10.6%
Graduate or professional degree 4.1%
Percent high school graduate or higher 77.7%
Percent bachelor’s degree or higher 14.7%
Note: Population, race, ethnicity, median household income, poverty, and educational attainment
data from the American Community Survey 3 Year Estimates, 2011-2013. Foreign born data
source is the American Community Survey 5 Year Estimates, 2008-2012. The Real Cost of
Living in New Jersey analysis by the Poverty Research Institute, Legal Services of New Jersey,
2013. Asset Limited, Income Constrained, Employed (“ALICE”) data, ranking and analysis by
Halpin 2012. Unemployment data from the Bureau of Labor Statistics, Local Area
Unemployment Statistics, 7 January 2015.

ECONOMIC INDICATORS AND QUALITY OF LIFE 50
Table 13
Gloucester County
POPULATION
Total Population 289,837
Median Age 39.3
Under 5 years 5.8%
18 years and over 76.4%
21 years and over 72.2%
62 years and over 16.7%
65 years and over 13.2%
RACE, ETHNICITY & ORIGINS
White 84.1%
Black or African American 11.6%
American Indian and Alaska Native 0.9%
Asian 3.4%
Native Hawaiian and Other Pacific Islander 0.1%
Some Other Race 2.5%
Hispanic or Latino of any race 5.2%
Foreign Born 5.1%
INCOME AND COST OF LIVING
Median Household Income $73,259
Real Cost of Living $61,700
Percentage Below Poverty Level 8.6%
Percentage ALICE 25%
Percentage Unemployed 7.8%
EDUCATIONAL ATTAINMENT
Population 25 years and over 194,429
Less than 9th grade 2.5%
9th to 12th grade, no diploma 6.2%
High School graduate (includes equivalency) 34.8%
Some college, no degree 19.6%
Associates degree 8.4%
Bachelor’s degree 19.7%
Graduate or professional degree 8.9%
Percent high school graduate or higher 91.3%
Percent bachelor’s degree or higher 28.5%
Note: Population, race, ethnicity, median household income, poverty, and educational attainment
data from the American Community Survey 3 Year Estimates, 2011-2013. Foreign born data
source is the American Community Survey 5 Year Estimates, 2008-2012. The Real Cost of
Living in New Jersey analysis by the Poverty Research Institute, Legal Services of New Jersey,
2013. Asset Limited, Income Constrained, Employed (“ALICE”) data, ranking and analysis by
Halpin 2012. Unemployment data from the Bureau of Labor Statistics, Local Area
Unemployment Statistics, 7 January 2015.

ECONOMIC INDICATORS AND QUALITY OF LIFE 51
Table 14
Ocean County
POPULATION
Total Population 581,223
Median Age 42.8
Under 5 years 6.8%
18 years and over 76.5%
21 years and over 73.3%
62 years and over 25.2%
65 years and over 21.4%
RACE, ETHNICITY & ORIGINS
White 93.2%
Black or African American 3.7%
American Indian and Alaska Native 0.7%
Asian 2.3%
Native Hawaiian and Other Pacific Islander 0%
Some Other Race 1.8%
Hispanic or Latino of any race 8.7%
Foreign Born 7.9%
INCOME AND COST OF LIVING
Median Household Income $60,156
Real Cost of Living $69,857
Percentage Below Poverty Level 10.8%
Percentage ALICE 33%
Percentage Unemployed 7.7%
EDUCATIONAL ATTAINMENT
Population 25 years and over 400,975
Less than 9th grade 3.5%
9th to 12th grade, no diploma 6.6%
High School graduate (includes equivalency) 37.3%
Some college, no degree 19.7%
Associates degree 6.9%
Bachelor’s degree 17.3%
Graduate or professional degree 8.6%
Percent high school graduate or higher 89.8%
Percent bachelor’s degree or higher 25.9%
Note: Population, race, ethnicity, median household income, poverty, and educational attainment
data from the American Community Survey 3 Year Estimates, 2011-2013. Foreign born data
source is the American Community Survey 5 Year Estimates, 2008-2012. The Real Cost of
Living in New Jersey analysis by the Poverty Research Institute, Legal Services of New Jersey,
2013. Asset Limited, Income Constrained, Employed (“ALICE”) data, ranking and analysis by
Halpin 2012. Unemployment data from the Bureau of Labor Statistics, Local Area
Unemployment Statistics, 7 January 2015.

ECONOMIC INDICATORS AND QUALITY OF LIFE 52
Table 15
Salem County
POPULATION
Total Population 65,651
Median Age 41.6%
Under 5 years 5.9%
18 years and over 77.2%
21 years and over 73.2%
62 years and over 20%
65 years and over 15.9%
RACE, ETHNICITY & ORIGINS
White 81.7%
Black or African American 15.4%
American Indian and Alaska Native 0.8%
Asian 1.3%
Native Hawaiian and Other Pacific Islander N
Some Other Race 3%
Hispanic or Latino of any race 7.4%
Foreign Born 4%
INCOME AND COST OF LIVING
Median Household Income $59,202
Real Cost of Living $52,184
Percentage Below Poverty Level 14.1%
Percentage ALICE 29%
Percentage Unemployed 6.7%
EDUCATIONAL ATTAINMENT
Population 25 years and over 45,168
Less than 9th grade 5.1%
9th to 12th grade, no diploma 8.7%
High School graduate (includes equivalency) 38.6%
Some college, no degree 18.6%
Associates degree 8.4%
Bachelor’s degree 14.5%
Graduate or professional degree 6.0%
Percent high school graduate or higher 86.2%
Percent bachelor’s degree or higher 20.5%
Note: Population, race, ethnicity, median household income, poverty, and educational attainment data
from the American Community Survey 3 Year Estimates, 2011-2013. Foreign born data source is the
American Community Survey 5 Year Estimates, 2008-2012. The Real Cost of Living in New Jersey
analysis by the Poverty Research Institute, Legal Services of New Jersey, 2013. Asset Limited, Income
Constrained, Employed (“ALICE”) data, ranking and analysis by Halpin 2012. Unemployment data from
the Bureau of Labor Statistics, Local Area Unemployment Statistics, 7 January 2015. “An 'N' entry in the
estimate and margin of error columns [foreign born] indicates that data for this geographic area cannot be
displayed because the number of sample cases is too small” (American Community Survey, 5 Year
Estimates, 2008-2012).

IN BRIEF Mission The William J. Hughes Center for Public Policy continues to expand its civic engagement mission and “serves as a catalyst for research on public policy and economic issues.” The Hughes Center focuses on the importance of civility in government as a way to bridge partisan differences and make government work. The Hughes Center promotes the civic life of our community through engagement, education and research. The Center is named for William J. Hughes, whose distinguished career includes service in the U.S. House of Representatives, Ambassador to Panama and teaching as a Distinguished Visiting Professor at the university. Symposia, Lectures and Panel Discussions The Center sponsors candidate lectures, panel discussions, and symposia. In November 2013, the Hughes Center and the Stockton School of Health Sciences brought together 600 citizens, students and health care professionals to discuss the Affordable Care Act. Some of our distinguished speakers included: former New Jersey Governors Brendan T. Byrne, Thomas H. Kean, James J. Florio, and Christine Todd Whitman; former New Mexico Governor and U.N. Ambassador Bill Richardson; New Jersey Supreme Court Chief Justice Stuart Rabner; then - E.P.A. Administrator Lisa Jackson, then-U.S. Attorney Chris Christie, National Advisory Board member Ruth Katz of the Aspen Institute; and, Nelson Johnson, author of three important New Jersey books: Boardwalk Empire, The Northside, and Battleground New Jersey. Survey Research The Stockton Polling Institute, part of the Hughes Center, conducts independent public opinion polling on elections and issues of importance across the state and the region. The Polling Institute relies on a student-based interview team, providing students with a first-hand opportunity to learn about public opinion and policymaking. It conducts about a dozen polls each year for the public, faculty, private clients, and the university. Research The Hughes Center conducts its own research and partners with the college’s distinguished faculty on public policy research. Major research projects include: • Understanding the United States Constitution and the Supreme Court: A Survey of New Jerseyans
– Professors Linda Wharton and James Avery • Economic Opportunity and Quality of Life in Southern New Jersey Report – Researcher Kelly
Sloane • Assessing the Impact of Civic Engagement Programs at Stockton University - Professors Sonia
Gonsalves and Ramya Vijaya. • New Jersey State Legislature: A Demographic Profile – John Froonjian, Senior Research Associate
Higher Education Strategic Information and Governance (HESIG) The Hughes Center includes the Higher Education Strategic Information and Governance (HESIG) project, which examines affordability and value of a college degree. HESIG has worked with the Stockton Polling Institute to produce three important studies. The most recent survey, under the direction of Dr. Darryl Greer, was commissioned by the Office of the Secretary of New Jersey Higher Education regarding student views of academic advising and career counseling.

Legislator-in-Residence The Legislator-in-Residence program brings state legislators to the Stockton campus, allowing students to learn about state issues important to our region and introducing lawmakers to what makes Stockton so distinctive. Past participants include Senate President Steve Sweeney, General Assembly Speaker Sheila Oliver, Majority Leader Louis Greenwald, State Senators Chris Connors and Jim Whelan, and Assembly members David Wolfe, Brian Rumpf, and DiAnne Gove. Congress-to-Campus Congress to Campus brings together former Members of Congress to visit colleges and universities to promote civic engagement with students, faculty and staff. Visiting Stockton from October 12-14, 2014 were Robert Clement, a Democrat who represented Tennessee’s 5th District from 1988-2003, and Louis Frey, a Republican who served Florida’s 9th District from 1973-1979, and Florida’s 5th district from 1969- 1973. Candidate Debates Since the earliest years of the Hughes Center, we have sponsored debates for candidates for federal and state candidates. This year we will offer debate forums in legislative districts 1 and 2. Debates in previous years have been held on the main campus in Galloway, at Dante Hall in Atlantic City and live streamed on the Internet. Civic Education with iCivics The iCivics program, started by former U.S. Supreme Court Justice Sandra Day O’Connor, provides civics teachers with interactive learning games that promote the understanding of civics. The goal of iCivics at Stockton is to train social studies teachers to use these Web-based activities in their classrooms. A Verizon Foundation grant is funding the cost of instruction, instructors, training sessions, and assessment study. Washington Internship Program Scholarships The Hughes Center provides scholarships for two students each year for the Washington Internship Program. The Hughes Center scholarship program was established in 2011 with funds raised through the Center's Civility in Government and Politics awards dinner, and has since awarded $7,000 to seven deserving students. Scholarships are meant to help defray costs for students who are interning through the Washington Internship Program. Hughes Center Honors The Hughes Center Honors recognize individuals (business, labor, community, governmental, alumni and student leaders) for professional excellence and a commitment to public service, civility and bipartisanship which reflects the life and career of William J. Hughes. Distinguished Lifetime Achievement Awards were given to former Governor Brendan T. Byrne in 2013, and to former Governor Thomas H. Kean in 2015. American Democracy Project The Hughes Center is active in the Political Engagement Project through the American Democracy Project sponsored by the American Association of State Colleges and Universities (www.aascu.org). A Stockton delegation will be presenting at their annual conference in June 2015 and is involved in the ADP Economic Inequality Initiative. Connecting The Hughes Center communicates through its website (www.stockton.edu/hughescenter), a public policy blog (blogs.stockton.edu/policyhues), newsletters, emails, Twitter and Facebook.

STEERING COMMITTEE
Dr. Edward H. Salmon, Chairman Ambassador William J. Hughes Steve Batzer Mark L. Blum Yvonne Bonitto-Doggett Hon. Fred Butler Edward Graham Dr. Anne Harlan Ronald Johnson Vincent Maione Hon. Frank Minor Hon. Steven P. Perskie Charles Pessagno David Tilton Richard Tolson Michael Tuosto William Varley Jennifer Young Dr. Harvey Kesselman, Acting President Dr. Susan Davenport, Interim Provost & Executive Vice President Dr. David L. Carr, Professor, Political Science Dr. Tina Zappile, Assistant Professor, Political Science Sara Toscano, Student Representative Angelo Bechara, Student Senate Government Affairs Committee Chair Sharon Schulman, CEO, External Affairs and Institutional Research Daniel J. Douglas, Director
NATIONAL ADVISORY BOARD
Dean Luke Bierman Hon. Bill Bradley Hon. Brendan T. Byrne Hon. Robert DelTufo Hon. Mickey Edwards Ms. Kristen Grimm Ms. Ruth J. Katz Hon. Virginia A. Long Hon. Bill Richardson Hon. Lindsay Thomas Hon. John E. Wallace, Jr. Hon. Christine Todd Whitman
FOUNDING ENDOWMENTS
Mr. & Mrs. Stephen Chazen
Mr. & Mrs. William J. Hughes and Family
South Jersey Industries
New Jersey American Water Company
Atlantic City Electric Company
Mr. & Mrs. Steve Batzer
Exelon Corp.
Public Service Enterprise Group
Salmon Ventures Limited
Thomas H. Heist Family
Tribhuvan & Nandita Singh
Verizon