Dopartment ofArl and Applid :Economicsageconsearch.umn.edu/bitstream/14280/1/p90-30.pdf ·...
61
: - :: ^^^^: L-Staf Pa;per Series0000 ^; ; /:f : ; ^,-::- : S taf Pape P90-3 : ~^* ; : f; :E::: ;0 Aprl :::: ^;^^. 0 0 00; ;':" ; I M T OF CtE: ;: FINA; NIA ;CRSI::; RE"SULTS, O TE 199 REINA FAM S R :URV FO SMINNESOTA: : ;: ~:f:Kent D. O;s Ga Cn hris L. MikesI1 1 i Dopartment ofArl and Applid :Economics :: : :::i : f;$f-t.;0 F:L=.0:S-:0E ffX f 'S a M ne t '50 8: : : -td0:::00E fL;tSSXtX 00'L 0 0 000 0f E ff fff0:0 d~;;000XI000:;0:;0.0 00:f :;--000 i: t.;0 X ;f nioeoi.ff::: ;0 000; :90t :;;0000:: 0: f0 W0 :0 \ i~~~~r;-X-70000S197;E~~~~~~~~~~1:sSX-- fA t 0 \-, If ff000f
Transcript of Dopartment ofArl and Applid :Economicsageconsearch.umn.edu/bitstream/14280/1/p90-30.pdf ·...
: - : : ^^^^: L-Staf Pa;per Series0000 ^; ; /:f : ; ̂,-::- :
S taf Pape P90-3 : ~^* ; : f; :E::: ;0 Aprl ::::
^;^^. 0 0 00; ;':" ; I M T OF CtE: ;: FINA; NIA ;CRSI::;
RE"SULTS, O TE 199 REINA FAM S R :URVEY FO SMINNESOTA: : ;:
~:f:Kent D. O;s Ga Cn hris L. MikesI1 1 i
Dopartment ofArl and Applid :Economics
:: : :::i : f;$f-t.;0 F:L=.0:S-:0E ffX f 'S a M ne t '50 8: :
: -td0:::00E fL;tSSXtX 00'L 0 0 000 0f E ff fff0:0d~;;000XI000:;0:;0.0 00:f :;--000 i: t.;0 X ;f nioeoi.ff::: ;0 000; :90t :;;0000:: 0: f0 W0 :0
\ i~~~~r;-X-70000S197;E~~~~~~~~~~1:sSX-- fA t 0 \-, If ff000f

IMPACTS OF THE FARM FINANCIAL CRISIS:
RESULTS OF THE 1989 REGIONAL FARM SURVEY FOR MINNESOTA
by
Kent D. Olson and Chris L. Mikesell*
Olson is an assistant professor and Mikesell is a research assistantin the Department of Agricultural and Applied Economics, University ofMinnesota, Twin Cities. This research was conducted as part of MinnesotaExperiment Station Project No. 14-22 as a contributing project to theRegional Project NC-184 entitled "Rural Development Strategies to MediateFarm Crisis Impacts on Families and Communities," and was supported in partby the North Central Regional Center for Rural Development. The authorsare indebted to Paul Lasley and the NC-184 committee for the development ofthe survey instrument and initial report outline and to Carroll Rock,George House, Roger Binning, and their staff at Minnesota AgriculturalStatistics Service for advice on and mailing of the survey.
Staff Papers are published without formal review within the Departmentof Agricultural and Applied Economics.
The University of Minnesota is committed to the policy that allpersons shall have equal access to its programs, facilities, and employmentwithout regard to race, religion, color, sex, national origin, handicap,age, veteran status or sexual orientation.
IMPACTS OF THE FARM FINANCIAL CRISIS:RESULTS OF THE 1989 REGIONAL FARM SURVEY FOR MINNESOTA
by Kent D. Olson and Chris L. Mikeselll
While much public attention has focused on the farm crisis, little
scientific inquiry has been directed at understanding its long-term
consequences. Extensive media coverage has focused on the tragedies of the
crisis, the distress associated with economic hardship, and the farmers'
protest against the "causes" of the crisis. Beyond these journalisticaccounts of the personal stories of loss, there is very little
documentation about the extent or severity of the farm crisis and how these
experiences have altered farm families' behaviors and attitudes. Some
national and state surveys of farm operators have addressed the needed
financial adjustments such as debt-asset ratio, cash flow analysis and
lender restructuring options (Melichar, 1984; Jolly, et al, 1985). Other
more limited studies have focused on case studies of the farm crisis
(Heffernan and Heffernan, 1986; Salamon and Davis-Brown, 1986). Still
other studies have examined the severity of the farm crisis within
individual states (Leistritz, 1986; Bultena, et al, 1986). However, a
regional assessment or perspective of the consequences of the farm crisis
was difficult, given that little was known about how economic hardship has
affected longer-term adjustments in farm operations or its influence on
farm family functioning and individual well-being.
To provide more knowledge of how farm families have been affected, a
regional study was conducted in the twelve North Central States. These
states included Illinois, Indiana, Iowa, Kansas, Michigan, Minnesota,
Missouri, Nebraska, Ohio, North Dakota, South Dakota, and Wisconsin. This
report summarizes data collected from a sample of Minnesota farm families
as part of the larger study. The survey was conducted through the
cooperation of the University of Minnesota and the Minnesota AgriculturalStatistics Service.
The purpose of the survey was to:
1. Identify what adjustments farm families made during the 1980s in
response to the farm crisis,
1Olson is an assistant professor and Mikesell is a research assistant
in the Department of Agricultural and Applied Economics, University of
Minnesota, Twin Cities. This research was conducted as part of Minnesota
Experiment Station Project No. 14-22 as a contributing project to the
Regional Project NC-184 entitled "Rural Development Strategies to Mediate
Farm Crisis Impacts on Families and Communities," and was supported in part
by the North Central Regional Center for Rural Development. The authors
are indebted to Paul Lasley and the NC-184 committee for the development of
the survey instrument and initial report outline and to Carroll Rock,
George House, Roger Binning, and their staff at Minnesota Agricultural
Statistics Service for advice on and mailing of the survey.

3
2. Identify information and educational needs of farm families, and
3. Assess farm families opinions about several importantagricultural and rural development issues.
Methodology
In February, 1989, a statewide random sample of 700 farm operators andspouses was contacted. A packet of two questionnaires were sent--one forthe farm operator (Appendix C) and the other for the spouse (Appendix D).One set of questions were answered by both operator and spouse; otherquestions were answered only by the operator or by the spouse.
There were 275 operator surveys returned for a response rate of 39percent and 245 spouse surveys returned for a response rate of 35 percent.Of these, 229 were matched questionnaires for both the spouse and theoperator for a response rate of 33 percent. The distribution of responsesamong Minnesota counties is shown in Figure 1.
Nonresponse and Weighting
As the response rate for this survey was only 39 percent, thepossibility of nonresponse bias in the survey responses requires someconsideration.2
Nonresponse bias can be of two forms--the first case occurswhen the distribution of the survey respondents by selectedcharacteristics is different from the distribution in the populationwith these same characteristics. A weighting procedure may be usedso the survey responses will reflect the population proportions.This weighting procedure is justified only if the individual'scharacteristics affect their behavior and the responses to the surveyquestions.
To correct for the nonresponse bias arising from the above case,two characteristics of the farm population were chosen for comparisonwith the survey respondents: age of the farm operator and gross farmsales (a measure of farm size). Data for the farm population wasobtained from the 1987 Census of Agriculture. The distribution ofthe survey respondents by age and gross farm sales was found to besomewhat different than the farm population, thus indicating a biasin the survey results. The survey data was then adjusted to reflectthe characteristics of the farm population.
The weighting matrix is reported in Appendix A Table 1.Differences in the distributions of the unweighted and weightedobservations for selected characteristics can be found in Appendix ATables 2 and 3.
2This section follows the procedures used by Saupe andEisenhauer (1989).

4
The second type of bias arises if the nonrespondents wouldanswer differently than respondents with the same characteristics.In this case information about the nonrespondents is needed tocorrect for the bias. In order to gain this information 28 operatorand 35 spouse nonrespondents were interviewed by telephone and askedseveral of the questions from the mail survey. Appendix B provides adiscussion of comparisons made.
Respondents' Characteristics
The average ages of the farm operator and spouse in the surveywere 48.5 and 45.9 (Table 1). The average age of farm operators inthe 1987 Minnesota Census of Agriculture was also 48.5. The twobiggest age groups as a percentage of the total were the 25-34 and35-44 year old group; these were the largest group in the 1987 Censusalso. Almost nineteen percent of the surveyed operators were lessthan 35 years old; 12.4 percent were over 65. The age distributionof the spouses was slightly younger reflecting the younger average.
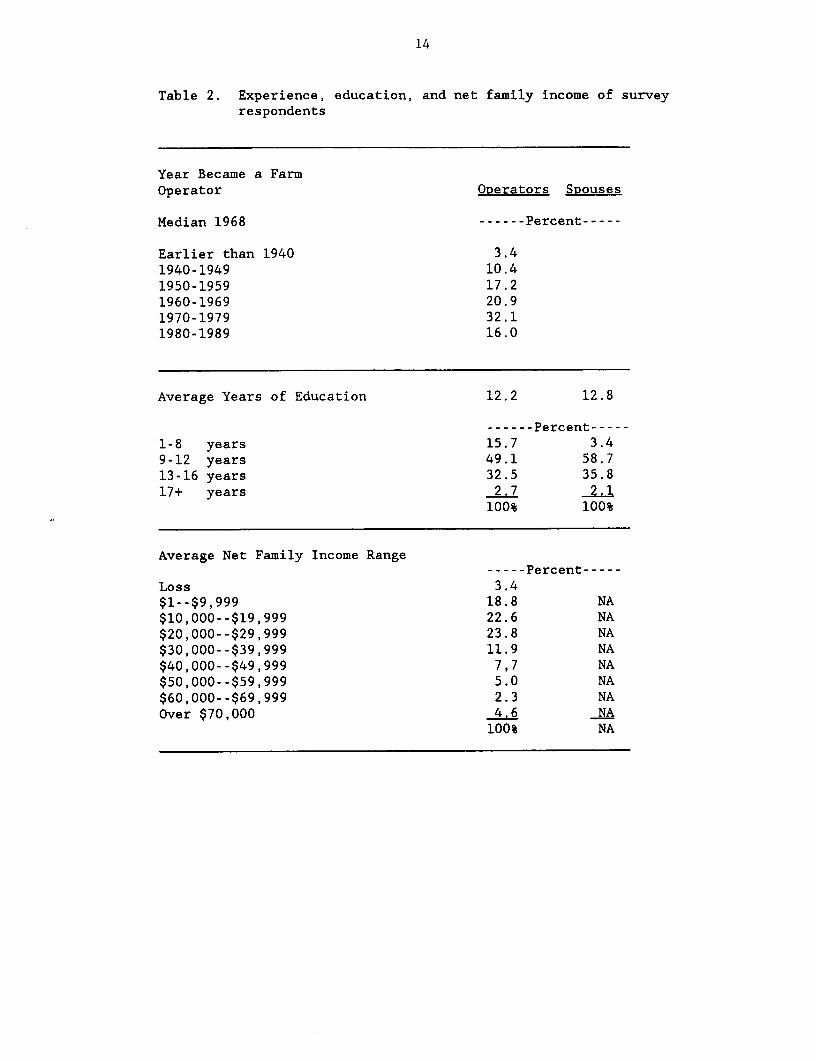
Thirty-two percent of the farmers in the survey had become afarm operator in the decade of the 1970s (Table 2). The percentageper decade declines farther back in time with only 3.4 percent of therespondents starting earlier than 1940. The median year for startingwas 1968. Only sixteen percent of the respondents started farming inthe decade of the 1980s; this smaller percent reflects the financialtroubles of those years which probably discouraged some from startingfarming, did not allow others to start farming, and caused others tostart and stop within that decade.
On average, operators had 12.2 years of education; that is, onaverage operators finished high school and a small amount of post-high school education. The spouses averaged 12.8 years of education.14.9 percent of the operators finished eighth grade but did not go onfor further schooling. Forty-nine percent had between 9 and 12 yearswith 79.7 percent of the operators having finished school. Thirty-two point five percent had some college education with 13.8 percentfinishing college. Almost 3 percent of the operators had donegraduate work. In general, the spouses had received more education;94 percent had finished high school and 14.2 percent had finishedcollege.
Average net family income from all sources for 1988 were in thelower range of those specified. Fully two-thirds of the operatorsreported income below $30,000. Almost half of the farm operatorsreported their net family income to be between $10,000 and $30,000.Less than 5 percent had income over $70,000.
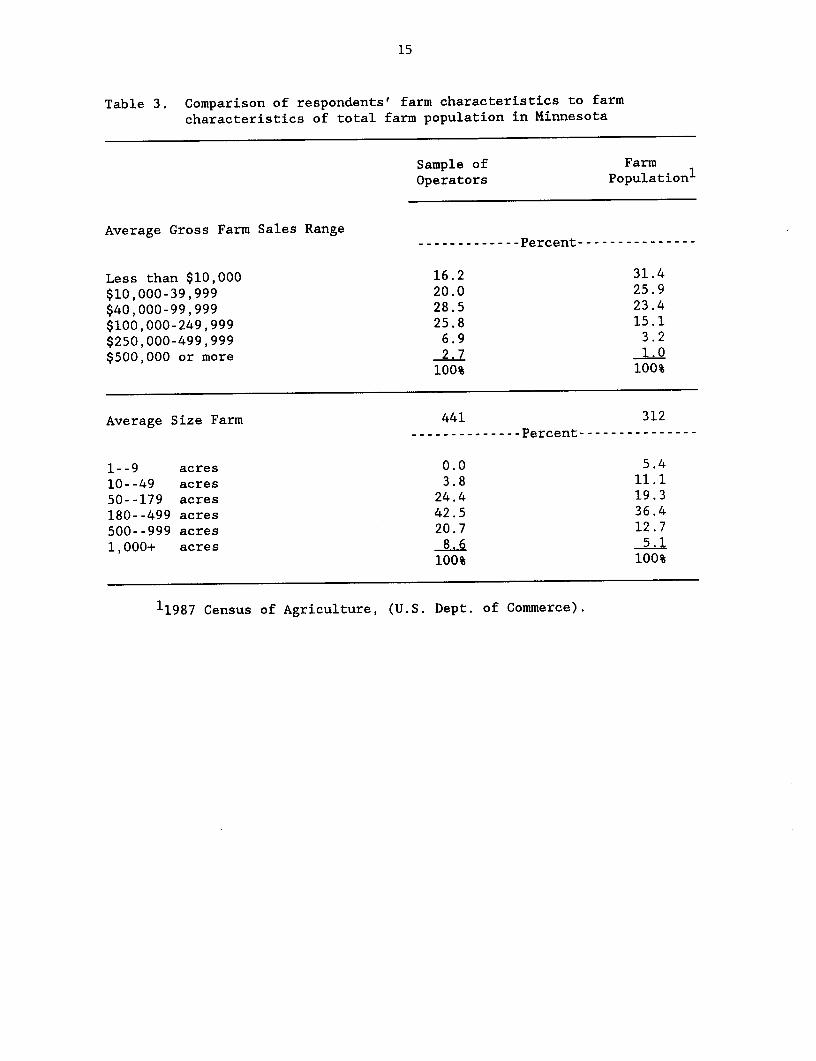
Sixteen percent of the sample farms had average gross farm salesof less than $10,000 compared to 31 percent of the population (Table3). Just under half of the surveyed farms and the population hadgross farm sales in the $10,000 to $99,999 range. Thirty-five

5
percent of the survey farms had sales of $100,000 or more compared to
19.3 percent of the population. 2.7 % of the surveyed farms had
sales of $500,000 or more compared to 1 percent of the population.
In terms of acreage, the sample farms were larger than the
population of all farms. The average size farm was 441 acres in the
sample of operators compared to 312 acres in the 1987 Census (Table
3). Only 3.8 percent of the survey farm were less than 50 acres
compared to 16.5 percent in the population. 8.6 percent of the farms
in the sample had over 1000 acres compared to 5 percent in the
population.
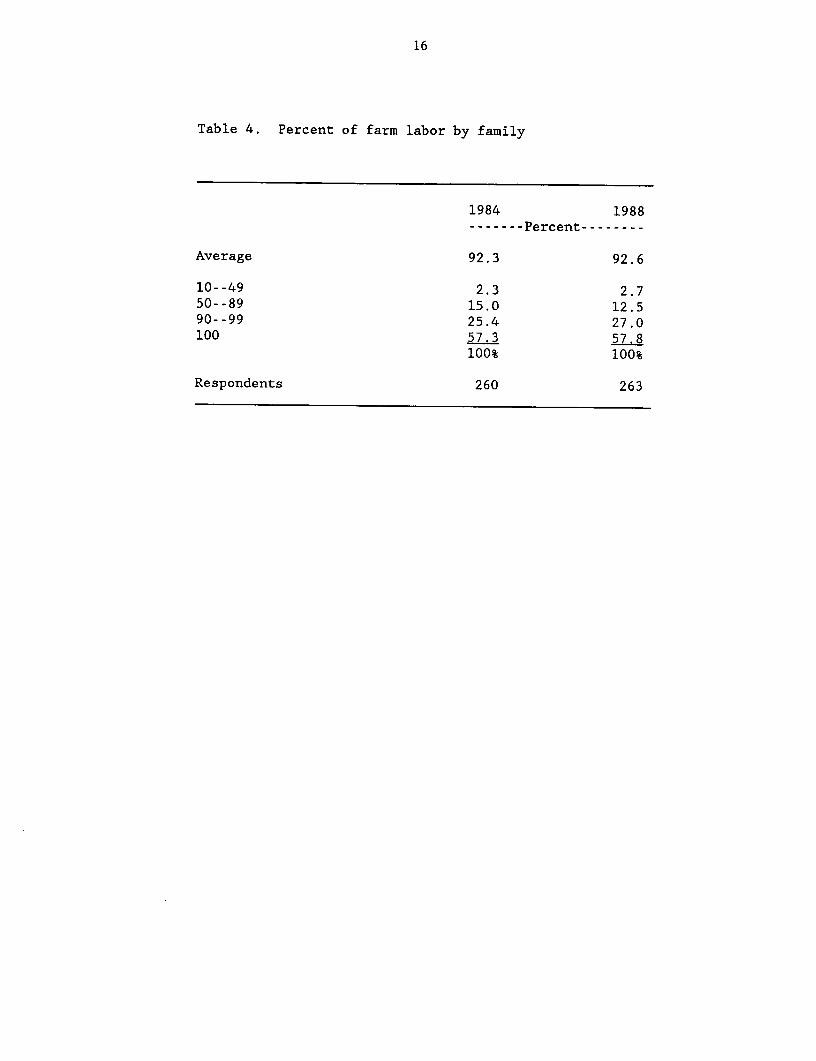
The proportion of labor supplied by the family changed verylittle between 1984 and 1988 (Table 4). Over 90% of the labor was
supplied by the family on average. Less than 3 percent of the
respondents supplied less than 50% of the labor.
Farming Intensity and Diversification
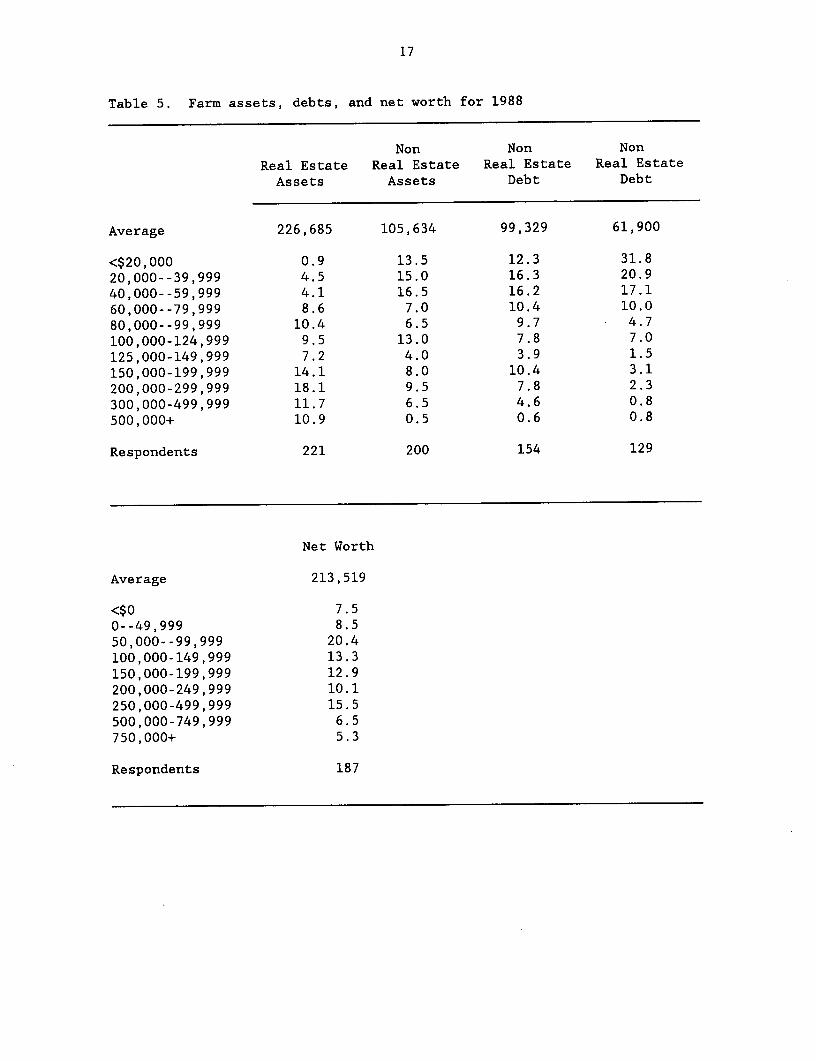
The average farm had real estate assets valued at $226,685 and
nonreal estate assets of $105,634 (Table 5). Forty-five percent offarmers had real estate assets valued at less than $200,000. Thesame percentage had non real estate assets of less than $60,000.
Only eleven percent of farms had real estate valued at more than
$500,000.
Thirty five percent of farms had real estate debt of more than
$100,000 and sixteen percent of farms had non real estate debt of
more than $100,000. The average real estate debt was $99,329 and non
real estate debt of $61,900. Net worth was calculated for each of
the 187 farms providing the necessary information. Almost eight
percent of the farms were insolvent, that is with total debtexceeding total assets. Sixteen percent had net worth of less than
$100,000 while twenty seven percent had net worth of more than
$250,000. The average calculated net worth was $213,519.
The average farm contained 441 acres of land up from 405 in 1984
(Table 6). The average owned acreage was 280 acres and the averagerented acreage was 294 acres. Twenty-six respondents leased an
average of 105 acres to other farmers. (These acreages were
calculated by using the number of responses in each category. Thus
the total average will not equal the owned plus rented minus rented
out average.) Twenty-eight percent of farms were less than 180 acres
in size; twenty-nine percent had more than 500 acres. Compared to
1984, owned and rented acreages increased only slightly.
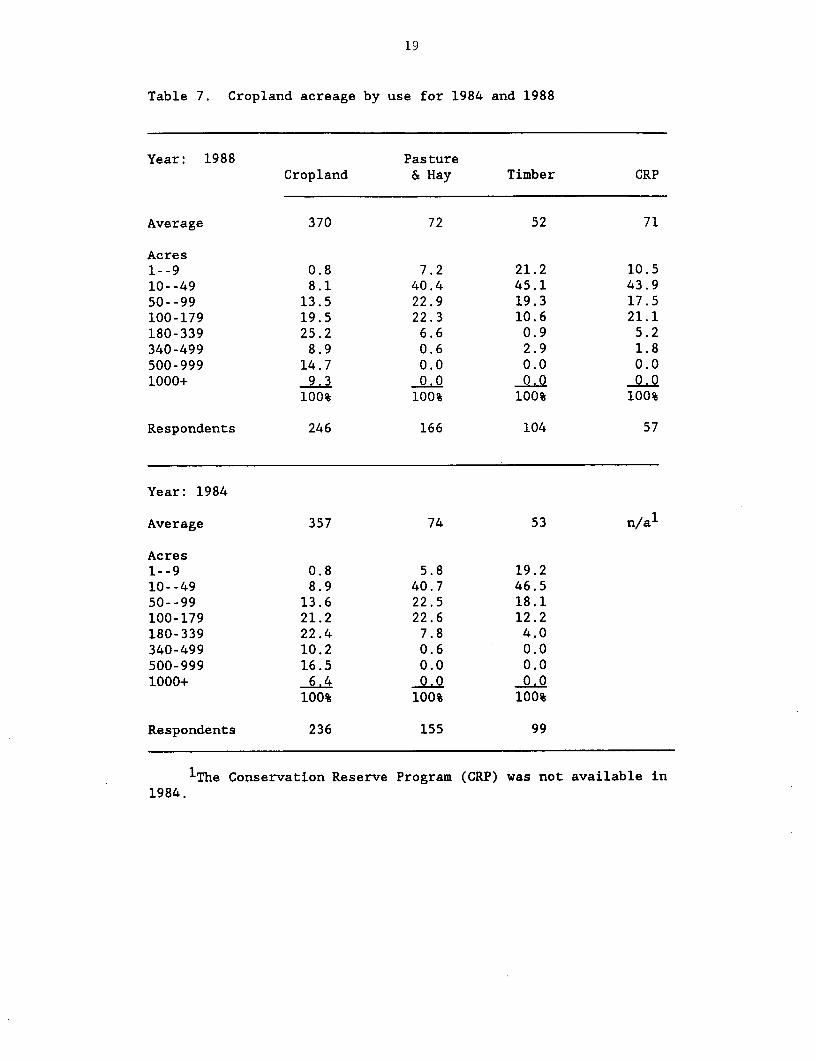
Total cropland increased between 1984 and 1988 even though the
introduction of the conservation reserve program (CRP) removed an
average of 71 acres from production on 57 farms (Table 7). Pasture,
hay, and timber land remained unchanged from 1984 to 1988.

6
Corn production decreased slightly and soybean productionremained essentially the same between 1988 and 1984 (Table 8). Theaverage farm had 134 acres of corn and 149 acres of soybeans in 1988.Wheat, oats and other crop production also remained essentiallyunchanged.
Livestock production also changed very little (Table 9). Theaverage farm had 78 head of feeder cattle, 28 head of beef cows and49 head of dairy cows in 1988. Thirty-nine percent of the farmshaving beef cows had less than 20 head while only six percent offarms with dairy cows had herds this small. Forty-two farms had anaverage of 87 head of sows in 1988. This was an increase of 17 headfrom 1984. Almost 65% of the farms with swine had more than 75 sows.
There were twelve farms with ewes in 1988 with an average of 37head. The number of ewes ranged from 89 head to a single ewe.Eighteen farms reported owning laying hens in 1988. This ranged from5 hens to 1700 hens with an average of 177 layers. There were onlytwo farms with turkeys. One being a large farm with 10,000 birds.
Local Services. Facilities, and Economic Conditions
One series of questions asked for the farm operators' opinionson whether local services, facilities, and economic conditions hadchanged in the past five years and how they had changed if they had.Although there is a difference of opinion, a majority of theoperators felt that these had remained the same over the past fiveyears: quality of schools, health care services, police and fireprotection, banking services, and opportunities for entertainment andrecreation (Table 10). A majority of the operators felt that thesehad improved or remained the same: child care facilities, shoppingfacilities, and adult education opportunities. Of the services andfacilities, job opportunities was the only category in which aplurality (42%) felt that it had gotten worse over the past fiveyears.
Of the four financial condition points, a majority felt that thefinancial condition of farmers and of agribusiness firms had gottenworse although there was a difference of opinion on this point also.A majority of the operators said that the financial condition oflenders had either remained the same or gotten worse. When askedabout the financial condition of their own farms, the operators werefairly evenly divided between improved, remained the same and gottenworse.
Ouality of Life
Although a plurality of operators and spouses (45 and 38percent, respectively) felt that their family finances have becomebetter during the past five years, 28 percent of the operators and 35percent of the spouses felt that their finances had gotten worse(Table 11). However, finances are not the total picture of a
7
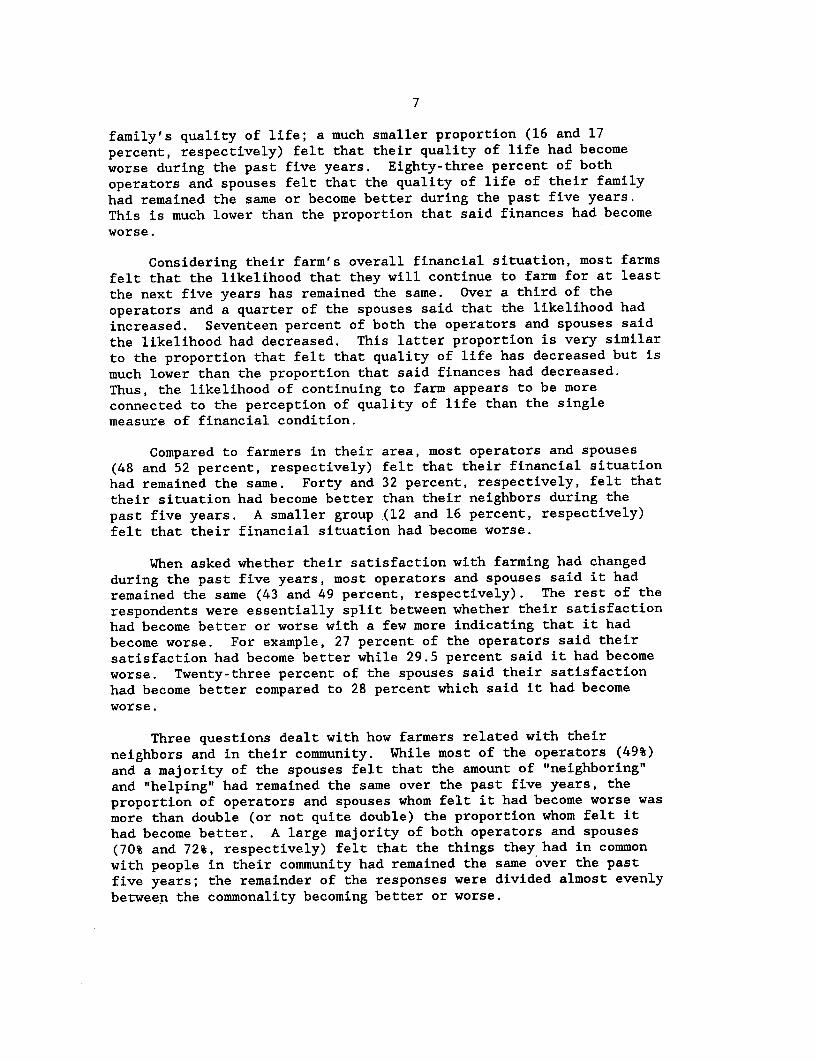
family's quality of life; a much smaller proportion (16 and 17
percent, respectively) felt that their quality of life had become
worse during the past five years. Eighty-three percent of both
operators and spouses felt that the quality of life of their family
had remained the same or become better during the past five years.
This is much lower than the proportion that said finances had become
worse.
Considering their farm's overall financial situation, most farms
felt that the likelihood that they will continue to farm for at least
the next five years has remained the same. Over a third of the
operators and a quarter of the spouses said that the likelihood had
increased. Seventeen percent of both the operators and spouses said
the likelihood had decreased. This latter proportion is very similar
to the proportion that felt that quality of life has decreased but is
much lower than the proportion that said finances had decreased.
Thus, the likelihood of continuing to farm appears to be more
connected to the perception of quality of life than the single
measure of financial condition.
Compared to farmers in their area, most operators and spouses
(48 and 52 percent, respectively) felt that their financial situation
had remained the same. Forty and 32 percent, respectively, felt that
their situation had become better than their neighbors during the
past five years. A smaller group (12 and 16 percent, respectively)
felt that their financial situation had become worse.
When asked whether their satisfaction with farming had changed
during the past five years, most operators and spouses said it had
remained the same (43 and 49 percent, respectively). The rest of the
respondents were essentially split between whether their satisfaction
had become better or worse with a few more indicating that it had
become worse. For example, 27 percent of the operators said their
satisfaction had become better while 29.5 percent said it had become
worse. Twenty-three percent of the spouses said their satisfaction
had become better compared to 28 percent which said it had become
worse.
Three questions dealt with how farmers related with their
neighbors and in their community. While most of the operators (49%)
and a majority of the spouses felt that the amount of "neighboring"
and "helping" had remained the same over the past five years, the
proportion of operators and spouses whom felt it had become worse was
more than double (or not quite double) the proportion whom felt it
had become better. A large majority of both operators and spouses
(70% and 72%, respectively) felt that the things they had in common
with people in their community had remained the same over the past
five years; the remainder of the responses were divided almost evenly
between the commonality becoming better or worse.
8
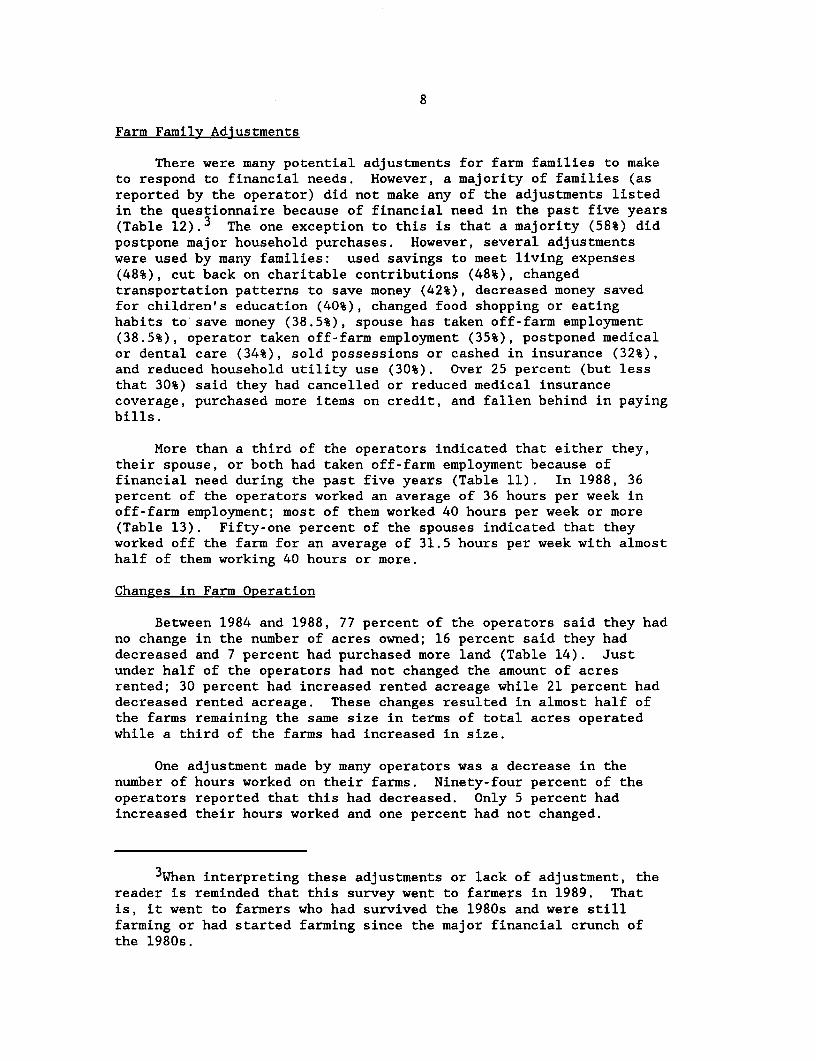
Farm Family Adjustments
There were many potential adjustments for farm families to maketo respond to financial needs. However, a majority of families (asreported by the operator) did not make any of the adjustments listedin the questionnaire because of financial need in the past five years(Table 12). 3 The one exception to this is that a majority (58%) didpostpone major household purchases. However, several adjustmentswere used by many families: used savings to meet living expenses(48%), cut back on charitable contributions (48%), changedtransportation patterns to save money (42%), decreased money savedfor children's education (40%), changed food shopping or eatinghabits to'save money (38.5%), spouse has taken off-farm employment(38.5%), operator taken off-farm employment (35%), postponed medicalor dental care (34%), sold possessions or cashed in insurance (32%),and reduced household utility use (30%). Over 25 percent (but lessthat 30%) said they had cancelled or reduced medical insurancecoverage, purchased more items on credit, and fallen behind in payingbills.
More than a third of the operators indicated that either they,their spouse, or both had taken off-farm employment because offinancial need during the past five years (Table 11). In 1988, 36percent of the operators worked an average of 36 hours per week inoff-farm employment; most of them worked 40 hours per week or more(Table 13). Fifty-one percent of the spouses indicated that theyworked off the farm for an average of 31.5 hours per week with almosthalf of them working 40 hours or more.
Changes in Farm Operation
Between 1984 and 1988, 77 percent of the operators said they hadno change in the number of acres owned; 16 percent said they haddecreased and 7 percent had purchased more land (Table 14). Justunder half of the operators had not changed the amount of acresrented; 30 percent had increased rented acreage while 21 percent haddecreased rented acreage. These changes resulted in almost half ofthe farms remaining the same size in terms of total acres operatedwhile a third of the farms had increased in size.
One adjustment made by many operators was a decrease in thenumber of hours worked on their farms. Ninety-four percent of theoperators reported that this had decreased. Only 5 percent hadincreased their hours worked and one percent had not changed.
3When interpreting these adjustments or lack of adjustment, thereader is reminded that this survey went to farmers in 1989. Thatis, it went to farmers who had survived the 1980s and were stillfarming or had started farming since the major financial crunch ofthe 1980s.
9
Sixty-nine percent of the operators reported that the sameamount of family labor was being used on the farm in 1988 as in 1984.Twenty percent of the farms had increased family labor while 12percent had decreased.
A majority of farmers made these changes in how they managedtheir farm between 1984 and 1988: paid closer attention to marketing(79%), postponed a major farm purchase (70%), kept more completefinancial records (61%), reduced short-term debt (60.5%), and reducedlong-term debt (59%) (Table 14). Other changes made by a largenumber of farmers were: bought crop insurance (48%), shared labor ormachinery with neighbors (44%), reduced expenditures for hired help(43%), diversified their farm by raising livestock (37%), and soughtoff-farm employment (33%).
When the operators looked forward to 1992, a majority said theywould pay closer to marketing (69%), reduce both long-term and short-term debt (56% and 53%, respectively), and keep more completefinancial records (61%). Other changes which were selected asimportant were postponing major farm purchase, sharing labor andmachinery, reducing expenditures for hired help, buying cropinsurance, and diversifying by raising livestock. Changes which werebeing considered but were not as definite included diversifying byadding crops, buying additional land, renting more acres, using thefuture markets to hedge prices, and seeking off-farm employment.Almost a third of the operators said they were considering quittingfarming in the next five years.
Participation in Government Programs
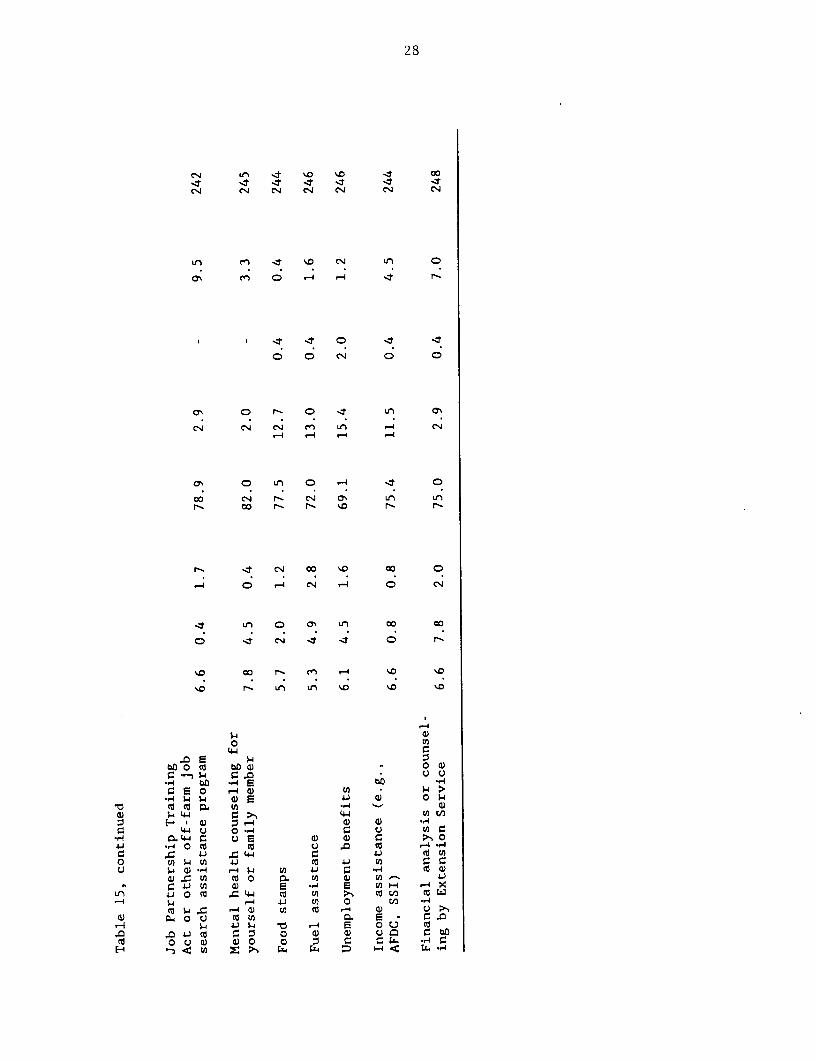
There are a number of government programs and laws designed tohelp farmers. Their participation and evaluation of these programsvaried. Four programs had the highest participation rates: thefederal government commodity programs (76%), the 1988 DroughtAssistance Act (69%), Federal all-risk crop insurance (38.5%), andthe conservation reserve program (CRP; 30%) (Table 15). Farmers hadnot participated in the other programs listed to the same extent asthey had in these just named.
Even in these heavily participated programs, the effectivenessof these programs was evaluated differently. Most of those whoparticipated said the commodity programs were either a lot of help orsome help; only 3 percent said they had participated and found thecommodity programs to be of no help. Even after all these years ofinformation and public exposure, there were still 1.6 percent of therespondents who claimed they did not know about the commodityprograms. Sixty-two percent of the operators had participated in the1988 Drought Assistance Act and felt the program had helped themeither a lot or some. Thirty percent of the farmers did notparticipate in the drought program because it was not needed orbecause they did not qualify. Twenty-seven percent had participated
10
in the Federal all-risk crop insurance and felt that it had been of
help, but 12 percent felt it had not been helpful. Interestingly,
even in February, 1989, after the drought of 1988, 51 percent of the
operators did not participate in the insurance program because they
did not think it was necessary. Forty-five percent felt that the CRP
was not needed and did not participate. In the other programs with
lower participation levels, many of the operators who had
participated indicated that the programs had been of no help. A
majority said they did not participate because the program was not
needed.
Information and Training Needs
The operators were asked to indicate their need for information
and/or training in several areas in order to continue farming in the
next five years. By their responses, there is not a strong showing
of need in any area; the needs are spread between several categories
(Table 16). For 6 of the 9 areas listed, about a third of the
operators said they had a moderate need for information and/or
training. Information and training on new technologies was needed at
some level by 72.5 percent; 31.8% said this area was a high or very
high need. Over half of the operators said the need for information
and training was low or not needed in these areas: processing farm
products on farm before selling (69%), diversification of the farm
(51%), and bookkeeping and financial systems (50%).
Farm Spouses' Duties
There are no surprises in the duties listed by the spouses.
Ninety-two point six percent of the spouses say they always do
household tasks and/or child care; another 5 percent say they do
these task sometimes (Table 17). The care of a vegetable garden or
animals for family consumption was always done by 64 percent and
sometimes by another 25 percent. Bookkeeping and maintaining records
was another task done always by 43.6 percent with another 33 percent
doing it sometimes. Thirty percent of the spouses always ran farm
errands with 64 percent saying they did this sometimes. Working at
an off-farm job was also done by 30 percent of the spouses all the
time and 40.5 percent sometimes. Sixty-five percent of the spouses
said they did field work at least sometimes. Duties which were not
done or never performed by a majority of the spouses were: marketing
of products (80%), purchasing of major supplies and equipment (71%),
and supervising others (58%).
A majority of the spouses said that the time on each of the
duties listed had stayed the same over the past five years except for
the milking and caring for farm animals (49%). Over twenty percent
of the spouses said their time had increased on these duties:
working at an off-farm job (28%), bookkeeping and maintaining records
(24%), and doing household tasks and/or child care (21%). Over
thirty percent of the spouses said their time had decreased on these
duties: milking or caring for farm animals (32%) and field work

11
(30%). Twenty-one percent of the spouses said they had decreasedtheir time spent working at an off-farm job or taking care of agarden or animals for family consumption.
Family Decision-Making Behavior
Buying major household appliances was a decision that 79 percentof the spouses surveyed said they did jointly with their partner(Table 18). This was a much higher percentage than the 60 percentthat said they made a joint decision to buy or sell land. Rentingmore or less land was a joint decision for 49 percent of the spouses.Buying major farm equipment was said to be done by the spouses'spartner in 51 percent of the spouses' responses and in a jointdecision in 45 percent. The decisions of when to sell products andwhether to try a new practice were done with the partner in 57percent of the responses.
Life Pressures and Coping Strategies
From the spouses' responses two pressures can be seen as themost often experienced. Twenty-seven of the spouses said they haddaily problems in balancing work and family responsibilities; 48percent said they had this pressure occasionally (Table 19). Onefourth of the spouses said they felt the pressure of lacking controlover weather and commodity prices on a daily basis; 55 percent feltthis occasionally.
The other pressures were felt by a majority of the spouses atleast occasionally with two exceptions. A majority of the spouseshave almost never felt they had insufficient support in farm orfamily duties. Also, over three-fourths of the spouses either havealmost never had difficulty with child care arrangements or thepressure of child care does not apply to them.
It is also interesting to note that in two instances theresponses are almost evenly divided between feeling pressure daily oroccasionally versus almost never or not applicable. These twopressures are: no farm help or loss of help when needed andindebtedness and debt-servicing problems.
When faced with the pressures just discussed, there are severalcoping strategies that can be used to deal with the pressure. Theone coping strategy which was used "a great deal" by 36 percent ofthe spouses was "participating in church activities" (Table 20).Participating in church activities was also used "quite a bit" by 25percent of the spouses. Only two other strategies were used "a greatdeal" or "quite a bit" by a majority of the spouses were "making aplan of action and following it" (53%) and "noticing people who havemore difficulties in life than I do" (52%). "Reminding myself thatfor everything bad about farming, there is also something good" wasalso used by many spouses. Less than 20 percent used eating,drinking, etc.; refused to think about it; or kept problems a secret.
12
Less than 30 percent sought support from a friend, relative, orminister, and less than 10 percent ever talked to a counselor.
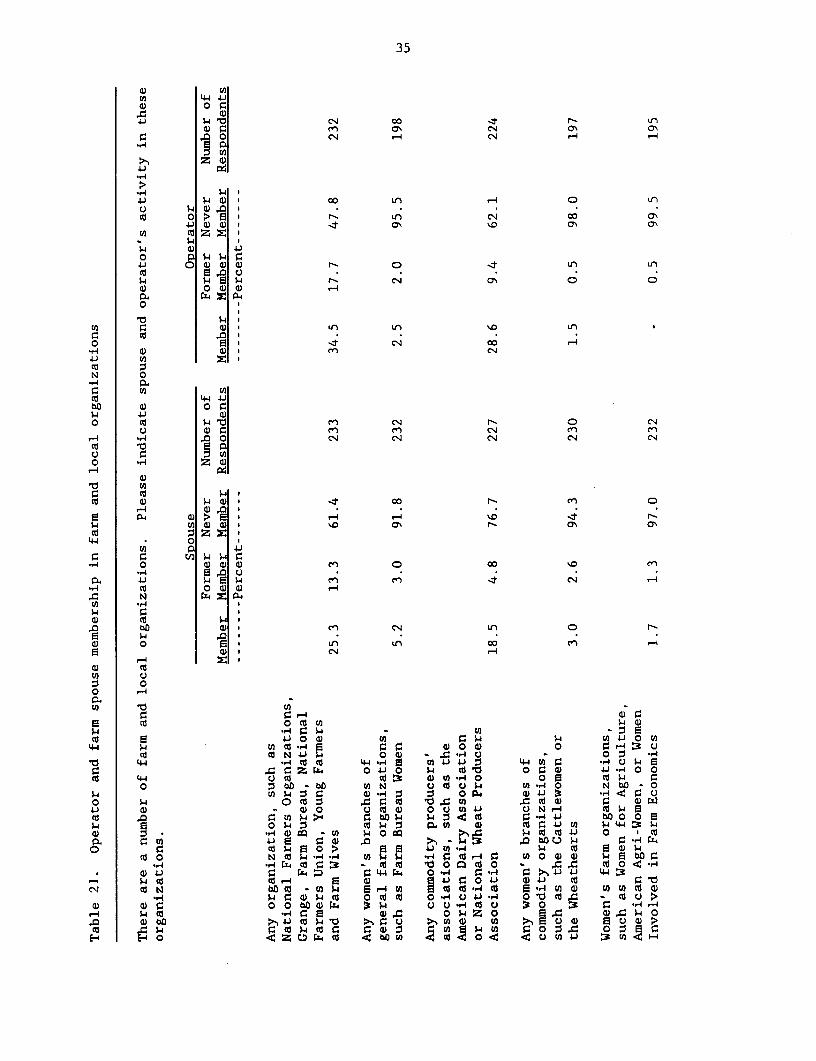
Membership in Organizations
Of the organizations listed, only the farm groups, such as FarmBureau, National Farmers Organizations, Grange, etc., had a majorityof the operators who were current members or had been members (Table21). These groups were the only ones listed by more than 30 percentof the spouses which were or had been members. Other organizationswhich were listed as having more than 30 percent of the operators asmembers were farm supply cooperatives, commodity groups, localgoverning boards, and marketing cooperatives.

13
Table 1. Comparison of the age distribution of operators and spousesbetween respondents and the total farm population in Minnesota
Operators inSample of Sample of FarmOperators Spouses Population1
Average Age 48.5 45.9 48.5
Age ------------- Percent---------------
Less than 25 0.8 2.5 2.825-34 18.7 19.2 16.935-44 23.0 25.4 21.745-49 10.1 12.1 10.550-54 10.6 13.3 11.055-59 10.1 10.4 11.960-64 14.3 10.4 11.065-69 6.0 4.6 7.170 or older 6.4 2.1 7.1
100% 100% 100%
11987 Census of Agriculture, (U.S. Dept. of Commerce).
14
Table 2. Experience, education, and net family income of surveyrespondents
Year Became a FarmOperator Operators Spouses
Median 1968 ------ Percent-----
Earlier than 1940 3.41940-1949 10.41950-1959 17.21960-1969 20.91970-1979 32.11980-1989 16.0
Average Years of Education 12.2 12.8
------ Percent-----1-8 years 15.7 3.49-12 years 49.1 58.713-16 years 32.5 35.817+ years 2.7 2.1
100% 100%
Average Net Family Income Range----- Percent-----
Loss 3.4$1--$9,999 18.8 NA$10,000--$19,999 22.6 NA$20,000--$29,999 23.8 NA$30,000--$39,999 11.9 NA$40,000--$49,999 7,7 NA$50,000--$59,999 5.0 NA$60,000--$69,999 2.3 NAOver $70,000 4.6 NA
100% NA
15
Table 3. Comparison of respondents' farm characteristics to farm
characteristics of total farm population in Minnesota
Sample of Farm
Operators Population1
Average Gross Farm Sales Range------------- Percent---------------
Less than $10,000 16.2 31.4
$10,000-39,999 20.0 25.9
$40,000-99,999 28.5 23.4
$100,000-249,999 25.8 15.1
$250,000-499,999 6.9 3.2
$500,000 or more 2.7 1.0100% 100%
Average Size Farm 441 312-------------- Percent---------------
1--9 acres 0.0 5.4
10--49 acres 3.8 11.1
50--179 acres 24.4 19.3
180--499 acres 42.5 36.4
500--999 acres 20.7 12.7
1,000+ acres 8.6 5.1100% 100%
11987 Census of Agriculture, (U.S. Dept. of Commerce).
16
Table 4. Percent of farm labor by family
1984 1988------- Percent--------
Average 92.3 92.6
10--49 2.3 2.750--89 15.0 12.590--99 25.4 27.0100 57.3 57.8
100% 100%
Respondents 260 263
17
Table 5. Farm assets, debts, and net worth for 1988
Non Non Non
Real Estate Real Estate Real Estate Real Estate
Assets Assets Debt Debt
Average 226,685 105,634 99,329 61,900
<$20,000 0.9 13.5 12.3 31.8
20,000--39,999 4.5 15.0 16.3 20.9
40,000--59,999 4.1 16.5 16.2 17.1
60,000--79,999 8.6 7.0 10.4 10.0
80,000--99,999 10.4 6.5 9.7 4.7
100,000-124,999 9.5 13.0 7.8 7.0
125,000-149,999 7.2 4.0 3.9 1.5
150,000-199,999 14.1 8.0 10.4 3.1
200,000-299,999 18.1 9.5 7.8 2.3
300,000-499,999 11.7 6.5 4.6 0.8
500,000+ 10.9 0.5 0.6 0.8
Respondents 221 200 154 129
Net Worth
Average 213,519
<$0 7.50--49,999 8.550,000--99,999 20.4100,000-149,999 13.3150,000-199,999 12.9200,000-249,999 10.1250,000-499,999 15.5500,000-749,999 6.5750,000+ 5.3
Respondents 187

18
Table 6. Farm size, tenure, and acreage distribution for 1984 and19881
Year: 1988 Total Farm LeasedSize Owned Rented Out
Average 441 280 294 105
Acres1--9 0.0 1.2 1.7 3.810--49 3.8 6.9 11.6 38.550--99 6.0 10.9 11.6 3.9100-179 18.4 25.9 24.8 42.3180-339 27.4 29.6 24.9 7.7340-499 15.1 11.3 9.2 3.8500-999 20.7 11.4 11.6 0.01000+ 8.6 2.8 4.6 0.0
100% 100% 100% 100%
Respondents 246 247 173 26
Year: 1984
Average 405 273 270 121
Acres1--9 0.4 2.2 0.6 0.010--49 4.6 7.6 10.6 25.050--99 6.1 9.3 14.7 20.0100-179 18.8 25.8 27.0 35.0180-339 28.3 30.2 25.9 20.0340-499 16.9 12.0 6.5 0.0500-999 19.2 10.2 11.8 0.01000+ 5.7 2.7 2.9 0.0
100% 100% 100% 100%
Respondents 261 225 170 20
1These averages were calculated by using the number of responses ineach category. Thus, the total average will not equal the owned plusrented minus rented out average.
19
Table 7. Cropland acreage by use for 1984 and 1988
Year: 1988 PastureCropland & Hay Timber CRP
Average 370 72 52 71
Acres1--9 0.8 7.2 21.2 10.510--49 8.1 40.4 45.1 43.950--99 13.5 22.9 19.3 17.5100-179 19.5 22.3 10.6 21.1180-339 25.2 6.6 0.9 5.2340-499 8.9 0.6 2.9 1.8500-999 14.7 0.0 0.0 0.01000+ 9.3 0.0 0.0 0.0
100% 100% 100% 100%
Respondents 246 166 104 57
Year: 1984
Average 357 74 53 n/a1
Acres1--9 0.8 5.8 19.210--49 8.9 40.7 46.550--99 13.6 22.5 18.1100-179 21.2 22.6 12.2180-339 22.4 7.8 4.0340-499 10.2 0.6 0.0500-999 16.5 0.0 0.01000+ 6.4 0.0 0.0
100% 100% 100%
Respondents 236 155 99
1The Conservation Reserve Program (CRP) was not available in1984.

20
Table 8. Major crop acreage for 1984 and 1988
Year: 1988Corn Soybeans Wheat Oats
Average 134 149 201 31
Acres1--9 3.5 2.0 1.4 7.6
10--49 24.0 22.2 29.7 77.1
50--99 25.0 23.5 12.1 11.9
100-179 24.0 22.2 14.9 2.6
180-339 17.0 20.3 25.7 0.8
340-499 2.5 5.2 6.7 0.0
500-999 3.5 3.9 8.1 0.0
1000+ 0.5 0.7 1.4 0.0100% 100% 100% 100%
Respondents 200 153 74 118
Year: 1984
Average 141 147 196 29
Acres1--9 2.0 1.5 1.4 4.2
10--49 22.2 23.5 31.5 82.4
50--99 25.3 20.5 13.7 10.0
100-179 24.2 25.7 17.8 3.4
180-339 20.7 20.5 21.9 0.0
340-499 2.1 4.5 2.7 0.0
500-999 2.5 3.0 9.4 0.0
1000+ 1.0 0.8 1.4 0.0100% 100% 100% 100%
Respondents 198 132 73 119

21
Table 9. Livestock herd sizes for 1984 and 1988
Year: 1988 Feeder Beef DairyCattle Cows Cows Sows
Average 78.3 27.6 49.3 87.2
No. of Head1--10 10.5 23.3 3.0 7.1
10--19 22.4 16.2 3.0 14.3
20--29 11.8 23.3 11.9 4.8
30--39 17.1 18.6 19.4 2.4
40--49 7.9 4.6 23.9 4.7
50--74 17.1 7.0 23.9 26.2
75--99 2.7 2.2 10.4 11.9
100-499 5.2 2.2 4.5 26.2
500+ 5.3 0.0 0.0 2.4
100% 100% 100% 100%
Respondents 76 45 67 42
Year: 1984
Average 73.1 27.6 48.7 69.8
No. of Head1--10 12.9 23.3 2.9 8.6
10--19 20.0 16.2 4.3 13.8
20--29 16.5 23.3 13.1 13.8
30--39 13.0 18.6 18.8 13.8
40--49 4.7 4.6 24.7 6.9
50--74 12.9 7.0 26.1 10.3
75--99 5.9 4.7 4.5 10.4
100-499 9.4 2.3 5.6 20.7
500+ 4.2 0 0.0 01,7100% 100% 100% 100%
Respondents 85 43 69 58

22
Table 10. Farm operators' opinions on local services, facilities, and economicconditions
How have the following services, facilities and economic conditions changed in yourcommunity over the past five years? Would you say they have generally "improved,""remained the same," or "gotten worse?"
Remained Gotten Not Number ofImproved the Same Worse Uncertain Available Respondents--------------------- Percent------------------
Quality of schools 21.0 50.0 23.5 4.8 0.7 272
Job opportunities 13.2 39.0 42.3 4.4 1.1 272
Health care services 21.0 56.1 19.2 3.0 0.7 271
Child care facilities 23.4 47.2 7.4 19.0 3.0 269
Shopping facilities 40.9 35.7 23.0 0.4 - 269
Police & fireprotection 29.4 65.4 3.7 1.5 - 272
Adult educationopportunities 43.2 48.7 3.7 3.7 0.7 271
Banking services 22.6 56.3 21.1 - - 270
Opportunities forentertainment andrecreation 18.8 57.6 19.2 3.3 1.1 271
The current financialcondition of farmershas 17.7 18.5 60.1 3.7 - 271
The current financialcondition of agri-business firms inyour area has 10.3 32.4 51.5 5.1 0.7 272
The current financialcondition of lendersin your area has 15.2 42.7 30.5 11.2 0.4 269
Your farm's financialcondition has 31.3 39.3 27.6 1.1 0.7 272

23
Table 11. Farm operator and spouse opinions on quality of life in their
community
Please circle the response that comes closest to your opinion about the
quality of life in your community.
Become Remained Become No. of
Better the Same Worse Responses
Op1 Sp2 Op Sp Op Sp Op Sp
------------Percent- -----------
During the past five years, yourfamily finances have 44.7/38.0 27.1/26.9 28.2/35.1 273/242
During the past five years, the qual-
ity of life for your family has 42.2/37.6 41.4/45.0 16.4/17.4 268/242
In the next five years the overalleconomic condition of farmers will 26.6/25.1 29.6/37.4 43.8/37.4 267/235
Considering your farm's overallfinancial situation, the likelihoodthat you will continue to farm forat least the next five years has 34.7/25.7 48.1/57.7 17.2/16.6 268/241
Compared to farmers in your area,
your financial situation has 40.0/32.1 48.1/51.7 11.9/16.2 270/240
All things considered, your satis-faction with farming has 27.3/23.0 43.2/49.0 29.5/28.0 271/239
Has "neighboring" over the pastfive years 15.4/14.1 49.1/55.2 35.5/30.7 273/241
Has neighbors helping each otherover the past five years 18.5/12.9 49.3/58.8 32.2/28.3 270/240
Do you believe the things youhave in common with people inyour community has 15.7/14.9 70.4/71.5 13.9/13.6 274/242
1Operator
2Spouse
3The %'s are calculated with the missing cases omitted.

24
Table 12. Farm family adjustments reported by operator as made in 1985-1989 because of financial need
Has your family made any of the following adjustments because of financial needin the past five years?
Yes No Number of--Percent-- Respondents
a. Used savings to meet living expenses 48.2 51.8 274
b. Sold possessions or cashed in insurance 32.1 67.9 274
c. Purchased more items on credit 26.6 73.4 274
d. Postponed major household purchase(s) 58.2 73.4 274
e. Let life insurance lapse 15.4 41.8 273
f. Cut back on charitable contributions 47.6 52.4 275
g. Changed food shopping or eating habitsto save money 38.5 61.5 275
h. Changed transportation patterns to save money 41.5 58.5 275
i. Reduced household utility use, such aselectricity, telephone 29.8 70.2 275
j. Postponed medical or dental care to save money 34.2 65.8 275
k. Cancelled or reduced medical insurance coverage 28.5 71.5 274
i. Borrowed money from relatives or friends 16.7 83.3 275
m. Fallen behind in paying bills 25.3 74.7 273
n. Decreased money saved for children's education 40.4 59.6 265
o. Children have postponed education 8.5 91.5 260
p. Spouse has taken off-farm employment 38.5 61.5 265
q. You have taken off-farm employment 35.4 64.6 271

25
Table 13. Off-farm employment of operator and spouse in 1988
Operator SpouseNumber Percent Number Percent
1--9 Hours per week 8 8.2 10 8.1
10--19 Hours per week 9 9.1 14 11.3
20--29 Hours per week 7 7.1 18 14.5
30--39 Hours per week 7 7.1 22 17.7
40+ Hours per week 67 68.4 60 48.4
Average 36.4 31.5
Number of respondents 98 124

26
0a\ 0Ca >-.o-,
i 4-1
co
(l 4J4-4 4-1, -i
0 , Co · m r"~ -~' o', ~"4 u'~, , ¢1 CS
Or-4 00 r-CS C4
O 'n
"c
'u-
'" °°C
r4 It N 'D It 00 00
4-I £ ~ Sv4 ca)j V I Lu-iin i Lnf L L in nn in t in in LnLn in in Ln in n in VI nn
C) 3 eli,~ z
CM 'A 0 N <uNJ'C~Nt- a C)
- En In . . . ... . .co C ca N2 4j -4-4' ,-4Cc csO '4 -4<'o -4 -4 - - 4ooo r4
<!) >'. '
x a)
a) . CC
X3 > u: a) 0cs csN VIOoOIro CS os oNO\0 w 0 r- CS r oo u r- - CO
C 44 - > w n 00 U, r- C .C, N . in O o o - ,, ,-4 C¢' r~ N O DO - e ' r- Q) .- i 4 O - u) un --. 4 ,-- r D .. 4 < CS-I -4
oo00 4-J
bl
)4 C il o . .o ... 1. . - u1q u r.. or , as oo ,~ r- o\ '-, O ,4 C" O '-
.,4 O 00
o efDC z o . ,o .or.-o .o ,o . - O
V4 s4 o cu oa o0 O oJ 0 i c- cO u N cJ cu o u . 4 cJ c"4 ¢J ~ h
. C aa)
Ca C- > -i Co o
a) CZa - - .. C q) - o4 *r-4 U1 0 , *,i p bO C g o Hq
·u 0 It ON rE u D m n O Cr- . I C. , 4 -.
0 C; C; vl X m m E E W M 4 C k It'
H .5 a) NSr- c.0 rLvo~o ^ Sir) r^q ,-4-4 , .4 C 4 -4 " .o r -I
S o a) E E 4) s o o . E
CI O S; e U X E k C 3 O)o 'o 0 43 ° - o Qi
*ril CZ 04 <
a) > Cn .o a a 4 ' 4 o -4
E- un C u O a) l k; 0 3 o C a
E ..-.J .4 4 .;4 in r ; i: -.- r-4 -; -4
En r' > a L 4Q
H 7 E a - v4 E C o
o " Ewn w
a)E I-.4 (B 'O c a) il 'O i-iO.
.,H En a' 4c o .4 -IW
a) eiu En(i>+ >? O B) C @
1~4-J iln co Hn a)i a )O 44
I co 'Ha 4n 0H c r. I HC)o 0 J 1-bO iOO · I() Oa-.i- Ena )a4 -
o0 IC b2 o a.,4 a 4 o a)Soc )co .H aO e b0 .4 C- 14a)' l. o ^ E 4r- 4a 0 4-4
0 .)0 -o w .- r- o r4 -4 a) 5i O Z-0 4 e aaEa Sea) $a) 0 ca $4a 44 4 C - 4aOEn 4 -
O C a> 0 .a.). .* 4* O Ca

27
C)
'-4
4C4
P.0
3 0o
u VI Kn Iy
43 30-
4) C)O
(lC)01 U
.-I a) <1> 0 4-Jr- .3 4J Z &r :1 ~4 L3 i r- CO r-
4r-4 Cn
0 0 .-40 0a, a) p- 0 C 0 ' 0 CM O t <n0 < .,n .: u o un 4 ' o .
a) -4lr
'10 )-4
4>4) 4 CZ
CZ J Z
t o b r4 00 f 0ON N 00} p- N) -a
0( ' IEn . I-l
4-) ~ c .. :I o -4 -40.
, C) O ' c~ I "O 0 en N 0, O .. N
.. (D · Z U)Z C i t4 cs4 o -4 L. co co
.0 a o o ,4 I a co
(. -) 2
0 co>4 C ~a i n :
4 4 0 0 N 4 - 0.
C <( a) ,-i N
(f. 444 4i Q »4 . < . . ,.4
0. C
lUl JJ O U ,
1- * 04) N o N U' in C i 0 C
QL| in il) 0O n! 4 .- L-i
E l Q 04
0)4 I o 4 0 o
0 3) rS -i 4 s 0 t»4 Z
0 o I C) ) 3 o w c a) c o
bO ,-
rCl 'M * 4 l ,
*C) (C ) 0C U . *
Cdw b4.0 C)
U 4.)cO 0 U 4.
(4-1 0 .'-' f - 4- 4
(0i 0c C.)C>4) 4-) C r0 U f O. C
OL| 3 - C) 4- 4- 4 0 vo -4 0 4-
*- _I ) l > O O 00 N 4 < O
U (fle~ ~ ~ ~ ~ ~ ~ ~ C > c4 0 U U V 44 _ c
0C4 C aC) Ea -,4
4-i .0C- C) U C) 9 .xSoo ccs 4 a)oo r~-
W4 C u o _Q) U4 U 0O-
U40 C~ ~*.4 C04-4 4t U-*
j^X gU .i-iOHC C no 1 r C 4 E x o o 4 4 -i-44-1 00 0W d . -
CbO ,4 ,-
* ). 4 0 c) a * oo 0 .-o ICc-
4J 43^ Z I, 4a)
o0 C
(OU eB o C) -1C Uo 4 ,
C) C) 44S-, C)4-4 U) C)',-4 444-4 4- I4J §J ~ )C
O 4 bO ^ E> O C O
.0 C)> 0-0 aE 4J o-40 Co 30) C
CS C C *4 04 p.c ) a' oC u C eSE-. uI .[ 3U >- .4 J O ' *- CUE)
" § 5 C~ S 2 i .a r i E . (u !ie4J o <
u. 5 b r k U ro o C ( C (o
u Su e n H r- o a m a) 4 B i: *^ o
(U 0>"d O z O |)l O Hd Q ) r ) C ,4J4 4 C oa J Q3 3> LN a c U o ,1 rl Ea n' f * y u, > _,
28
C A o .s so . 0X
CN CN CMC CMN N
uil, C - SO e', , 0O
\ e} O il l <
i * 04 -4 -4o -
00 Co r 0 0
CS o4 cSo *<n U C4
o0 o L o 0-1 -4 o
ro COD M P cD m rn
r- d CS Or D t-*X O
r o ¥ P~ ¥ o ¥ o
0o x r- i s sD s0,4r u4 u n '0 '. 0 '
)-l<U C~~~~~~0)0ioC
b~ObO bO) e 0o
a r- C r "e va4 H-I 0 )4 4 0 v0l
Crl 4 C 4O E U oS C 0O
0 U) SJ4- U i r.,.o c 4. . O.,u U, UC oU V.r)-4i UTm. *.-4 CEn-
o 4i 0) co n u c w C _ -C i -n .E o 0 u~ -'
,- ) o U , o r- Z)au , c O I E I - II
4-) 4 0 -4 E o0 U CO0 D > 4-j o 0 o C) a pCO O U ) 0 o O 0 C c - .-C
E-4 '-n< S, £r > -<s b <

29
Table 16. Farmers' opinions on their information and training needs to continuefarming in the next five years
In order to continue farming in the next five years, I will need informationtraining on:
Not Low Moderate High Very High Number ofNeeded Need Need Need Need Respondents----------------- Percent---------------
Marketing skills 19.1 12.5 35.8 21.4 11.3 257
Diversification of farmoperation by adopting newcrops and livestock 27.8 23.2 31.3 13.1 4.6 259
Available governmentassistance 21.2 23.5 35.3 10.2 9.8 255
Bookkeeping andfinancial systems 29.6 20.6 26.8 17.1 5.8 257
Using appropriateconservation techniques 22.5 22.1 32.9 17.8 4.7 258
Using new technologiesas they become available 12.0 15.5 40.7 23.3 8.5 258
Using new machines andchemical inputs toincrease my production 17.1 19.1 33.1 22.6 8.2 257
Reducing production coststhrough low-input farmingmethods 14.8 16.0 34.8 22.3 12.1 256
Processing farm productson farm before selling 44.6 24.8 21.3 5.8 3.5 258

30
0) m tO
.0)
0)Q C 0 o 0 CM o ol 0 -o
u) q 0 'M ,-- M 0 N 0 N
o 0)
4C JJ W Dr n x O, , cO OQ) C U 0 C U, a 0 0 0o ao N a) o o > o oo ( z C<U4 ,-4 .-4 4 N NU
) QU) Q -
0) I 04"-4 E-,4i 1 0 I
WJ 4 Dco)D
C0) a o0o)o 0 0 a' 0 4 r a'
O E vO' , 4 -T o- x ', - - o r-I .o u,
.iC -S ,-
I "-}5 0,-a 1-4 I -4 -4 .. N .
C I ,.,-
Oa O4,-- 4I -.1
C o CO
(fl (' 4e.U ) I C O ,- c 4 C4 0 4 o NC0o0 4 ,4 4 " c.: 4 4 4 4 4
-t Z c cs co cs c
O
0
0). en en o, n , - 4 N. M '. n-
0 0C 01 cn 4. 1c mI ¢
4i-
Sj ,
0 U0
0X o C~,.
E4-i a z cM ^-ci CC ' c w cn : I
w C u.
0) £ )(U >.so C rN a' so 4 n
c: a M
cn o m m son x ~ - O ' 4 O 4o 4d to C. -4 C.
I
U)fiq ~ ~ ~ ~ ~ ~ ~~C , s- a
0) 4E. ( 1 2 0),-) o o a , .0 o
0 ) 0 , 4.JO - u ) C
>o)o o 5 -. , $.j 5 B w 4- o SP.. 0 CflO. 'O C W l CO U
4 4-14a 4-4. 1i 00)0 z Ct C CS- 0UO4 ~4 W 3 M^ w 04 r. CSC1- I 4.1.4 4- >1r
ea oa n)4j) C 0) g: v : 0) 30 0 t
3 i d (c( A, vU E ) .0> 3n v E 0 0
E. 0 4 S 0i)Cra> 0 0E io o- -4 o 44 v-' o B C )0 4ob0) 0)t- 0 o-0 Cu Q o E0) *O 0) 4.4 ,z -4 0Eo.4 v 4. 0 , . a 0)4-4
'-4 '-4 ES t0 3vo'o - a C e ao o 00 S o v
CU T4 -4 ~ ~ -i U ) ~ .3 1: i Cu l o n C 4 0 i -o 4 .n z o

31
0
a) cm y-4 4e cn CN ,4 cN
0o z
a .4 O t I n , -a) c Vn m
CU44 Z I
a) Wr Z
0r Ua) Q)CU
, O Oa)) 0a
0 * rl -,1
E u *,| a) p , r- o x f> o <aU C Z ,C
.- ) C U S 0x
.0 I NI 0 N-
0I ~ ~ 4C' ' 4 n 0
n) 0
4) En
r o E 4 J,
. 0) 4 4-4
· r,3 ,-4
., 4- } 0 01 a
ar u, O > ( f3 0 O 0
on) r K 0
S ~ - ,- C , , o ,o-
o ) -IP ,-I a
0) 4 C 0'
10 0 * O M ·0
ao W1M P .1 o o0 aN
4 - .,, .i -4 .,w ,
r,1 0 a a)-H ca) P. a)a o
o 0a
a) H '. . a)
0 0 >) 0 a E P
o 4-0 oC 4 *n) o P
U] Lt 00 \ ,m o V-)*a) * W , a 0 >0 i
C a U ) < 0) a) 0a 0
* I o U - U k P ' pC o P. I 0 ro $ -4 0 0) )0
'4-4 ,-4 0 .d - 0Y (4C C* ° ° a)a) o 1 o C, a> o
W 1i- 00 0 0 43 a- a)
aj 4J 3 0 r-l *i a) 1. 0. o 1-1 4n a) z p, S o a)1-CU Oa).H : a) : P 1-i*.-4 r
E)^ C4a tflm X 04J 4 -> . P

32
Table 19. Farm spouses' report of frequency of life pressures
There are many pressures on farm families. How frequently do you experience thefollowing pressures?
Almost Does Not Number ofNever Occasionally Daily Applv Respondents----------------- Percent-----------------
Problems in balancing workand family responsibilities 19.3 48.3 27.3 5.0 238
Conflict with spouse 32.2 54.1 9.1 4.5 242
Conflict with children 30.6 47.5 9.1 12.8 242
Adjusting to newgovernment policies 24.2 55.4 6.7 13.8 240
Difficulty with childcare arrangements 28.9 17.8 2.1 51.2 242
No farm help or loss orhelp when needed 32.4 46.9 2.9 17.8 241
Lacking control overweather and commodityprices 11.7 54.8 25.1 8.4 239
Insufficient support fromspouse in farm or familyduties 52.5 33.5 4.5 9.5 242
Indebtedness and debt-servicing problems 34.2 40.4 12.9 12.5 240

33
o c0)
I. -l4 r-4 --4 00 aO 4 ao -r. It ~d m m cfln Co
N N C C CS M CM C CS CM C
B oO
s> I a ~ o or o 4 ,-x o0 0 o1 N 0
in) I 0 0 op 0- O . N C X C O
)0 3a ' I 0 0 , , -,-P i ' c0 ,-I , C-a , -l i-l inl CM M i4 ^n 4 4 N 4 4 Cl
0l
ca a4-Q
U c.o ' 0 ' a O 0 .-o M oL a o N 4a) S * * . . . . . . . . .01 MU4 0W CM 00 00 I P-4 0i.4 I C- -- . 4 -4cci oo 0M oO 0 NC
U)
m) o
U) Ut-
. 4I
4- i c U0 *
o 74 0) Cao
-4 hoPQ ~ ~ ~ ~ 0- .w -oU 4 C D-44 bo P
0) n - E bO 3 . bo U) r,- o I .4 ..-I , W . .
U) -ia4 *H bM *, o H0 . 0 . o
0b o . C I p1 > c CM 1O -U)b0 U o U) C 4 0 0 C .D E m4 0
4) Cd 4 U) U) 0 0 Cd -4 I *,-A 5co4 co 1A 4-1 4-) -i -45 U) 4. 44 M-I 0 E U1 0 * 0r 0 4a u
u 0 U C C C 44 4 0 4-4 * w z U .0 4 a o) r l o o0 U .
) aU) -w 0 a 4i -i co tO -4 U 0 4-4u 1 ~ O o to w 4- 0 v 4o 44 u wn Zu -4 0 C 0 A0 - O U - co U O
. >-. C C o.t 1o -a 0 o o 3 4u4co0 *-4 0 bOCO C> bO CO e0 -. U)OU O 0> U 6 o Cu4^0 C O 4-)
10 X 0 a . l . v 4-4 0. W Cho a -4 w0r4 - 4U 0 -4-u s ,) C ..o w . *C v -E u > -4 0C
(fl tl 04-) 04-) 00) 0 bO 4-.>4 '-4 *d 0 0 0 04 U)0 0 ). 4 .'I U) 4 )41 U 0"- co4J »-0N4 40 o u 4 u 4 3 4-1 co -4 o t. 0 4
c 4 U 0' OU :U : 0 C, 0bOC d - - U ) ?
a) o * laE .* u 4 C( 4-> 1 C( C-1 u U) 4.o)b0 4u3 0o ) Ov, 4-4 41 . :0 3 a) 0) 0 ' -, 4 0 v (0 3 w. U 4-1 4 4 J4 E O 4E u0a 4 P>-,o, -, ) -4o o co ) :1 i 0 ( o n 0) 0 d o cS -o a o a) oE 3: 4 p 0 Z* x P 3) C o l E 0 4 =- a) E W C SJ

34
CN CN C( CN CS CN
O u'~ oo ~-4 X ,.O
+ o0' 0 O ' a-4 -4 .- -0 (
o o -4 .- ' .0 Ql 00 1 4 -4
r-. . o -e. -.= -.- -. -
(M «i C: = O. C .(N t , - i 0 0 0 '
,-4 -4 C(
E u4 C1 o= o- E ,° .
J c6 4 4
O o V
v LL O r V _ ~
4 V
I:~ ~ ~ ~ -4 Ai 0 °
co b o o o CU 0« Ul
* i 40 0 > % 0
i4 c1 * o e s 4 O :c
OU0 Ud V V.S i Ai o
p0 a YC C; a> w co ^ 3'-4 4) .OQ
0 g 4-j la o u o
I i0 cn *-i (A
0 Ca44 S S OLI co.Aon 40 Cv-4 LW 0 4 C)0 .0C
0u " -4 ) 0 C) - CC
35
4,-4 4)o o
ii oN r - OO -.T r-4 -A
a) C n oq CS N Cr
>N ) i l
CU 0 ., - 4 m
. 04 ))) 0 4 LA LA w a
-440
O- C n
, O -E r O M o Lnl) o, a a r 0 c4 E: 3
4J ,)
o I.F( G a) e a , o cs
N O
04 .,
C
rd 4).o 0 .
C U) .)
4.l 1 4C) C3 C C
.d wo R co o
4) Cu 1 ,
. 0) L
S .0 z 0
4) 0
e-1 X X > e ,UH ~ 0)
0 * I c 0 r .CM M C
o C 3 C
.,, oS a04 Cl) 1-I Clo x
. C N 04 d -
3 - C
e (U .0 , *
4-1i S 01. C*- 01 4 CuJ-U 4- E
4)4 *,-cd - cE w 0 0 r 4 n u0 C C 4 5 C
.1 -1 u0 (u )4 4 dOCu 04)4) o 1-4 b 0
e w 0 xr 0C m0.dXc 0 O4)i 4)o o a CJ )o ii4C o dCd w v W .4 e C:40 0 .4 C o 0 o. o) 0. 0
CU ) . Q v 0go Cl 5 c1 ca . <4 N. 0u 0< CM '-
e o N e e E: ^ e e r nt o a U3CL Cc Cd 0 0 0 0 E 4 5 C
0 0 D - 44 0 -A 0 rA . *F 0 4 -
Cd C t -4 4- 0 4. (1 4 t F¢)Co
etd R C Me 44 >t P bO u "4 ¢ u 0 b 1- ii>
*co la ewo( CZad d O i 0 ¢ 0

36
-4 -4 CNJ CSC4 CM4 CM C'4
CX4 h 0,
t %D 'IO un
oo n r-
CN CS en
Ln co r- in7a CS CS C14
CS CS CS CS4
CN O o '. 0. .
-0c' CM r X
Mo CM CM0 c C- ^0 C
.i~.~ 0 1
._ ,~ D 0 4 ) ,
U Oz~0w-4 0 C-4O -4
-_,
Qu
3 i-iu 00 - a) u
>h-03 > C o C o o a *O Enr o O ; fi > >
t. *l e 00*- 0 *- UU U) ) n C V4 o- L) > i: Q nO 1 D O <D
t C V i uD a) o
JJ .4 e 4 co -o °
.0 > U C O OC 4 U Z0 0 uH ( O CM -w > oo O
4 ·r .. c 0 > Ca U
0 Ou Cj r0 0 -
I - E C Q U E)nC, CO t > Eor-i e D ii)O n uo 0 e
CE (3 0 M r. w 4

37
(* * Figure 1. Location of Operator (Op)f---f-y\ :^ ~ and Spouse (Sp) Respondents
OP 1 OP 2 by CountySP - SP 3
KTrrSON ROSEAU Sp s_ 1
OP 6 OR TrE Wooos
SP 6 O 3MARSHALL OP 3
OP 2 SP 3 SP1 PENNINGOON -
IOP 1 SP KI-) _ -- JOOCHICIS |S -CO
P 7 SP 1 SP - SP -
POLK SP -
OP 5 OP 1 fr» B, - /SP 4 SP 1
MOIMAN MANOMEN waripI OP 2 @~ ff
}voanrN HII~OWYI SP 3 irAscA /OP 4 OP 1 OP 3SP 1 SP 1 SP 3
I( ~~#fetrOSvA _ CAss P 1 sr. LOUIS f
OP' _-- n_ OP 5
CLAP OP SF 11 OPP OP -
_ _ SP 2 SP 3 5 _
-oIHsoH SP - S
SP 1 OP 25 OP 6 OP 8 .P 2 u P ION
v -4__N S P 6 OP - H OP 6 c-^,^, §OP 2
SP 3 HSP WaH SP 1 x
OP 23 SP 3 S P 3 rp
LINCOLN- LYO N |E 1D I p 2, 1 S A S A
P3 0oP4 2 OPW 32 7 032 3 F-FP2 2 OP5
SP UASP 2 SP 1 S62 3SP 5SP 1 S P
SP 2 SP 4 SP 10 airoL SP 43
PF2Srron HfuNPY PCTTONWOOD WATONWAN BlUt ERT| WS STL PE OlM WINONA--
2 O P 02 OP O4 P 3 P 4 P 4 OP 5 OP 2
P SP 4 2 SP 4 SP 6 SP SP 4 SP 5 SP 2
RoCK NOSBlS ACSOPN 3 SN| FAIrAULT O MowEA |lLLMODE HOUsTO Roex NORLIS I ACCKSON MAl~nN FptivImr 9 rr&OQO MOWER )~IID O~O

38
REFERENCES
Bultena, Gordon, Paul Lasley and Jack Geller1986 "The Farm Crisis: Patterns and Impacts of Financial Distress
among Iowa Farm Families." Rural Sociology 5(14):436-448.
Heffernan, William D. and Judith Bortner-Heffernan1986 "Impact of the Farm Crisis on Rural Families and Communities."
The Rural Sociologist 6(3):160-170.
Jolly, Robert W., Arnold Paulsen, James D. Johnson, Kenneth Baum andRichard Prescott
1985 "Incidence, Intensity and Duration of Financial Stress among FarmFirms." American Journal of Agricultural Economics 67(5):1108-1115.
Leistritz, Larry1986 "Effect of Farm Financial Stress on Off-Farm Work Behavior of
Farm Operators and Spouses in North Dakota." North CentralJournal of Agricultural Economics 8(2):169-282.
Melichar, Emanuel1984 "A Financial Perspective on Agriculture." Federal Reserve
Bulletin 70(1):1-13.
Salamon, Sonya and Karen Davis-Brown1986 "Middle-range Farmers Persisting through the Agricultural
Crisis." Rural Sociology 51(4):503-512.
Saupe, William E. and Janet Eisenhauer1989 "Results of the 1989 Regional Farm Survey for Wisconsin." Staff
Paper No. 311, Department of Agricultural Economics, Universityof Wisconsin-Madison, 28pp.
39
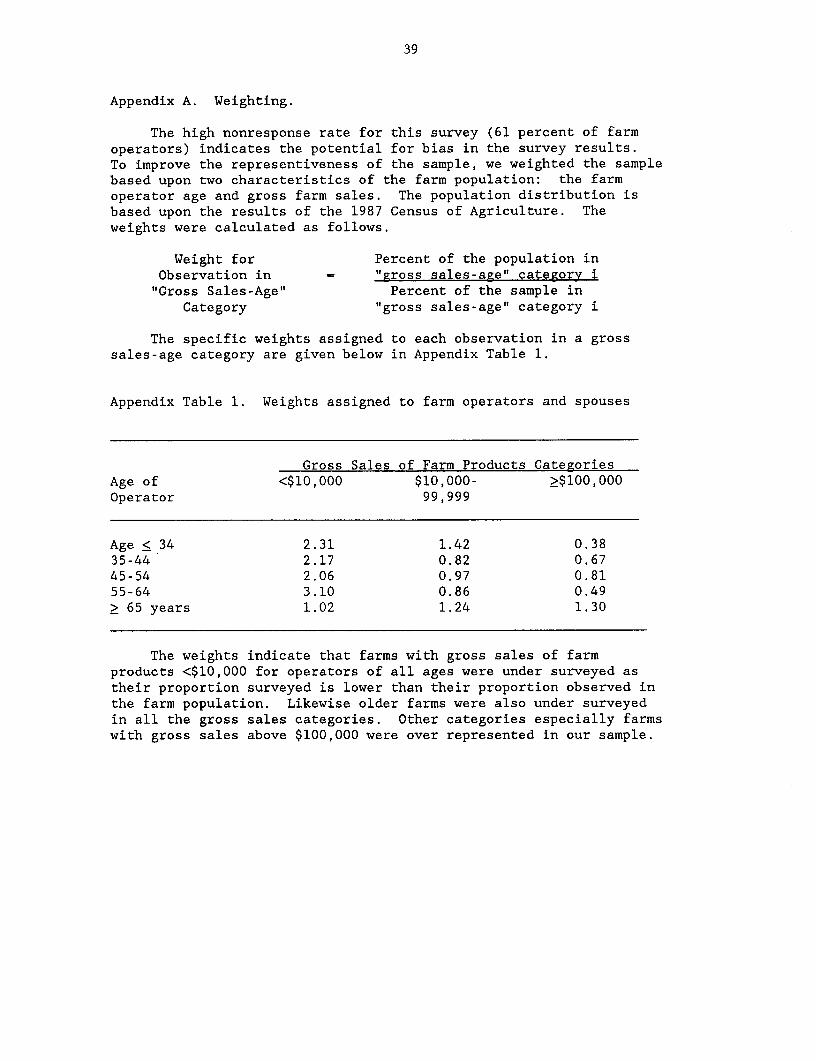
Appendix A. Weighting.
The high nonresponse rate for this survey (61 percent of farmoperators) indicates the potential for bias in the survey results.To improve the representiveness of the sample, we weighted the samplebased upon two characteristics of the farm population: the farmoperator age and gross farm sales. The population distribution isbased upon the results of the 1987 Census of Agriculture. Theweights were calculated as follows.
Weight for Percent of the population inObservation in "gross sales-age" category i
"Gross Sales-Age" Percent of the sample inCategory "gross sales-age" category i
The specific weights assigned to each observation in a grosssales-age category are given below in Appendix Table 1.
Appendix Table 1. Weights assigned to farm operators and spouses
Gross Sales of Farm Products CategoriesAge of <$10,000 $10,000- 2$100,000Operator 99,999
Age < 34 2.31 1.42 0.3835-44 2.17 0.82 0.6745-54 2.06 0.97 0.8155-64 3.10 0.86 0.49> 65 years 1.02 1.24 1.30
The weights indicate that farms with gross sales of farmproducts <$10,000 for operators of all ages were under surveyed astheir proportion surveyed is lower than their proportion observed inthe farm population. Likewise older farms were also under surveyedin all the gross sales categories. Other categories especially farmswith gross sales above $100,000 were over represented in our sample.

40
Appendix Table 2. Comparison of weighted and unweighted personalcharacteristics of operators and spouses
Sample of Sample of
Operators Spouse
Characteristics Unweighted Weighted Unweighted Weighted
Years of Age
Under 25 years 0.8 0.3 2.5 3.0
25-34 years 18.7 19.4 19.2 20.7
35-44 years 23.0 21.6 25.4 26.2
45-54 years 20.7 21.5 25.4 21.9
55-64 years 24.4 23.0 20.8 20.765+ years 12.4 14.2 6.7 7.5
100% 100% 100% 100%
Years of Education
1-8 years 15.7 15.5 3.4 5.4
9-12 years 49.1 53.5 58.7 58.1
13-16 years 32.5 27.9 35.8 35.1
17+ years 2.7 3.1 2.1 1.4100% 100% 100% 100%
Net Family Incomefrom All Sources
Loss 3.4 3.7$1--$9,999 18.8 19.0$10,000--$19,999 22.6 22.3$20,000--$29,999 23.8 24.1$30,000--$39,999 11.9 13.1$40,000--$49,999 7.7 8.9$50,000--$59,999 5.0 3.7$60,000--$69,999 2.3 2.3Over $70,000 4.6 2.9
100% 100%
Mean age of farm operator was 48.5 years for the Census of
Agriculture and 48.9 years from our weighted survey respondents.
The weighting procedure had only a small effect upon the
distributions by age, education and net family income.

41
Appendix Table 3. Comparison of weighted and unweighted respondents'farm size characteristics to characteristics ofthe total farm population of Minnesota
Sample of Farm_ Operators Population1
Characteristics Unweighted Weighted
Farm Size in Acres1--9 acres 0.0 0.0 5.4
10--49 acres 3.8 6.8 11.150--179 acres 24.4 30.3 19.3
180--499 acres 42.5 43.2 36.4500--999 acres 20.7 14.6 12.71,000+ acres 8.6 5.1 5.1
100% 100% 100%
Gross Sales ofFarm Products
Less than $10,000 16.2 31.4 31.4$10,000--$39,999 20.0 20.5 25.9$40,000--$99,999 28.5 28.8 23.4$100,000--$249,999 25.8 15.5 15.1$250,000 or more 9.6 3.9 4.2
100% 100% 100%
11987 Census of Agriculture, (U.S. Dept. of Commerce)
Our survey reports small farms with fewer than 50 acres and overreports middle and large sized farms as compared with the farmpopulation. Likewise the survey also under reports small farms inthe gross sales categories and over reports the number of middle andlarger size farms. The weighted sample will very closely resemblethe farm population in the gross sales category as the weights arebased, in part, upon the value of gross sales.

42
Appendix B. Comparison between respondents and nonrespondents
In order to gain additional information about possible bias 28
operator and 35 spouse nonrespondents were interviewed by telephoneand asked several of the questions from the mail survey. The sample
mean responses from the mail surveys were compared to those of the
phone interviews using t-tests.
No significant difference was indicated between the respondentsand the nonrespondents for most of the survey questions compared.
The average age of the farm operator was 48.6 (farm spouses 46.0) for
survey respondents as compared to 48.3 (45.0 for spouses) on the
nonrespondent survey. Mean responses were compared for the two
surveys and no statistical differences were indicated. Likewise no
statistical differences were found for operator and spouse education,
total family income and gross farm sales. Average owned acres of the
mail survey was 284 acres as compared to 355 acres for the phonesurvey. This was statistically different (a-0.2 level). However
average rented acres were statistically the same 295 for the mail
survey and 304 for the phone survey.
Other variables compared were related to perceived quality of
life, financial condition, overall satisfaction with farming and
plans to continue farming. In this case the average mail surveyee
indicated that he was more likely to discontinue farming operations.
There were no statistical differences indicated by the farm
operator from a selection of the risk reducing behaviors in question
8 of the survey. Nor were the nonrespondents more or less likely to
have off farm occupations.
Similar comparisons were made on the survey of farm spouses withno statistical differences observed.
It f-^~~~~~44 <APPENDIX C
,_ D^?\ 1 NORTH CENTRAL REGIONAL CENTER FOR RURAL DEVELOPMENT
EDMi- - -- \SoIOWA STATE UNIVERSITY
-- I ^ I -- ^of Science and Technology1 -- )'-I--^ 216 East Hall
QF^cs0~~~~ 7\~ au ~~Ames, Iowa 50011515-294-8322
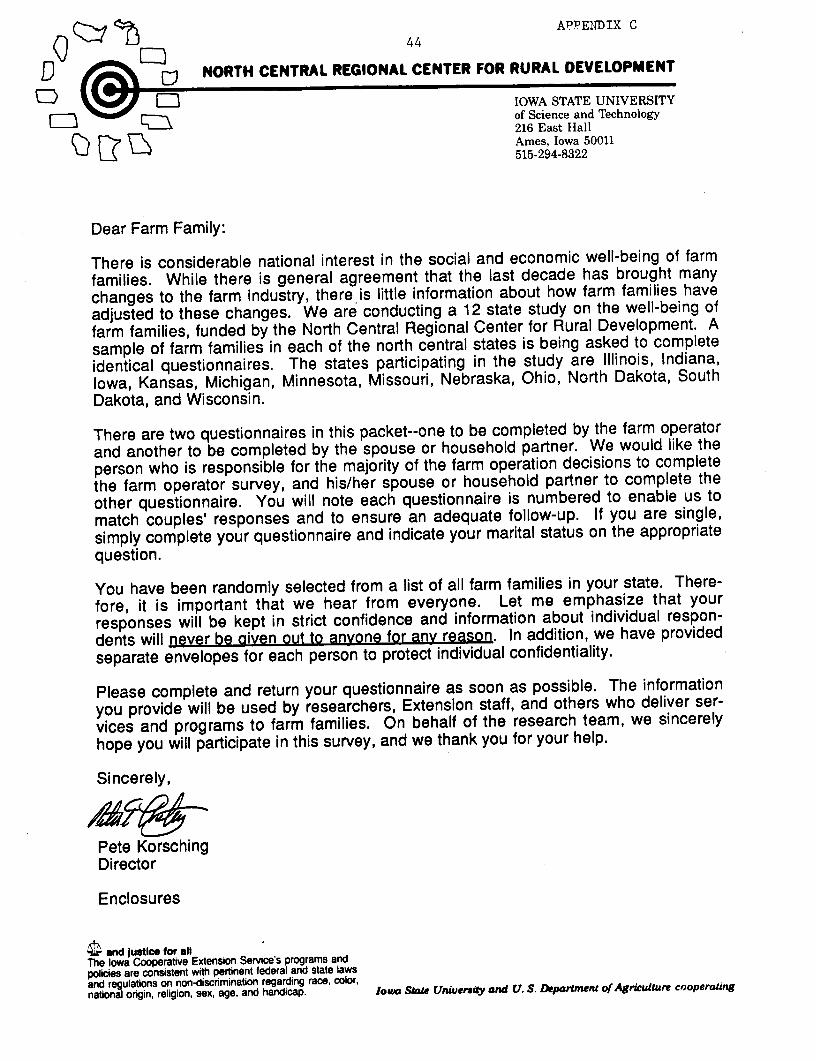
Dear Farm Family:
There is considerable national interest in the social and economic well-being of farmfamilies. While there is general agreement that the last decade has brought manychanges to the farm industry, there is little information about how farm families haveadjusted to these changes. We are conducting a 12 state study on the well-being offarm families, funded by the North Central Regional Center for Rural Development. Asample of farm families in each of the north central states is being asked to completeidentical questionnaires. The states participating in the study are Illinois, Indiana,Iowa, Kansas, Michigan, Minnesota, Missouri, Nebraska, Ohio, North Dakota, SouthDakota, and Wisconsin.
There are two questionnaires in this packet--one to be completed by the farm operatorand another to be completed by the spouse or household partner. We would like theperson who is responsible for the majority of the farm operation decisions to completethe farm operator survey, and his/her spouse or household partner to complete theother questionnaire. You will note each questionnaire is numbered to enable us tomatch couples' responses and to ensure an adequate follow-up. If you are single,simply complete your questionnaire and indicate your marital status on the appropriatequestion.
You have been randomly selected from a list of all farm families in your state. There-fore, it is important that we hear from everyone. Let me emphasize that yourresponses will be kept in strict confidence and information about individual respon-dents will never be given out to anyone for any reason. In addition, we have providedseparate envelopes for each person to protect individual confidentiality.
Please complete and return your questionnaire as soon as possible. The informationyou provide will be used by researchers, Extension staff, and others who deliver ser-vices and programs to farm families. On behalf of the research team, we sincerelyhope you will participate in this survey, and we thank you for your help.
Sincerely,
Pete KorschingDirector
Enclosures
X and justice for allThe iowa Cooperative Extension Service's programs andpolicies are consistent with pertinent federal and state lawsand regulations on non-discrimination regarding race, color,national origin, religion, sex, age, and handicap. lowa State Uniersity and U. S. Department of Agriculture cooperating

45
OPERATOR'S QUESTIONNAIREDIRECTIONS
Please circle the appropriate number to answer each queston. Your firstimpression is the answer desired on the following questions.
1. How have the following services, facilities and economic conditions changed in your community over the past fiveyears? Would you say they have generally "improved, "remained the same," or "gotten worse?"
Remained Gotten NotImproved the same Worse Uncertain Available
a. Quality of schools ...................... 1 2 3 4 5b. Job opportunities. .................. ... 1 2 3 4 5c. Health care services .................... 1 2 3 4 5.d. Child care facilities ..................... 1 2 3 4 5e. Shopping facilities ..................... 1 2 3 4 5f. Police and fire protection ................. 1 2 3 4 5g. Adult education opportunities . ............. 1 2 3 4 5h. Banking services ................. ..... 1 2 3 4 5i. Opportunities for entertainment and recreation ... 1 2 3 4 5j. The current financial condition of farmers has .... 1 2 3 4 5k. The current financial condition of agribusiness firms
in your area has. ...................... 1 2 3 4 5I. The current financial condition of lenders in your
area has. ........................... 1 2 3 4 5m. Your farm's financial condition has. ........ . 1 2 3 4 5
Yes No Not sure
2. Would you recommend farming to your children or another relative? ........... 1 2 3
At least once At least once At least once ora week a month twice a year Not at all
3. How often do you work with other people inyour community to solve local problems? . ......... 1 2 3 4
Very Somewhat A little Not atsorry sorry sorry all sorry
4. Suppose that for some reason you had to moveaway from here. How sorry would you be to leave? 1 2 3 4
2
46
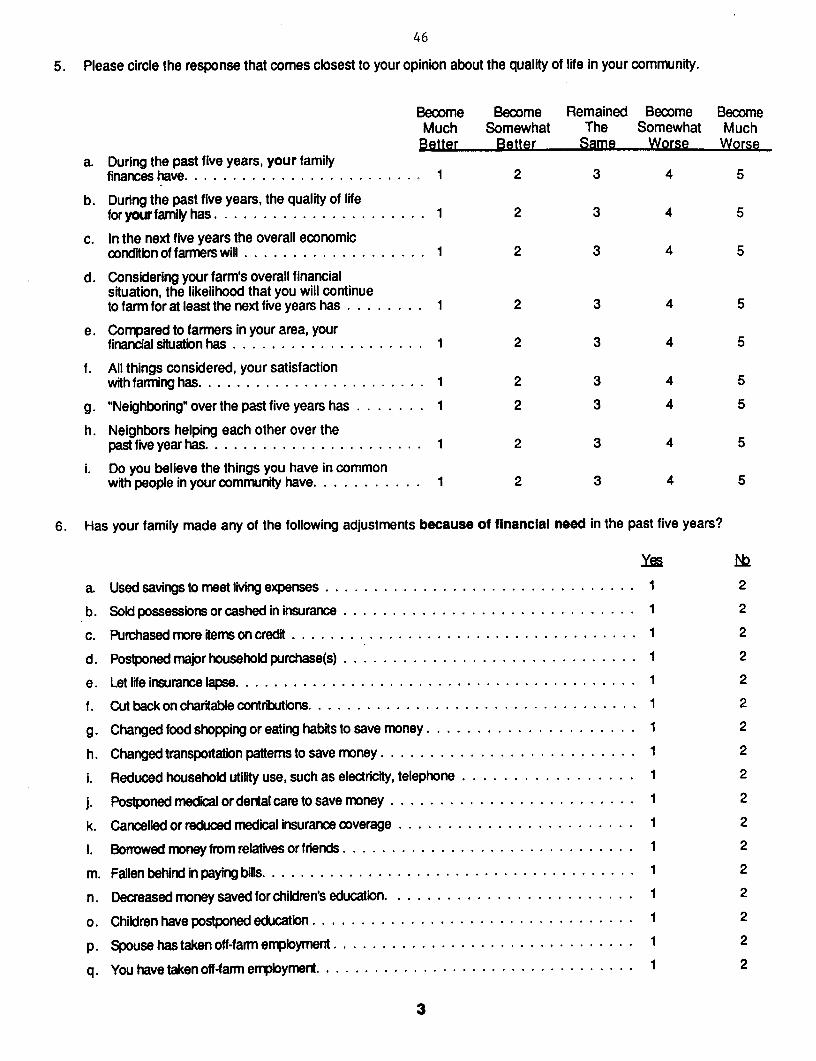
5. Please circle the response that comes closest to your opinion about the quality of life in your community.
Become Become Remained Become BecomeMuch Somewhat The Somewhat Much
Better Better Same Worse Worsea. During the past five years, your family
finances have ......................... 1 2 3 4 5
b. During the past five years, the quality of lifeforyourfamilyhas . .......................... 1 2 3 4 5
c. In the next five years the overall economiccondition of farmerswill ................... 1 2 3 4 5
d. Considering your farm's overall financialsituation, the likelihood that you will continueto farm for at least the next five years has ........ 1 2 3 4 5
e. Compared to farmers in your area, yourfinancial situation has .................... 1 2 3 4 5
f. All things considered, your satisfactionwithfarminghas ........................ 1 2 3 4 5
g. "Neighboring" over the past five years has ....... 1 2 3 4 5
h. Neighbors helping each other over thepast five year has. ...................... 1 2 3 4 5
i. Do you believe the things you have in commonwith people in your community have. .......... 1 2 3 4 5
6. Has your family made any of the following adjustments because of financial need in the past five years?
a Used savings to meet living expenses ............................. . . 1 2
b. Sold possessions or cashed in insurance ............................. . 2
c. Purchased more items on credit .................................. 1 2
d. Postponed major household purchase(s) ............................. 1 2
e. Let life insurance lapse ................................. 1 2
f. Cut back on charitable contributions. ........................... ...... 1 2
g. Changed food shopping or eating habits to save money ................... . 1 2
h. Changed transportation patterns to save money ................... ...... 1 2
i. Reduced household utility use, such as electricity, telephone ................. 1 2
j. Postponed medical or dental care to save money ......................... 2
k. Cancelled or reduced medical insurance coverage .................... 1 2
I. Borrowed money from relatives or friends ............................. 2
m. Fallen behind in paying bills ........................... ............ 1 2
n. Decreased money saved for children's education. ................... ..... 1 2
o. Children have postponed education ............. ................... ......... 1 2
p. Spouse has taken off-farm employment . .......... ........... . . . . 12
q. You have taken off-farm employment ................................. 2
3

47
Greatly Somewhat Remained Somewhat GreatlyIncreased Increased The Same Declined Declined
7. a. Over the past five years, your personallevel of stress has ........ .......... ... 1 2 3 4 5
b. Your concern with your level of stress has ....... 1 2 3 4 5
c. On a day-to-day basis, your stress has. ......... 1 2 3 4 5
8. Many farmers believe that the risk in farming has increased during the past five years. In Column A, please indicatewhat changes you have made to reduce risk in your operation. In Column B, please indicate the changes youare planning to make in the next five years. (Please answer both columns A & B)
Column A Column BChanoes Made (1984-1988) Changes Planned (1989-1993)
YES NO YES NO MAYBE
a. Diversified farm by adding new crops ..... 1 2 1 2 3
b. Diversified farm by raising livestock. ....... 1 2 1 2 3
c. Paid closer attention to marketing ....... 1 2 1 2 3
d. Postponed major farm purchase(s). ....... 1 2 1 2 3
e. Reduced long-term debt ............ 1 2 1 2 3
f. Reduced short-term debt . . ........... 1 2 1 2 3
g. Bought additional land ............... 1 2 1 2 3
h. Sold some land ......... .......... 1 2 1 2 3
i. Rented fewer acres ................. 1 2 1 2 3
j. Rented more acres ................ 1 2 1 2 3
k. Started a new business (not farming) ...... 1 2 1 2 3
I. Used the future markets to hedge prices. ... 1 2 1 2 3
m. Shared labor or machinery with neighbors. . . 1 2 1 2 3
n. Transferred land back to lender. ......... 1 2 1 2 3
o. Sought training for new vocation. ........ 1 2 1 2 3
p. Reduced expenditures for hired help. ...... 1 2 1 2 3
q. Kept more complete financial records. ...... 1 2 1 2 3
r. Changed from cash rent to crop share ..... 1 2 1 2 3
s. Bought crop insurance. .............. 1 2 1 2 3
t. Reduced machinery inventory ......... 1 2 1 2 3
u. Sought off-farm employment ............ 2 1 2 3
v. Retire fromfarming ................. 1 2 1 2 3
w. Quitfarming ...................... 1 2 1 2 3
4

48
9. There are a number of government programs and laws designed to assist farmers. For each of the programs or lawslisted below, please indicate whether you have participated in them over the past five years and how much help theyprovided.
YES, I participated in this NO, I did not participate in thisprogram and found it to be: program because:
Did NotNb Some A Lot Not Did Not Not Know
Help Help of Help Needed Qualify Available About
a. Federal government com-modity programs (e.g. FeedGrain, Dairy Support) . ............ 1 2 3 4 5 6 7
b. Conservation reserveprogram (CRP) ................. 1 2 3 4 5 6 7
c. Loans from FmHA . .............. 1 2 3 4 5 6 7
d. Farmer/lender mediationservices . .................... 1 2 3 4 5 6 7
e. 1988 Drought Assistance Act. ....... 1 2 3 4 5 6 7
f. Federal all-risk crop insurance. ....... 1 2 3 4 5 6 7
g. Chapter 11 bankruptcy (debtreorganization ) ................. 1 2 3 4 5 6 7
h. Chapter 12 (debt restructuringforfarmers) ................... 1 2 3 4 5 6 7
i. Vocational retraining/educa-tion program for self or familymember ..................... 1 2 3 4 5 6 7
j. Job Partnership Training Actor other off-farm job searchassistance program ... ........... 1 2 3 4 5 6 7
k. Mental health counseling foryourself or family member .......... 1 2 3 4 5 6 7
I. Foodstamps .................. 1 2 3 4 5 6 7
m. Fuel Assistance ................ 1 2 3 4 5 6 7
n. Unemployment benefits .......... 1 2 3 4 5 6 7
o. Income assistance (e.g. AFDC,SSI) ....................... 1 2 3 4 5 6 7
p. Financial analysis or counselingby Extension Service. ............ 1 2 3 4 5 6 7
$S
49
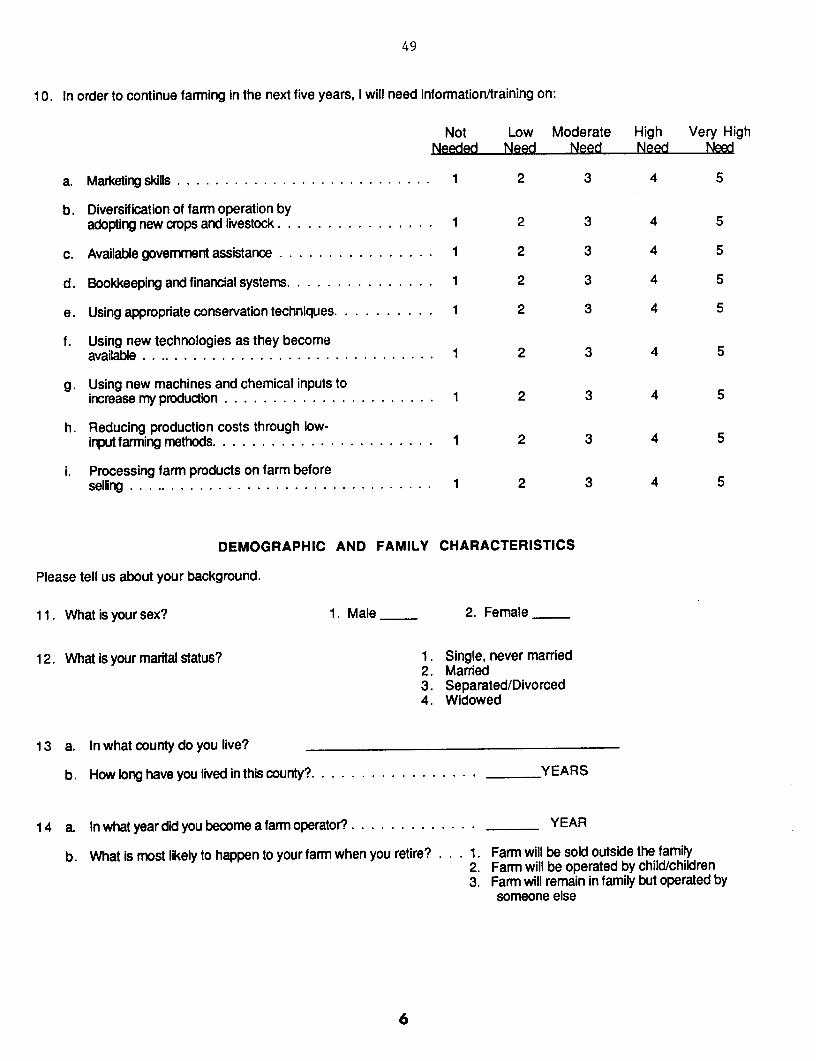
10. In order to continue farming in the next five years, I will need information/training on:
Not Low Moderate High Very HighNeeded Need Need Need Need
a. Marketing skills ....................... 1 2 3 4 5
b. Diversification of farm operation byadopting new crops and livestock ................ 1 2 3 4 5
c. Available government assistance ................ 1 2 3 4 5
d. Bookkeeping and financial systems. .............. 1 2 3 4 5
e. Using appropriate conservation techniques. ......... 1 2 3 4 5
f. Using new technologies as they becomeavailable ................................ 1 2 3 4 5
g. Using new machines and chemical inputs toincrease my production ................... 1... 2 3 4 5
h. Reducing production costs through low-input farming methods. ................... .. 1 2 3 4 5
i. Processing farm products on farm beforeselling . ................ ......... ....... 1 2 3 4 5
DEMOGRAPHIC AND FAMILY CHARACTERISTICS
Please tell us about your background.
11. What is your sex? 1. Male _ 2. Female
12. What is your marital status? 1. Single, never married2. Married3. Separated/Divorced4. Widowed
13 a. In what county do you live?
b. How long have you lived in this county? ................ _. YEARS
14 a. In what year did you become a farm operator?. ............ YEAR
b. What is most likely to happen to your farm when you retire? . . 1. Farm will be sold outside the family2. Farm will be operated by child/children3. Farm will remain in family but operated by
someone else
6

50
Please tell us about your family. If you are married, be sure to answer the questions for your spouse.
15. What are the ages of:. ..................... Farm Operator Spouse
16. What is the highest level of educationcompleted. . ........................... Yourself . years Spouse _ years
17. How many persons in your household are: Under 5 years of age
5 to 12 years of age
13 to 19 years of age
Over 19 years of age
OPERATOR SPOUSE
18. a. In 1988, did you (or your spouse) work off the farm? Yes (1) Yes (1)No (2) No (2)
b. How many miles did you commute one-way? MILES MILES
c. How many years have you (or your spouse)worked off the farm? YEARS YEARS
d. On an average, how many hours per week doyou work at this job? HOURS HOURS
e. How many weeks in 1988 did you work at this job? WEEKS WEEKS
f. What occupation was the most important off-farm job in 1988?(Please check the appropriate category)
Professional
Manager/Administrator
Sales/Clerical
Craftsman/Machine Operator
Transportation
Laborer/Service Worker
Nonfarm self-employed
Other (please specify)
7

51
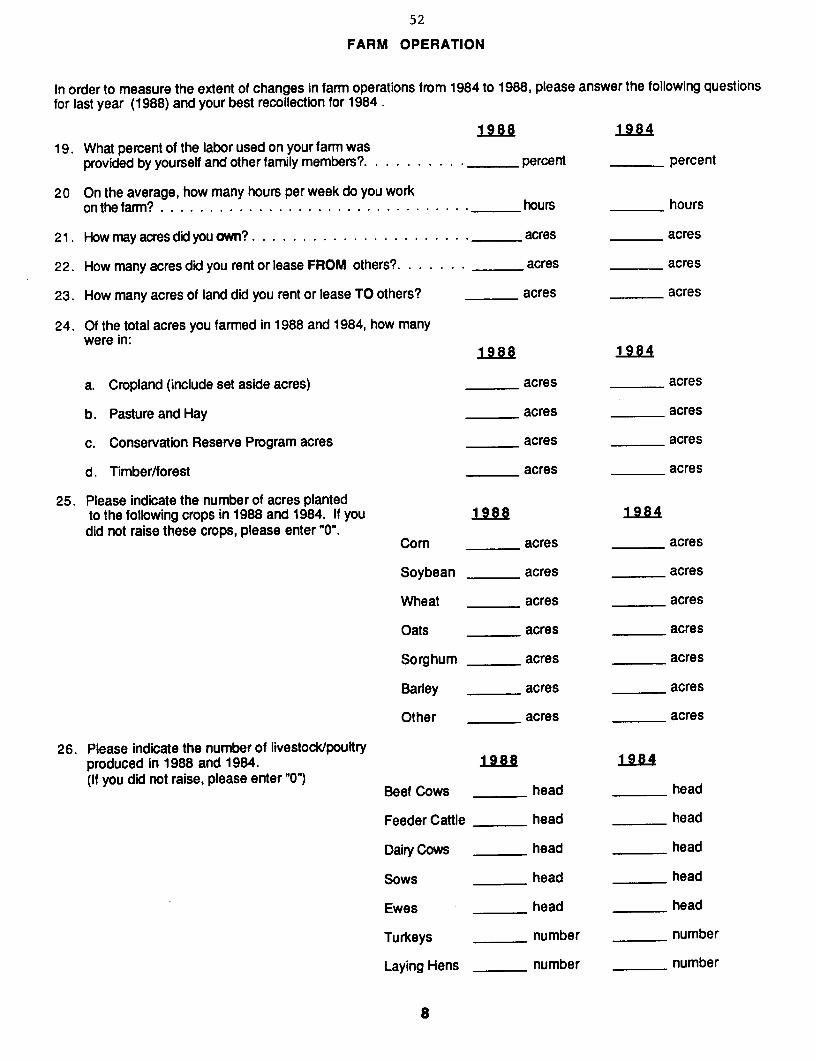
FARM OPERATION
In order to measure the extent of changes in farm operations from 1984 to 1988, please answer the following questions
for last year (1988) and your best recollection for 1984.
1988 1984
19. What percent of the labor used on your farm wasprovided by yourself and other family members?. ...... . .. percent percent
20 On the average, how many hours per week do you workon the farm? ................ -- hours hours
21. How may acres did you own? . .............. . . . . .acres acres
22. How many acres did you rent or lease FROM others?. ..... . - acres acres
23. How many acres of land did you rent or lease TO others? _acres - acres
24. Of the total acres you farmed in 1988 and 1984, how manywere in:
1 988 1984
a. Cropland (include set aside acres) acres -- acres
b. Pasture and Hay acres -- acres
c. Conservation Reserve Program acres acres acres
d. Timber/forest acres acres
25. Please indicate the number of acres plantedto the following crops in 1988 and 1984. If you 9 88 1 9 8 4
did not raise these crops, please enter "0".Corn acres acres
Soybean acres acres
Wheat acres acres
Oats acres acres
Sorghum acres acres
Barley acres acres
Other acres acres
26. Please indicate the number of livestock/poultryproduced in 1988 and 1984. 1 984
(If you did not raise, please enter "0") Beef Cows head headBeef Cows head head
Feeder Cattle head head
Dairy Cows head head
Sows head head
Ewes head head
Turkeys number number
Laying Hens number number
8
52
FARM OPERATION
In order to measure the extent of changes in farm operations from 1984 to 1988, please answer the following questionsfor last year (1988) and your best recollection for 1984 .
1988 1 98419. What percent of the labor used on your farm was
provided by yourself and other family members? .. ...... .percent percent
20 On the average, how many hours per week do you workon the farm? .. ............................. hours hours
21. How may acres did you own? .................... ._ . acres acres
22. How many acres did you rent or lease FROM others?. ...... acres acres
23. How many acres of land did you rent or lease TO others? acres acres
24. Of the total acres you farmed in 1988 and 1984, how manywere in:
1988 1984
a. Cropland (include set aside acres) acres acres
b. Pasture and Hay acres acres
c. Conservation Reserve Program acres acres acres
d. Timber/forest acres acres
25. Please indicate the number of acres plantedto the following crops in 1988 and 1984. If you 1 988 1 984did not raise these crops, please enter "0".
Corn acres acres
Soybean acres acres
Wheat acres acres
Oats acres acres
Sorghum acres acres
Barley acres acres
Other acres acres
26. Please indicate the number of livestock/poultryproduced in 1988 and 1984. 1 988 1984(If you did not raise, please enter "0")
Beef Cows head head
Feeder Cattle head head
Dairy Cows head head
Sows head head
Ewes head head
Turkeys number number
Laying Hens number number
8

53
FINANCIAL CONDITIONS IN FARMING
There is a continuing debate on the financial health of farming. Some people argue that the problem is beingexaggerated, while others claim the financial condition remains a very serious problem. To help us assess the financialconditions in farming, we'd like you to answer the following questions.
27. As of January 1,1989, what was the estimatedcurrent market value of your farm assets? ........... 1. Real Estate Assets $(including land, buildings, machinery, and livestock)
2. Non-Real Estate Assets $
28. The value of your January 1, 1989 total assets,compared to a year earlier has: ................. 1. Increased
2. Remained the Same
3. Decreased
29. As of January 1,1989, what were your estimated totalliabilities? (including all debts for land, buildings,machinery, livestock and unpaid bills) ............. 1. Real Estate Debts $
2. Non-Real Estate Debts $_
30. Your debts as of January 1,1989, compared to a yearearlier have: ................... 1........ 1. Increased
2. Remained the Same
3. Decreased
31. What was the gross farm sales, including government farm payments, from your operation in 1988?(Circle the appropriate range)
1. Less than $10,000 4. $100,000--$249,9992. $10,000--$39,999 5. $250,000--$499,9993. $40,000--$99,999 6. $500,000 or more
32. Which of the following categories comes closest to your net family income for 1988? (This includes off-farmemployment, farming and non-farm income such as interest and Social Security)
1. A loss was realized 6. $40,000--$49,9992. $1--$9,999 7. $50,000--$59,9993. $10,000--$19,999 8. $60,000--$69,9994. $20,000--$29,999 9. Over $70,0005. $30,000--$39,999
9
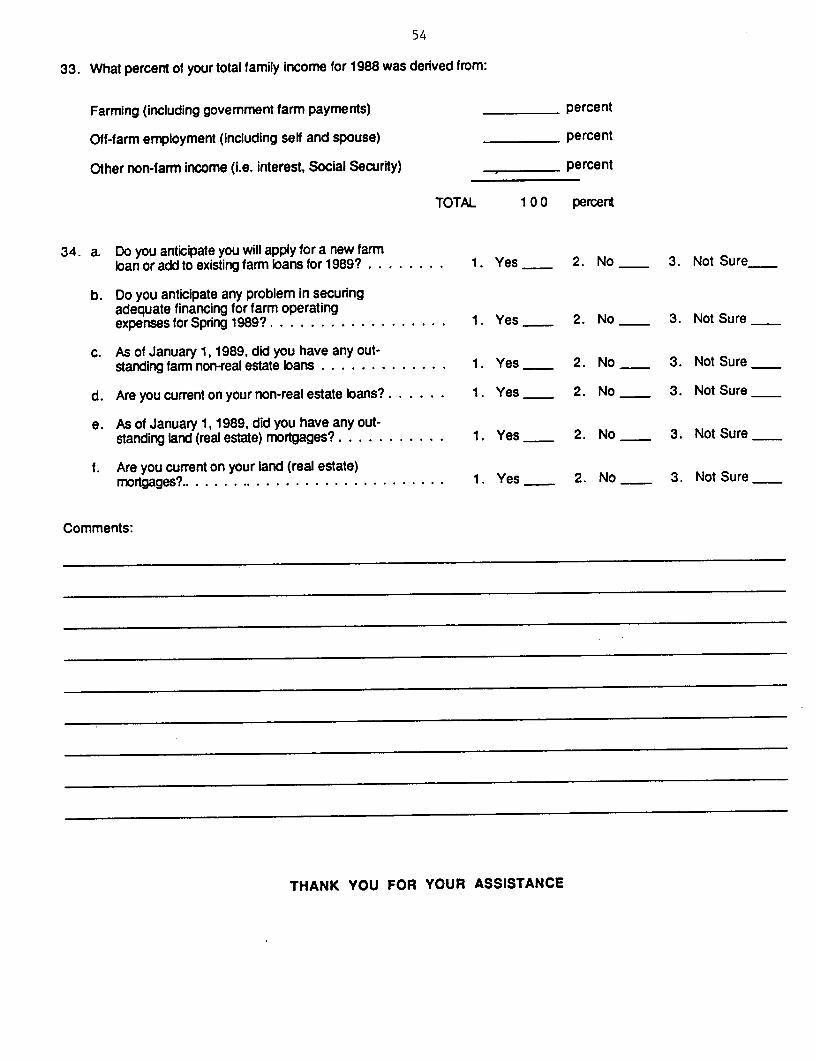
54
33. What percent of your total family income for 1988 was derived from:
Farming (including government farm payments) percent
Off-farm employment (including self and spouse) percent
Other non-farm income (i.e. interest, Social Security) percent
TOTAL 10 0 percent
34. a. Do you anticipate you will apply for a new farmloan or add to existing farm loans for 1989? ........ 1. Yes_ 2. No 3. Not Sure
b. Do you anticipate any problem in securingadequate financing for farm operatingexpensesforSpring 1989? .................. 1. Yes 2. No 3. Not Sure
c. As of January 1,1989, did you have any out-standing farm non-real estate loans ............. 1. Yes__ 2. No 3. Not Sure
d. Are you current on your non-real estate bans? ...... 1. Yes_ 2. No 3. Not Sure
e. As of January 1,1989, did you have any out-standing land (real estate) mortgages? ........... 1. Yes 2. No 3. Not Sure
f. Are you current on your land (real estate)mortgages? ............................. 1. Yes 2. No 3. Not Sure
Comments:
THANK YOU FOR YOUR ASSISTANCE
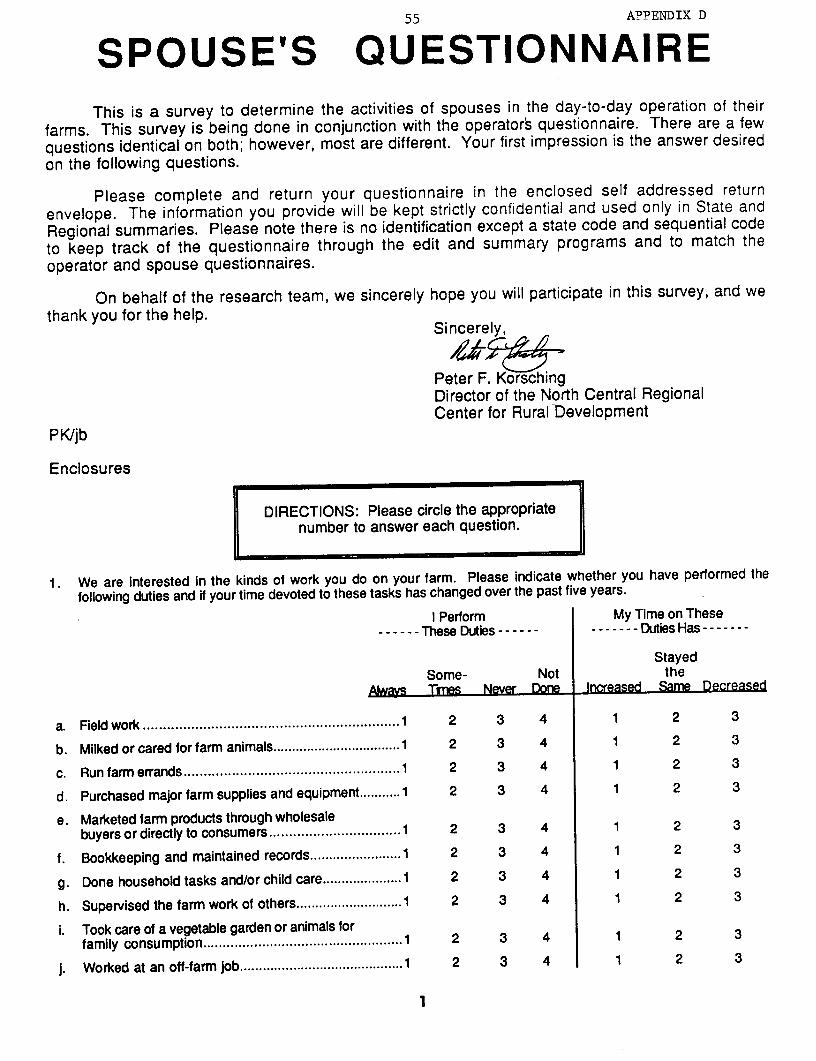
55 APPENDIX D
SPOUSE'S QUESTIONNAIREThis is a survey to determine the activities of spouses in the day-to-day operation of their
farms. This survey is being done in conjunction with the operators questionnaire. There are a few
questions identical on both; however, most are different. Your first impression is the answer desired
on the following questions.
Please complete and return your questionnaire in the enclosed self addressed return
envelope. The information you provide will be kept strictly confidential and used only in State and
Regional summaries. Please note there is no identification except a state code and sequential code
to keep track of the questionnaire through the edit and summary programs and to match the
operator and spouse questionnaires.
On behalf of the research team, we sincerely hope you will participate in this survey, and we
thank you for the help.Sincerely,
Peter F. KorschingDirector of the North Central RegionalCenter for Rural Development
PK/jb
Enclosures
DIRECTIONS: Please circle the appropriatenumber to answer each question.
1. We are interested in the kinds of work you do on your farm. Please indicate whether you have performed thefollowing duties and if your time devoted to these tasks has changed over the past five years.
I Perform My Time on These- - - - - - These Duties -.- -- - - --- Duties Has -------
StayedSome- Not the
Always Trnes Never Done Increased Same Decreased
a. Field work ................................................ .......... 1 2 3 4 1 2 3
b. Milked or cared for farm animals..................................1 2 3 4 1 2 3
c. Run farm errands ............................................ 1 2 3 4 1 2 3
d. Purchased major farm supplies and equipment...........1 2 3 4 1 2 3
e. Marketed farm products through wholesalebuyers or directly to consumers ................................. 1 2 3 4 1 2 3
f. Bookkeeping and maintained records........................1 2 3 4 1 2 3
g. Done household tasks and/or child care.....................1 2 3 4 1 2 3
h. Supervised the farm work of others............................1 2 3 4 1 2 3
i. Took care of a vegetable garden or animals forfamily consumption........................... . 2 3 4 1 2 3
j. Worked at an off-farm job ......................... 1 2 3 4 1 2 3
1
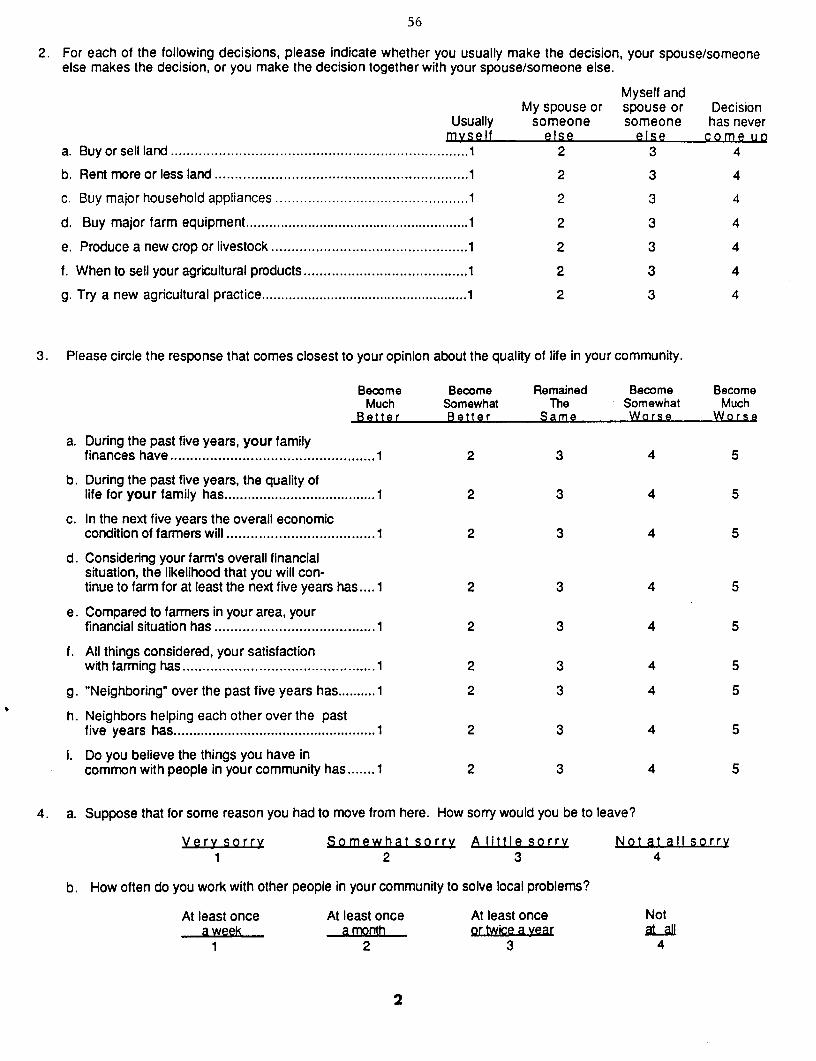
56
2. For each of the following decisions, please indicate whether you usually make the decision, your spouse/someoneelse makes the decision, or you make the decision together with your spouse/someone else.
Myself andMy spouse or spouse or Decision
Usually someone someone has nevermyself else else come up
a. Buy or sell land .......................................................................... 1 2 3 4
b. Rent m ore or less land ............................................................... 1 2 3 4
c. Buy major household appliances ................................................ 1 2 3 4
d. Buy major farm equipment..........................................................1 2 3 4
e. Produce a new crop or livestock ................................................. 1 2 3 4
f. W hen to sell your agricultural products.........................................1 2 3 4
g. Try a new agricultural practice......................................................1 2 3 4
3. Please circle the response that comes closest to your opinion about the quality of life in your community.
Become Become Remained Become BecomeMuch Somewhat The Somewhat Much
Better Better Same Worse Worse
a. During the past five years, your familyfinances have ................................................... 1 2 3 4 5
b. During the past five years, the quality oflife for your family has ....................................... 1 2 3 4 5
c. In the next five years the overall economiccondition of farmers will ..................................... 1 2 3 4 5
d. Considering your farm's overall financialsituation, the likelihood that you will con-tinue to farm for at least the next five years has.... 1 2 3 4 5
e. Compared to farmers in your area, yourfinancial situation has ........................................ 1 2 3 4 5
f. All things considered, your satisfactionwith farm ing has ................................................ 1 2 3 4 5
g. "Neighboring" over the past five years has..........1 2 3 4 5
h. Neighbors helping each other over the pastfive years has....................................................1 2 3 4 5
i. Do you believe the things you have incommon with people in your community has....... 1 2 3 4 5
4. a. Suppose that for some reason you had to move from here. How sorry would you be to leave?
Very sorry Somewhat sorry A little sorry Not at all sorry1 2 3 4
b. How often do you work with other people in your community to solve local problems?
At least once At least once At least once Nota week a month or twice a year aall
1 2 3 4
2

57
ProbablyWould Probably would not Would notheld help helD help Unsure
5. a. If a situation developed that would hurt yourcommunity, would residents in your communityhelp in doing something about it?................................1 2 3 4 5
b. If a farmer in your community had his/her farmforeclosed and some of the community residentsthought it was unfair and organized a protest,would the others help out? ....................................... 1 2 3 4 5
c. If a situation developed that would hurt yourcommunity, would you help in doingsom ething about it? .................................................... 1 2 3 4 5
d. If a farmer in your community had his/her farmforeclosed and some of the community residentsthought it was unfair and organized a protest,would you help out? ........................................... .1 2 3 4 5
6. There are many pressures on farm families. How frequently do you experience the following pressures?
Almost Does notnever Occasionally Daily aoply
a. Problems in balancing work and family duties .............................. 1 2 3 4
b. Conflict w ith spouse........................*1................................ 2 3 4
c. Conflict with children........................... ............................... . 1 2 3 4
d. Adjusting to new government policies........................................1 2 3 4
e. Difficulty with child care arrangements ........................................ 1 2 3 4
f. No farm help or loss of help when needed..................................1 2 3 4
g. Lacking control over weather and commodity prices ................... 1 2 3 4
h. Insufficient support from spouse in farm or family duties...............1 2 3 4
i. Indebtedness and debt-servicing problems................................1 2 3 4
7. During the past twelve months, how often did your family not have enough money to afford the kind of:
Very Fairly Not veryoften often often Never
a. Food your household should have? ..........................1. 2 3 4
b. Clothes your household should have? ............................... 1 2 3 4
c. Medical care your household should have? ....................... .... 1 2 3 4
3
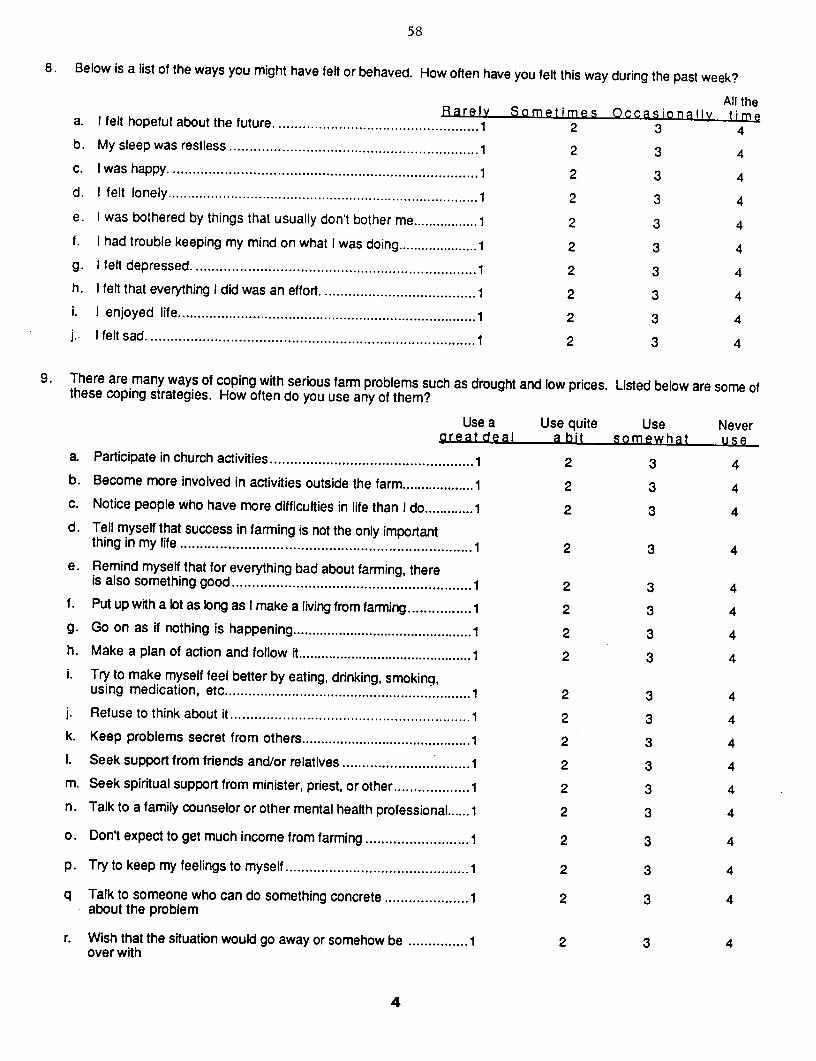
58
8. Below is a list of the ways you might have felt or behaved. How often have you felt this way during the past week?
All theRarely Sometimes Occasionally timea. I felt hopeful about the future ........................................... .... 2 3 4
b. M y sleep was restless ..................................................... . 2 3 4c. I was happy ........................................................................... 1 2 3 4d. I felt lonely........................................... ................... 2 3 4e. I was bothered by things that usually don't bother me ................. 1 2 3 4f. I had trouble keeping my mind on what I was doing ..................... 1 2 3 4g. I felt depressed ................................................................. 2 3 4h. I felt that everything I did was an effort ...................................... 1 2 3 4i. I enjoyed life........................................... .... ..................... 1 2 3 4j. I felt sad ................................................................................. 2 3 4
9. There are many ways of coping with serious farm problems such as drought and low prices. Listed below are some ofthese coping strategies. How often do you use any of them?
Use a Use quite Use Neverareat deal a bit somewhat use
a Participate in church activities ................................................. 1 2 3 4b. Become more involved in activities outside the farm ................... 1 2 3 4c. Notice people who have more difficulties in life than I do ............. 2 3 4d. Tell myself that success in farming is not the only important
thing in m y life ...................................................................... 2 3 4e. Remind myself that for everything bad about farming, there
is also something good ........................ .......................... 1 2 3 4f. Put up with a lot as long as I make a living from farming ................ 1 2 3 4g. Go on as if nothing is happening ............................................... 2 3 4h. Make a plan of action and follow it .............................................. 1 2 3 4i. Try to make myself feel better by eating, drinking, smoking,
using medication, etc ................................................. 2 3 4j. Refuse to think about it............................................................1 2 3 4k. Keep problems secret from others ........................................... 1 2 3 4I. Seek support from friends and/or relatives ................................1 2 3 4m. Seek spiritual support from minister, priest, or other ................... 1 2 3 4n. Talk to a family counselor or other mental health professional ...... 2 3 4
o. Don't expect to get much income from farming .......................... 1 2 3 4
p. Try to keep my feelings to myself .............................................. 1 2 3 4
q Talk to someone who can do something concrete ..................... 1 2 3 4about the problem
r. Wish that the situation would go away or somehow be ............... 1 2 3 4over with
4

59
Greatly Somewhat Remained Somewhat GreatlyIncreased Increased The Same Declined Declined
10. a. Over the past five years, your personallevel of stress has .............................................. 1 2 3 4 5
b. Your concern with your level of stress has............1 2 3 4 5
c. On a day-to-day basis, your stress has .................. 1 2 3 4 5
11. We would like to ask you some questions about your social activities10 or
None 1-2 3-5 6-9 more
a. How many clubs, organizations and other groups(such as bowling teams, church groups, P.T.A)do you belong to?.................................................................. 1 2 3 4 5
b. About how many people do you know from whomyou can expect real help in times of trouble? ............................ 1 2 3 4 5
c. About how many relatives do you have that you feelclose to?............................................................................. . . 1 2 3 4 5
d. About how many close friends do you have, peopleyou can talk to about personal problems? ................................ 1 2 3 4 5
12. On the average, how often have you seen your close friends or relatives in the past month?
1. More than once a week 2. At least every week 3. At least once or twice 4. Not at alla month
13. There are a number of farm or local organizations. Please indicate both you and your spouse's membershipactivity in the following:
Yourself SpouseFormer Never Former Never
Member Member Member Member Member Member
a. Any farm organization, such as National FarmersOrganizations, Grange, Farm Bureau, NationalFarmers Union, Young Farmers and Farm Wives.......................1 2 3 1 2 3
b. Any women's branches of general farm organiza-tions, such as Farm Bureau Women ........................................ 1 2 3 1 2 3
c. Any commodity producers' associations, such asthe American Dairy Association or National WheatProducers Association ............... .......... ................... .1 2 3 1 2 3
d. Any women's branches of commodity organizations,such as the Cattlewomen or the Wheathearts .......................... 1 2 3 1 2 3
e. Women's farm organizations, such as Women forAgriculture, American Agri-Women, or Women Involvedin Farm Economics.......................................... 1 2 3 1 2 3
f. Farm political action groups, such as a state Family FarmMovement or National Save The Family Farm Coalition..............1 2 3 1 2 3
g. Local governing board, such as school board or towncouncil .......................... .............................. .1 2 3 1 23
h. Marketing Cooperative .................................................. 1 2 3 1 2 3
i. Farm Supply Cooperative ............................ .............. 2 3 1 2 3$s
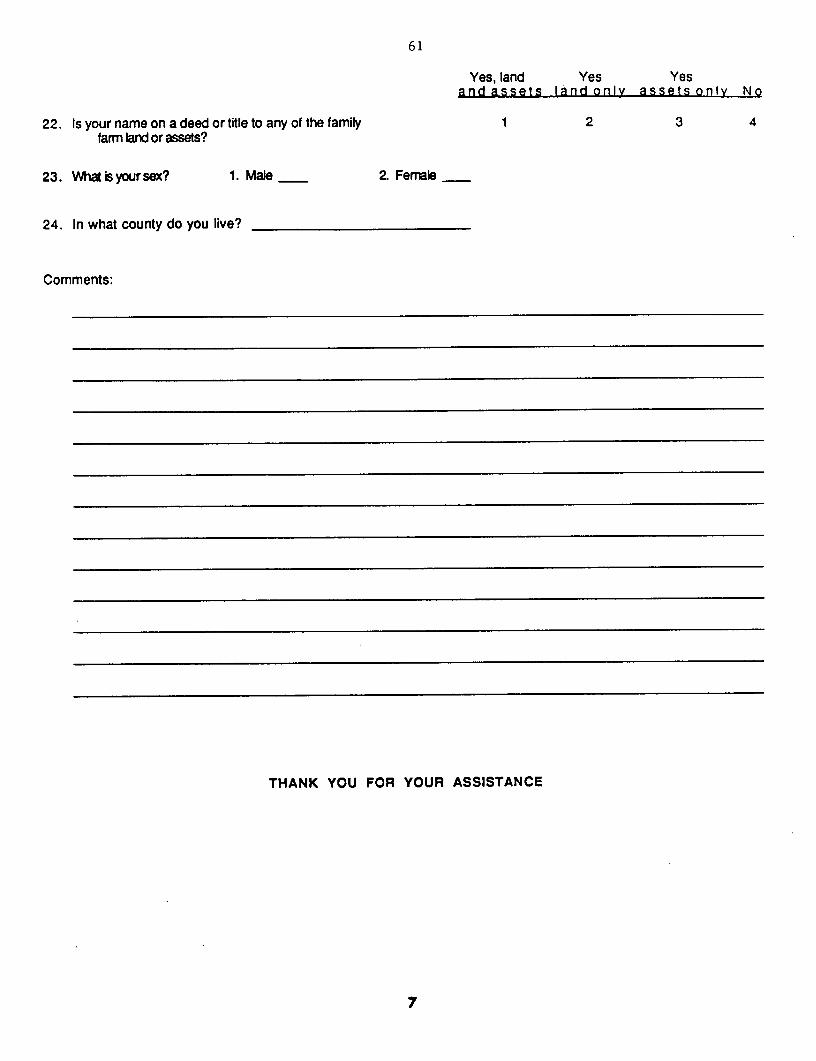
61
Yes, land Yes Yesand assets land only assets only No
22. Is your name on a deed or title to any of the family 1 2 3 4farm land or assets?
23. What is your sex? 1. Male 2. Female
24. In what county do you live?
Comments:
THANK YOU FOR YOUR ASSISTANCE
7

60
Yourself Spouse14. In the past five years, have you or your spouse: Yes tb Yes No
a. Attended public meetings about farm or other issues .................. 1 2 1 2
b. Talked to or written to government officials about publicor farm issues ........................................................................... 1 2 1 2
c. Signed a petition ........................................................ .... 1 2 1 2
d. Become more active in political groups ....................................... 1 2 1 2
e. Participated in a protest over farm foreclosures ........................... 1 2 1 2
15. Until you were sixteen, did you live mostly on a farm? 1. Yes _2. No
16. With which political party do you identify? 1. Democratic 2. Independent 3. Republican
17. Does your family have a religious preference? 1. No 2. Yes If yes, please circle thedenomination.
1. Episcopalian, United Church of Christ, Presbyterian.
2. Methodist, Lutheran, Disciples of Christ, Christian, Central Christian, Disciples of Christ, First Christian, Northern
Baptist, Reformed (such as Christian Reformed).
3. Southern Baptist, Church of Christ, EvangelicalFundamentalist, Nazarene, PentecostalHoliness, Assembly of
God, Church of God, Adventist.
4. Catholic 8. Christian Scientist
5. Jewish 9. Unitarian-Universalist
6. Church of Latter Day Saints 10. Other
7. Jehovah's Witness
18. If you worked off the farm or were self-employed in 1988, how much net income did you earn?
1. Less than $2,500 6. $30,000--$39,999
2. $2,500--$4,999 7. $40,000--$49,999
3. $5,000--$9,999 8. $50,000--$59,999
4. $10,000--$19,999 9. $60,000--$69,999
5. $20,000--$29,999 10. Over $70,000
19. What percent of your family's net income for 1988 was derived from your off farm work? %___
20. On an average, how many hours per week do you work on the farm? _ hours
21. Would you recommend farming to your children or another relative? 1. Yes_ 2. No - 3. Not sure
6