Do Green Exchange-Traded Funds Outperform the S&P500? · EXCHANGE-TRADED FUNDS AND SAMPLE DATA...
10
Do Green Exchange-Traded Funds Outperform the S&P500? Omid Sabbaghi University of Detroit Mercy This study provides an empirical analysis of green index funds. Green exchange-traded funds (ETFs) are new financial instruments that invest in companies exhibiting positive environmental, social, and corporate governance (ESG) characteristics, and provide a low-cost approach to socially responsible investments. In this paper, we provide one of the first investigations of the return dynamics for these financial instruments. Specifically, we construct an equally-weighted portfolio of green ETFs and compare its return performance to that of the S&P500 equity index. Using data at the monthly frequency, we find that our equally-weighted green portfolio outperforms the S&P500 prior to the financial market collapse of 2008. However, consistent with recent research, we find that these new financial instruments are highly volatile and subsequently underperform the S&P500 in the years following the financial market crash. Our findings suggest that investors proceed with caution when encountering similar green- related financial instruments. INTRODUCTION The financial implications of sustainability are growing in importance. In particular, there has been a recent trend towards sustainable investing in today’s global markets. For example, in 2008, Mercer announced that it would integrate questions and analyses pertaining to the environmental, social, and corporate governance (ESG) dimensions in its manager searches on behalf of all its clients. In a 2009 global survey, 63 percent of funds and fund manager respondents said that they are including responsible investing elements into contractual arrangements with external managers of their investments (United Nations Principles for Responsible Investment, 2009). That is, a majority of institutional investors are increasingly investing in firms that are well-governed, environmentally friendly, and socially responsible. Such firms are often referred to as being green and promise a long-term value creation strategy. Recent research has investigated the relationship between environmental stewardship and financial performance. These studies include Chia et al. (2009), Porter & van der Linde (1995), Reinhardt (1999), Klassen & McLaughlin (1996), Konar & Cohen (2001), and Clemens (2006). In particular, these studies argue that firms actively undertaking green measures towards the environment attain future cost savings by increasing efficiency and reducing compliance costs. In theory, this translates into higher returns for green firms. Using financial event methodology, Klassen & McLaughlin (1996) find that significant positive returns are associated with strong environmental management. In addition, environmental awards were found to be highly correlated with increases in market valuation. Similarly, Konar & Cohen (2001) also find that there is a positive correlation between environmental and financial performance. During the three-year period from 2005 through 2008, Chia et al. (2009) find that a sample portfolio of renewable 50 Journal of Accounting and Finance vol. 11(1) 2011
Transcript of Do Green Exchange-Traded Funds Outperform the S&P500? · EXCHANGE-TRADED FUNDS AND SAMPLE DATA...

Do Green Exchange-Traded Funds Outperform the S&P500?
Omid Sabbaghi University of Detroit Mercy
This study provides an empirical analysis of green index funds. Green exchange-traded funds (ETFs) are new financial instruments that invest in companies exhibiting positive environmental, social, and corporate governance (ESG) characteristics, and provide a low-cost approach to socially responsible investments. In this paper, we provide one of the first investigations of the return dynamics for these financial instruments. Specifically, we construct an equally-weighted portfolio of green ETFs and compare its return performance to that of the S&P500 equity index. Using data at the monthly frequency, we find that our equally-weighted green portfolio outperforms the S&P500 prior to the financial market collapse of 2008. However, consistent with recent research, we find that these new financial instruments are highly volatile and subsequently underperform the S&P500 in the years following the financial market crash. Our findings suggest that investors proceed with caution when encountering similar green-related financial instruments. INTRODUCTION
The financial implications of sustainability are growing in importance. In particular, there has been a recent trend towards sustainable investing in today’s global markets. For example, in 2008, Mercer announced that it would integrate questions and analyses pertaining to the environmental, social, and corporate governance (ESG) dimensions in its manager searches on behalf of all its clients. In a 2009 global survey, 63 percent of funds and fund manager respondents said that they are including responsible investing elements into contractual arrangements with external managers of their investments (United Nations Principles for Responsible Investment, 2009). That is, a majority of institutional investors are increasingly investing in firms that are well-governed, environmentally friendly, and socially responsible. Such firms are often referred to as being green and promise a long-term value creation strategy.
Recent research has investigated the relationship between environmental stewardship and financial performance. These studies include Chia et al. (2009), Porter & van der Linde (1995), Reinhardt (1999), Klassen & McLaughlin (1996), Konar & Cohen (2001), and Clemens (2006). In particular, these studies argue that firms actively undertaking green measures towards the environment attain future cost savings by increasing efficiency and reducing compliance costs. In theory, this translates into higher returns for green firms. Using financial event methodology, Klassen & McLaughlin (1996) find that significant positive returns are associated with strong environmental management. In addition, environmental awards were found to be highly correlated with increases in market valuation. Similarly, Konar & Cohen (2001) also find that there is a positive correlation between environmental and financial performance. During the three-year period from 2005 through 2008, Chia et al. (2009) find that a sample portfolio of renewable
50 Journal of Accounting and Finance vol. 11(1) 2011

energy stocks outperforms a global market index as well as a sub-index consisting of traditional energy stocks.
On the other hand, studies such as Walley & Whitehead (1994), argue that adopting green measures may lead firms to realize negative returns. Their argument is based on the idea that firms are forced to invest significantly in technology as a consequence of regulation compliance and that the magnitude of the necessary investment leads to negative returns. Another argument often cited in regards to why green funds may exhibit negative returns is provided in Ambec & Lanoie (2008) and Renneboog et al. (2008). The latter studies argue that ethical funds may underperform over the long run since fund managers are constrained to a subset of the market portfolio. Boulatoff & Boyer (2009) examine 310 green companies and find that Nasdaq firms outperform the green firms, whereas certain green industries dominate the Nasdaq. In addition, their study finds that green firms exhibit larger R&D, capital expenditures, and better corporate governance relative to Nasdaq firms.
This study contributes to the emerging literature on green investments in numerous ways. First, we investigate the return dynamics for a portfolio comprising of equal investment weights in different green exchange-traded funds (ETFs). In this study, we define green ETFs as funds investing in companies that exhibit positive environmental, social, and corporate governance (ESG) characteristics. Green exchange-traded funds are new financial instruments as inception dates for these funds begin in January 2005. Recently, Sabbaghi (2011) identifies a sample of green ETFs and finds that volatility persistence levels are significantly high for these financial instruments. In the latter study, GARCH models are important in modeling the time-varying volatility.
Second, we provide a comparative analysis of our green portfolio with respect to the S&P500 equity index. We examine this issue empirically via several techniques. One, we examine the time-series of the cumulative returns over the 2005 through 2010 period. Furthermore, our study provides annualized average and geometric return statistics for the equally-weighted green portfolio and the S&P500 index. In addition, we study the respective annualized return standard deviations and adjust for possible differences with a modified version of the Sharpe ratio, first proposed by Statman (1987). As an alternate means of assessing performance with risk-adjusted returns, we also conduct a CAPM analysis for our green portfolio and calculate Jensen’s alpha.
Finally, our paper investigates the return performance of the green ETF portfolio and the S&P500 over different sub-periods in time. In addition to providing performance metrics over the 2005- 2010 time period, our study investigates the behavior of the green portfolio prior to the market collapse of 2008 and contrasts it with the time period that followed shortly thereafter. The recent global financial crisis has been integral in helping to bring ESG issues much attention. The performance of the green ETF portfolio across different time periods serves as an important robustness check and highlights the degree of potential persistence in returns.
The present study proceeds as follows. First, we present an overview of green ETFs and the sample data. Next, we present the empirical methodology in assessing return performance. Consequently, we present the empirical results and an interpretation of the descriptive statistics, asset pricing tests, and time-series evidence. Finally, we offer concluding remarks and provide further directions for future research. EXCHANGE-TRADED FUNDS AND SAMPLE DATA
Exchange-traded funds (ETFs) are variants of mutual funds that were first introduced in the early 1990s. ETFs allow investors to trade index portfolios, similar to how individual investors trade shares of stock. The first ETF was the Standard & Poor’s Depository Receipt, also known as SPDR. Investing in the SPDR ETF is analogous to holding a portfolio matching the S&P 500 index. ETFs are designed to provide a convenient means to investing in a specific basket of securities. Gastineau (2001) documents the history and evolution of ETFs in our financial markets.
One of the advantages to investing in ETFs is that they allow for a low-cost approach to market speculation. For instance, if investors believe that green companies are likely to exhibit short-term performance increases in the near future, green ETFs would provide a convenient channel in capturing
Journal of Accounting and Finance vol. 11(1) 2011 51

this speculation. The green ETFs would be natural investments given that they exhibit low expense ratios and may focus on a specific industry.
In the present study, we identify a sample of green ETFs through the Internet site SustainableBusiness.com, which defines sustainable businesses as: “Businesses that contribute to an equitable and ecologically sustainable economy”. Consistent with recent research, we focus on the seminal 15 green ETFs identified in Sabbaghi (2011). These ETFs are the test assets in our empirical analysis. Table 1 presents the investment objectives, the ticker symbols and the fund inception dates for these funds. In regards to the relevant financial exchanges, the green ETFs in the present study are dominantly traded on the New York Stock Exchange (NYSE).
We extract closing price data for the identified green ETFs at the monthly frequency from the Yahoo! Finance database. Specifically, we obtain data that begins from the inception date of the seminal green ETF: our sample data ranges from January 2005 through November 2010. In addition to extracting data for the ETFs, we also obtain closing price data for the S&P500 index using the identical time period and data frequency.
Exchange-traded funds are known to replicate market indices. The green ETFs in the present study vary from one another in important ways. For example, while one specific ETF selects securities on the relative importance of water in their respective business models, another ETF invests in companies on the extent to which their revenues depend on solar or alternative sources of energy. In addition, the present study includes ETFs that invest in businesses specializing in cleaner, less costly, and more efficient means of transportation. In sum, the 15 green ETFs capture the multiple dimensions of sustainable investing in today’s global markets.
52 Journal of Accounting and Finance vol. 11(1) 2011

TABLE 1
SYMBOL Start Date Investment Objectives CGW May 2007 Seeks to replicate the performance of the S&P Global Water Index. The S&P Global
Water Index is comprised of approximately 50 securities selected based on the relative importance of the global water industry within the company’s business model.
TAN April 2008 Seeks to replicate the performance of the MAC Global Solar Energy Index. The Index is comprised of approximately 25 stocks selected based upon the relative importance of solar power within the company’s business model.
FAN June 2008 Seeks to replicate the performance of the ISE Global Wind Energy Index. Comprises of companies that are actively engaged in some aspect of the wind energy industry such as the development or management of a wind farm, the production of distribution of electricity generated by wind power, involvement in the design, manufacture or distribution of machinery or materials designed specifically for the wind energy industry.
DSI November 2006
Seeks to replicate the performance of the FTSE KLD 400 Social Index, which is designed to provide exposure to the common stocks of companies that exhibits positive environmental, social, and governance characteristics.
KLD January 2005
Seeks to replicate the performance of the FTSE KLD Select Social Index, which is designed to maximize exposure to large capitalization companies that exhibit positive environmental, social, and governance characteristics.
GEX May 2007 Seeks to replicate the Ardour Global Index, which provides exposure to publicly traded companies worldwide that derive over 50% of total revenues from the alternative energy industry.
KWT April 2008 Seeks to replicate the Ardour Solar Energy Index, which provides exposure to publicly traded companies from around the world that derive at least 66% of their revenues from solar energy.
PZD October 2006
Based on the Cleantech Index, which is designed to identify companies within the cleantech industry, that is, companies that produces any knowledge-based product or service that improves operation, performance, productivity or efficiency, while reducing costs, inputs, energy consumption, waste or pollution.
PBD June 2007 Based on the WilderHill New Energy Global Innovation Index. Composed of companies that focus on greener and generally renewable sources of energy and technologies facilitating cleaner energy.
PTRP September 2008
Based on the Wilder NASDAQ OMX Global Energy Efficient Transport Index. Includes global companies engaged in businesses that the Index provider believes stand to benefit substantially from a societal transition toward using cleaner, less costly, and more efficient means of transportation.
PIO June 2007 Based on the Palisades Global Water Index. Comprised of a group of global companies that focuses on the provision of potable water, the treatment of water and the technology and services that are directly related to global water consumption.
PWND July 2008 Based on the NASDAQ OMX Clean Edge Global Wind Energy Index. Designed to measure the performance of global companies engaged in the wind energy industry, which are primarily manufacturers, developers, distributors, installers, and users of energy derived from wind sources.
PHO December 2005
Based on the Palisades Water Index. Seeks to identify a group of companies that focuses on the provision of potable water, the treatment of water and the technology and services that are directly related to water consumption.
PBW March 2005 Based on the WilderHill Clean Energy Index. Composed of companies that focus on greener and generally renewable sources of energy and technologies facilitating cleaner energy.
PUW October 2006
Based on the WilderHill Progressive Energy Index. Composed of companies that exhibit transitional energy technologies significant in improving the use of fossil fuels and nuclear power.
Source: Sabbaghi (2011)
Journal of Accounting and Finance vol. 11(1) 2011 53

EMPIRICAL FRAMEWORK
We examine the return generating process for the green ETF index funds and the S&P500 index over the January 2005 through November 2010 period. We write the monthly closing price for the ith green ETF at time t, ,i tp , as:
, , 1 ,i t i t i tp p (1)
The innovations ,i t are independent and identically distributed over time. We define the monthly rate of
return for the ith green ETF for month t, ,i tr , as the continuously compounded return:
, , , 1log( ) log( )i t i t i tr p p (2) In this study, we construct a portfolio with equal investment weights in the 15 green ETFs, henceforth
the green ETF portfolio. Formally, the monthly return for the green portfolio p is given by the monthly, cross-sectional average of the individual green ETF returns:
15
, ,1
115p t i t
ir r (3)
Similarly, we define the monthly return for the S&P500 index using the log differences in closing levels. Formally, the return for the S&P500 in month t, ,SP tr , is given by:
, , , 1log( ) log( )SP t SP t SP tr p p (4) We compare the return performance of the green ETF portfolio with respect to the S&P500 using
several metrics. These metrics include the annualized arithmetic mean return, annualized geometric mean return, and the annualized standard deviation of returns. In addition, we conduct a CAPM analysis and calculate Jensen’s alpha, a performance measure that uses beta as a measure of risk, for the green ETF portfolio. Formally, our asset pricing test is given by:
p f p p SP f pr r r r e (5)
where pr is the monthly return of the green ETF portfolio, fr is the monthly return of the 30-day U.S.
Treasury bills, SPr is the monthly return of the S&P500, and pe is the residual. In addition to the CAPM pricing regression, our study calculates the excess standard-deviation-
adjusted return, or eSDAR .This metric is a modified version of the Sharpe ratio and leverages the green ETF portfolio to have the S&P500’s standard deviation. In other words, the eSDAR allows us to examine the extent to which higher returns add to performance more than its higher standard deviation adding to it. Similar studies have used the eSDAR to compare assets with differing standard deviations. For example, Statman (1987) proposes the use of the eSDAR when examining portfolios of stocks versus bonds. Similarly, Modigliani and Modigliani (1997) calculate the eSDAR when adjusting the performance of different portfolios for risk. DISCUSSION OF EMPIRICAL RESULTS
Figure 1 plots the cumulative returns of the green ETF portfolio and the S&P500 index over the 2005 – 2010 period. In agreement with the findings presented in Chia et al. (2009), the green portfolio outperforms the S&P500 index over the 2005 – 2008 period. The higher returns for the green portfolio are persistent during this time and continue to increase substantially. For instance, in April 2008, the green portfolio realizes a cumulative return of 40 percent, whereas the S&P500 index realizes a cumulative return of 15 percent. Hence, Figure 1 provides visual confirmation of outperformance from 2005 through 2008.
54 Journal of Accounting and Finance vol. 11(1) 2011

FIGURE 1
We plot the time series of the cumulative returns for the equally-weighted green ETF portfolio and the S&P500 index. For each month, the returns of the equally weighted green portfolio return are given by the cross-sectional average of the green ETF returns. Fifteen green ETFs comprise the equally-weighted green portfolio. Monthly data begins in January 2005 and ends November 2010.
Investments in green ETFs, however, are not immune to market volatility. In Figure 1, we observe
that both the S&P500 and the green ETF portfolio experience parallel dives into negative return territory following the financial market crash of 2008. In addition, the green ETF portfolio remains consistently below the S&P500 from a return standpoint in the years that follow the market crash, suggesting that green ETFs are cyclical investments. In other words, green ETFs fail to provide a hedge against market volatility.
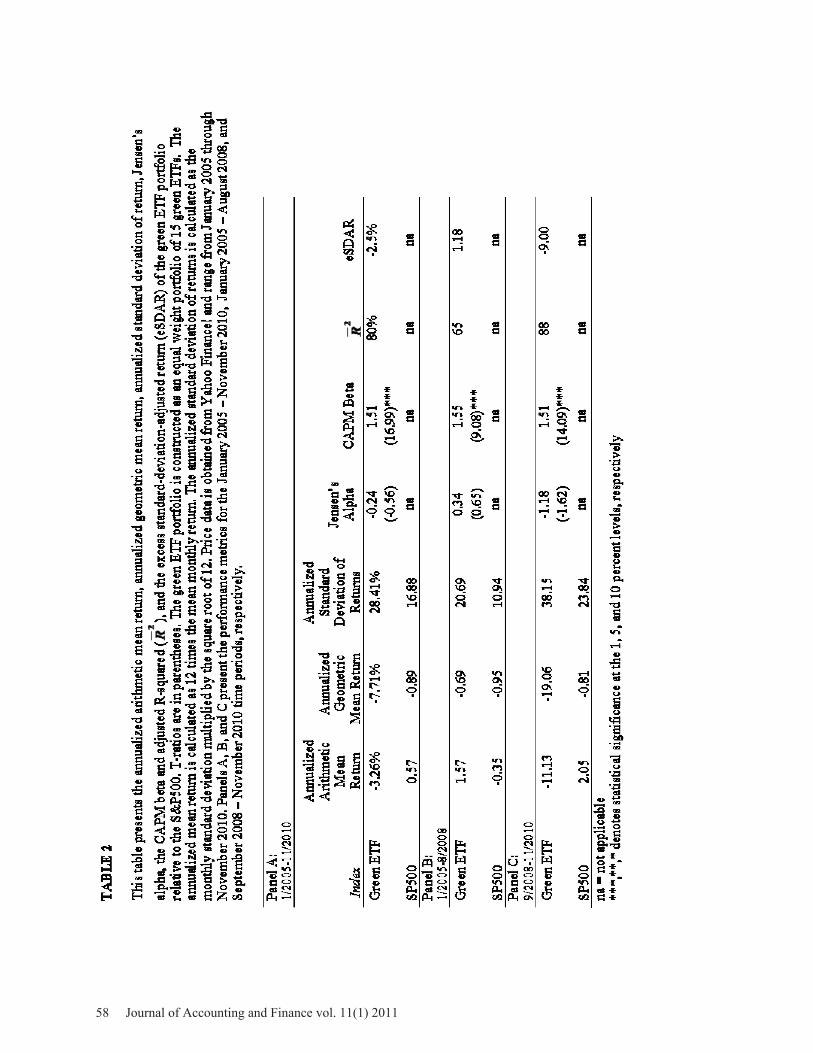
Table 2 Panel A provides performance metrics for the green ETF portfolio and the S&P500 index over the 2005 – 2010 period. During this time, the green ETF portfolio achieves an annualized mean return of -3.26 percent, whereas the S&P500 index realizes a positive gain of 57 basis points. The annualized geometric return for the SP500 is also higher when comparing it to the realized geometric return for the green ETF portfolio. In addition, the green ETF portfolio realizes an annualized standard deviation of 28.41 percent, significantly higher than the S&P500’s 16.88 percent. This result confirms that the green portfolio is highly volatile and is consistent with the empirical findings documented in Sabbaghi (2011).
-80
-60
-40
-20
0
20
40
60
Cumulative Returns: Green ETFs vs SP500
GreenETF SP500
Journal of Accounting and Finance vol. 11(1) 2011 55

Adjusting for risk, we find that the green ETF portfolio realizes a CAPM beta of 1.51. The portfolio beta is highly significant at the 1 percent level, and further confirms the cyclical nature of the green portfolio. In addition, Jensen’s alpha for the green portfolio is -0.24. However, the alpha estimate is statistically indistinguishable from zero, suggesting that the green portfolio is neither overpriced nor underpriced. The adjusted R-squared of 80 percent reinforces the close relationship that exists between the green ETF portfolio and the SP500 index during this time.
The degree to which the negative returns of the green portfolio adds to its relative performance over the 2005 – 2010 time period is presented in Table 2 Panel A. Specifically, the green ETF portfolio realizes an excess standard-deviation-adjusted return of -2.5 percent, suggesting that the portfolio’s higher negative returns added to its performance more than its higher standard deviation added to it.
The return behavior of the green ETF portfolio differs significantly prior to the market collapse. Table 2 Panel B presents performance statistics for the January 2005 – August 2008 time period. Consistent with the recent work of Chia et al. (2009), we observe that our equally-weighted green portfolio significantly outperforms the S&P500 during this time period. Specifically, the green ETF portfolio earns an annualized mean return of 1.57 percent versus the S&P500, which realizes a negative 35 basis points annualized return. Similar to Panel A, the green ETF portfolio exhibits a higher annualized standard deviation relative to the S&P500. However, the green portfolio realizes a positive 1.18 percent excess standard-deviation-adjusted return, suggesting that the portfolio’s higher returns added to its performance more than its higher standard deviation added to it. Similar to Panel A, Jensen’s alpha is statistically indistinguishable from zero and the realized CAPM beta is near 1.5. The decrease in the adjusted R-squared suggests that the variation in returns for the green portfolio depends less on market forces, as proxied by the S&P500.
Following the market collapse of September 2008, we observe that the green portfolio performs disastrously relative to the S&P500 in Panel C. In particular, the equally-weighted green ETF portfolio earns an abysmal -11.13 percent annualized average return versus the S&P500’s 2.5 percent. The annualized geometric return for the green ETF portfolio is also substantially lower than the S&P500: -19 percent versus -81 basis points.
In light of the higher annualized standard deviation for the green portfolio, we observe an excess standard-deviation-adjusted return of -9.00 percent. This result is similar to the eSDAR observed in Panel A and reconfirms the higher negative returns inherent in the green portfolio. With respect to the asset pricing test, Jensen’s alpha remains negative, however approaches statistical significance at the 10 percent level. In addition, the adjusted R-squared increases to nearly 90 percent, reinforcing the parallel relationship that exists between the green portfolio and the S&P500 during this time. CONCLUDING REMARKS AND FUTURE RESEARCH
In this study, we empirically investigate the return behavior of green exchange-traded funds (ETFs) in relation to the S&P500. Green ETFs are new investment vehicles which focus on companies that exhibit positive environmental, social, and corporate governance (ESG) characteristics in the 21st century. The seminal fifteen green ETFs identified in Sabbaghi (2011) serve as the test assets for the present empirical analysis.
Several findings are reported in this study. First, we find that an equally-weighted portfolio of green ETFs underperform the S&P500 over the 2005 – 2010 period. This finding contrasts with recent research underlining a positive relationship between environmental stewardship and financial performance. Rather, we find that this relationship is not immune to rises in market volatility. While the January 2005 – August 2008 time period presents evidence of a positive relationship, we find that it is reversed after the financial market collapse of September 2008. Thus, green ETFs do not serve as hedges against market volatility.
Second, in agreement with recent research, we find that green ETFs are highly volatile instruments. Conducting a CAPM analysis, we find that their betas are significantly higher than 1. In addition, annualized return standard deviations for our equally-weighted green portfolio range from 20 percent
56 Journal of Accounting and Finance vol. 11(1) 2011

through 38 percent. The fact that the green ETFs are financial instruments in a state of infancy warrants caution amongst investors.
Third, we find that the higher standard deviation for the green is not the sole reason for the differences in returns. Using a modified version of the Sharpe ratio, we find that the returns for the green portfolio are inherently negative. That is, we find that the green portfolio’s returns add more to its performance than its respective standard deviation.
Several avenues lie ahead for future research. First, green exchange-traded securities provide a low-cost approach for the individual retail investor to gain exposure to common stocks exhibiting positive ESG characteristics. It would be of interest to conduct a time-series analysis of the trading volume associated with these securities. An examination of trading volume over time provides additional insight in regards to the demand that exists for these types of securities.
In addition to investigating trading volume, it would be of interest to examine the return properties of other related green financial instruments. Green financing is predicted to grow in the future given its emerging importance in developing lower-carbon economies. Globally, economies will require investments in new infrastructure. For example, the World Bank and the International Finance Corporation have issued Green Bonds to finance new infrastructure and projects. Since 2008, the World Bank has issued more than 1.5 billion dollars in Green Bonds (World Bank 2010). An examination of Green Bonds and their return dynamics remain to be reported in future work.
Journal of Accounting and Finance vol. 11(1) 2011 57
58 Journal of Accounting and Finance vol. 11(1) 2011

REFERENCES Ambec, S., & Lanoie, P. (2008). Does It Pay to Be Green? A Systematic Overview. The Academy of Management Perspectives, 22, 45-62. Boulatoff, C., & Boyer, C.M. (2009). Green Recovery: How Are Environmental Stocks Doing? The Journal of Wealth Management, 12, 9-20. Chia, C.P., Goldberg, L., Owyong, D.T., Shepard,P., & Stoyanov T. (2009). Is There a Green Factor? The Journal of Portfolio Management, 35, 34-40. Clemens, B. (2006). Economic incentives and small firms: Does it pay to be green? Journal of Business Research, 59, 492-500. Gastineau, G.L. (2001). Exchange-Traded Funds: An Introduction. Journal of Portfolio Management, 27, 88-96. Klassen, R.D., & McLaughlin, C. (1996). The Impact of Environmental Management on Firm Performance. Management Science, 42, 1199-1214. Konar, S., & Cohen, M. (2001). Does the Market Value Environmental Performance? Review of Economics and Statistics, 83, 281-289. Modigliani, F. & Modigliani, L. (1997). Risk-Adjusted Performance. Journal of Portfolio Management, 23, 45-54. Porter, M. & van der Linde, C. (1995). Green and competitive. Harvard Business Review, 73, 121-134. Reinhardt, F. (1999). Market failure and the environmental policies of firms. Journal of Industrial Ecology, 3, 9-21. Renneboog, L., Ter Horst, J., & Zhang, C. (2008). Socially responsible investments: Institutional aspects, performance, and investor behavior. Journal of Banking and Finance, 32, 1723-1742. Sabbaghi, O. (2011). The Behavior of Green Exchange-Traded Funds. Managerial Finance. Statman, M. (1987). Bonds versus stocks: Another look. The Journal of Portfolio Management, 13, 33-38. Walley, N. & Whitehead, B. (1994). It’s not easy being green. Harvard Business Review, 72, 46-52. United Nations Principles for Responsible Investment. (2009). New data signals growing ‘culture change’ amongst significant portion of global investors. Retrieved December 1, 2010, from United Nations, Principles for Responsible Investment Web site: http://www.unpri.org/archived/ World Bank. (2010). Green Bond. Retrieved December 2, 2010, from World Bank Web site: http://treasury.worldbank.org/cmd/pdf/WorldBank_GreenBondFactsheet.pdf
Journal of Accounting and Finance vol. 11(1) 2011 59