DML13 Mobile First!
29
©TNS 2012 The Mobile revolution; impact for marketeers Martin Warmelink Client service director and Digital Lead TNS Nipo
Transcript of DML13 Mobile First!

©TNS 2012
The Mobile revolution; impact for marketeers
Martin Warmelink Client service director and Digital Lead TNS Nipo

©TNS 2012
2

©TNS 2012
Smartphone ownership
3
Tablet in household
55% 30% 0%
10%20%30%40%50%60%
2009 2010 2011 20120%
10%20%30%40%50%60%
2009 2010 2011 2012
2012 sales Smartphone %: 67% OS: - Android 65% - IOS 25% - Blackberry 5%

©TNS 2012
4
©TNS 2012
5
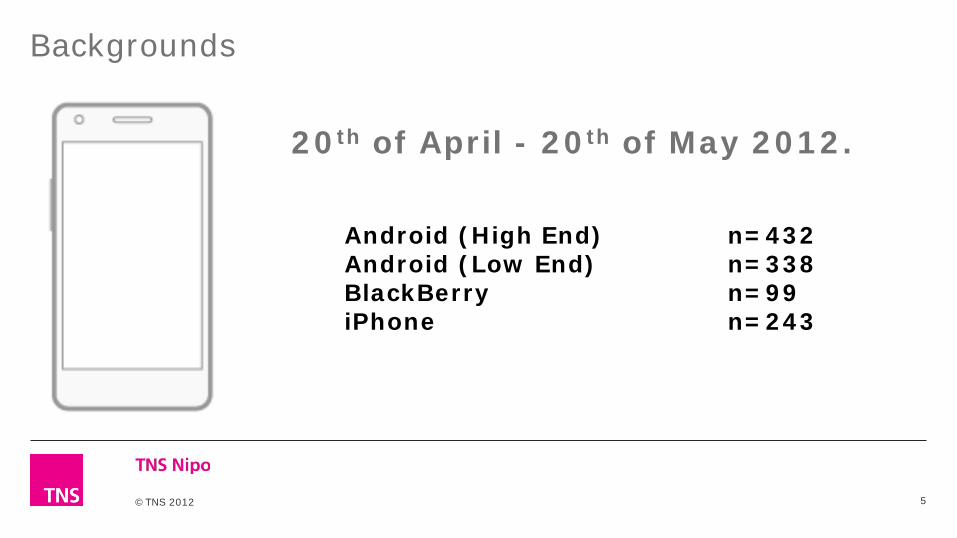
Backgrounds
20th of April - 20th of May 2012.
Android (High End) n=432 Android (Low End) n=338 BlackBerry n=99 iPhone n=243
©TNS 2012
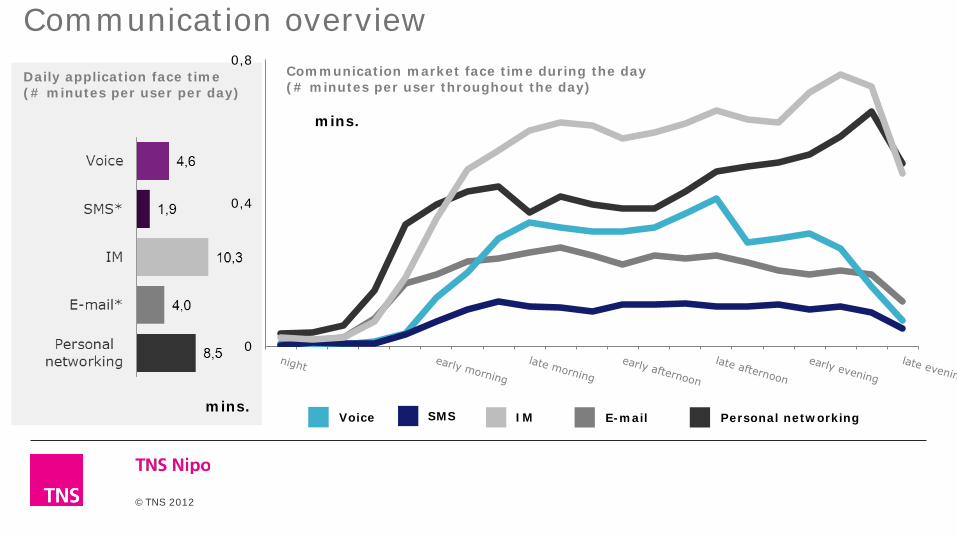
mins.
Daily application face time (# minutes per user per day)
Communication market face time during the day (# minutes per user throughout the day)
0
0,4
0,8
Voice SMS IM E-mail Personal networking
mins.
Communication overview

©TNS 2012
7
Quiz: How much time spent on apps and mobile websites per day? (excluded Voice, SMS and system apps)
a. Less than 15 minutes b. Between 15 and 30 minutes
c. Over 30 minutes
©TNS 2012
8
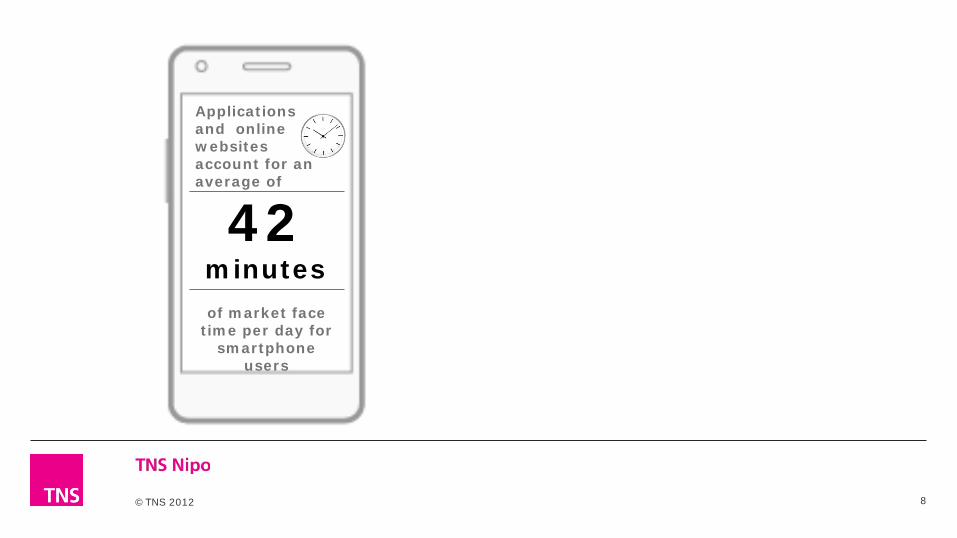
Applications and online websites account for an average of
42 minutes of market face
time per day for smartphone
users

©TNS 2012
9
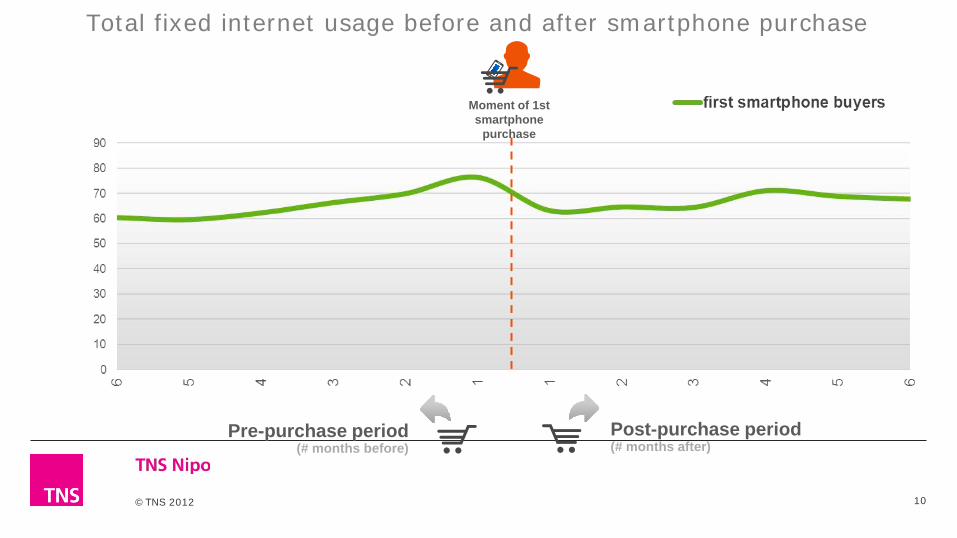
Pre-purchase period (# months before)
Total fixed internet usage before and after smartphone purchase
Moment of 1st smartphone
purchase
Post-purchase period (# months after)
©TNS 2012
10
Pre-purchase period (# months before)
Total fixed internet usage before and after smartphone purchase
Moment of 1st smartphone
purchase
Post-purchase period (# months after)

©TNS 2012
11
Fixed internet usage before and after purchase
Average # of minutes per user over 6 months period
Base: smartphone owners

©TNS 2012
12
Quiz: Who spends most time on the internet on their device?
a. Blackberry users b. Android users c. iPhone users
©TNS 2012
13
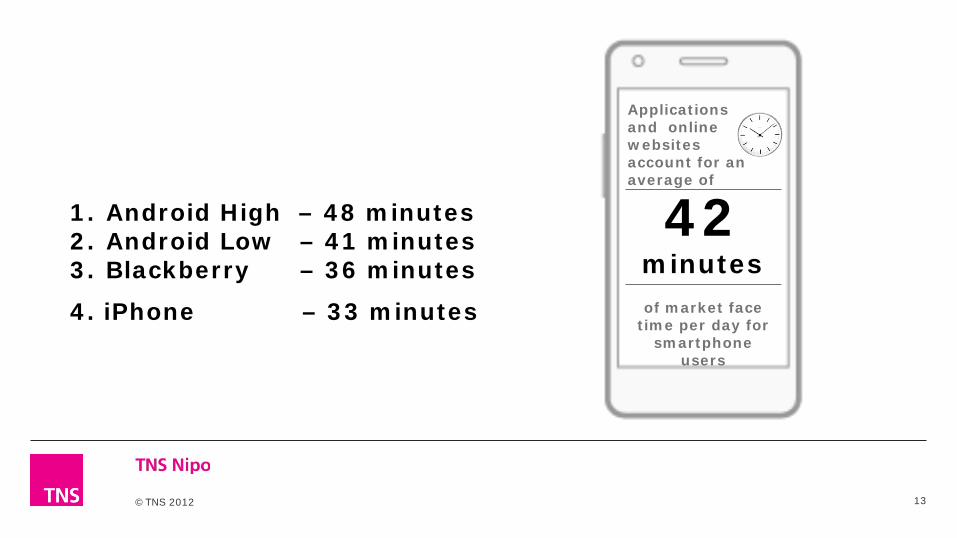
Applications and online websites account for an average of
42 minutes of market face
time per day for smartphone
users
1. Android High – 48 minutes 2. Android Low – 41 minutes 3. Blackberry – 36 minutes
4. iPhone – 33 minutes

©TNS 2012
14
Consumer Segmentation for Dummies

©TNS 2012
Total/Day
42
mins.
19 18
32
13
12 11
0,1
7
Communication
Entertainment
Information
Management
Social networking & connecting
Multi-media & entertainment
Online gaming
Personal interest
Shopping Knowledge & education
News, sport & weather
Personal admin
Planning and organising
©TNS 2012
16
Quiz: On which device do people spend more time?
a. Smartphones b. Tablets

©TNS 2012
17
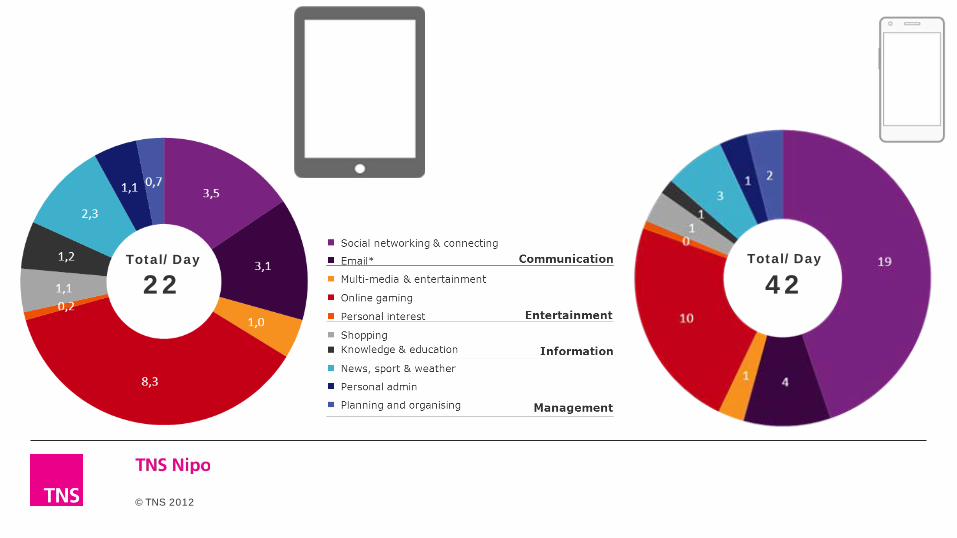
Applications and online websites account for an average of
22 minutes
of market face time per day for iPad
users

©TNS 2012
18
Quiz: What is the biggest activity on iPads?
a. Multimedia b. Social
c. Gaming
©TNS 2012
Total/Day
22 Total/Day
42
©TNS 2012
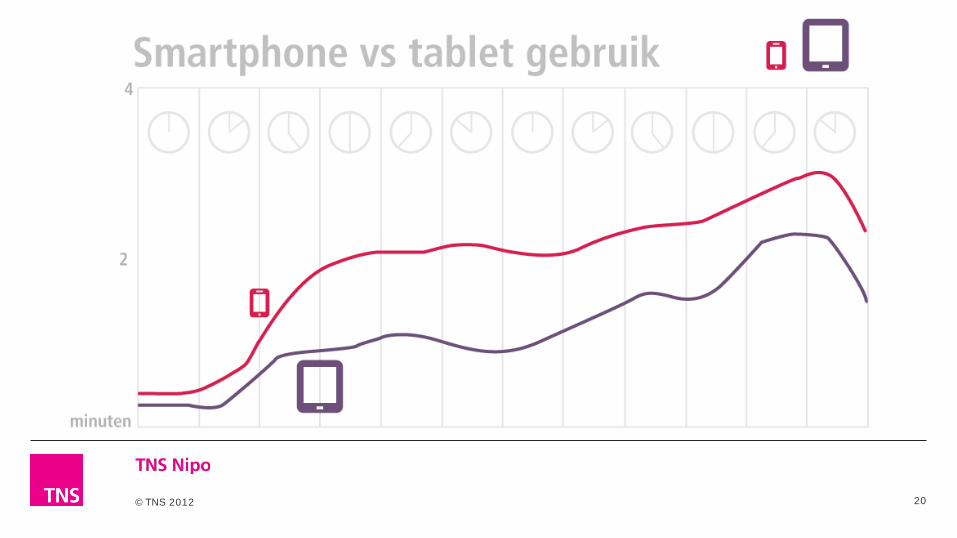
20

©TNS 2012
“Mobile is not always mobile”
*
3G
WiFi
17 minutes
a day
25 minutes a day
Total daily market time
©TNS 2012
22
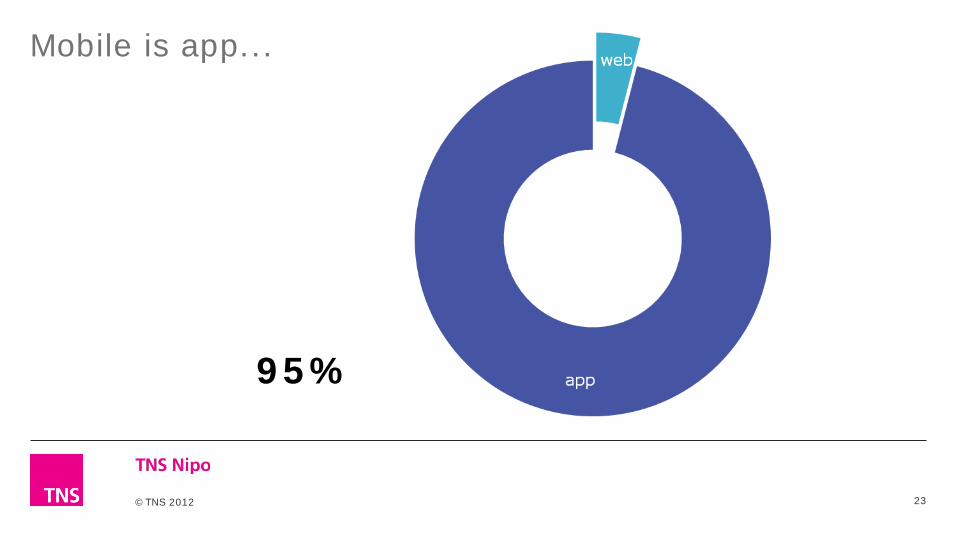
Quiz: App vs. web
a. 55% apps b. 75% apps c. 95% apps
©TNS 2012
23
Mobile is app...
95%
©TNS 2012
0%
10%
20%
30%
40%
50%
60%
70%
80%
90%
100%
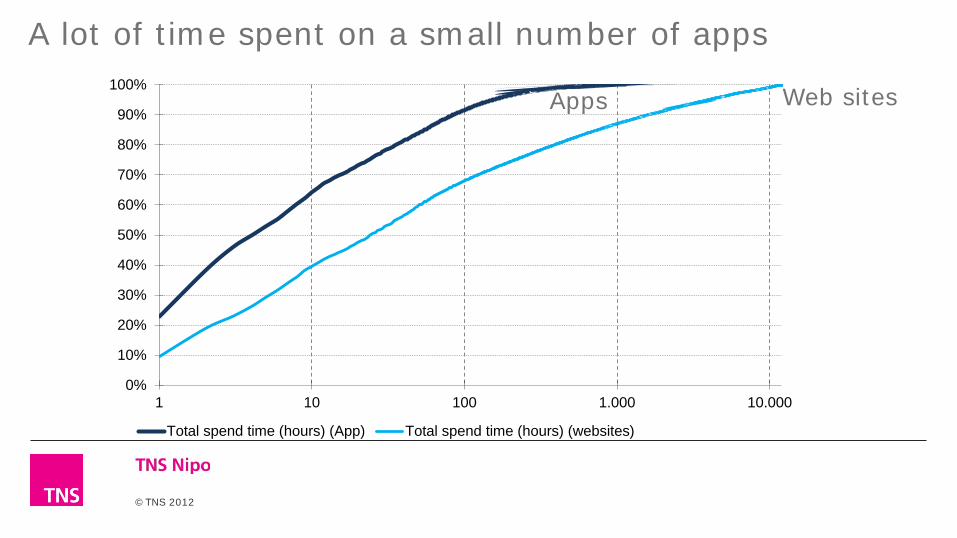
1 10 100 1.000 10.000
Total spend time (hours) (App) Total spend time (hours) (websites)
A lot of time spent on a small number of apps
Web sites Apps

©TNS 2012
25

©TNS 2012
Relevance
Independence
Convenience
Experience
Transparency
27%
13%
20%
16%
18% 8%

©TNS 2012
27
1. Build consumer journeys 2. Formulate KPI’s and how to measure
success 3. Create a uniform brand experience
across platforms 4. Begin with a responsive website 5. Maybe then apps…. 6. Launch and iterate
6 ingredients for a mobile strategy

©TNS 2012
28

©TNS 2012
Thank you
Martin Warmelink Client service director and Digital Lead TNS Nipo +31 653720496 [email protected]