Mobile-First Cloud-First Graphics - ferraiolo.comferraiolo.com/graphicalweb2013/Mobile-First...
17
© 2013 IBM Corporation Mobile-First, Cloud-First Graphics Project Verona Jon Ferraiolo, DE, IBM Emerging Technologies November 4, 2013
Transcript of Mobile-First Cloud-First Graphics - ferraiolo.comferraiolo.com/graphicalweb2013/Mobile-First...

© 2013 IBM Corporation
Mobile-First, Cloud-First Graphics
Project Verona
Jon Ferraiolo, DE, IBM Emerging Technologies November 4, 2013

© 2013 IBM Corporation
Mobile-First, Cloud-First Graphics (Project Verona)
2
What this talk will be about
IBM's project Verona – Visualization as a cloud service – Focus on mobile – In early stage development
Content and target audience – Mostly about architecture and implementation strategy (i.e., geeky) – Hopefully will offer food for thought about graphics technology trends – Encourage questions and comments from audience (during or after the talk)
© 2013 IBM Corporation
Mobile-First, Cloud-First Graphics (Project Verona)
3
Verona Executive Summary
Modern visualization stack – Focused on charts and other sorts of packaged visualizations – Cloud-first: delivered as a cloud service (currently, CloudFoundry) – Mobile-first: key focus is mobile interactivity and performance
Target users – Professional developers
• Many extension points to give pros the flexibility to address custom needs – Non-programmers and lightweight developers
• Visual authoring tool for non-programmers • Make it easy to customize using CSS and simple event handlers in JavaScript
Current status – Some things working today, but still much to do
Where is this ultimately headed? – Verona is an IBM Emerging Technologies project - technology exploration – Don’t know will happen ultimately. Open source? Productization?

© 2013 IBM Corporation
Mobile-First, Cloud-First Graphics (Project Verona)
4
Cloud-First
Invoked as a cloud service – Typical usage:
<div id="vis1"></div> <script src="http://<server>/1/vis?format=js&spec=111&data=222&selector=%23vis1"/>
where: format=js – tells service to deliver chart as client-side executable JavaScript spec=111 – identifies JSON “spec” for visual (describing chart type and chart options) data=222 – (optional) identifies data to use (data file id or url) selector=%23vis1 – identifies HTML element (#vis1) into which visual should be placed
– The JavaScript from SCRIPT tag will handle all rendering and (built-in) interactivity • (quick demo)
Includes a chart designer app and a user management system – (quick demo) – Each user gets his own private area in cloud for data and visuals – Ultimately, will add access control features (including groups)
Currently running on an internal IBM cloud (using CloudFoundry)
Designed to be part of a comprehensive cloud app development system – Promise of cloud app development: drastically reduce dev/deploy/maintenance time

© 2013 IBM Corporation
Mobile-First, Cloud-First Graphics (Project Verona)
5
Mobile-First
Challenges with mobile graphics – Slow networks with high latencies – Limited memory – Limited caching – Slow CPU => slow JavaScript execution
• Even downloading/parsing JavaScript can be significant • Mobile interactivity often requires substantial recalculation => animations/redrawing
can be very jerky (using either JS [SVG or Canvas] and CSS3+SVG)
Solutions – Push computation to the cloud wherever possible – Drastically minimize the JS that gets downloaded/executed on client – Clever client-side animation/redraw techniques to achieve smooth visual effects

© 2013 IBM Corporation
Mobile-First, Cloud-First Graphics (Project Verona)
6
Mixed client-server architecture for preparing/rendering visuals Built-in visual types, plus ability to install 3rd party libraries of visuals
– Each library consists of N visual types (e.g., bar, map, treemap, …)
Each visual type has its own complete implementation – Can use arbitrary client technologies to render on client – Verona’s charts currently use D3, but could use other, including WebGL
Implementation for each visual type provides both: – server.js
• prepare(vis) – Server-side logic, typically modifies vis object • client(vis) – (Optional) If needs to dynamically assemble client-side JS
– client.js • Makes calls to Verona core (and D3) to draw graphics into the viewport
– Each visual type implementation can decide how to split logic between server/client – FUTURE: server-side data reduction, level-of-detail, streaming data
Built-in visual types so far – line, grouped bar, stacked bar, bubble

© 2013 IBM Corporation
Mobile-First, Cloud-First Graphics (Project Verona)
7
Dynamic builds to minimize client
To address mobile performance limitations….
Leverages require.js and AMD modules (rendering code is AMD) <script src="require.js"></script> <script> require(["app/mod1"], function(mod1){ … main logic, references mod1 … }); ------- // mod1 define(["app/mod2", "app/mod3"], function(mod2, mod3){ … module implementation – references mod1, mod2, … });
Dynamic server-side builds using require.js – require.js optimizer on server to build client-side JavaScript
• Only include JS needed by a particular visual • Merges JS into single file and then minifies
Result: Minimal client-side runtime (not including data) – Libs: require.js (15K compressed), D3 (138K compressed) – Verona: spec + Verona JS (~8K compressed) – Current total = ~175K – Could be smaller – only download D3 features used by vis
Server Node/express Verona server require.js D3
Client Verona JS require.js D3
Client SCRIPT tag
Server dynamically builds JS to return to client
<div id="vis1"></div> <script src="http://<server>/1/vis/…
© 2013 IBM Corporation
Mobile-First, Cloud-First Graphics (Project Verona)
Rendering options
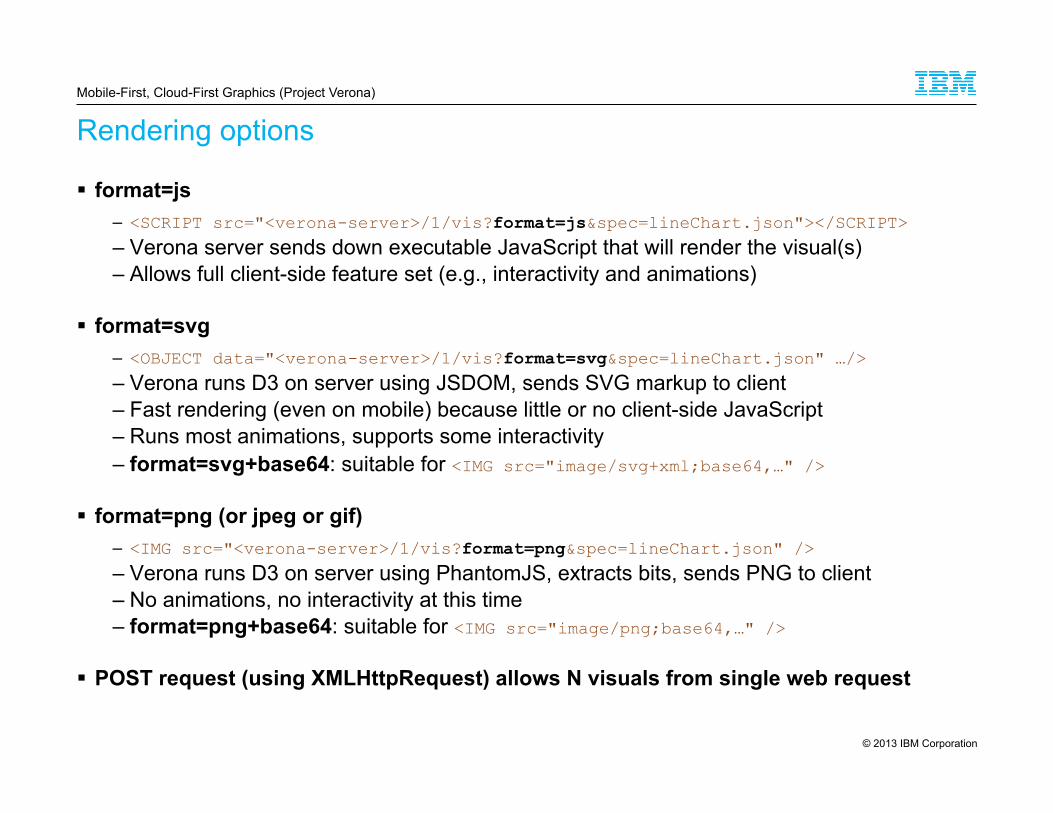
format=js – <SCRIPT src="<verona-server>/1/vis?format=js&spec=lineChart.json"></SCRIPT> – Verona server sends down executable JavaScript that will render the visual(s) – Allows full client-side feature set (e.g., interactivity and animations)
format=svg – <OBJECT data="<verona-server>/1/vis?format=svg&spec=lineChart.json" …/> – Verona runs D3 on server using JSDOM, sends SVG markup to client – Fast rendering (even on mobile) because little or no client-side JavaScript – Runs most animations, supports some interactivity – format=svg+base64: suitable for <IMG src="image/svg+xml;base64,…" />
format=png (or jpeg or gif) – <IMG src="<verona-server>/1/vis?format=png&spec=lineChart.json" /> – Verona runs D3 on server using PhantomJS, extracts bits, sends PNG to client – No animations, no interactivity at this time – format=png+base64: suitable for <IMG src="image/png;base64,…" />
POST request (using XMLHttpRequest) allows N visuals from single web request
© 2013 IBM Corporation
Mobile-First, Cloud-First Graphics (Project Verona)
9
Native-like smooth animations using pure browser technologies
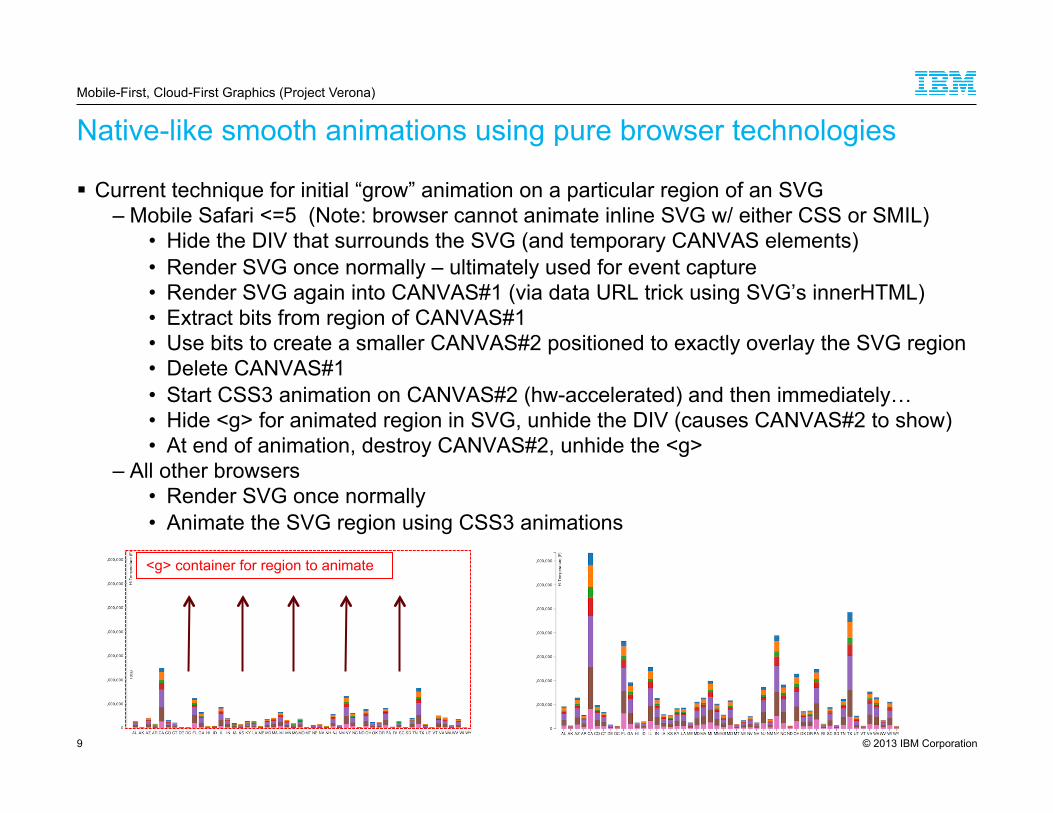
Current technique for initial “grow” animation on a particular region of an SVG – Mobile Safari <=5 (Note: browser cannot animate inline SVG w/ either CSS or SMIL)
• Hide the DIV that surrounds the SVG (and temporary CANVAS elements) • Render SVG once normally – ultimately used for event capture • Render SVG again into CANVAS#1 (via data URL trick using SVG’s innerHTML) • Extract bits from region of CANVAS#1 • Use bits to create a smaller CANVAS#2 positioned to exactly overlay the SVG region • Delete CANVAS#1 • Start CSS3 animation on CANVAS#2 (hw-accelerated) and then immediately… • Hide <g> for animated region in SVG, unhide the DIV (causes CANVAS#2 to show) • At end of animation, destroy CANVAS#2, unhide the <g>
– All other browsers • Render SVG once normally • Animate the SVG region using CSS3 animations
<g> container for region to animate

© 2013 IBM Corporation
Mobile-First, Cloud-First Graphics (Project Verona)
Mobile gestures
Mobile gestures we plan to implement soon – Flick – to show earlier or later data (assuming x-axis is a timeline) – Pinch – to change density of data shown (pinch inward => show more of timeline) – Press+hold – show details on graphic element under finger (hover on desktop)
Will take lots of experimentation and development to deliver smooth effects – Across all popular mobile devices and all common scenarios
© 2013 IBM Corporation
Mobile-First, Cloud-First Graphics (Project Verona)
Declarative D3
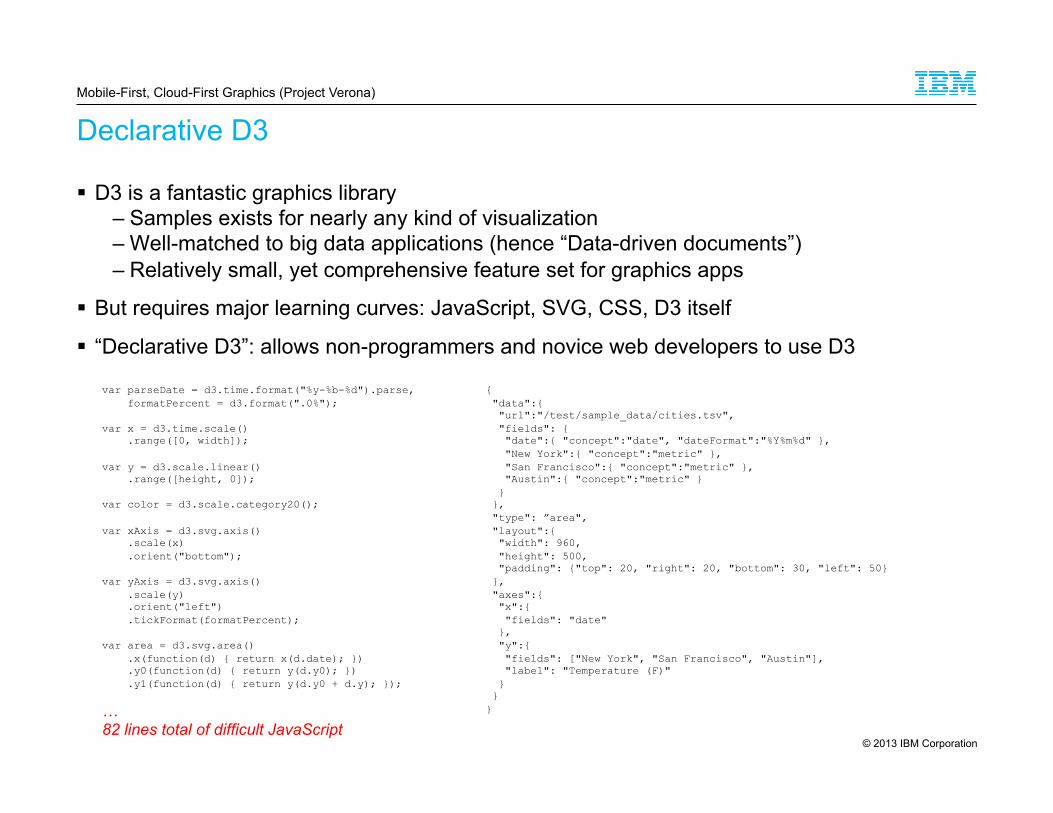
D3 is a fantastic graphics library – Samples exists for nearly any kind of visualization – Well-matched to big data applications (hence “Data-driven documents”) – Relatively small, yet comprehensive feature set for graphics apps
But requires major learning curves: JavaScript, SVG, CSS, D3 itself
“Declarative D3”: allows non-programmers and novice web developers to use D3
var parseDate = d3.time.format("%y-%b-%d").parse, formatPercent = d3.format(".0%");
var x = d3.time.scale() .range([0, width]);
var y = d3.scale.linear() .range([height, 0]);
var color = d3.scale.category20();
var xAxis = d3.svg.axis() .scale(x) .orient("bottom");
var yAxis = d3.svg.axis() .scale(y) .orient("left") .tickFormat(formatPercent);
var area = d3.svg.area() .x(function(d) { return x(d.date); }) .y0(function(d) { return y(d.y0); }) .y1(function(d) { return y(d.y0 + d.y); });
… 82 lines total of difficult JavaScript
{ "data":{ "url":"/test/sample_data/cities.tsv", "fields": { "date":{ "concept":"date", "dateFormat":"%Y%m%d" }, "New York":{ "concept":"metric" }, "San Francisco":{ "concept":"metric" }, "Austin":{ "concept":"metric" } } }, "type": ”area", "layout":{ "width": 960, "height": 500, "padding": {"top": 20, "right": 20, "bottom": 30, "left": 50} }, "axes":{ "x":{ "fields": "date" }, "y":{ "fields": ["New York", "San Francisco", "Austin"], "label": "Temperature (F)" } } }

© 2013 IBM Corporation
Mobile-First, Cloud-First Graphics (Project Verona)
12
GUI visualization design tool
Goals – Available as a web app (point browser to a URL) – Hosted on cloud infrastructure – Works well on tablets and desktops (& phones?) – Output is an HTML snippet (eg, a SCRIPT tag) – Clunky UI at first, but improve over time
Technical notes – UI built dynamically from JSON schema – Not using any major JavaScript libraries at this time
– Pull in small JS components as needed – User management (logins, etc)
• Using “passport” (a Node module) – Persisting data on cloud (e.g., datasets, visuals)
• Currently using mysql + sequelize • Maybe switch to mongodb + node-restful
{ "title": "Verona vis spec", "type": "object", "properties": { "data": { "description": ”…", "type": "object", "properties":{ "url":{ "description": ”…", "type": "string", "required" : true }, "type":{ "description": ”…", "type": "string", "enum":["csv”,…"], "default": "auto" }, … etc ….

© 2013 IBM Corporation
Mobile-First, Cloud-First Graphics (Project Verona)
Extensibility options
Verona designed to be highly extensible
Customizing pre-packaged visuals – Use app (or hand-code the JSON) to set chart options
• E.g., data file, stack-vs-grouped bars, chart size, axis labels – Use CSS to style elements of the chart – Author JS event handlers for custom interactivity and effects
Define new chart types – Minor changes: incrementally modify code for existing visual types – Major changes: author new visual types from scratch – Custom chart types need to be deployed on your cloud server by cloud admin

© 2013 IBM Corporation
Mobile-First, Cloud-First Graphics (Project Verona)
14
Current status – things that are working today
Node.js/express server Initial JSON format for visualizations (along with JSON Schema and validator) Data persistence with mysql+sequelize Image generation using PhantomJS Running on CloudFoundry/NextGen Fairly complete test suite using vows Dynamic server-side builds Render as JavaScript, SVG, PNG/JPEG/GIF (and base64 data protocol versions) Extensible architecture for different visualization types Native-like smooth animations using pure browser technologies Early work on mobile gestures Early version of GUI tool

© 2013 IBM Corporation
Mobile-First, Cloud-First Graphics (Project Verona)
15
Next Steps
Performance, performance, performance (focused on mobile) More work on mobile gestures More work on GUI tool Expose CSS hooks for custom styling Expose DOM and JS hooks for custom effects Data windowing (initially download a subset of data to client, pull addl data with gestures) Streaming data Many new features (including new vis types) Integration into customer-facing projects
Then…Open source? Productization?
© 2013 IBM Corporation
Mobile-First, Cloud-First Graphics (Project Verona)
16 16

© 2013 IBM Corporation
Mobile-First, Cloud-First Graphics (Project Verona)
17
THANKS! For more information, contact me:
– Jon Ferraiolo ([email protected])