Disaster Mitigation Module:Planning Flood- Prone … Network/Philippines/UP...1 Disaster Mitigation...
25
Disaster Mitigation Module:Planning Flood- Prone Areas using GIS Alex Ramon Q. Cabanilla Associate Professor School of Urban and Regional Planning Background The training module is part of the institutional commitment of UP to the CASITA Project to include disaster mitigation in SURP curriculum. As a result, disaster mitigation have been incorporated in the following courses: Land Use Planning as part of hazard mapping and planning special types of land use- flood-prone areas; and Special Problems in Urban Planning: Planning for Flood-Prone Areas. Disaster Mitigation Land Use Planning Course Special Problems in Urban & Regional Planning: Planning for Flood-Prone Areas
Transcript of Disaster Mitigation Module:Planning Flood- Prone … Network/Philippines/UP...1 Disaster Mitigation...

1
Disaster Mitigation Module:Planning Flood-Prone Areas using GIS
Alex Ramon Q. CabanillaAssociate Professor
School of Urban and Regional Planning
BackgroundThe training module is part of the institutional commitment of UP to the CASITA Project to include disaster mitigation in SURP curriculum. As a result, disaster mitigation have been incorporated in the following courses: Land Use Planning as part of hazard mapping and planning special types of land use-flood-prone areas; and Special Problems in Urban Planning: Planning for Flood-Prone Areas.
Disaster Mitigation
Land Use Planning CourseSpecial Problems in Urban & Regional Planning: Planning for Flood-Prone Areas
2
To accelerate the learning process, a case study was developed to enable the students appreciate the use of GIS in applying land use planning principles in a flood-prone municipality.
In view of this, the module will: (1) involved lectures on Planning Special Types of Land Use: Flood-Prone Areas; and GIS; (2) GIS drill exercises; (3) analysis of the case study using GIS, and presentation of recommendations by the students.
Furthermore, digital data are provided for the students to analyze. They are expected to further process these digital data to produce thematic and decision maps and recommend an option in flood mitigation.
Teaching Approach
Lecture•Planning Flood-Prone Areas•GIS
GIS Drill Exercises Case Study Analysis andRecommendation
INPUT PROCESS OUTPUT
Learning Outcome
The students after undertaking the module will be able to:
• organize planning data;• process planning data; • produce thematic and decision maps; and• select a viable option for a disaster prone
municipality.

3
OutlineI. Lecture on: Planning Special Types of Land Use: Flood
Prone Areas; and GISII. GIS Drill ExercisesIII. Presentation of the Case Study and Leveling of
ExpectationsIV. Tutorial in analyzing the digital data in terms of:
1. Organizing the Inputs2. Deriving Thematic Maps3. Formulating Decision Maps4. Selecting the Best Option
V. Student Analysis and RecommendationsVI. Resolution of Issues and Concerns
Lecture on Planning Special Types of Land Use: Flood-Prone Areas
Powerpoint Presentation: Refer to Annex A)
Definition of FloodCauses of FloodsTypes of FloodTypical Adverse EffectsCauses of the Adverse EffectsEvolution of Approaches to Flood ManagementApproaches in Dealing with Floods
•Structural•Less Structural•Non Structural
Philippine Experience

4
Characteristics of GIS
Georeferenced information•Longitude•Latitude
One to many relationship between the geometric
and attribute information
Maps with attached database can be converted to themes
Thematic Maps are organized into layers to:•Identify Problems
•Generate Solutions (Decision Maps)
Lecture on GIS
Georeferenced information

5
Database 1 Database 2 Database 3
Map
One to Many Relationship in GIS
Base Map Converted to Theme

6
Base Map: Drainage Map
Base Map Converted to Theme

7
Theme: Adequacy of Drainage Pipes During Floods Map
Base Map: Street Map Category

8
Thematic Map: Flooded Streets Map
GIS Process Applied to Flood Mitigation
Base MapsRainfall MapSoil MapElevation Map
ThematicMapsPermeability MapHazard Map
Decision MapsStructural OptionLess Structural Option
GIS• Inputting Data• Database Linking• Thematic
Mapping• Geographic
Analysis
9
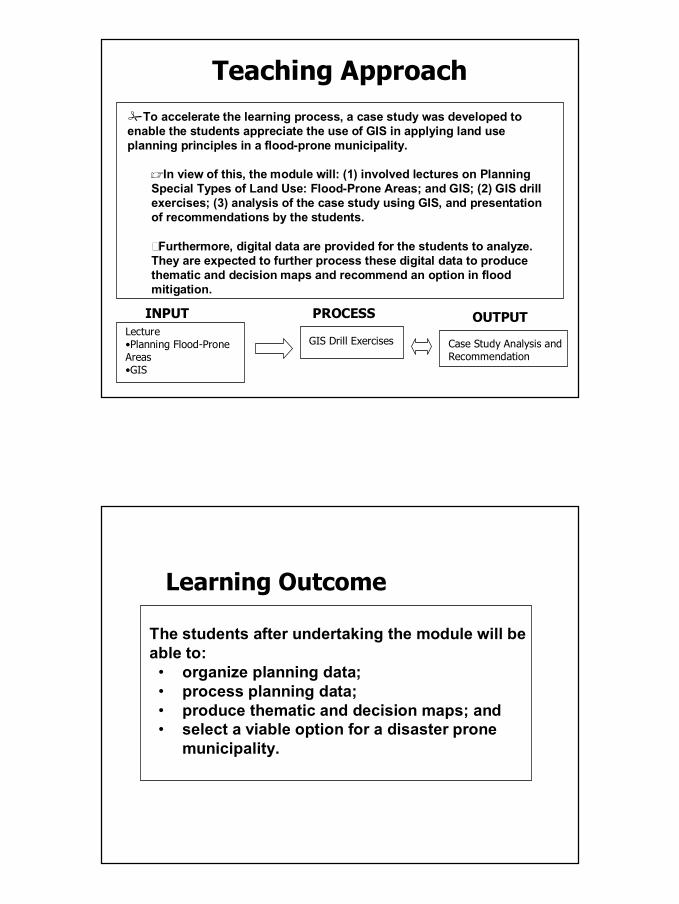
GIS Drill Lessons/Exercises(Hand-outs)
Please Refer to Annex B
Lesson 1: IntroductionLesson 2: Displaying Your DataLesson 3: Mapping in LayersLesson 4: Opening FilesLesson 5: Putting It on the MapLesson 6: SelectingLesson 7: Labeling your MapLesson 8: Working with LayoutsLesson 9: Using Thematic Maps for AnalysisLesson 10: RedistrictingLesson 11: Object Creating and EditingLesson 12: BufferingLesson 13: Integration
Case Study: Flood-Prone Municipality1
The case study is about a municipality confronted by the overflowing of a river during the rainy season causing perennial flooding. Moreover, the case study requires the use of Geographic Information System (GIS) in processing the given inputs so that a viable development intervention can be selected. To accelerate the learning process, digital data are provided for the students to analyze. They are required to process these digital data to produce thematic maps and recommend an option in flood mitigation. Thus, the expectations from the student are:
•organization and processing of planning data using GIS; •generation of thematic and decision maps; and•selection of a viable development option for flood-prone municipality
The case study is divided into four modules. Module 1 focuses on the analysis of the given digital data. Module 2 is about digitizing of additional data to supplement the provided data. Module 3 is concerned in linking databases to the maps to be able to perform thematic mapping. Module 4 focuses on the generation of additional thematic maps. Module 5 is about selection of a viable development option by highlighting the issues and concerns.
1Note: Refer to Annex C

10
Digital Data Provided
Digital Data 1 : Rain Gauge Station Map Digital Data 2 : River Map
Rain Gauge Stations Map provide Rainfall Data
Rainfall Data (Table Data)
8617.4208.85.93.311.132.945.332.520.330.59.62.48.56.5D
173228.762745.268.947.998.5476.3698.1598.7178.6483.732.413.934.813.4C
124155.961871.556.534.776.5312.3345.7455.6157.4365.822.27.824.812.2B
186219.552634.670.445.893.3450.2664.5564.9166.7489.530.312.632.613.8A
Rain Days
AveTotalDecNovOctSeptAugJulyJuneMayAprilMarFebJanZone

11
Digital 3: Rainfall Map
Digital Data 4: Elevation Map

12
Digital Data 5 : Soils Map
Digital Data 6 : Land Use Map

13
Digital Data 7: Parcel Map
Digital Data 8: Street Map

14
Digital Data 9: Drainage Pipes Map
Digital Data 10: Permeability Map

15
Digital Data 11: Flood Prone Areas (Hazard Map)
Digital Data 12: Flood Risk Structures Map

16
Digital Data 13: Structures Affected Along Floodway Map
Digital Data 14: Structures Affected along Flood Fringe
Map

17
Digital Data 15: Levee Map
Digital Data 16: Relocation

18
Group Discussion & Selection
Organize the Digital Data according to:•Base Maps•Thematic or Criteria Maps•Development Options Map
Group A Group B Group C
Thematic Mapping
Thematic Maps
Base Maps

19
Group Discussion & Recommendation
Perform and Recommend Other Thematic Maps
Development Options
Criteria orThematicMaps
Decision Maps

20
Decision Map 1 Levee, River Management, and Flood
Insurance
Decision Map 2Relocation,Rehabilitation, and River
Management

21
SelectionCultural Dimension- Compatible with norms and beliefs of affected people.Social Aspects- The alternative selected minimizes the number of people affected. Political Viability- The option is acceptable to key actors.Economic- The alternative is the least cost.Continuity- The alternative will promote sustainability.
Decision Matrix
Alternative II: Relocation
Alternative I: Levee and Flood Insurance
RemarksSustainabilityLeast CostPolitical Viability
Less People Affected
Cultural Feasibility
Option

22
Which Option to select?
Option 1 or 2?
Group Discussion & Selection
Group A Group B Group C

23
Why?
Answer
Base Maps•Streets Map•Rain Gauge Map•Soils Map•Drainage Pipes Map•Land Use Map•Parcel Map•Structures Map•Elevation Map
Thematic Maps•Flood Prone Areas Map•Flood Risks Population Map•Permeability Map•Rainfall Distribution Zones Map•Drainage Pipes Capacity Map•Critical Utilities/Land Use Map•Flood Characteristics Street Map•Traffic Characteristics Street Map
Decision Maps •Option1•Option2

24
AnswerLess People Affected
Option 1: 1906 people subsidizing 238 personsOption 2: No subsidy required
SustainabilityOption 1
Occasional RepairRehabilitationReconstruction
Option 2:Critical Landusing activities are flood freeNo repair, rehabilitation or reconstruction
activities

25
Least CostOption 1: Cost Dimension are:
Levee ConstructionLevee MaintenanceLevee RepairExpropriation of Affected Properties
Option 2: Cost Dimension are:Construction of InfrastructureSubsidy in the Construction of Houses
Political Viability and Cultural Feasibilityvaries from country to country


![Flood Mitigation Planning for the Upper Wapsipinicon River ......Regulation Checklist that are important for flood mitigation planning [1]. There is a section for each flood mitigation](https://static.fdocuments.us/doc/165x107/5f23df6e5f50b45b8f2214fc/flood-mitigation-planning-for-the-upper-wapsipinicon-river-regulation-checklist.jpg)