Economic valuation of flood risk exposure and flood control in a severely flood prone developing...
21
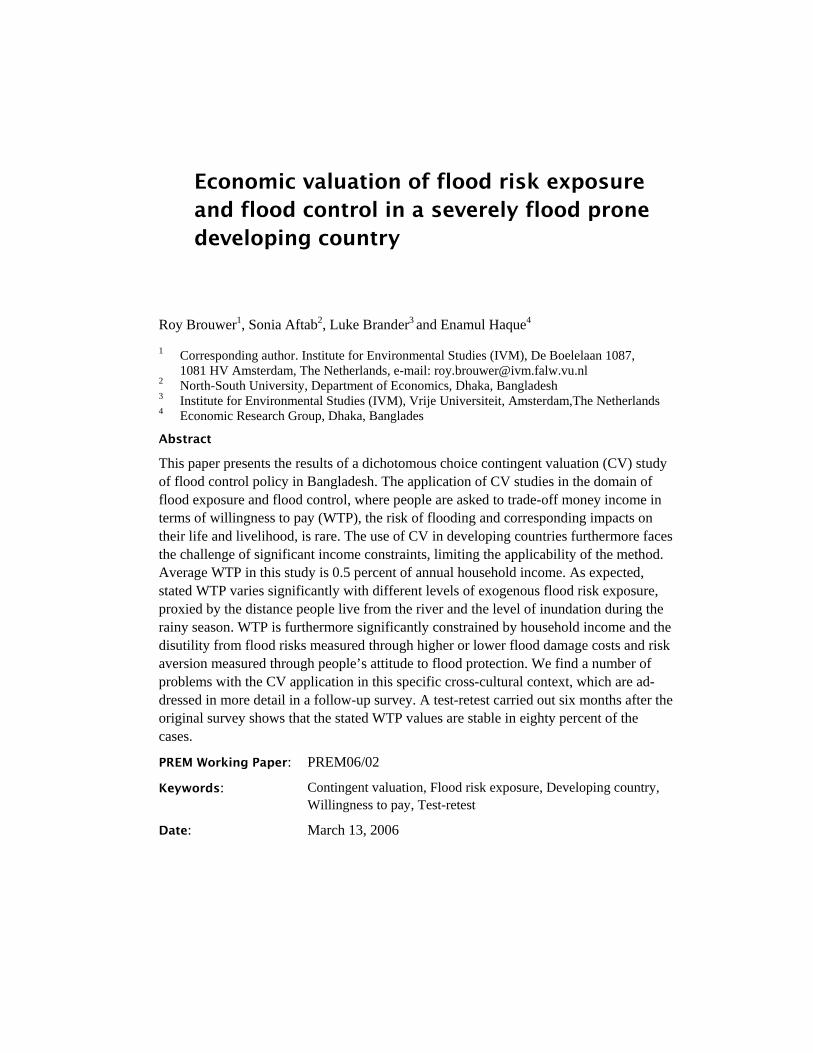
Economic valuation of flood risk exposure and flood control in a severely flood prone developing country Roy Brouwer 1 , Sonia Aftab 2 , Luke Brander 3 and Enamul Haque 4 1 Corresponding author. Institute for Environmental Studies (IVM), De Boelelaan 1087, 1081 HV Amsterdam, The Netherlands, e-mail: [email protected] 2 North-South University, Department of Economics, Dhaka, Bangladesh 3 Institute for Environmental Studies (IVM), Vrije Universiteit, Amsterdam,The Netherlands 4 Economic Research Group, Dhaka, Banglades Abstract This paper presents the results of a dichotomous choice contingent valuation (CV) study of flood control policy in Bangladesh. The application of CV studies in the domain of flood exposure and flood control, where people are asked to trade-off money income in terms of willingness to pay (WTP), the risk of flooding and corresponding impacts on their life and livelihood, is rare. The use of CV in developing countries furthermore faces the challenge of significant income constraints, limiting the applicability of the method. Average WTP in this study is 0.5 percent of annual household income. As expected, stated WTP varies significantly with different levels of exogenous flood risk exposure, proxied by the distance people live from the river and the level of inundation during the rainy season. WTP is furthermore significantly constrained by household income and the disutility from flood risks measured through higher or lower flood damage costs and risk aversion measured through people’s attitude to flood protection. We find a number of problems with the CV application in this specific cross-cultural context, which are ad- dressed in more detail in a follow-up survey. A test-retest carried out six months after the original survey shows that the stated WTP values are stable in eighty percent of the cases. PREM Working Paper: PREM06/02 Keywords: Contingent valuation, Flood risk exposure, Developing country, Willingness to pay, Test-retest Date: March 13, 2006
-
Upload
beverly-ann-dela-vega -
Category
Documents
-
view
24 -
download
2
description
This paper presents the results of a dichotomous choice contingent valuation (CV) studyof flood control policy in Bangladesh. The application of CV studies in the domain offlood exposure and flood control, where people are asked to trade-off money income interms of willingness to pay (WTP), the risk of flooding and corresponding impacts ontheir life and livelihood, is rare. The use of CV in developing countries furthermore facesthe challenge of significant income constraints, limiting the applicability of the method.Average WTP in this study is 0.5 percent of annual household income. As expected,stated WTP varies significantly with different levels of exogenous flood risk exposure,proxied by the distance people live from the river and the level of inundation during therainy season. WTP is furthermore significantly constrained by household income and thedisutility from flood risks measured through higher or lower flood damage costs and riskaversion measured through people’s attitude to flood protection. We find a number ofproblems with the CV application in this specific cross-cultural context, which are addressedin more detail in a follow-up survey. A test-retest carried out six months after theoriginal survey shows that the stated WTP values are stable in eighty percent of thecases.
Transcript of Economic valuation of flood risk exposure and flood control in a severely flood prone developing...
Economic valuation of flood risk exposure and flood control in a severely flood prone developing country
Roy Brouwer1, Sonia Aftab2, Luke Brander3 and Enamul Haque4
1 Corresponding author. Institute for Environmental Studies (IVM), De Boelelaan 1087, 1081 HV Amsterdam, The Netherlands, e-mail: [email protected]
2 North-South University, Department of Economics, Dhaka, Bangladesh 3 Institute for Environmental Studies (IVM), Vrije Universiteit, Amsterdam,The Netherlands 4 Economic Research Group, Dhaka, Banglades
Abstract
This paper presents the results of a dichotomous choice contingent valuation (CV) study of flood control policy in Bangladesh. The application of CV studies in the domain of flood exposure and flood control, where people are asked to trade-off money income in terms of willingness to pay (WTP), the risk of flooding and corresponding impacts on their life and livelihood, is rare. The use of CV in developing countries furthermore faces the challenge of significant income constraints, limiting the applicability of the method. Average WTP in this study is 0.5 percent of annual household income. As expected, stated WTP varies significantly with different levels of exogenous flood risk exposure, proxied by the distance people live from the river and the level of inundation during the rainy season. WTP is furthermore significantly constrained by household income and the disutility from flood risks measured through higher or lower flood damage costs and risk aversion measured through people’s attitude to flood protection. We find a number of problems with the CV application in this specific cross-cultural context, which are ad-dressed in more detail in a follow-up survey. A test-retest carried out six months after the original survey shows that the stated WTP values are stable in eighty percent of the cases.
PREM Working Paper: PREM06/02
Keywords: Contingent valuation, Flood risk exposure, Developing country, Willingness to pay, Test-retest
Date: March 13, 2006
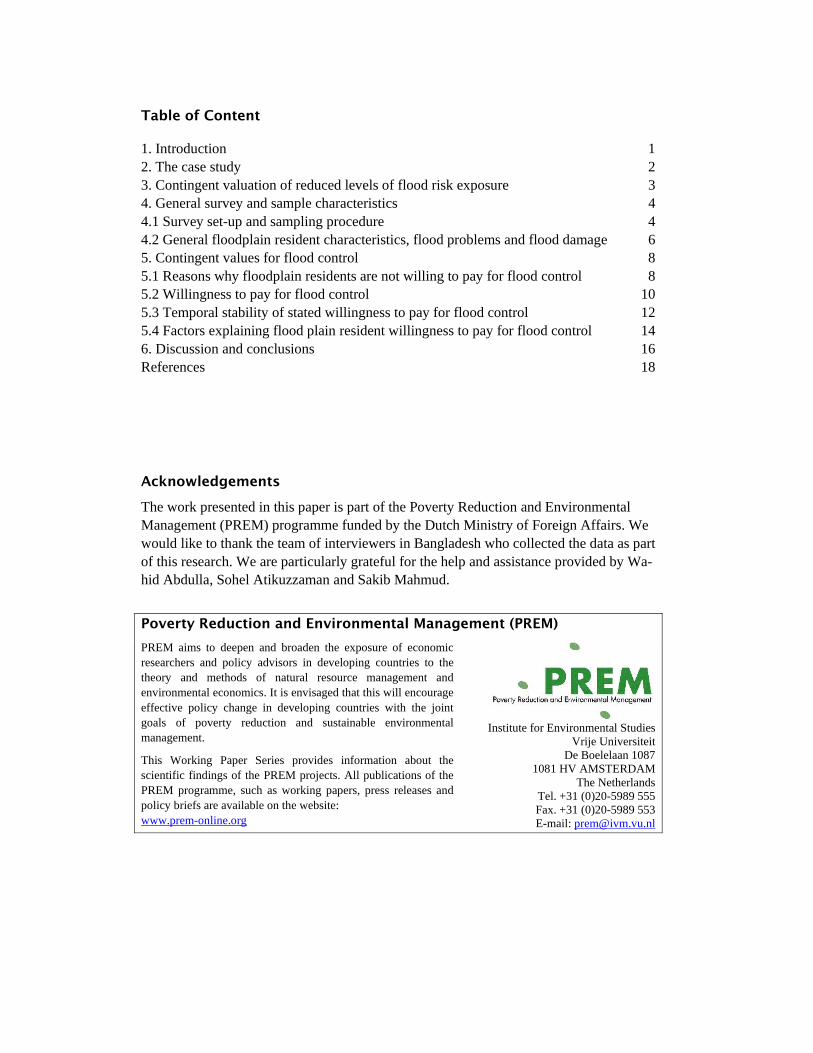
Table of Content
1. Introduction 1 2. The case study 2 3. Contingent valuation of reduced levels of flood risk exposure 3 4. General survey and sample characteristics 4 4.1 Survey set-up and sampling procedure 4 4.2 General floodplain resident characteristics, flood problems and flood damage 6 5. Contingent values for flood control 8 5.1 Reasons why floodplain residents are not willing to pay for flood control 8 5.2 Willingness to pay for flood control 10 5.3 Temporal stability of stated willingness to pay for flood control 12 5.4 Factors explaining flood plain resident willingness to pay for flood control 14 6. Discussion and conclusions 16 References 18
Acknowledgements
The work presented in this paper is part of the Poverty Reduction and Environmental Management (PREM) programme funded by the Dutch Ministry of Foreign Affairs. We would like to thank the team of interviewers in Bangladesh who collected the data as part of this research. We are particularly grateful for the help and assistance provided by Wa-hid Abdulla, Sohel Atikuzzaman and Sakib Mahmud.
Poverty Reduction and Environmental Management (PREM)
PREM aims to deepen and broaden the exposure of economic researchers and policy advisors in developing countries to the theory and methods of natural resource management and environmental economics. It is envisaged that this will encourage effective policy change in developing countries with the joint goals of poverty reduction and sustainable environmental management.
This Working Paper Series provides information about the scientific findings of the PREM projects. All publications of the PREM programme, such as working papers, press releases and policy briefs are available on the website: www.prem-online.org
Institute for Environmental Studies Vrije Universiteit
De Boelelaan 1087 1081 HV AMSTERDAM
The Netherlands Tel. +31 (0)20-5989 555 Fax. +31 (0)20-5989 553 E-mail: [email protected]
Roy Brouwer et al. 1
1. Introduction
Bangladesh is a flood struck country. Eighty percent of the country consists of flood-plains of the Ganges, Brahmaputra, Meghna and several other minor rivers. These flood-plains sustain a predominantly poor rural population. Approximately 75 percent of the total population of 124 million people (in 2001) lives in these rural areas, earning on av-erage US$325 per capita per year (Bangladesh Bureau of Statistics, 2005). Once every ten years roughly one third of the country gets severely affected by floods, while in catastrophic years such as 1988, 1998 and 2004 more than 60 percent of the country is inundated, that is an area of approximately one hundred thousand square kilometres for a duration of nearly three months (CEGIS, 2002). Floods cause social disruptions and result in scarcity of drinking water as surface water gets contaminated by organic and in-organic substances. Cases of diarrhea, cholera and other intestine diseases increase re-markably during and after floods.
After the catastrophic floods in 1988, the Government of Bangladesh adopted an elabo-rate World Bank sponsored scheme of flood alleviation measures through their Flood Action Plan (FAP) (NEDECO, 1993). The main objective of this FAP is to regulate flood levels inside proposed flood-control compartments. One of the critiques on the FAP is that it does not take into account the interests and views of floodplain residents (Rasid and Mallik, 1995). Two surveys, one carried out between 1991 and 1994 (Rasid, 2000) and one in 1996 (Rasid and Haider, 2003), investigated public preferences for flood control and found that a majority of floodplain residents – mainly farmers – prefer regulated flood levels instead of total flood prevention, where the preferred level of in-undation corresponds with the ideal flood depth for the cultivation of floodplain rice.
In a large scale survey carried out in 2005 in the South East of Bangladesh, we ask al-most seven hundred floodplain residents currently living without any flood protection along the river Meghna for their preferences for a flood alleviation scheme using the contingent valuation (CV) method, i.e. asking them for their willingness to pay (WTP) to reduce current and future flood risks. CV studies of flood risks and flood control are very rare (Daun et al., 2000). A considerable literature does exist, however, regarding the economic value of the floodwater retention capacity of wetlands and floodplains (e.g. Brouwer et al., 1999; Brouwer and Bateman, 2005), which shows a positive relationship between stated WTP and the provision of flood protection. The main objective of this paper is to investigate whether such a positive relationship can also be found for artificial constructions such as an embankment and to what extent stated WTP varies depending on different flood risk exposure levels, taking into account the challenges identified in the international literature when applying the CV method in the developing world (e.g. Georgiou et al., 1997; Whittington, 1998). Flood risk exposure levels are measured in this case study in different ways, including the distance floodplain residents live from the river Meghna, the level of flooding during the rain season, and corresponding annual flood damage. The temporal stability and reliability of the stated WTP values are fur-thermore tested in a follow-up survey six months after the original valuation study was carried out. Although the test presented here is not directly comparable, previous CV re-search in developing countries suggests that giving respondents time to think signifi-cantly lowers stated WTP (Whittington et al., 1992).
Economic valuation of flood risk exposure and flood control 2
The remainder of this paper is organized as follows. Section 2 introduces the case study, while section 3 discusses the set-up of the CV study. Section 4 presents the general char-acteristics of the floodplain residents, and section 5 the CV results. Finally, section 6 concludes.
2. The case study
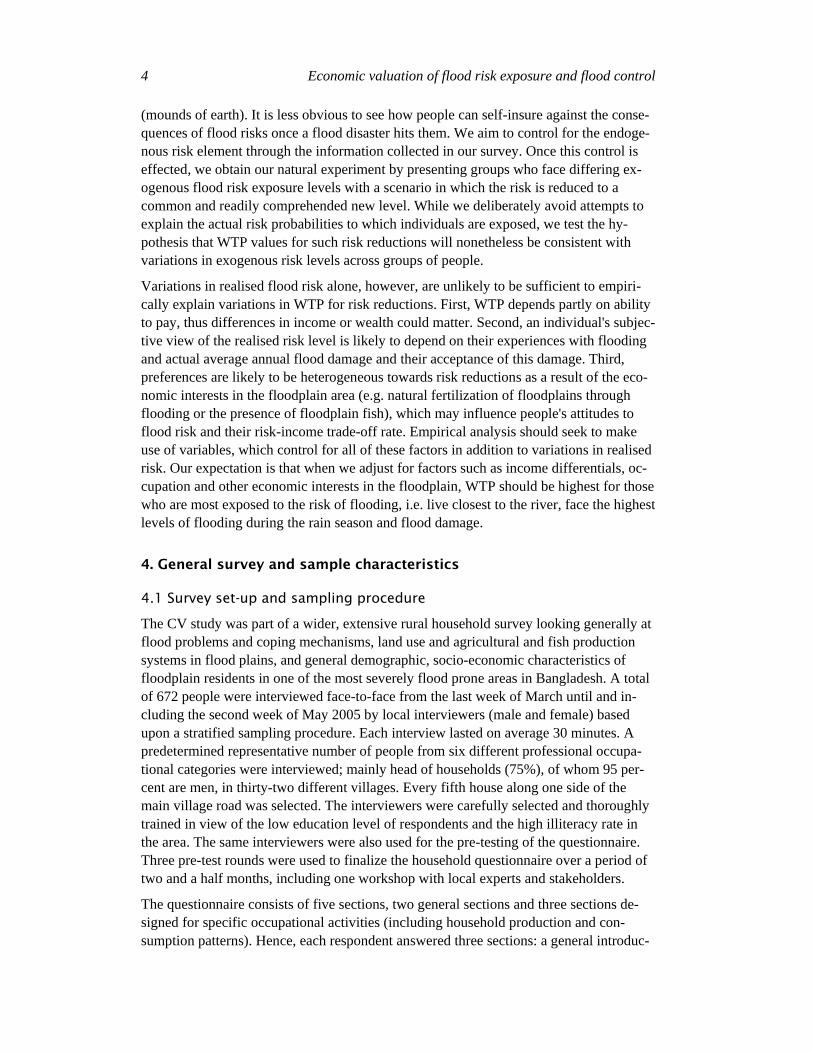
The case study is carried out in a low-lying, severely flood prone fluvial delta located in the south-east of Bangladesh in the sub-district Homna, approximately 70 km from Dhaka. The floodplain delta covers an area of approximately ten thousand hectares and is bordered by the Meghna river in the north-west and its tributaries the Titas river in the north and south and the Kathalia river in the west (Figure 2.1).
Figure 2.1 Location of the case study area in Bangladesh.
The area’s topography varies between 1.5 and 4.0 meter above sea level. Average annual rainfall is 2,025 ml of which 75% falls during the monsoon from June to October. Heavy monsoon rainfall generates excessive flows in the rivers and thereby causes floods al-most every year. These floods cause damage to houses, agricultural crops and the infra-structure in the area. During the 2004 flood, Homna was identified in the Rapid Flood Assessment as one of the most severely affected areas in Bangladesh in terms of per-centage of area inundated, inundation depth (≥ 2 meter) and percentage of people af-fected (Centre for Policy Dialogue, 2005). More than four hundred thousand people live in the area (2001 population census). Most of them are farmers. Almost three quarters of
Roy Brouwer et al. 3
the land is used for farming, mainly rice. Other crops include wheat, vegetables, pulses, oil seeds and maize. Some livestock farming is also present, but on a very small scale. Communities of fishermen are found along the rivers. Furthermore, many creeks and ca-nals are found in the area, which are also utilized for fishing.
3. Contingent valuation of reduced levels of flood risk exposure
The application of CV to value changes in individual risk exposure is fairly widespread nowadays (e.g. Jones-Lee et al., 1993; Baron and Greene, 1996; Jones-Lee and Loomes, 1997; Beattie et al., 1998; Carthy et al., 1999). A money measure of a change in risk is identified, defined as a positive or negative payment, which holds expected utility con-stant under different risk levels. The higher the utility obtained from risk reductions, the greater we expect this amount to be, ceteris paribus (Johansson, 1995). Typically, exist-ing studies investigate the consistency between stated WTP and the changes in risk ex-posure levels using probabilistic representations of risk levels. Based on evidence that lay public may find such probabilistic representations of risk levels difficult to under-stand and interpret (e.g. Tversky et al., 1988), ‘natural experiments’ have been proposed and used to test the sensitivity of public preferences to hypothesised changes in risk in cases where different groups of individuals are at different, pre-existing levels of real-world risks (e.g. Rosenzweig and Wolpin, 2000; Bateman et al., 2005).
In general, the level of risk exposure faced by an individual (Ri) depends on two main factors: an exogenous and an endogenous element. The former refers to facts or factors, which are beyond an individual’s locus of control (X), and the latter to the fact that peo-ple can take actions (Pi) which reduce the likelihood of an undesirable event occurring (self-protection), and reduce the costs of the event to them if it does occur (self-insurance) (Shogren and Crocker, 1991). Obviously, individual risk-reducing behaviour will influence the realised risk level affecting each person. In equilibrium, economic the-ory predicts that individuals equate the marginal benefits of self-protection/insurance (expected avoided disutility) with the marginal costs (price of self-protection/insurance), subject to their budget constraint.
In terms of WTP for a risk reduction, the relevant measurement of risk is people’s sub-jective assessment of risk, rather than a scientifically observed measure. As Smith (1992) points out, the use of subjective rather than objective risk assessment is more correct if one assumes that the general model of decision-making under uncertainty is prospective reference theory as an extension of standard expected utility theory (Viscusi, 1989). Hence, theory tells us that WTPi for a reduction in risk exposure depends on (i) the real-ised level of risk, R which is itself determined by exogenous risk, X, and self-protection activities, Pi, (ii) income, Yi and (iii) individual’s disutility from risk exposure (risk aver-sion), Si such that we obtain Equation (1):
WTPi = f (Yi, Si, R(X, Pi)) (3.1)
In the case study presented here, exogenous flood risk exposure is measured through the distance people live from the river. Different groups, proxied by the distance they live from the river, have different exogenous risk exposure levels dependent upon their loca-tion. Individuals can self-protect by moving further away from the river and taking measures to anticipate flooding and flood damage such as building houses on terps
Economic valuation of flood risk exposure and flood control 4
(mounds of earth). It is less obvious to see how people can self-insure against the conse-quences of flood risks once a flood disaster hits them. We aim to control for the endoge-nous risk element through the information collected in our survey. Once this control is effected, we obtain our natural experiment by presenting groups who face differing ex-ogenous flood risk exposure levels with a scenario in which the risk is reduced to a common and readily comprehended new level. While we deliberately avoid attempts to explain the actual risk probabilities to which individuals are exposed, we test the hy-pothesis that WTP values for such risk reductions will nonetheless be consistent with variations in exogenous risk levels across groups of people.
Variations in realised flood risk alone, however, are unlikely to be sufficient to empiri-cally explain variations in WTP for risk reductions. First, WTP depends partly on ability to pay, thus differences in income or wealth could matter. Second, an individual's subjec-tive view of the realised risk level is likely to depend on their experiences with flooding and actual average annual flood damage and their acceptance of this damage. Third, preferences are likely to be heterogeneous towards risk reductions as a result of the eco-nomic interests in the floodplain area (e.g. natural fertilization of floodplains through flooding or the presence of floodplain fish), which may influence people's attitudes to flood risk and their risk-income trade-off rate. Empirical analysis should seek to make use of variables, which control for all of these factors in addition to variations in realised risk. Our expectation is that when we adjust for factors such as income differentials, oc-cupation and other economic interests in the floodplain, WTP should be highest for those who are most exposed to the risk of flooding, i.e. live closest to the river, face the highest levels of flooding during the rain season and flood damage.
4. General survey and sample characteristics
4.1 Survey set-up and sampling procedure
The CV study was part of a wider, extensive rural household survey looking generally at flood problems and coping mechanisms, land use and agricultural and fish production systems in flood plains, and general demographic, socio-economic characteristics of floodplain residents in one of the most severely flood prone areas in Bangladesh. A total of 672 people were interviewed face-to-face from the last week of March until and in-cluding the second week of May 2005 by local interviewers (male and female) based upon a stratified sampling procedure. Each interview lasted on average 30 minutes. A predetermined representative number of people from six different professional occupa-tional categories were interviewed; mainly head of households (75%), of whom 95 per-cent are men, in thirty-two different villages. Every fifth house along one side of the main village road was selected. The interviewers were carefully selected and thoroughly trained in view of the low education level of respondents and the high illiteracy rate in the area. The same interviewers were also used for the pre-testing of the questionnaire. Three pre-test rounds were used to finalize the household questionnaire over a period of two and a half months, including one workshop with local experts and stakeholders.
The questionnaire consists of five sections, two general sections and three sections de-signed for specific occupational activities (including household production and con-sumption patterns). Hence, each respondent answered three sections: a general introduc-
Roy Brouwer et al. 5
tory section, including questions about respondent demographic and socio-economic characteristics, a section specifically dealing with flood and flood control issues, and an occupational section. For a more detailed description of the survey design, the interested reader is referred to Haque et al. (forthcoming). The flood related questions are aimed at examining the extent and nature of the impacts of flooding on life and livelihood (includ-ing any health related impacts and damage costs) and floodplain residents’ perceptions regarding the management and funding of a proposed flood alleviation scheme in the area.
Besides asking people for the importance of reducing flood exposure risks, they were also asked for their willingness to pay (WTP) for the flood protection scheme. First they were asked for their WTP in principle for the flood protection scheme, and those who replied ‘yes’ subsequently for a specific bid amount using a dichotomous choice model. It is emphasized that this amount of money is solely used to finance the costs of building the embankment in the area. Ten different bid levels were used: 10, 20, 50, 100, 200, 500, 1000, 2000, 3000 and 5000 Taka (Tk) per household per year1. These bid amounts were randomly allocated across respondents and are based on thorough pre-testing of the WTP question in an open-ended format before the actual survey was carried out.
After each WTP question respondents are asked in an open-ended question why they are or why they are not willing to pay. The sequence of WTP questions is based on previous research by the corresponding author of this paper (e.g. Brouwer and Bateman, 2005) and allows, among others, investigation of protest and legitimate zero bidders. This is considered essential in CV research, but even more so in this particular case study in view of the fact that people are not used to pay for flood protection, and the study area is located in one of the poorest regions in one of the poorest countries in the world and in-come constraints are therefore believed to significantly constrain WTP (Whittington, 1998).
In order to test the temporal stability of stated WTP and the reliability of the application of the CV method in a developing country, a follow-up CV survey was carried out six months after the original survey. Face-to-face interviews were conducted with eighty-nine randomly selected respondents who also participated in the original household sur-vey (13% of the original sample population). In this unannounced follow-up survey, re-spondents were asked whether they remembered the WTP question in the original survey and their answer to the WTP question, which money amount they were asked to pay, if they are still willing to pay or not, how clear it was what they were being asked to pay for, how certain they were about their reply, and, if they want to change their original re-ply, why they wish to change it. Those respondents who were not willing to pay in the original survey were asked more specifically about the reasons why they were not will-ing to pay and whether they would be willing to contribute in other ways than in money terms, i.e. in kind, for instance by providing household labour or paying with part of their harvest2.
1 Between 1st of March and 31st of May 2005, Tk100 equalled on average US$1.59. 2 Two different questionnaires were used in the follow-up survey, one for respondents who
said yes to the WTP question and one for respondents who said no to the WTP question in the original survey. The follow-up interviews lasted, on average, between 10 and 15 minutes.
Economic valuation of flood risk exposure and flood control 6
4.2 General floodplain resident characteristics, flood problems and flood damage
An average household consists of six family members, of which two work, usually men. Most people interviewed (97%) were born and raised in the region. The average age of respondents is around 40 to 45 years. Fifty-two percent of the sample population cannot read or write. A majority of eighty-nine percent of the households interviewed are mus-lim and eleven percent is Hindu.
Most households are involved in agricultural activities to support their livelihood. Ap-proximately twenty percent of the sample population consists of day labourers. Almost all households own the house they live in; while sixty percent owns the land they grow their crops on. Almost all houses are made of tin (both roof and walls) and a water-sealed latrine is the most important sanitary facility in dwellings. Just over one in every third household has electricity. Most households get their drinking water from a private or collective tube well and use leaves and cow dung as their main source of energy.
Average annual household income is about US$950, while half of the households have an income of less than US$560. Average annual per capita income is US$150, which is substantially lower than the national average mentioned in the introduction of this paper (US$325). Using the Basic Cost Need (BCN) calculated by the Bangladesh Bureau of Statistics as the poverty threshold (US$105 per capita per year), fifty-five percent of the floodplain residents included in the sample appear to live below this poverty line.
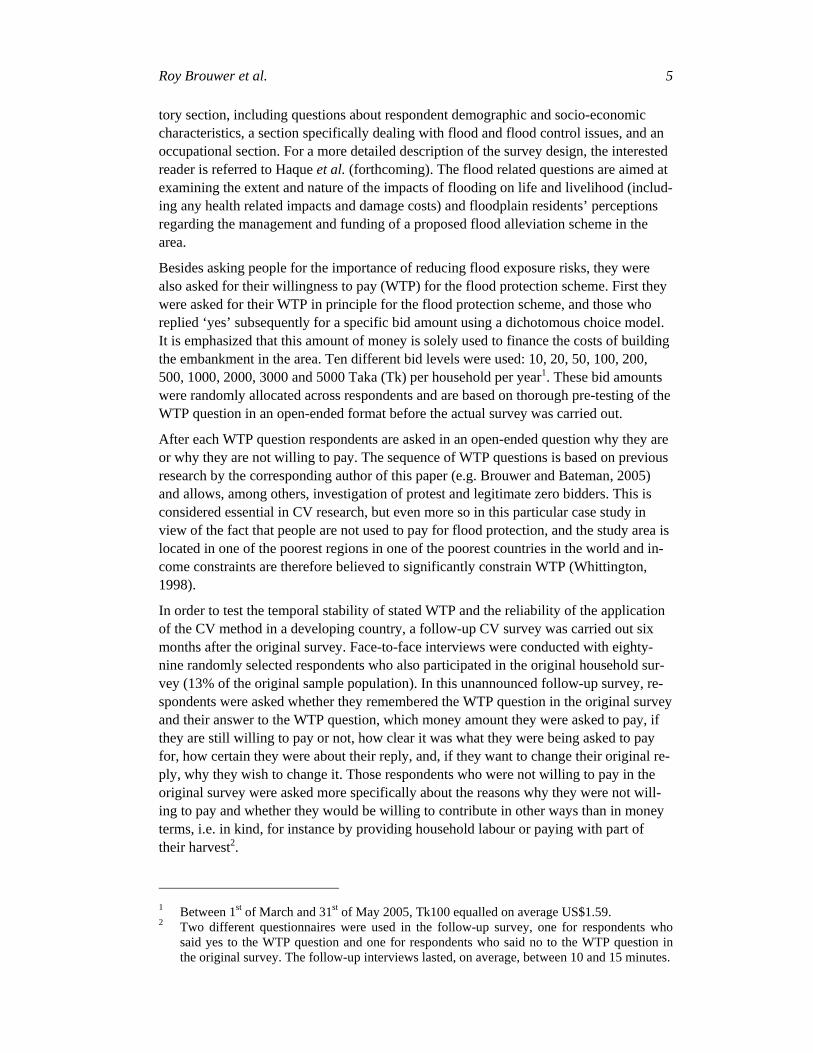
A majority of ninety-six percent of the floodplain residents interviewed are exposed every year during the rain season to flooding, and a quarter of the population mentions flooding as the main problem faced by the region, followed by other important problems such as bad roads (23%), unemployment (20%) and lack of electricity (17%). The extent of flood exposure during the rain season is presented in Figure 4.1. In more than one third of the cases the water comes waist high during the rain season (approximately 1.5 feet) and in another one third of the cases even up to the shoulders (approximately 3 feet). Almost half of the population (46%) furthermore indicates that they suffer each year from diarrhea during the rain season. Ninety-nine percent seeks medical treatment for this.
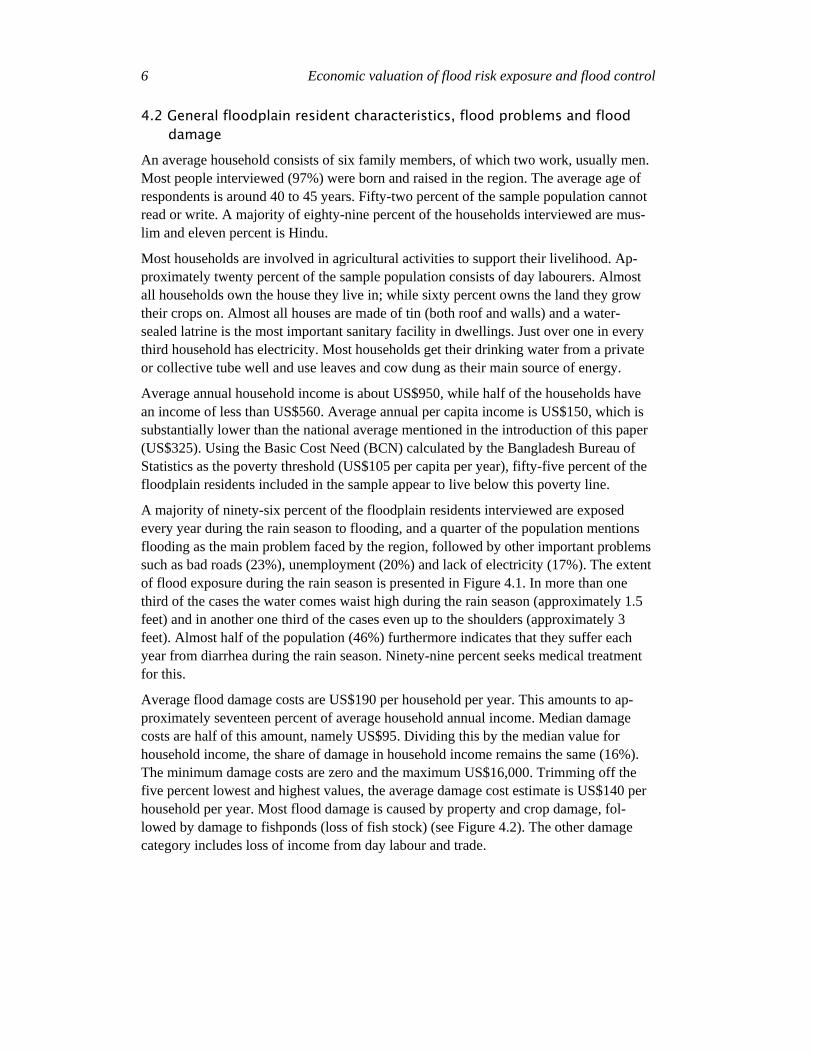
Average flood damage costs are US$190 per household per year. This amounts to ap-proximately seventeen percent of average household annual income. Median damage costs are half of this amount, namely US$95. Dividing this by the median value for household income, the share of damage in household income remains the same (16%). The minimum damage costs are zero and the maximum US$16,000. Trimming off the five percent lowest and highest values, the average damage cost estimate is US$140 per household per year. Most flood damage is caused by property and crop damage, fol-lowed by damage to fishponds (loss of fish stock) (see Figure 4.2). The other damage category includes loss of income from day labour and trade.
Roy Brouwer et al. 7
0
5
10
1520
25
30
35
40
No floodproblem
Up to yard Insidehouse
kneehigh
Insidehousewaist
Insidehouse
shoulder
Insidehouse >shoulder
%
Figure 4.1 Percentage of households suffering from flood at different inundation levels.
0
5
10
15
20
25
30
healt
h
hous
ecro
p
equip
ment
lives
tock
fruittr
ees
fishp
ond
other
%
Figure 4.2 Relative contribution of different damage categories to total household damage costs.
When relating flood risk exposure levels (measured through the distance people live from the river) to actual flood problems (measured through inundation depth, flood dam-age and health problems) and household income as an important indicator of household socio-economic status (based on Spearman’s rho), a number of interesting results are found. First, there exists a small, but significant positive relationship between risk expo-sure level measured via the distance people live from the river and annual household in-come (r=0.11; p<0.01). This means that on average households with higher income lev-els live further away from the river. This income differential cannot be attributed to one specific occupational group such as farmers or fishermen. Farmers and fishermen earn
Economic valuation of flood risk exposure and flood control 8
significantly different incomes, but there exists no significant relationship between occu-pation and the distance to the river (one might perhaps expect fishermen to live nearer to the river).
As expected, a negative relationship is found between distance and annual flood damage (the further away, the less damage), but this relationship is not significant at the ten per-cent level. Possibly due to the significant relationship between income and distance, we also find that the higher household income, the lower the inundation level during floods (r=-0.19; p<0.01). The highest correlation is found between household income and an-nual flood damage costs (r=0.43; p<0.01), implying that higher income groups suffer more damage. On the other hand, higher household income is negatively correlated with catching diarrhea during the rain season (r=-0.14; p<0.01), suggesting that higher income groups are better able to cope with the negative health impacts of flooding. Finally, a small, but significant positive relationship exists between the estimated market value of household dwellings and the distance the dwelling is located from the river (r=0.17; p<0.01), suggesting that flood risk exposure has a negative impact on house prices.
When asking floodplain residents about their attitude towards flood protection, eighty percent of all respondents say that they consider flood protection important to very im-portant. Thirteen percent believes this is not important at all (n=91). Interestingly, com-paring those who consider flood protection not important at all with those who believe this is (very) important, the latter live significantly further away from the river than the former and earn significantly more income3. However, in the case of inundation depth during floods and annual flood damage the relationships are as expected, i.e. those who believe flood protection is (very) important face significantly higher inundation depths during the rain season and suffer significantly more damage4.
Finally, when asking respondents who they believe is responsible for flood control in their region and who should pay for the proposed embankment, a majority of eighty-two percent refers to the central Government, followed by foreign aid agencies (12%). Less than five percent believes that local residents should pay.
5. Contingent values for flood control
5.1 Reasons why floodplain residents are not willing to pay for flood control
After respondents are asked for the importance they attach to flood control in their re-gion, they are presented with two WTP questions (section 4.1). First, respondents are asked whether they are willing to pay in principle for a flood protection scheme in their area. Those who say ‘yes’ are subsequently asked in a dichotomous choice question whether they are willing to pay a specific bid amount every year on behalf of their entire household.
3 Differences are tested using the non-parametric Mann-Whitney test. The Z test statistic
equals –1.881 (p<0.06) in the case of household income and –3.462 (p<0.01) in the case of distance from the river.
4 The Z test statistic equals –6.436 (p<0.01) in the case of inundation depth and –4.255 (p<0.01) in the case of annual flood damage.
Roy Brouwer et al. 9
Forty percent of all respondents reply positively to the first WTP question. A majority (80%) of those who said ‘no’ to the first WTP question refuse to pay because of lack of financial resources. From an economic point of view, this is a legitimate zero bid. Re-spondents who indicate that their income is too low have indeed a significantly lower annual household income (average income of US$760) than those respondents who said ‘yes’ to the first WTP question (average income of US$1080)5. Ten percent believe that an embankment will be harmful to the environment and therefore refuse to pay. About sixty percent of these respondents are floodplain farmers, who may be worried about re-duced soil fertility as a result of the embankment (and hence higher production costs), and fourteen percent are fishermen, who may be worried that they lose fishing opportu-nities. Five percent of those who said ‘no’ don’t consider flooding a problem or consider other issues more important such as improved electricity supply or infrastructure or for which they would be willing to pay extra. Finally, almost five percent appeared to pro-test against the imposed market construct by the hypothetical WTP question by stating reasons such as ‘I don’t believe the money will actually be spent on the embankment’ or ‘I don’t believe the embankment will protect me and my family’. Special attention was paid to possible ‘yes, but …’ answers reported elsewhere in the literature (Whittington, 1998), but these answers were not found in this CV application.
Hence, although more than half of the sample population does not want to pay for the proposed flood alleviation scheme in principle, most of them simply lack the financial resources to do so. This finding seems to confirm that applying CV in developing coun-tries may result in a high number of zero bids as a result of severe income constraints (e.g. Georgiou et al., 1997). However, we do not find any evidence in this study that there is something fundamentally wrong with asking the WTP question given the low number of protest bidders (<5%)6. The question obviously remains how useful the exer-cise is in view of the fact that the data is highly skewed (high number of zero bidders).
The high number of zero bidders and the financial income constraint issue were therefore addressed and analyzed in more detail in the small-scale follow-up survey. Those re-spondents who indicated in the original survey that their financial resources are insuffi-cient to pay for the proposed flood protection scheme were asked whether they are will-ing to contribute in kind, for example with household labour or by giving up part of their harvest. Forty percent of these respondents (n=21) said that they would. Three quarters of these respondents prefer to pay with their own labour, followed by twenty percent who is willing to pay with part of their harvest and five percent who is willing to give up part of their land for the construction of the embankment. Although there was no indica-tion in the pre-test of the survey of limited money-economy experiences, a non-monetary measure of WTP would have substantially reduced the number of zero bids.
5 Differences are tested using the non-parametric Mann-Whitney test again. The Z test statistic
equals –3.139 (p<0.01). 6 Approximately half of the respondents who said ‘no’ to the first WTP question were also
asked the second WTP question to test the consistency of their answers and see whether this resulted in any further protest against the imposed hypothetical market structure. Those who said ‘no’ to the first WTP question answered also consistently ‘no’ to the second WTP ques-tion for the same reasons and no further evidence of protest was found.
Economic valuation of flood risk exposure and flood control 10
Another important issue addressed in the follow-up survey is to what extent strategic bias played a role when stating a zero WTP. Most floodplain residents in the original survey indicated that the central Government is responsible and should pay for flood control in their region before answering the WTP question (section 4.2). None of these respondents, however, referred to this statement when they were asked to explain why they are not willing to pay for the proposed flood protection scheme. In the follow-up survey, respondents were asked whether their original WTP reply was in any way af-fected by their belief that others should pay for the flood protection scheme, e.g. the cen-tral Government. Twenty-two percent (n=9) of those respondents who claimed to have insufficient financial resources to pay for the flood protection scheme answered yes to this question and repeated that the central Government should pay. Relating this number to the total number of respondents who said no to the original WTP question (i.e. for in-come and other reasons), this equals seventeen percent of the follow-up sample popula-tion. Hence, some degree of strategic bias may also have influenced the high share of zero stated WTP. Usually this biased response is included in the definition of protest re-sponse in CV research, resulting in this case study in a substantially higher protest rate of around twenty instead of less than five percent (assuming that the respondents included in the follow-up survey are representative for the entire original sample population who said no to the WTP question).
5.2 Willingness to pay for flood control
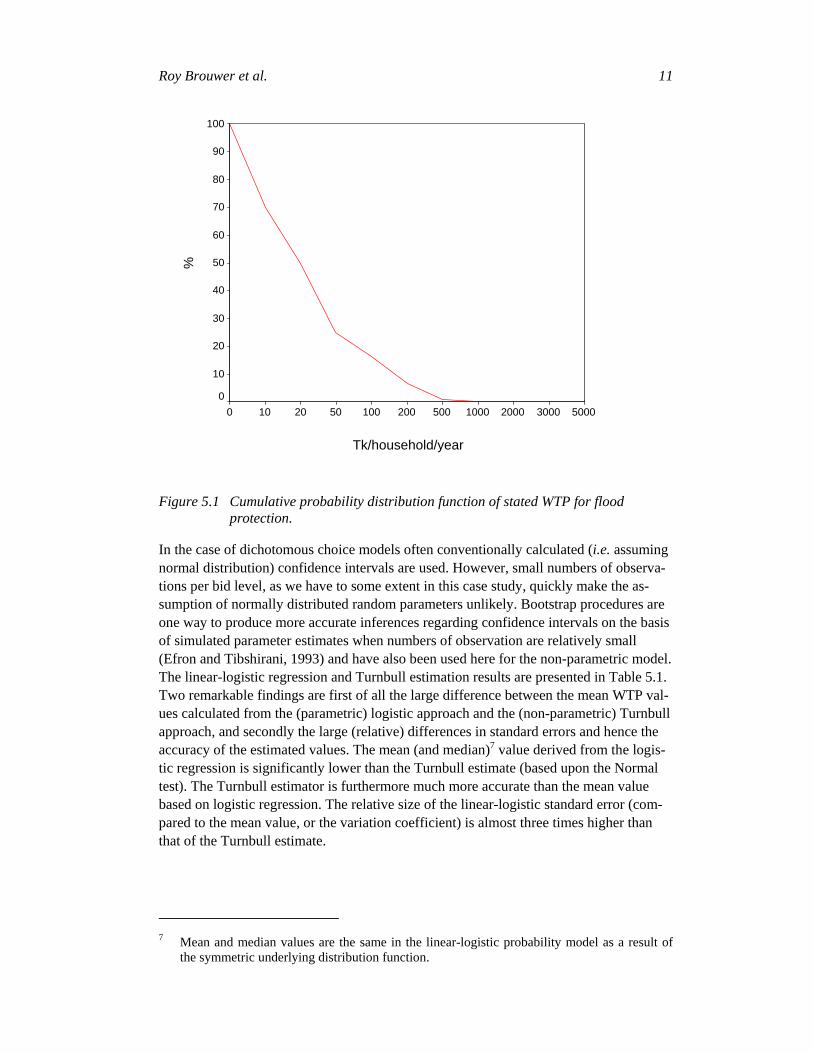
The cumulative probability distribution of stated WTP for the proposed flood protection scheme based upon a total of 488 valid observations for the second WTP question is pre-sented in Figure 5.1. The dichotomous choice CV model does not reveal the maximum WTP amount, only a discrete indicator of maximum WTP. Mean and median WTP are inferred from the underlying statistical distribution of the probability that respondents say ‘yes’ or ‘no’ to the different bid levels as presented in Figure 5.1. The calculation procedures for mean and median values based on binary CV response data were first out-lined by Hanemann (1984). Various parametric and non-parametric statistical models ex-ist to estimate these underlying distributions, which usually produce significantly differ-ent results and are an important source of statistical model specification bias in the analysis of CV results. In order to test for this bias, the (parametric) logistic probability model is used to estimate mean and median WTP and the (non-parametric) Turnbull model. For a more detailed discussion of these two approaches and the calculation pro-cedures of average WTP values, the interested reader is referred to, for example, Hane-mann (1989), Langford and Bateman (1993), Carson et al. (1994) and Haab and McCon-nell (1997).
Roy Brouwer et al. 11
Tk/household/year
50003000200010005002001005020100
%
100
90
80
70
60
50
40
30
20
10
0
Figure 5.1 Cumulative probability distribution function of stated WTP for flood protection.
In the case of dichotomous choice models often conventionally calculated (i.e. assuming normal distribution) confidence intervals are used. However, small numbers of observa-tions per bid level, as we have to some extent in this case study, quickly make the as-sumption of normally distributed random parameters unlikely. Bootstrap procedures are one way to produce more accurate inferences regarding confidence intervals on the basis of simulated parameter estimates when numbers of observation are relatively small (Efron and Tibshirani, 1993) and have also been used here for the non-parametric model. The linear-logistic regression and Turnbull estimation results are presented in Table 5.1. Two remarkable findings are first of all the large difference between the mean WTP val-ues calculated from the (parametric) logistic approach and the (non-parametric) Turnbull approach, and secondly the large (relative) differences in standard errors and hence the accuracy of the estimated values. The mean (and median)7 value derived from the logis-tic regression is significantly lower than the Turnbull estimate (based upon the Normal test). The Turnbull estimator is furthermore much more accurate than the mean value based on logistic regression. The relative size of the linear-logistic standard error (com-pared to the mean value, or the variation coefficient) is almost three times higher than that of the Turnbull estimate.
7 Mean and median values are the same in the linear-logistic probability model as a result of
the symmetric underlying distribution function.
Economic valuation of flood risk exposure and flood control 12
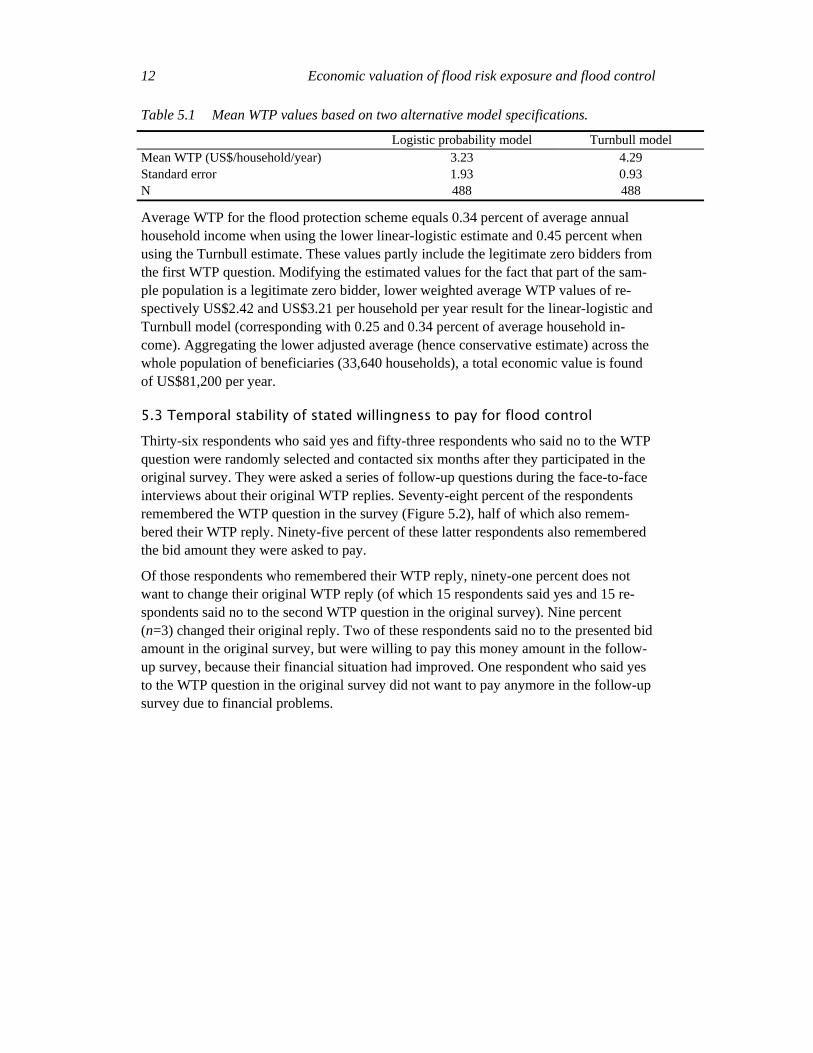
Table 5.1 Mean WTP values based on two alternative model specifications.
Logistic probability model Turnbull model Mean WTP (US$/household/year) 3.23 4.29 Standard error 1.93 0.93 N 488 488
Average WTP for the flood protection scheme equals 0.34 percent of average annual household income when using the lower linear-logistic estimate and 0.45 percent when using the Turnbull estimate. These values partly include the legitimate zero bidders from the first WTP question. Modifying the estimated values for the fact that part of the sam-ple population is a legitimate zero bidder, lower weighted average WTP values of re-spectively US$2.42 and US$3.21 per household per year result for the linear-logistic and Turnbull model (corresponding with 0.25 and 0.34 percent of average household in-come). Aggregating the lower adjusted average (hence conservative estimate) across the whole population of beneficiaries (33,640 households), a total economic value is found of US$81,200 per year.
5.3 Temporal stability of stated willingness to pay for flood control
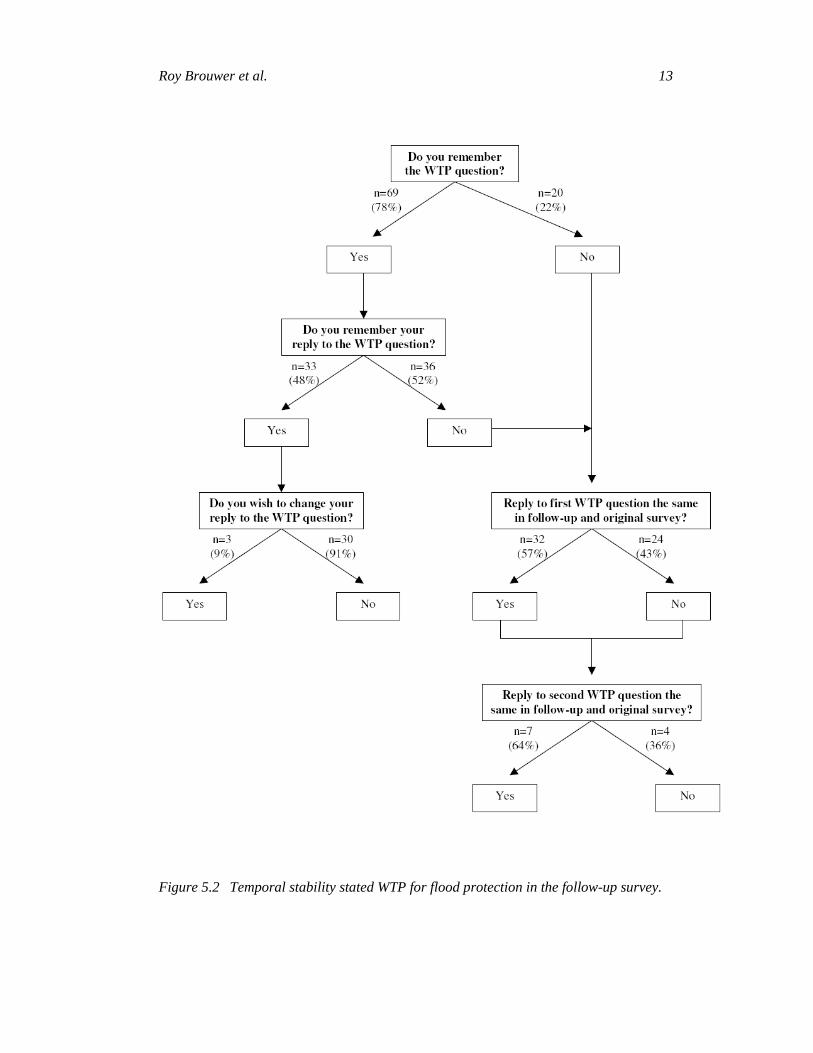
Thirty-six respondents who said yes and fifty-three respondents who said no to the WTP question were randomly selected and contacted six months after they participated in the original survey. They were asked a series of follow-up questions during the face-to-face interviews about their original WTP replies. Seventy-eight percent of the respondents remembered the WTP question in the survey (Figure 5.2), half of which also remem-bered their WTP reply. Ninety-five percent of these latter respondents also remembered the bid amount they were asked to pay.
Of those respondents who remembered their WTP reply, ninety-one percent does not want to change their original WTP reply (of which 15 respondents said yes and 15 re-spondents said no to the second WTP question in the original survey). Nine percent (n=3) changed their original reply. Two of these respondents said no to the presented bid amount in the original survey, but were willing to pay this money amount in the follow-up survey, because their financial situation had improved. One respondent who said yes to the WTP question in the original survey did not want to pay anymore in the follow-up survey due to financial problems.
Roy Brouwer et al. 13
Figure 5.2 Temporal stability stated WTP for flood protection in the follow-up survey.
Economic valuation of flood risk exposure and flood control 14
Those respondents who did not remember their WTP reply were asked the two WTP questions once again, but this time the second WTP question was an open-ended WTP question (asking respondents for their maximum WTP). Fifty-seven percent of these re-spondents answered the first WTP question (WTP in principle) in the same way as they did in the original survey. Forty-three percent gave a different answer. Six respondents said yes where they said no in the original survey and eighteen respondents said no in-stead of yes, mainly because of insufficient financial resources (n=14). Half of the latter respondents (n=7) said that they are willing to pay in kind, e.g. providing labour or giv-ing up land for the construction of the embankment.
Seven of the eleven respondents who agreed to pay a specific bid amount in the original survey and stated a maximum WTP for the second WTP question in the follow-up sur-vey, gave a higher maximum WTP than the original bid amount. Four respondents stated a maximum WTP lower than the original bid amount, suggesting that their WTP de-creased over time between the original and follow-up survey. Nine respondents who said yes to the first WTP question and no to the presented bid amount in the original survey, stated, as expected, a lower maximum WTP in the follow-up survey. Average WTP in the follow-up survey is US$2.02, which is significantly lower than the estimated original WTP values presented in Table 5.1 (based on the Normal test8). However, the number of observations for the WTP values in the follow-up survey (n=20) is too low to be able to draw any meaningful conclusion (in the international CV literature open ended WTP elicitation formats have been found to produce significantly lower average WTP values than dichotomous choice based formats (e.g. Bateman et al., 1995)).
Finally, respondents were asked in the follow-up survey how certain they are about the money amount they are willing to pay and how clear it is what they are being asked to pay for. All respondents who stated a maximum WTP in the follow-up survey were (very) clear and (very) certain about the stated WTP amount. Almost seventy percent of those respondents who remembered their WTP reply were very clear what they were be-ing asked to pay for during the first interview, twenty-five percent was clear and only one respondent said it was not very clear to him.
5.4 Factors explaining flood plain resident willingness to pay for flood control
When regressing stated WTP on the theoretically expected variables, we end up with two significant and - based on the statistics presented at the bottom of Table 5.2 such as R2 – good fitting, but competing models (Table 5.2)9. In both models, the bid amounts used in the CV survey are statistically significant and show the expected sign (the higher the bid,
8 The estimated 95% confidence intervals around the hypothesized differences in mean WTP
values are [-1.50 - -0.92] for the logistic probability based estimator and [-2.52 - -2.02] for the Turnbull based estimator. The hypothesized value of zero (no difference) does not fall in the estimated confidence interval, resulting in the rejection of the null hypothesis of equal mean WTP values.
9 Several models were estimated using statistical backward and forward elimination techniques and trial and error, including a variety of other demographic and socio-economic sample population characteristics such as respondent age, gender, occupation, education, household size, assets (including land and fish ponds), specific flood problems, religion and house char-acteristics. However, none of these variables appeared to be statistically significant.
Roy Brouwer et al. 15
the lower the probability that someone is willing to pay, all other things being equal). The models differ because other theoretically expected variables appear to be statistically significant depending on which combinations of variables are included in the model. This concerns all the variables identified in the theoretical model presented in section 3 (equation 1): the exogenous flood risk exposure indicator measured through the distance respondents live from the river or inundation level, disutility from flood risks measured through higher or lower damage costs10, risk aversion measured through the importance attached to flood protection, and household income as one of the most import economic constraints on WTP.
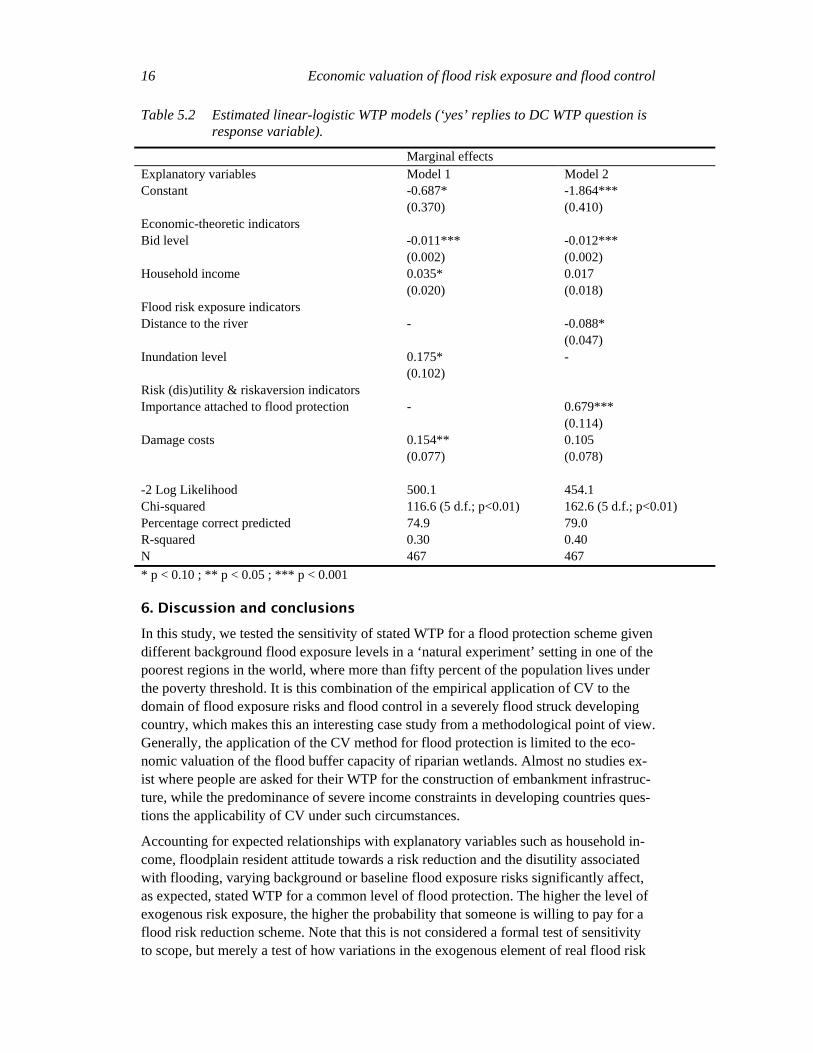
In the first model, inundation level is used as a proxy for respondent flood risk exposure. In this model, household income has, as expected, a significant positive impact on stated WTP (the higher the income level, the higher the probability that someone is willing to pay, all other things being equal), and also annual flood damage costs is significant and positively related to WTP (all other things being equal, the more damage, the higher the probability someone is willing to pay for flood protection). The latter positive relation-ship can be interpreted as an insurance premium floodplain residents are willing to pay for flood protection. In view of the fact that there exists a significant correlation between inundation depth and the flood protection attitude variable (the highest correlation (r=0.29; p<0.01) found between explanatory variables when using the parametric Pear-son’s correlation coefficient to examine possible model multicollinearity), these two variables are not included together in Model 111. In Model 2, the distance people live from the river is used instead as an indicator of flood risk exposure, and this variable ap-pears to be statistically significant when including it together with the highly significant flood risk attitude variable ‘importance attached to flood protection’. Stated WTP varies with this indicator for flood risk exposure levels only if this attitudinal variable is ac-counted for. The closer people live to the river, the higher the probability that they are willing to pay a positive amount of money for flood protection (all other things being equal). As expected, the higher the ex ante ‘utility’ from flood protection (or ‘disutility’ from no protection), the higher the probability of a positive WTP. However, as can be seen from Table 5.2, when including the attitude variable in the model, the variables household income and damage costs become insignificant. Excluding household income from Model 2, the variable damage costs becomes just significant at the 10 percent level. In that case, we still find exactly the same expected relationship: the higher current dis-utility (as measured through annual damage costs), the higher the probability of a posi-tive WTP.
10 Originally also the extent to which floodplain residents suffer from diarrhea during the rain
season was used as a proxy for this, but this variable appeared to be insignificant in both models.
11 There also exists a small, but significant correlation between inundation depth and distance from river (r=0.21; p<0.01). This is why inundation depth and the distance variable are not included in one and the same model.
Economic valuation of flood risk exposure and flood control 16
Table 5.2 Estimated linear-logistic WTP models (‘yes’ replies to DC WTP question is response variable).
Marginal effects Explanatory variables Model 1 Model 2 Constant -0.687*
(0.370) -1.864*** (0.410)
Economic-theoretic indicators Bid level -0.011***
(0.002) -0.012*** (0.002)
Household income 0.035* (0.020)
0.017 (0.018)
Flood risk exposure indicators Distance to the river - -0.088*
(0.047) Inundation level 0.175*
(0.102) -
Risk (dis)utility & riskaversion indicators Importance attached to flood protection -
0.679*** (0.114)
Damage costs 0.154** (0.077)
0.105 (0.078)
-2 Log Likelihood 500.1 454.1 Chi-squared 116.6 (5 d.f.; p<0.01) 162.6 (5 d.f.; p<0.01) Percentage correct predicted 74.9 79.0 R-squared 0.30 0.40 N 467 467 * p < 0.10 ; ** p < 0.05 ; *** p < 0.001
6. Discussion and conclusions
In this study, we tested the sensitivity of stated WTP for a flood protection scheme given different background flood exposure levels in a ‘natural experiment’ setting in one of the poorest regions in the world, where more than fifty percent of the population lives under the poverty threshold. It is this combination of the empirical application of CV to the domain of flood exposure risks and flood control in a severely flood struck developing country, which makes this an interesting case study from a methodological point of view. Generally, the application of the CV method for flood protection is limited to the eco-nomic valuation of the flood buffer capacity of riparian wetlands. Almost no studies ex-ist where people are asked for their WTP for the construction of embankment infrastruc-ture, while the predominance of severe income constraints in developing countries ques-tions the applicability of CV under such circumstances.
Accounting for expected relationships with explanatory variables such as household in-come, floodplain resident attitude towards a risk reduction and the disutility associated with flooding, varying background or baseline flood exposure risks significantly affect, as expected, stated WTP for a common level of flood protection. The higher the level of exogenous risk exposure, the higher the probability that someone is willing to pay for a flood risk reduction scheme. Note that this is not considered a formal test of sensitivity to scope, but merely a test of how variations in the exogenous element of real flood risk
Roy Brouwer et al. 17
impacts on stated WTP, in view of the fact that we are unable to fully control for the va-riety of possible endogenous influences on real flood risk levels. Although a majority of almost eighty-five percent of the sample population takes no preventive measures to pro-tect themselves against flooding for reasons of insufficient financial means or respondent belief that flooding is an unavoidable natural process, risk-averting behaviour was in-adequately addressed in this case study due to a lack of information.
Background flood exposure levels were measured in two different ways: through the dis-tance that people live from the river and the inundation level of their house during the rainy season. Based on these two different measures (and due to the possible presence of multicollinearity) two separate dichotomous choice CV models were estimated, with ac-ceptable goodness of fit parameters. As expected, inundation level is positively related to stated WTP and distance from the river negatively, reflecting significant distance-decay effects. Household income level is only significant in the model where inundation level is used as a proxy for risk exposure level. Respondent attitude towards flood risk reduc-tion as a measure of risk aversion is also a highly significant explanatory variable, but one which interacts with inundation level. Annual flood damage costs are used as a proxy for the disutility of flood risk exposure and have, as expected, a positive impact on stated WTP, i.e. the higher the annual damage costs (or disutility), the higher the prob-ability that someone states a positive WTP.
The valuation results are fairly stable in time. In a follow-up survey six months after the original survey was carried out, almost eighty percent of the respondents stay with their original WTP reply. This corresponds with previous findings in developed countries (e.g. McConnell et al., 1998). However, we find a large number of zero bids in this case study due to respondents lacking money resources. This raises questions over the applicability of the CV method in a developing country such as Bangladesh. Theoretically we expect income constraints to be significant in CV research as willingness to pay is determined by ability to pay, but in our case as many as 47 percent of the population sample is not willing to pay for this specific reason.
In the follow-up survey we find a number of reasons for this result. First, although there was no indication in the pre-test of limited experiences with the cash economy, approxi-mately half of the respondents who said that they have insufficient financial resources to pay are willing to contribute in kind, mainly by supplying household labour for the con-struction of the embankment. This indicates that WTP for these respondents is in fact positive and that the combined use of a monetary and non-monetary measure of WTP should perhaps have been considered. On the other hand, twenty percent of the respon-dents in the follow-up survey believe that flooding is an unavoidable natural event. This suggests that flood events may be factored in floodplain residents’ mental frame and be-haviour and hence behavioural intention as measured through CV, resulting in a low WTP, even though flooding is mentioned as the most important problem in the area by 25% of the original sample population. Furthermore, the economic value of flood risk exposure also seems to have been capitalized already in property prices as we find a small, but significant positive relationship in this study between risk exposure and prop-erty prices. Third, strategic behaviour may have played a role here too in view of the fact that before answering the WTP question a majority of respondents indicated that they generally expect the central Government to pay for flood control with the help of foreign aid, although no one actually protested against the proposed market and payment struc-
Economic valuation of flood risk exposure and flood control 18
ture for this reason. In the follow-up survey, we find that for about twenty percent of the respondents who claimed to have insufficient financial resources to pay, their reply is in-fluenced by their belief that the central Government is responsible for flood control. These respondents are usually categorized as protest bidders in CV research, undermin-ing the validity of the CV application. Despite thorough pre-testing of the CV questions and lengthy discussions about the questions between the ‘Western’ and ‘Asian’ experts, this latter result illustrates once again how careful CV researchers must be in interpreting respondents’ answers in a cross-cultural context.
References
Bangladesh Bureau of Statistics (2005). Statistical pocketbook of Bangladesh 2003. Bangladesh Bureau of Statistics, Dhaka.
Bateman, I.J., Langford, I.H., Turner, R.K., Willis, K.G. & Garrod, G.D. (1995). Elicitation and truncation effects in contingent valuation studies. Ecological Economics, 12(2), 161-179.
Bateman, I.J., Brouwer, R., Georgiou, S., Hanley, N., Machado, F., Mourato, S. & Saunders, S. (2005). A 'natural experiment' approach to investigating scope sensitivity in values for risk reductions: Private and public UV health risk reduction strategies in low and high risk coun-tries. Environmental and Resource Economics, 31, 47-72.
Brouwer, R., Langford, I.H., Bateman, I.J. & Turner, R.K. (1999). A meta-analysis of wetland contingent valuation studies. Regional Environmental Change, 1(1), 47-57.
Brouwer, R. & Bateman, I.J. (2005). The temporal stability and transferability of models of will-ingness to pay for flood control and wetland conservation. Water Resources Research, 41(3), W03017, doi:10.1029/2004WR003466.
Baron, J. & J. Greene (1996). Determinants of insensitivity to quantity in valuations of public goods: contribution, warm glow, budget constraints, availability and prominence. Journal of Experimental Psychology, 2, 107-25.
Beattie, J., Covey, J., Dolan, P., Hopkins, L., Jones-Lee, M., Loomes, G., Pidgeon, N., Robinson, A & Spencer, A. (1998). On the contingent valuation of safety and the safety of contingent valuation: Part 1 – Caveat investigator. Journal of Risk and Uncertainty, 17, 5-25.
Carthy, T., Chilton, S., Covey, J., Hopkins, L., Jones-Lee, M., Loomes, G., Pidgeon, N. & Spencer, A. (1999). On the contingent valuation of safety and the safety of contingent valua-tion: part 2 – the CV/SG chained approach. Journal of Risk and Uncertainty, 17, 187-213.
Carson, R.T., Hanemann, W.M., Kopp, R.J., Krosnick, J.A., Mitchell, R.C., Presser, S., Ruud, P.A. & Smith, V.K. (1994). Prospective interim lost use value due to DDT and PCB contamination in the Southern California Bight. NOAA Contract no. DGNC-1-00007.
CEGIS (2002). Analytical framework for the planning of integrated water resources manage-ment. Center for Environmental and Geographic Information Systems, Dhaka, Bangladesh.
Daun, M.C. (2000). Flood risk and contingent valuation willingness to pay studies: A methodo-logical review and applied analysis. Technical report #6, Institute for Urban Environmental Risk Management, Marquette University, Milwaukee, WI, USA.
Efron, B. & Tibshirani, R.J. (1993). An introduction to the bootstrap. New York: Chapman and Hall.
Georgiou, S., Whittington, D., Pearce, D.W. & Moran, D. (1997). Economic values and the environment in the Developing World Cheltenham, UK: Edward Elgar.
Haab, T.C. & McConnell, K.E. (1997). Referendum models and negative willingness to pay: al-ternative solutions. Journal of Environmental Economics and Management, 32, 251-270.
Roy Brouwer et al. 19
Hanemann, W.M. (1984). Welfare evaluations in contingent valuation experiments with discrete responses. American Journal of Agricultural Economics, 66, 332-341.
Hanemann, W.M. (1989). Welfare evaluations in contingent valuation experiments with discrete response data: Reply. American Journal of Agricultural Economics, 71, 1057.
Haque, E., Aftab, S., Brander, L. & Brouwer, R. (forthcoming). Sustainable flood management in Bangladesh. A cost-benefit analysis. PREM report, IVM, Vrije Universiteit, Amsterdam.
Johansson, P-O. (1995). Evaluating health risks. An economic approach. Cambridge: Cambridge University Press.
Jones-Lee, M., Loomes, G., O’Reilly, D. & Philips, P. R, (1993). The value of preventing non-fatal road injuries: Findings of a willingness-to-pay national sample survey. Working Paper WP/SRC/, Crowthorne, Transport Research Laboratory.
Jones-Lee, M. & Loomes, G. (1997). Valuing health and safety: some economic and psychologi-cal issues. In Nau, R., Gronn, E., Machina, M. & Bergland, O. (eds)., Economic and Envi-ronmental Risk and Uncertainty: New Models and Methods. Dordrecht: Kluwer Academic Press, pp. 3-32.
Langford, I.H. & Bateman, I.J. (1993). Welfare measures for contingent valuation studies: estima-tion and reliability. GEC Working Paper 93-04, Centre for Social and Economic Research on the Global Environment (CSERGE), University of East Anglia and University College London.
McConnell, K.E., Strand, I.E. & Valdes, S. (1998). Testing temporal reliability and carry-over ef-fect: the role of correlated responses in test-retest reliability studies. Environmental and Resource Economics, 12, 357-374.
NEDECO (1993). Flood Action Plan Bangladesh: Evaluation Report 1993. Netherlands Development Cooperation, The Hague.
Rasid, H. (2000). Reducing vulnerability to flood disasters in Bangladesh: Compatibility of floodplain residents’ preferences for flood alleviation measures with indigenous adjustments to floods. In Parker, D.J. (ed.). Floods: Volume II. London: Routledge, pp. 46–65.
Rasid, H. & Mallik, A. (1995). Flood adaptations in Bangladesh: is the compartmentalization technique compatible with indigenous adjustments of rice cropping to flood regimes? Applied Geography, 15(1), 3–7.
Rasid, H. & Haider, W. (2003). Floodplain residents’ preferences for water level management options in flood control projects in Bangladesh. Natural Hazards, 28, 101-129.
Rosenzweig, M.R. & Wolpin, K.I. (2000). ‘Natural experiments’ in economics. Journal of Economic Literature, 38 (4), 827-874.
Shogren, J. & Crocker, T. (1991). Risk, self-protection, and ex ante valuation. Journal of Environmental Economics and Management, 20, 1-15.
Smith, V.K. (1992). Environmental risk perception and valuation: Conventional versus prospective reference theory. In Bromley, D.W. & Segerson, K. (eds.). The social response to environ-mental risk. Boston: Kluwer.
Tversky, A., Sattath, S. & Slovic, P. (1988). Contingent weighting in judgement and choice. Psychological Review, 95, 371-384.
Viscusi, W.K. (1989). Prospective reference theory: Toward an explanation of the paradoxes. Journal of Risk and Uncertainty, 2(3), 235-264.
Whittington, D. (1998). Administering contingent valuation surveys in Developing Countries. World Development, 26(1), 21-30.
Whittington, D., Smith, V.K., Okorafor, A., Okore, A., Long Liu, J. & McPhail, A. (1992). Giving respondents time to think in contingent valuation studies: A Developing Country ap-plication. Journal of Environmental Economics and Management, 22, 205-225.