CORPUS CHRISTI HONDA - Barcom Construction...
39
CORPUS CHRISTI HONDA APPENDIX A SOILS REPORT
Transcript of CORPUS CHRISTI HONDA - Barcom Construction...
CORPUS CHRISTI HONDA
APPENDIX A SOILS REPORT

GEOTECHNICAL ENGINEERING STUDY NORTH CORPUS CHRISTI HONDA
CORPUS CHRISTI, TEXAS
Prepared for:
John Mahoney Architect 850 W. Elliot Rd., # 108 Tempe, Arizona 85284
Prepared by:
Tolunay-Wong Engineers, Inc. 826 South Padre Island Drive Corpus Christi, Texas 78416
October 24, 2016
Project No. 16.53.065 / Report No. 12548
TWE Project No. 16.53.065 Report No. 12548 i
TABLE OF CONTENTS
1 INTRODUCTION AND PROJECT DESCRIPTION 1-1 1.1 Introduction 1-1 1.2 Project Description 1-1
2 PURPOSE AND SCOPE OF SERVICES 2-1 3 FIELD PROGRAM 3-1
3.1 Soil Borings 3-1 3.2 Drilling Methods 3-1 3.3 Soil Sampling 3-1 3.4 Boring Logs 3-2 3.5 Groundwater Measurements 3-2
4 LABORATORY SERVICES 4-1 5 SITE AND SUBSURFACE CONDITIONS 5-1
5.1 General 5-1 5.2 Site Description and Surface Conditions 5-1 5.3 Subsurface Conditions 5-1 5.4 Subsurface Soil Properties 5-1 5.5 Groundwater Observations 5-2 5.6 Shrink / Swell Potential 5-2
6 FOUNDATION RECOMMENDATIONS 6-1 6.1 Discussion 6-1 6.2 Drilled and Underreamed Piers 6-1 6.3 Grade Beams 6-3 6.4 Buildings Floor Slabs 6-3
7 EARTHWORK CONSIDERATIONS 7-1 7.1 Subgrade Preparation and Structural Select Fill 7-1 7.2 Drainage 7-2
8 PAVEMENT DESIGN RECOMMENDATIONS 8-1 8.1 New Pavement Sections 8-1 8.2 Pavement Section Materials 8-5 8.3 Pavement Drainage and Maintenance 8-6
9 LIMITATIONS AND DESIGN REVIEW 9-1 9.1 Limitations 9-1 9.2 Design Review 9-1 9.3 Construction Monitoring 9-1 9.4 Closing Remarks 9-1
TWE Project No. 16.53.065 Report No. 12548 ii
TABLES AND APPENDICES
TABLES
Table 4-1 Laboratory Testing Program 4-1
Table 5-1 General Relationship between P.I. and Shrink/Swell Potential 5-2
Table 6-1 Material Excavation and Replacement with Resulting PVR 6-4
Table 7-1 Compaction Equipment and Maximum Lift Thickness 7-1
Table 8-1 Vehicle Classification and Traffic Loading 8-1
Table 8-2 Flexible Pavement Design Values 8-2
Table 8-3 Recommended Minimum Typical Flexible Pavement Thicknesses 8-2
Table 8-4 Rigid Pavement Design Values 8-3
Table 8-5 Recommended Minimum Typical Rigid Pavement Thicknesses 8-4
Table 8-6 Rigid Pavement Components 8-4
APPENDICES
Appendix A: Soil Boring Location Plan TWE Drawing No. 16.53.065-1
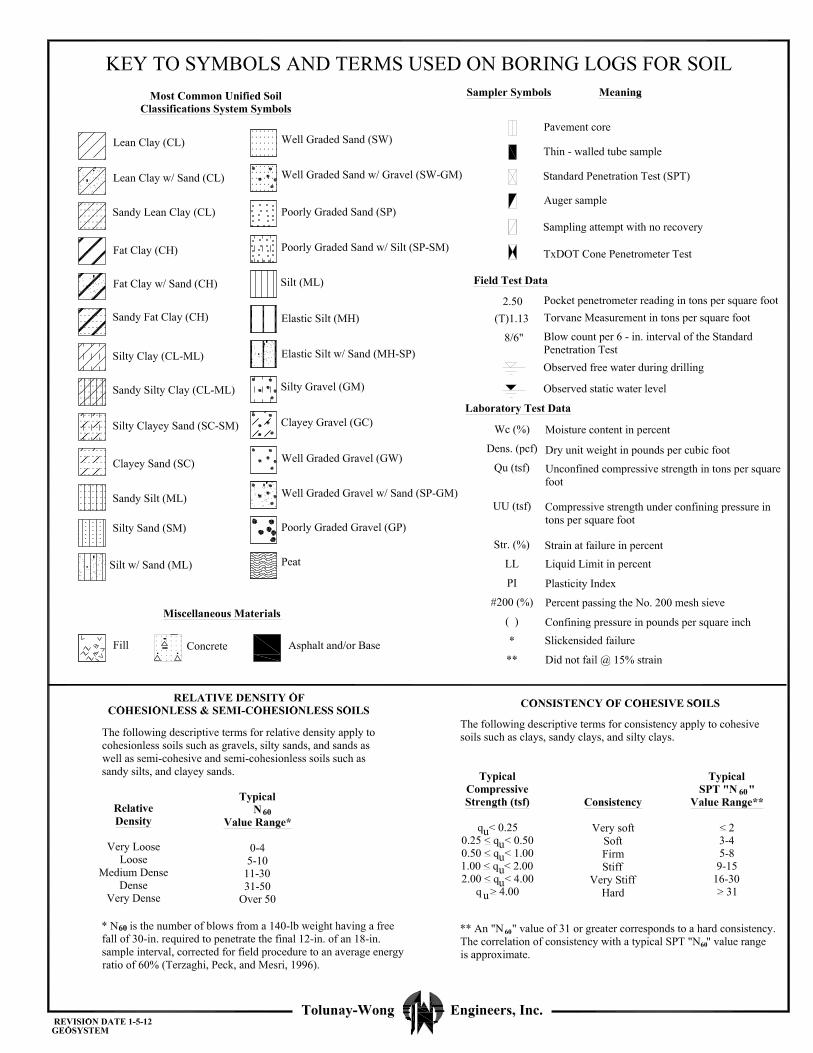
Appendix B: Log of Project Borings and a Key to Terms and Symbols used on Boring Logs
TWE Project No. 16.53.065 1-1 Report No. 12548
1 INTRODUCTION AND PROJECT DESCRIPTION
1.1 Introduction
This report presents the results of our geotechnical engineering study performed for the proposed new North Corpus Christi Honda in Corpus Christi, Texas. Our geotechnical engineering study was conducted in accordance with TWE Proposal No. P16-C066, dated July 12, 2016, and authorized by Mr. Zamora on behalf of John Mahoney Architect.
1.2 Project Description
The project involves construction of a new Honda dealership with associated parking and driveway areas. We understand that the project will include a single- story, structural steel frame and load bearing tilt panel concrete or concrete masonry walls building with a footprint of about 135-ft. by 225-ft. with a 50-ft. by 60-ft. covered carport. Maximum anticipated structural gravity loads are on the order of 6 to 7 kips/lf for walls and 80 to 90 kips for columns. Most of the remainder of the site will be covered by parking lots, driveways, and access ways. Further, we understand that the at-grade area pavement will be mostly subjected to light traffic conditions (automobiles and light trucks) but occasionally heavy truck traffic from delivery trucks and vans as well as solid waste disposal vehicles.
TWE Project No. 16.53.065 2-1 Report No. 12548
2 PURPOSE AND SCOPE OF SERVICES
The purposes of our geotechnical engineering study were to investigate the soil and groundwater conditions within the project site and to provide geotechnical design and construction recommendations for the proposed facility.
Our scope of services performed for the project consisted of:
1. Drilling three (3) soil borings to depths of 25-ft. each within the proposed building footprint and five (5) borings to depth of 5-ft. each within proposed area pavement to evaluate subsurface stratigraphy and groundwater conditions;
2. Performing geotechnical laboratory tests on recovered soil samples to evaluate the physical and engineering properties of the strata encountered;
3. Providing geotechnical design recommendations for suitable foundation systems for support of the new building;
4. Providing geotechnical design recommendations for both flexible (asphalt) and rigid (concrete) pavement sections including subgrade preparation and required component thicknesses; and,
5. Providing geotechnical construction recommendations including site and subgrade preparation, excavation considerations, fill and backfill requirements, compaction requirements, foundation installation and overall quality control monitoring, testing and inspection services.
Our scope of services did not include any environmental assessments for the presence or absence of wetlands or of hazardous or toxic materials within or on the soil, air or water within this project site. Any statements in this report or on the boring logs regarding odors, colors or unusual or suspicious items or conditions are strictly for the information of the Client. A geological fault study was also beyond the scope of our services associated with this geotechnical engineering study.
TWE Project No. 16.53.065 3-1 Report No. 12548
3 FIELD PROGRAM
3.1 Soil Borings
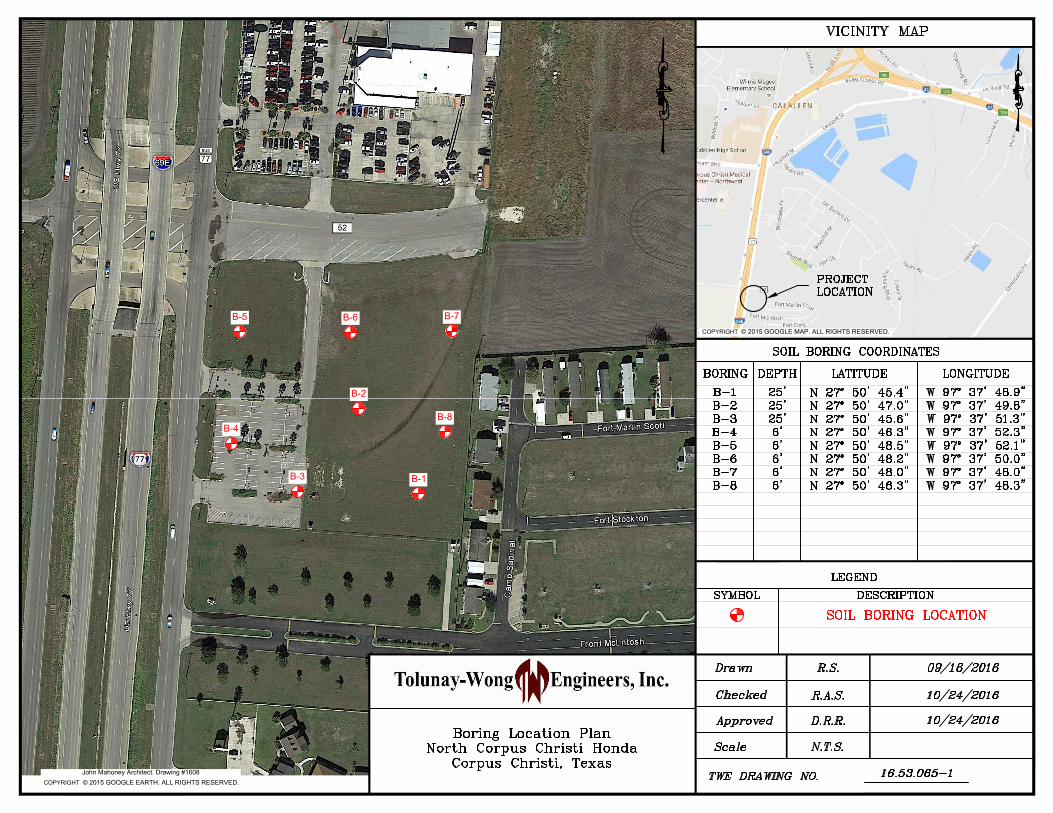
TWE conducted an exploration of subsurface soil and groundwater conditions at the project site on September 26, 2016 by drilling, logging and sampling eight (8) soil borings to depths of 6-ft. and 25-ft. below existing grades. The soil boring locations are presented on TWE Drawing No. 16.53.065-1 in Appendix A of this report. Drilling and sampling of the soil borings were performed using conventional truck-mounted drilling equipment. The borings were logged by an experienced geotechnician. The boring locations were staked at the site by TWE and the latitude and longitude for each boring location were determined by hand held GPS device and are presented on the boring logs.
3.2 Drilling Methods
Field operations were performed in general accordance with the Standard Practice for Soil Investigation and Sampling by Auger Borings [American Society for Testing and Materials (ASTM) D 1452]. The soil borings were drilled using a truck-mounted drilling rig equipped with a rotary head. Typically, borings are dry-augered using a flight auger to advance the boreholes until groundwater is encountered or until the boreholes become unstable and/or collapse. At that point, soil borings are completed using wash-rotary drilling techniques. Samples were obtained continuously from existing ground surface to a depth of 12-ft., at the 13-ft. to 15-ft. depth interval and at intervals of 5-ft. thereafter until the boring completion depths of 6-ft. and 25-ft. were reached.
3.3 Soil Sampling
Fine-grained, cohesive soil samples were recovered from the soil borings by hydraulically pushing 3-in diameter, thin-walled Shelby tubes a distance of about 24-in. The field sampling procedures were conducted in general accordance with the Standard Practice for Thin-Walled Tube Sampling of Soils (ASTM D 1587). Our geotechnician visually classified the recovered soils and obtained field strength measurements using a pocket penetrometer. A factor of 0.67 is typically applied to the penetrometer measurement to estimate the undrained shear strength of the Gulf Coast cohesive soils. The samples were extruded in the field, wrapped in foil, placed in moisture sealed containers and protected from disturbance prior to transport to the laboratory.
Cohesionless and semi-cohesionless samples were collected with the standard penetration test (SPT) sampler driven 18-in by blows from a 140-lb hammer falling 30-in in accordance with the Standard Test Method for Standard Penetration Test (SPT) and Spilt-Barrel Sampling of Soils (ASTM D 1586). The number of blows required to advance the sampler three (3) consecutive 6-in depths are recorded for each corresponding sample on the boring logs. The N-value, in blows per foot, is obtained from SPTs by adding the last two (2) blow count numbers. The compactness of cohesionless and semi-cohesionless samples are inferred from the N-value. The samples obtained from the split-barrel sampler were visually classified, placed in moisture sealed containers and transported to our laboratory.
The recovered soil sample depths with corresponding pocket penetrometer measurements and SPT blowcounts are presented on the boring logs in Appendix B.

TWE Project No. 16.53.065 3-2 Report No. 12548
3.4 Boring Logs
Our interpretations of general subsurface soil and groundwater conditions at the soil boring locations are included on the boring logs. Our interpretations of the soil types throughout the boring depths and the locations of strata changes were based on visual classifications during field sampling and laboratory testing results in accordance with Standard Practice for Classification of Soils for Engineering Purposes (Unified Soil Classification System) (ASTM D 2487) and Standard Practice for Description and Identification of Soils (Visual-Manual Procedure) (ASTM D 2488).
The boring logs include the type and interval depth for each sample along with its corresponding pocket penetrometer measurements and SPT blow counts. The boring logs and a key to terms and symbols used on boring logs are presented in Appendix B.
3.5 Groundwater Measurements
Groundwater level measurements were attempted in the open boreholes during dry-auger drilling. Water level readings were attempted in the open boreholes when groundwater was first encountered and after a ten (10) to fifteen (15) minute time period. The groundwater observations are summarized in Section 5.5 of this report entitled “Groundwater Observations.”

TWE Project No. 16.53.065 4-1 Report No. 12548
4 LABORATORY SERVICES
A laboratory testing program was conducted on selected samples to assist in classification and evaluation of the physical and engineering properties of the soils encountered in the project borings. Laboratory tests were performed in general accordance with ASTM International standards to measure physical and engineering properties of the recovered samples. The types and brief descriptions of the laboratory tests performed are presented in Table 4-1 below.
Table 4-1: Laboratory Testing Program
Test Description Test Method Amount of Material in Soils Finer than No. 200 Sieve ASTM D 1140
Unconfined Compressive Strength of Cohesive Soil (UC) ASTM D 2166
Water (Moisture) Content of Soil ASTM D 2216
Liquid Limit, Plastic Limit and Plasticity Index of Soils ASTM D 4318
Density (Unit Weight) of Soil Specimens ---
Amount of Materials in Soils Finer than No. 200 (75-µm) Sieve (ASTM D 1140) This test method determines the amount of materials in soils finer than the No. 200 (75-µm) sieve by washing. The loss in weight resulting from the wash treatment is presented as a percentage of the original sample and is reported as the percentage of silt and clay particles in the sample.
Unconfined Compressive Strength of Cohesive Soil (ASTM D 2166) This test method determines the unconfined compressive (UC) strength of cohesive soil in the undisturbed or remolded condition using strain-controlled application of an axial load. This test method provides an approximate value of the strength of cohesive materials in terms of total stresses. The undrained shear strength of a cohesive soil sample is typically one-half (1/2) the unconfined compressive strength.
Water (Moisture) Content of Soil by Mass (ASTM D 2216) This test method determines water (moisture) content by mass of soil where the reduction in mass by drying is due to loss of water. The water (moisture) content of soil, expressed as a percentage, is defined as the ratio of the mass of water to the mass of soil solids. Moisture content may provide an indication of cohesive soil shear strength and compressibility when compared to Atterberg Limits.
Liquid Limit, Plastic Limit and Plasticity Index of Soils (ASTM D 4318) This test method determines the liquid limit, plastic limit and the plasticity index of soils. These tests, also known as Atterberg limits, are used from soil classification purposes. They also provide an indication of the volume change potential of a soil when considered in conjunction with the natural moisture content. The liquid limit and plastic limit establish boundaries of consistency for plastic soils. The plasticity index is the difference between the liquid limit and plastic limit.

TWE Project No. 16.53.065 4-2 Report No. 12548
Dry Unit Weight of Soils This test method determines the weight per unit volume of soil, excluding water. Dry unit weight is used to relate the compactness of soils to volume change and stress-strain tendencies of soils when subjected to external loadings.
Soil properties including moisture content, unit weight, Atterberg Limits, grain size distribution, penetration resistance, shear strength and compressive strength are presented on the project boring logs in Appendix B.
TWE Project No. 16.53.065 5-1 Report No. 12548
5 SITE AND SUBSURFACE CONDITIONS
5.1 General
Our interpretations of soil and groundwater conditions within the project site are based on information obtained at the soil boring locations only. This information has been used as the basis for our conclusions and recommendations included in this report. Subsurface conditions may vary at areas not explored by the soil borings. Significant variations at areas not explored by the soil borings will require reassessment of our recommendations.
5.2 Site Description and Surface Conditions
The site is an approximate 4.75 acre tract of land located on the southeast corner of the intersection of US Highway 77 (IH-69) and County Road 52 in Corpus Christi, Texas. The vacant property has existing at-grade pavement area that is used for new vehicle parking by an adjacent automobile dealership. The remainder of the site is covered by native vegetation (grass and weeds). The site is mostly flat with fair to poor drainage.
5.3 Subsurface Conditions
An existing asphaltic pavement section, consisting of about 2-in of asphalt and 7-in of flexible base material, was encountered at the surface of Boring B-4. A 2-ft. layer of existing fill material consisting of hard lean clay (CL) was encountered below the existing asphalt pavement section.
Below the existing fill material at B-4 and at the ground surface of the remaining borings, the soil profile included SANDY FAT CLAY (CH), FAT CLAY with SAND (CH), and SANDY LEAN CLAY (CL). The sandy fat clay, fat clay with sand, and sandy lean clay profile extended to about 10-ft. to 12-ft. below existing grades. The shallow 6-ft. borings were terminated in the sandy fat clay (CH) soils. Below the clay profile, CLAYEY SAND (SC) and POORLY GRADED SAND with CLAY (SP-SC) were encountered to the termination depth of the deep borings at 25-ft. below existing grades. The consistency of the clay profile ranged from stiff to hard. The relative density of the clayey sand and poorly grade sand ranged from loose to dense. Detailed descriptions of the soils encountered at the boring locations are presented on the boring logs in Appendix B.
5.4 Subsurface Soil Properties
Results of Atterberg Limits tests on selected cohesive soil samples from the project borings indicated liquid limits (LL) ranging from 34 to 79 with corresponding plasticity indices (PI) ranging between 21 to 61. In-situ moisture contents of the soils ranged from 12% to 27% while the dry unit weight ranged between 96-pcf to 117-pcf. The amount of material passing the No. 200 sieve ranged from 52% to 77% within selected cohesive samples tested for grain size distribution.
Undrained shear strengths derived from field pocket penetrometer readings ranged from 1.25-tsf to 4.50+-tsf. Undrained shear strengths derived from laboratory unconfined compressive (UC) strength testing ranged from 1.79-tsf to 17.48-tsf.

TWE Project No. 16.53.065 5-2 Report No. 12548
The results of in-situ moisture content and percent finer than No. 200 sieve tests for the clayey sands and poorly graded sands with clay ranged from 4% to 12% and 4% to 42%, respectively.
Tabulated laboratory test results at the recovered sample depths are presented on the boring logs in Appendix B.
5.5 Groundwater Observations
Groundwater measurements were attempted in the project borings during dry-auger drilling. Free groundwater was not encountered in any borings drilled for this study during dry-auger drilling.
However, groundwater levels may fluctuate with climatic and seasonal variations and should be verified before construction. Accurate determination of the static groundwater level is typically made with a standpipe piezometer. Installation of a piezometer to evaluate the long-term groundwater condition was not included within the current scope of services.
5.6 Shrink / Swell Potential
The tendency for a soil to shrink and swell with change in moisture content is a function of clay content and type which are generally reflected in soil consistency as defined by Atterberg Limits. A generalized relationship between shrink/swell potential and soil plasticity index (PI) is shown in Table 5-1 below.
Table 5-1: General Relationship Between PI and Shrink/Swell Potential
P.I. Range Shrink/Swell Potential 0 – 15 Low
15 – 25 Medium
25 – 35 High
> 35 Very High
The amount of expansion that will actually occur with increase in moisture content is inversely related to the overburden pressure. Therefore, the larger the overburden pressure, the smaller the amount of expansion. Near-surface soils are thus most susceptible to shrink/swell behavior because they experience low amounts of overburden. Overall, the soils at this site possess medium to very high shrink/swell potential.
TWE Project No. 16.53.065 6-1 Report No. 12548
6 FOUNDATION RECOMMENDATIONS
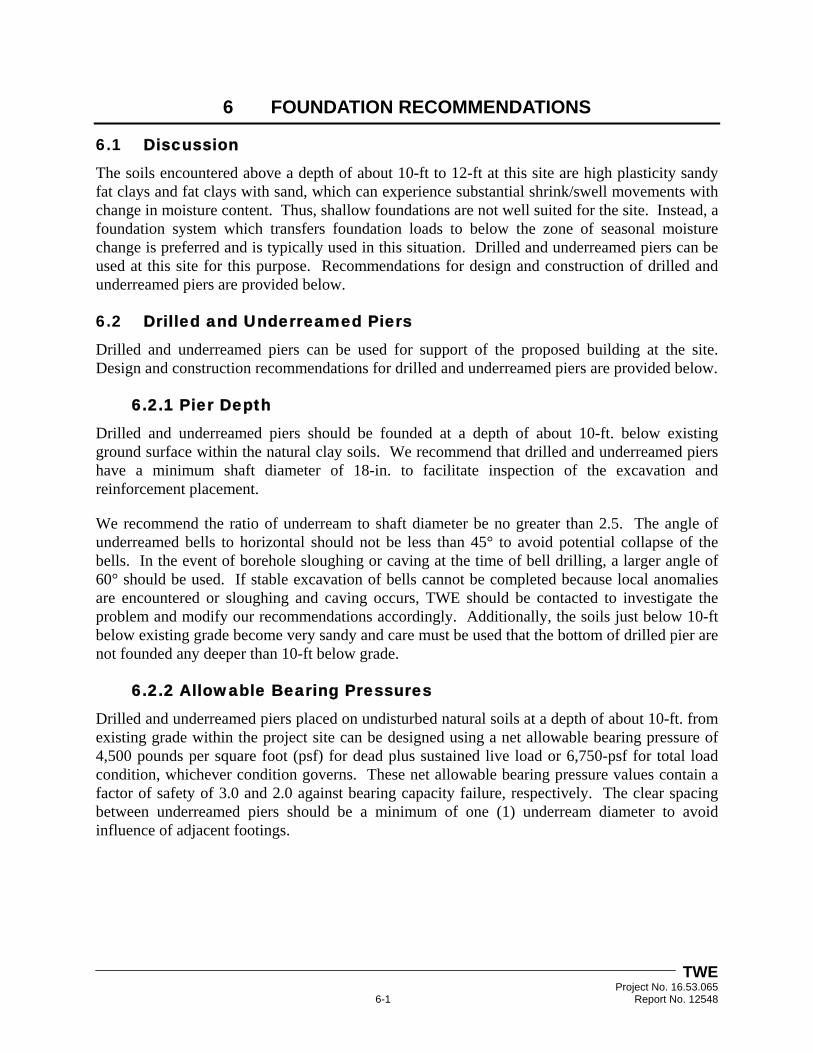
6.1 Discussion
The soils encountered above a depth of about 10-ft to 12-ft at this site are high plasticity sandy fat clays and fat clays with sand, which can experience substantial shrink/swell movements with change in moisture content. Thus, shallow foundations are not well suited for the site. Instead, a foundation system which transfers foundation loads to below the zone of seasonal moisture change is preferred and is typically used in this situation. Drilled and underreamed piers can be used at this site for this purpose. Recommendations for design and construction of drilled and underreamed piers are provided below.
6.2 Drilled and Underreamed Piers
Drilled and underreamed piers can be used for support of the proposed building at the site. Design and construction recommendations for drilled and underreamed piers are provided below.
6.2.1 Pier Depth
Drilled and underreamed piers should be founded at a depth of about 10-ft. below existing ground surface within the natural clay soils. We recommend that drilled and underreamed piers have a minimum shaft diameter of 18-in. to facilitate inspection of the excavation and reinforcement placement.
We recommend the ratio of underream to shaft diameter be no greater than 2.5. The angle of underreamed bells to horizontal should not be less than 45° to avoid potential collapse of the bells. In the event of borehole sloughing or caving at the time of bell drilling, a larger angle of 60° should be used. If stable excavation of bells cannot be completed because local anomalies are encountered or sloughing and caving occurs, TWE should be contacted to investigate the problem and modify our recommendations accordingly. Additionally, the soils just below 10-ft below existing grade become very sandy and care must be used that the bottom of drilled pier are not founded any deeper than 10-ft below grade.
6.2.2 Allowable Bearing Pressures
Drilled and underreamed piers placed on undisturbed natural soils at a depth of about 10-ft. from existing grade within the project site can be designed using a net allowable bearing pressure of 4,500 pounds per square foot (psf) for dead plus sustained live load or 6,750-psf for total load condition, whichever condition governs. These net allowable bearing pressure values contain a factor of safety of 3.0 and 2.0 against bearing capacity failure, respectively. The clear spacing between underreamed piers should be a minimum of one (1) underream diameter to avoid influence of adjacent footings.

TWE Project No. 16.53.065 6-2 Report No. 12548
6.2.3 Settlement
Settlement of properly constructed drilled and underreamed piers bearing on natural soils at a depth of 10-ft. below existing grade and designed using the allowable bearing pressures presented above should be less than 1-in. Drilled piers should have a clear spacing of one (1) underream diameter of the larger adjacent underream. Differential settlements between drilled piers will be governed by variation in subsurface conditions, structural loading conditions, and quality of the pier construction such as cleanliness of the underream.
6.2.4 Uplift Load Due to Swell Pressure
Swell pressure induced uplift loads acting on drilled piers can be estimated using a unit uplift skin friction (fs) in pounds per square foot (psf) acting on the outer perimeter of the shaft from the bottom of the structural select fill pad, if present, to the top of the underream. The estimated uplift skin friction derived from the subsurface conditions encountered in the project borings can be taken as 500-psf.
6.2.5 Uplift Resistance
The allowable uplift capacity of drilled and underreamed piers within the project site could be calculated using the following equations:
For Df/B > 1.5
Qa = Wf/1.2 + [11.6(B2 – b2)/FS]
For Df/B < 1.5
Qa = Wf/1.2 + [3.0(Df/B)2(B2 – b2)/FS]
where:
Qa = Allowable Uplift Capacity (kips) Wf = Weight of Footing (kips) Df = Depth of Base of Footing below Ground Surface (ft) B = Diameter of Underream (ft) b = Diameter of Shaft (ft) FS = Factor of Safety (2.0 for transient loads, 3.0 for sustained loads)
It is recommended that a total unit weight of 150-pcf be used for concrete to calculate the weight of the footing.
TWE Project No. 16.53.065 6-3 Report No. 12548
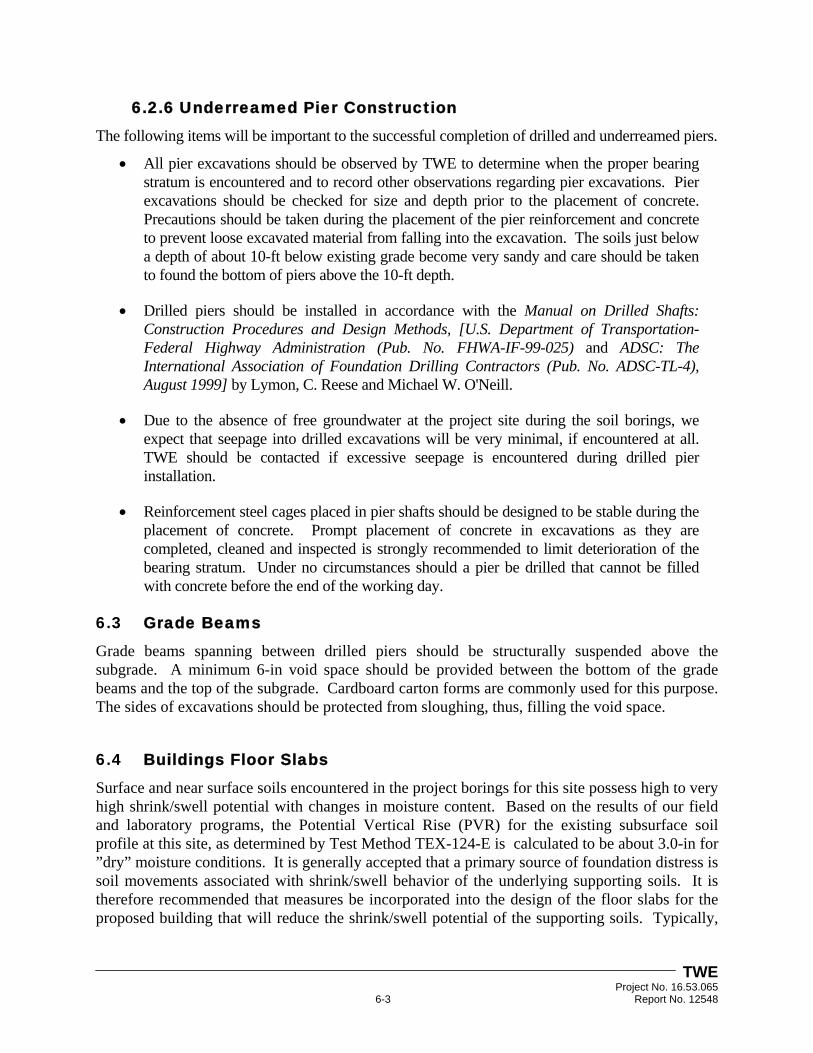
6.2.6 Underreamed Pier Construction
The following items will be important to the successful completion of drilled and underreamed piers.
All pier excavations should be observed by TWE to determine when the proper bearing stratum is encountered and to record other observations regarding pier excavations. Pier excavations should be checked for size and depth prior to the placement of concrete. Precautions should be taken during the placement of the pier reinforcement and concrete to prevent loose excavated material from falling into the excavation. The soils just below a depth of about 10-ft below existing grade become very sandy and care should be taken to found the bottom of piers above the 10-ft depth.
Drilled piers should be installed in accordance with the Manual on Drilled Shafts: Construction Procedures and Design Methods, [U.S. Department of Transportation-Federal Highway Administration (Pub. No. FHWA-IF-99-025) and ADSC: The International Association of Foundation Drilling Contractors (Pub. No. ADSC-TL-4), August 1999] by Lymon, C. Reese and Michael W. O'Neill.
Due to the absence of free groundwater at the project site during the soil borings, we expect that seepage into drilled excavations will be very minimal, if encountered at all. TWE should be contacted if excessive seepage is encountered during drilled pier installation.
Reinforcement steel cages placed in pier shafts should be designed to be stable during the placement of concrete. Prompt placement of concrete in excavations as they are completed, cleaned and inspected is strongly recommended to limit deterioration of the bearing stratum. Under no circumstances should a pier be drilled that cannot be filled with concrete before the end of the working day.
6.3 Grade Beams
Grade beams spanning between drilled piers should be structurally suspended above the subgrade. A minimum 6-in void space should be provided between the bottom of the grade beams and the top of the subgrade. Cardboard carton forms are commonly used for this purpose. The sides of excavations should be protected from sloughing, thus, filling the void space.
6.4 Buildings Floor Slabs
Surface and near surface soils encountered in the project borings for this site possess high to very high shrink/swell potential with changes in moisture content. Based on the results of our field and laboratory programs, the Potential Vertical Rise (PVR) for the existing subsurface soil profile at this site, as determined by Test Method TEX-124-E is calculated to be about 3.0-in for ”dry” moisture conditions. It is generally accepted that a primary source of foundation distress is soil movements associated with shrink/swell behavior of the underlying supporting soils. It is therefore recommended that measures be incorporated into the design of the floor slabs for the proposed building that will reduce the shrink/swell potential of the supporting soils. Typically,

TWE Project No. 16.53.065 6-4 Report No. 12548
potential movements below lightly loaded interior floors are reduced to the order of one (1)-in or less.
The most positive means of reducing potential floor slab movement at this site is the use of a structurally suspended floor system. The floor slab is structurally suspended above the subgrade with a minimum crawl space of 6-in. Loads from the floor slab are carried to grade beams which transfer the loads to columns and the drilled pier foundation. The crawl space subgrade should be shaped and graded to avoid ponding of water on its surface. Water should be drained to the perimeter of the crawl space and carried away from the building prior to discharging.
As an alternate, interior floor slabs for the proposed building may also consist of ground-supported units provided that potential shrink/swell movements are reduced to tolerable levels. A typical method of reducing the swell potential includes removal of a portion of the existing fat clay soils and installation of non-expansive structural fill beneath floor slabs. This method has beneficial results but does not totally eliminate the potential for shrink/swell movements.
Based on results of PVR analysis, we recommend that site preparation include:
Removal of the existing soils to the depth of at least 5.0-ft below existing grade.
After achieving specified subgrade elevation, proof-roll exposed subgrade and compact as indicated below.
After testing and acceptance of subgrade, immediate placement and compaction of at least 5.0-ft of non-expansive structural select fill, within the footprint of the proposed new building.
Maintain moisture in select fill pad until the concrete floor slab is constructed.
The subgrade to receive non-expansive structural fill should be proof-rolled as indicated below in Section 7.1. After proof-rolling, the subgrade should be scarified to a depth of 8-in, moisture adjusted to above (0 to +4%) optimum moisture content, and compacted to at least 95% of maximum dry density determined by ASTM D 698. After testing is accepted, the first lift of structural fill should be immediately placed and compacted.
Material and compaction requirements for non-expansive structural fill are provided below in Section 7.1 of this report. It is recommended that the final elevation of the building pad be raised using non-expansive select fill at least 8 inches above existing surrounding grade to provide positive drainage away from the building.
It should be noted that these methods for reducing shrink/swell movements are designed for normal seasonal changes in soil moisture content of the subgrade soils. Excessive shrink/swell movements can be expected if increases in soil moisture content occur as a result of broken water and sewer lines, improper drainage of surface water, shrubbery and trees planted near the foundation slab and excessive lawn or shrubbery irrigation. Gutter and downspouts preferably should be provided and runoff should be carried away from the building before discharging unto flatwork or paving.

TWE Project No. 16.53.065 6-5 Report No. 12548
Due to the expansive nature of the subgrade soils at this site, special care should be taken not to allow the exposed subgrade soils to become extremely wet or extremely dry of the existing moisture content. Therefore, delays between excavation and fill placement should be avoided. If construction occurs during rainy weather and the exposed subgrade soils are allowed to become wet or saturated, removal and replacement of excessively soft, wet soils or lime-stabilization should be anticipated. The depth of undercutting should be determined in the field by TWE.
It is recommended that a vapor barrier such as polyethylene sheeting be provided beneath the soil supported floor slab. Adequate construction joints and reinforcement should be provided to reduce the potential for cracking of the floor slab due to differential movement and volume change in concrete. Crawl spaces below suspended floor systems should be thoroughly ventilated to reduce potential for moisture to be trapped below floors.

TWE Project No. 16.53.065 7-1 Report No. 12548
7 EARTHWORK CONSIDERATIONS
7.1 Subgrade Preparation and Structural Select Fill
Any subgrade to receive fill soils or pavements should be proof rolled with at least a 20-ton pneumatic roller, loaded dump truck, or equivalent, to detect weak areas. Such weak areas should be removed and replaced with soils exhibiting similar classification, moisture content, and density as the adjacent in-place soils. Subsequent to proof rolling, and just prior to placement of select fill, the exposed subgrade should be compacted to at least 95% of the maximum dry density at a moisture above (0 to +4%) the optimum moisture in accordance with Standard Proctor (ASTM D 698) procedures.
Proper site drainage should be maintained during construction so that ponding of surface runoff does not occur and cause construction delays and/or inhibit site access. Due to the nature of the subgrade, the cohesive soils can become wet and soft. If the subgrade becomes wet and soft, consideration can be given to removal or replacement of the wet material with structural fill material.
The maximum loose thickness for each lift will depend on the type of compaction equipment used. Recommended fill layers are summarized in Table 7-1 below.
Table 7-1: Compaction Equipment and Maximum Lift Thickness
Compaction Equipment Maximum Lift Thickness
Mechanical Hand Tamper 4.0-in
Pneumatic Tired Roller 6.0-in
Tamping Foot Roller 8.0-in
Sheepsfoot Roller 8.0-in
Non-expansive structural fill for this project should consist of a clean low-plasticity sandy clay (CL) or clayey sand (SC) material with a liquid limit of less than 40 and a plasticity index between 8 and 20. The select fill should be placed in thin lifts, not exceeding 8-in loose measure, moisture conditioned to between -2% and +3% of optimum moisture content, and compacted to a minimum 95% of the maximum dry density as determined by ASTM D 698 (Standard Proctor).
Prior to any filling operations, samples of the proposed borrow materials should be obtained for soil classification and laboratory moisture-density testing. The tests will provide a basis for evaluation of fill compaction by in-place density testing. A qualified soil technician should perform sufficient in-place density tests during the earthwork operations to verify that proper levels of compaction are being attained.

TWE Project No. 16.53.065 7-2 Report No. 12548
7.2 Drainage
The performance of the foundation system for the proposed building and site pavement will not only be dependent upon the quality of construction but also upon the stability of the moisture content of the near surface soils. Therefore, we highly recommend that site drainage be developed so that ponding of surface runoff near the building or pavement does not occur. Accumulations of water near the structure foundation or pavement could cause significant moisture variations in the soils adjacent to the foundation and pavement thus increasing the potential for structural distress.
TWE Project No. 16.53.065 8-1 Report No. 12548
8 PAVEMENT DESIGN RECOMMENDATIONS
8.1 New Pavement Sections
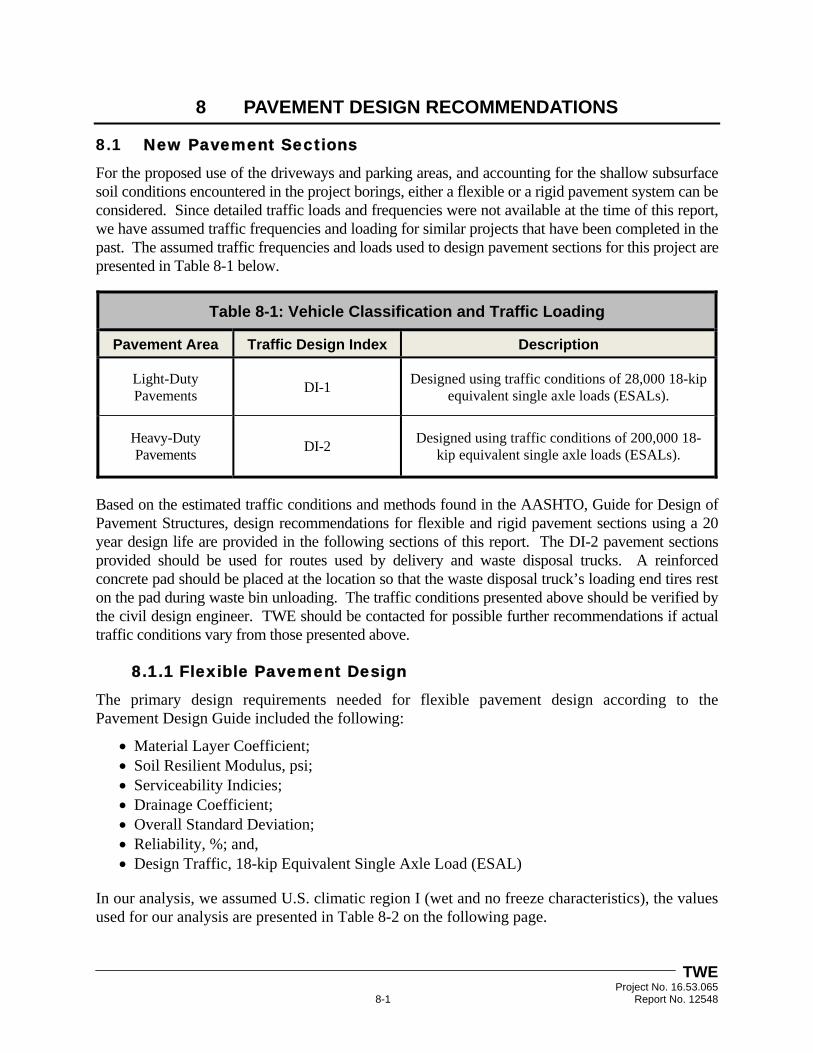
For the proposed use of the driveways and parking areas, and accounting for the shallow subsurface soil conditions encountered in the project borings, either a flexible or a rigid pavement system can be considered. Since detailed traffic loads and frequencies were not available at the time of this report, we have assumed traffic frequencies and loading for similar projects that have been completed in the past. The assumed traffic frequencies and loads used to design pavement sections for this project are presented in Table 8-1 below.
Table 8-1: Vehicle Classification and Traffic Loading
Pavement Area Traffic Design Index Description
Light-Duty Pavements DI-1 Designed using traffic conditions of 28,000 18-kip
equivalent single axle loads (ESALs).
Heavy-Duty Pavements DI-2 Designed using traffic conditions of 200,000 18-
kip equivalent single axle loads (ESALs).
Based on the estimated traffic conditions and methods found in the AASHTO, Guide for Design of Pavement Structures, design recommendations for flexible and rigid pavement sections using a 20 year design life are provided in the following sections of this report. The DI-2 pavement sections provided should be used for routes used by delivery and waste disposal trucks. A reinforced concrete pad should be placed at the location so that the waste disposal truck’s loading end tires rest on the pad during waste bin unloading. The traffic conditions presented above should be verified by the civil design engineer. TWE should be contacted for possible further recommendations if actual traffic conditions vary from those presented above.
8.1.1 Flexible Pavement Design
The primary design requirements needed for flexible pavement design according to the Pavement Design Guide included the following:
Material Layer Coefficient; Soil Resilient Modulus, psi; Serviceability Indicies; Drainage Coefficient; Overall Standard Deviation; Reliability, %; and, Design Traffic, 18-kip Equivalent Single Axle Load (ESAL)
In our analysis, we assumed U.S. climatic region I (wet and no freeze characteristics), the values used for our analysis are presented in Table 8-2 on the following page.
TWE Project No. 16.53.065 8-2 Report No. 12548
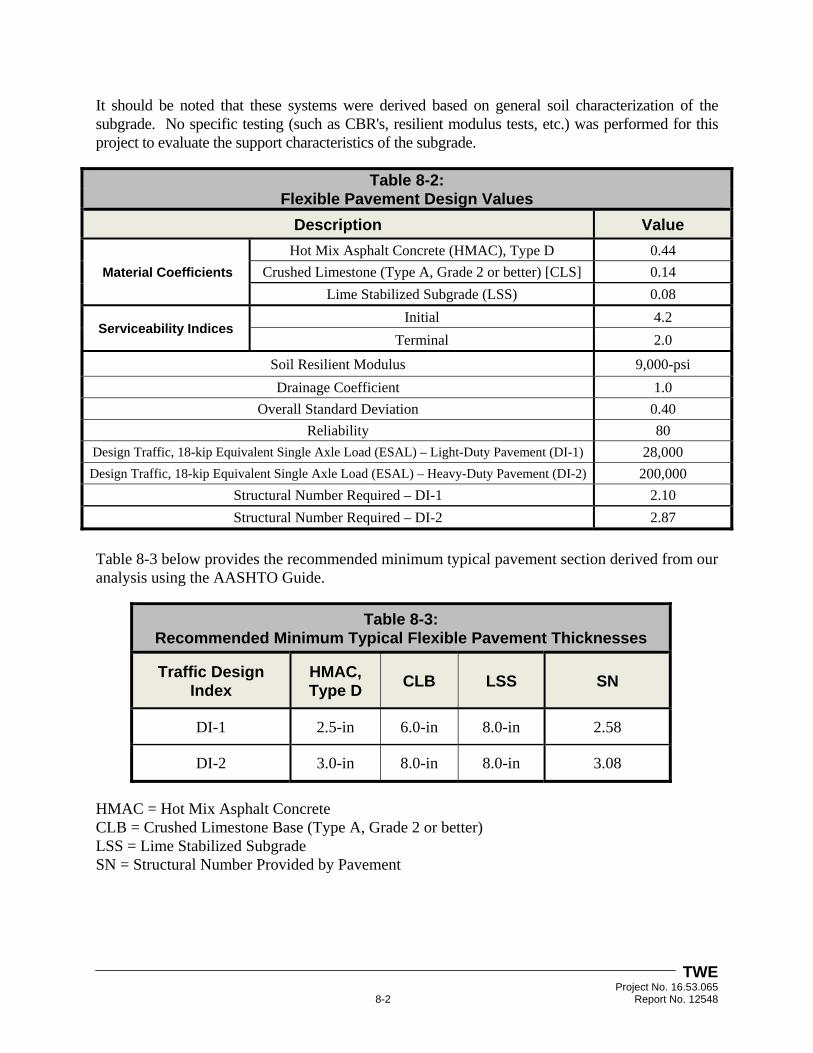
It should be noted that these systems were derived based on general soil characterization of the subgrade. No specific testing (such as CBR's, resilient modulus tests, etc.) was performed for this project to evaluate the support characteristics of the subgrade.
Table 8-2: Flexible Pavement Design Values
Description Value
Material Coefficients
Hot Mix Asphalt Concrete (HMAC), Type D 0.44 Crushed Limestone (Type A, Grade 2 or better) [CLS] 0.14
Lime Stabilized Subgrade (LSS) 0.08
Serviceability Indices Initial 4.2
Terminal 2.0
Soil Resilient Modulus 9,000-psi Drainage Coefficient 1.0
Overall Standard Deviation 0.40 Reliability 80
Design Traffic, 18-kip Equivalent Single Axle Load (ESAL) – Light-Duty Pavement (DI-1) 28,000 Design Traffic, 18-kip Equivalent Single Axle Load (ESAL) – Heavy-Duty Pavement (DI-2) 200,000
Structural Number Required – DI-1 2.10 Structural Number Required – DI-2 2.87
Table 8-3 below provides the recommended minimum typical pavement section derived from our analysis using the AASHTO Guide.
Table 8-3:Recommended Minimum Typical Flexible Pavement Thicknesses
Traffic Design Index
HMAC, Type D CLB LSS SN
DI-1 2.5-in 6.0-in 8.0-in 2.58
DI-2 3.0-in 8.0-in 8.0-in 3.08
HMAC = Hot Mix Asphalt Concrete CLB = Crushed Limestone Base (Type A, Grade 2 or better) LSS = Lime Stabilized Subgrade SN = Structural Number Provided by Pavement
TWE Project No. 16.53.065 8-3 Report No. 12548
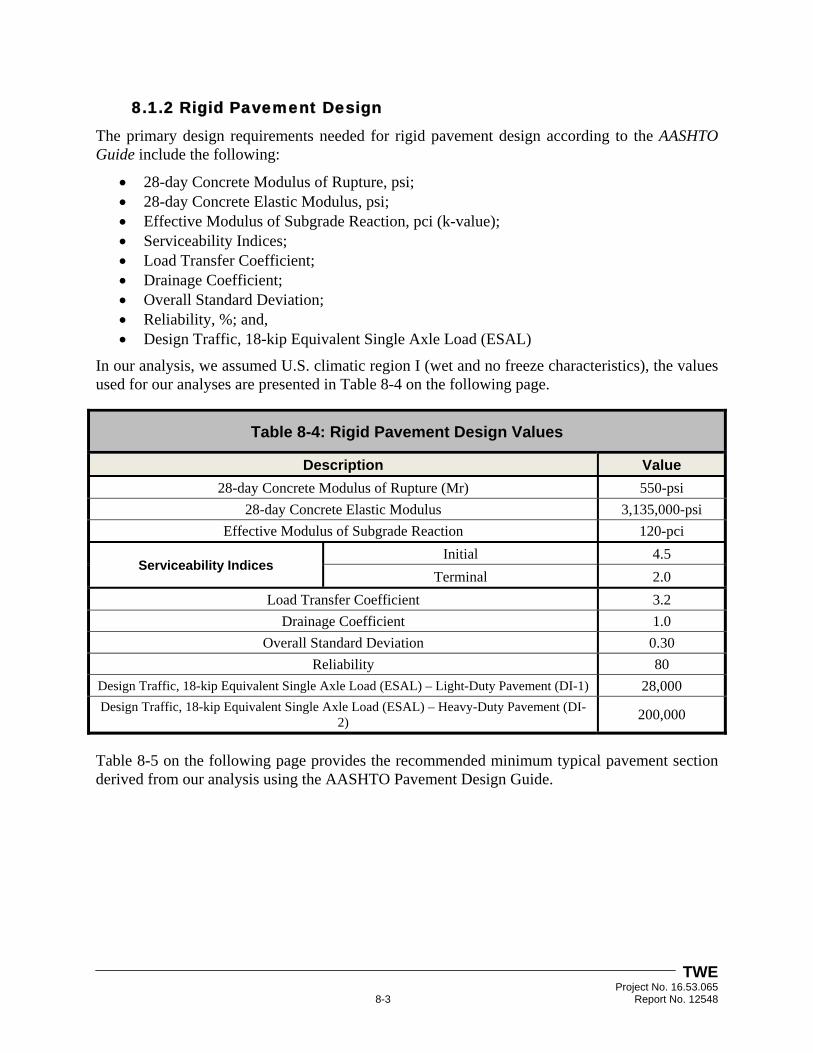
8.1.2 Rigid Pavement Design
The primary design requirements needed for rigid pavement design according to the AASHTO Guide include the following:
28-day Concrete Modulus of Rupture, psi; 28-day Concrete Elastic Modulus, psi; Effective Modulus of Subgrade Reaction, pci (k-value); Serviceability Indices; Load Transfer Coefficient; Drainage Coefficient; Overall Standard Deviation; Reliability, %; and, Design Traffic, 18-kip Equivalent Single Axle Load (ESAL)
In our analysis, we assumed U.S. climatic region I (wet and no freeze characteristics), the values used for our analyses are presented in Table 8-4 on the following page.
Table 8-4: Rigid Pavement Design Values
Description Value 28-day Concrete Modulus of Rupture (Mr) 550-psi
28-day Concrete Elastic Modulus 3,135,000-psi Effective Modulus of Subgrade Reaction 120-pci
Serviceability Indices Initial 4.5
Terminal 2.0 Load Transfer Coefficient 3.2
Drainage Coefficient 1.0 Overall Standard Deviation 0.30
Reliability 80 Design Traffic, 18-kip Equivalent Single Axle Load (ESAL) – Light-Duty Pavement (DI-1) 28,000 Design Traffic, 18-kip Equivalent Single Axle Load (ESAL) – Heavy-Duty Pavement (DI-
2) 200,000
Table 8-5 on the following page provides the recommended minimum typical pavement section derived from our analysis using the AASHTO Pavement Design Guide.

TWE Project No. 16.53.065 8-4 Report No. 12548
Table 8-5: Recommended Minimum Typical Rigid Pavement Thicknesses
Traffic Design Index RC LSS
DI-1 5.0-in 8.0-in
DI-2 7.0-in 8.0-in
RC = Reinforced Portland Cement Concrete LSS = Lime Stabilized Subgrade
Reinforcing steel consisting of deformed steel rebar should be used in concrete pavement. Thickness is based on concrete flexural strength, soil modulus and traffic volume. Selection of steel is dependent on joint spacing, slab thickness and other factors as discussed in Portland Cement Association publications. The following suggested guidelines for the concrete pavement should be modified by the civil-structural engineer based upon the actual configuration of the pavement layout and published Portland Cement Association and ACI articles. Table 8-6 below presents these guidelines.
Table 8-6: Rigid Pavement Components
Component Description
Minimum Reinforcing Steel #3 bars should be spaced at 18-in on centers in both directions.
Minimum Dowel Size 3/4-in bars, 18-in in length, with one (1) end treated to slip should be spaced at 12-in on centers at each joint.
Control Joint Spacing
Maximum control joint spacing should be 15-ft. If sawcut, control joints should be cut as soon as the concrete has hardened sufficiently to permit sawing without excessive raveling which is usually within four (4) to twenty-four (24) hours of concrete placement.
Isolation / Expansion Joints Expansion joints should be used in areas adjacent to structures, such as manholes and walls.

TWE Project No. 16.53.065 8-5 Report No. 12548
8.2 Pavement Section Materials
Hot Mix Asphalt Concrete (HMAC), Type D
HMAC should conform to Item 340, “Dense-Graded Hot-Mix Asphalt” of the Texas Department of Transportation (TxDOT) 2004 Standard Specifications for Construction and Maintenance of Highways, Streets and Bridges. The HMAC should provide a minimum tensile strength (dry) of 85 to 200 psi when tested in accordance with TxDOT Test Method Tex-226-F, and should be compacted at 96% of the theoretical density as determined from the asphaltic mixture design prepared in accordance with TxDOT Test Method Tex-207-F “Determining Density of Compacted Bituminous Mixtures”.
Crushed Limestone Base (CLB)
CLB should conform to TxDOT, Item No. 247 “Flexible Base”, Type A, Grade 2 or better and should be compacted to 100% of the maximum dry density determined by TxDOT Test Method Tex-113-E within ±2% of the optimum moisture content.
Reinforced Concrete (RC)
RC should be provided in accordance with TxDOT Item 421 “Hydraulic Cement Concrete”, 2004. Concrete should be designed to meet a minimum average flexural strength (modulus of rupture) of at least 620-psi at 28-days or a minimum average compressive strength of 4,500-psi at 28-days. Reinforcing steel consisting of deformed steel rebar should be used in accordance with TxDOT Item 440 “Reinforcing Steel.”
The first few loads of concrete should be checked for slump, air and temperature on start-up production days to check for concrete conformance and consistency. Concrete should be sampled and strength test specimens [two (2) specimens per test] prepared on the initial day of production and for each 400-yd2 or fraction thereof of concrete pavement thereafter. At least one (1) set of strength test specimens should be prepared for each production day. Slump, air and temperature tests should be performed each time strength test specimens are made. Concrete temperature should also be monitored to ensure that concrete is consistently within the temperature requirements.
Lime Stabilized Subgrade
Lime stabilization of the subgrade soils is recommended for the pavement sections included in Tables 8-3 and 8-5 above. Proper preparation and lime stabilization of the pavement subgrade will improve long-term pavement performance by reducing plasticity of the clay soils, increasing their load carrying capacity, and improving their workability.
After completion of necessary stripping and clearing, the exposed soil subgrade should be carefully evaluated by probing and testing. Any unsuitable material (shell, gravel, organic material, wet, soft or loose soil) still in place should be removed. The exposed soil subgrade should be further evaluated by proofrolling with a heavy pneumatic tired roller, loaded dump truck or similar equipment weighing at least 20-tons to ensure that soft or loose material does not exist beneath the exposed soils. Proofrolling procedures should be observed routinely by a qualified representative of TWE. Any undesirable material revealed should be removed and replaced in a controlled manner with soils similar in classification or select fill.

TWE Project No. 16.53.065 8-6 Report No. 12548
Once final subgrade elevation is achieved and prior to placement of reinforced concrete wearing surface or crushed limestone base material, the exposed surface of the pavement subgrade soil should be scarified to a depth of 8-in and mixed with hydrated lime in conformance with TxDOT Item 260 “Lime Treatment (Road-Mixed)”. It is estimated that 5% hydrated lime by dry unit weight of soil will be required. Assuming an in-place unit weight of 120-pcf for the roadway subgrade soils, 6% lime by dry unit weight equates to about 43-lbs of lime per square yard of treated subgrade. The actual quantity of lime required should be determined after the pavement area is stripped and subgrade soils are exposed by use of a laboratory soil treatability study. Lime used during chemical stabilization should be Type A hydrated lime or Type B commercial slurry. The lime stabilized subgrade should be compacted to a minimum 95% of the maximum dry density as determined by ASTM D 698 at a moisture content within the range of 4% above optimum.
Lime stabilization should extend at least 1-ft beyond the pavement edge to reduce effects of seasonal shrinking and swelling. In areas where hydrated lime is used for stabilization, routine sampling and Atterberg limit tests should be performed to verify the resulting plasticity index of the stabilized mixture is at/or below 20.
Mechanical lime stabilization of the pavement subgrade will not prevent normal seasonal movement of the underlying untreated materials. Therefore, good perimeter surface drainage with a minimum 2% slope away from the pavement is recommended.
8.3 Pavement Drainage and Maintenance
Providing drainage away from the pavement and maintaining the pavement to prevent infiltration of water into the subgrade soils is essential. Water ponding adjacent to the pavement will infiltrate the base material and/or subgrade and result in high maintenance costs and premature pavement failure and, therefore, should be avoided. Periodic maintenance should be performed on the pavement sections to seal any surface cracks and prevent infiltration of water into the subgrade.
TWE Project No. 16.53.065 9-1 Report No. 12548
9 LIMITATIONS AND DESIGN REVIEW
9.1 Limitations
This report has been prepared for the exclusive use of John Mahoney Architect and the project team for specific application to the design and construction of the for the proposed new North Corpus Christi Honda in Corpus Christi, Texas. Our report has been prepared in accordance with the generally accepted geotechnical engineering practice common to the local area. No other warranty, express or implied, is made.
The analyses and recommendations contained in this report are based on the data obtained from the referenced subsurface explorations within the project site. The soil borings indicate subsurface conditions only at the specific location, time and depth penetrated. The soil borings do not necessarily reflect strata variations that could exist at other locations within the project site. The validity of our recommendations is based in part on assumptions about the stratigraphy made by the Geotechnical Engineer. Such assumptions may be confirmed only during construction and installation of the project structures. Our recommendations presented in this report must be reevaluated if subsurface conditions during the construction phase are different from those described in this report.
If any changes in the nature, design or location of the project are planned, the conclusions and recommendations contained in this report should not be considered valid unless the changes are reviewed and the conclusions modified or verified in writing by TWE. TWE is not responsible for any claims, damages or liability associated with interpretation or reuse of the subsurface data or engineering analyses without the expressed written authorization of TWE.
9.2 Design Review
Review of the design and construction drawings as well as the specifications should be performed by TWE before release. The review is aimed at determining if the geotechnical design and construction recommendations contained in this report have been properly interpreted. Design review is not within the authorized scope of work for this study.
9.3 Construction Monitoring
Construction surveillance is recommended and has been assumed in preparing our recommendations. These field services are required to check for changes in conditions that may result in modifications to our recommendations. The quality of the construction practices will affect foundation performance and should be monitored. TWE would be pleased to provide construction monitoring, testing and inspection services for the project.
9.4 Closing Remarks
We appreciate the opportunity to be of service during this phase of the project and we look forward to continuing our services during the construction phase and on future projects.
TWE Project No. 16.53.065 Report No. 12548
APPENDIX A
SOIL BORING LOCATION PLAN TWE DRAWING NO. 16.53.065-1
Sheet: 1
File: C:\Users\ecrochet\Desktop\Desktop_Folder\CAD\CAD\XREF\TWE_Logo.pdf
Missing or invalid reference
COPYRIGHT © 2015 GOOGLE EARTH. ALL RIGHTS RESERVED.
COPYRIGHT © 2015 GOOGLE MAP. ALL RIGHTS RESERVED.
B-5
B-4
B-3
B-1
B-8
B-7
B-6
B-2
John Mahoney Architect. Drawing #1608
AutoCAD SHX Text
Drawn
AutoCAD SHX Text
Scale
AutoCAD SHX Text
Checked
AutoCAD SHX Text
Approved
AutoCAD SHX Text
BORING
AutoCAD SHX Text
LONGITUDE
AutoCAD SHX Text
LATITUDE
AutoCAD SHX Text
DEPTH
AutoCAD SHX Text
LEGEND
AutoCAD SHX Text
SOIL BORING COORDINATES
AutoCAD SHX Text
SYMBOL
AutoCAD SHX Text
DESCRIPTION
AutoCAD SHX Text
TWE DRAWING NO.
AutoCAD SHX Text
VICINITY MAP
AutoCAD SHX Text
R.S.
AutoCAD SHX Text
09/16/2016
AutoCAD SHX Text
R.A.S.
AutoCAD SHX Text
10/24/2016
AutoCAD SHX Text
D.R.R.
AutoCAD SHX Text
10/24/2016
AutoCAD SHX Text
N.T.S.
AutoCAD SHX Text
16.53.065-1
AutoCAD SHX Text
B-1
AutoCAD SHX Text
25'
AutoCAD SHX Text
N 27° 50' 45.4"
AutoCAD SHX Text
W 97° 37' 48.9"
AutoCAD SHX Text
B-2
AutoCAD SHX Text
25'
AutoCAD SHX Text
N 27° 50' 47.0"
AutoCAD SHX Text
W 97° 37' 49.8"
AutoCAD SHX Text
B-3
AutoCAD SHX Text
25'
AutoCAD SHX Text
N 27° 50' 45.6"
AutoCAD SHX Text
W 97° 37' 51.3"
AutoCAD SHX Text
B-4
AutoCAD SHX Text
6'
AutoCAD SHX Text
N 27° 50' 46.3"
AutoCAD SHX Text
W 97° 37' 52.3"
AutoCAD SHX Text
B-5
AutoCAD SHX Text
6'
AutoCAD SHX Text
N 27° 50' 48.5"
AutoCAD SHX Text
W 97° 37' 52.1"
AutoCAD SHX Text
B-6
AutoCAD SHX Text
6'
AutoCAD SHX Text
N 27° 50' 48.2"
AutoCAD SHX Text
W 97° 37' 50.0"
AutoCAD SHX Text
B-7
AutoCAD SHX Text
6'
AutoCAD SHX Text
N 27° 50' 48.0"
AutoCAD SHX Text
W 97° 37' 48.0"
AutoCAD SHX Text
B-8
AutoCAD SHX Text
6'
AutoCAD SHX Text
N 27° 50' 46.3"
AutoCAD SHX Text
W 97° 37' 48.3"
AutoCAD SHX Text
Boring Location Plan North Corpus Christi Honda Corpus Christi, Texas
AutoCAD SHX Text
SOIL BORING LOCATION
AutoCAD SHX Text
PROJECT LOCATION

TWE Project No. 16.53.065 Report No. 12548
APPENDIX B
LOGS OF PROJECT BORINGS AND A KEY TO TERMS AND SYMBOLS USED ON BORING LOGS
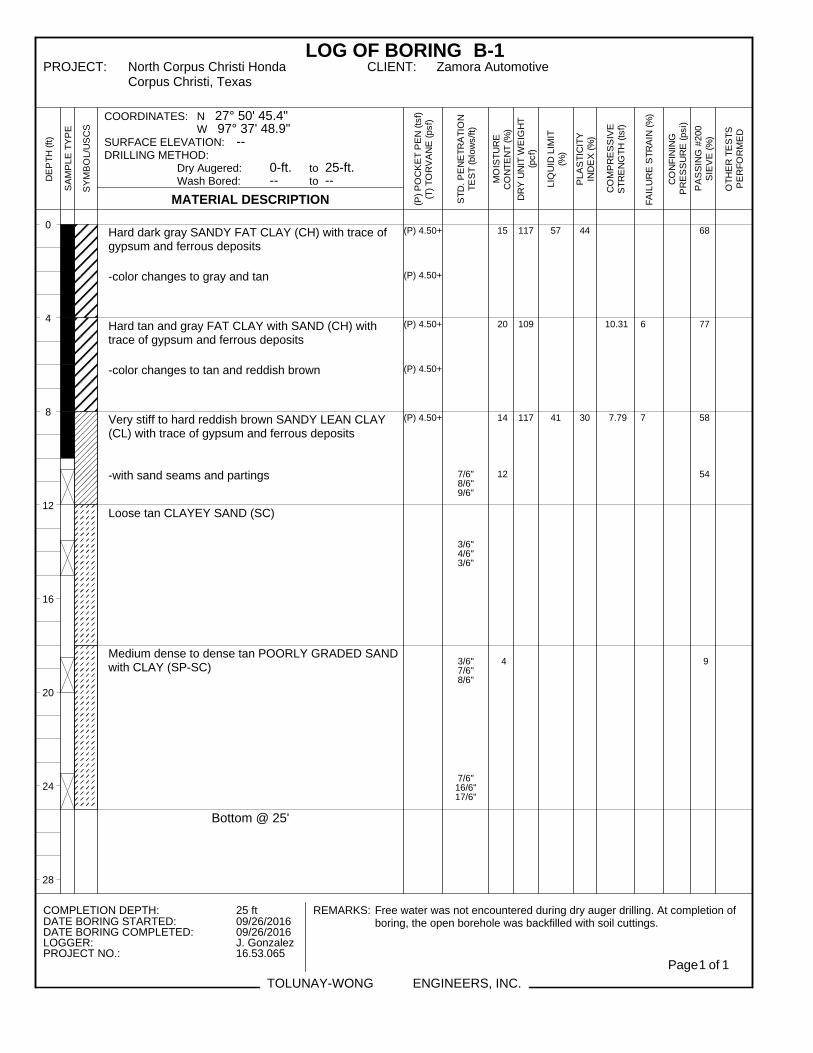
0
4
8
12
16
20
24
28
Hard dark gray SANDY FAT CLAY (CH) with trace ofgypsum and ferrous deposits
-color changes to gray and tan
Hard tan and gray FAT CLAY with SAND (CH) withtrace of gypsum and ferrous deposits
-color changes to tan and reddish brown
Very stiff to hard reddish brown SANDY LEAN CLAY(CL) with trace of gypsum and ferrous deposits
-with sand seams and partings
Loose tan CLAYEY SAND (SC)
Medium dense to dense tan POORLY GRADED SANDwith CLAY (SP-SC)
Bottom @ 25'
(P) 4.50+
(P) 4.50+
(P) 4.50+
(P) 4.50+
(P) 4.50+
7/6"8/6"9/6"
3/6"4/6"3/6"
3/6"7/6"8/6"
7/6"16/6"17/6"
15
20
14
12
4
117
109
117
57
41
44
30
10.31
7.79
6
7
68
77
58
54
9
TOLUNAY-WONG ENGINEERS, INC.
LOG OF BORING B-1PROJECT: North Corpus Christi Honda
Corpus Christi, TexasCLIENT: Zamora Automotive
COMPLETION DEPTH: 25 ft REMARKS: Free water was not encountered during dry auger drilling. At completion ofboring, the open borehole was backfilled with soil cuttings.DATE BORING STARTED: 09/26/2016
DATE BORING COMPLETED: 09/26/2016LOGGER: J. GonzalezPROJECT NO.: 16.53.065
Page of1
DE
PT
H (
ft)
SA
MP
LE
TY
PE
SY
MB
OL/U
SC
S
MATERIAL DESCRIPTION
COORDINATES: N 27° 50' 45.4"W 97° 37' 48.9"
SURFACE ELEVATION: --DRILLING METHOD:
Dry Augered: 0-ft. to 25-ft.Wash Bored: -- to --
(P)
PO
CK
ET
PE
N (
tsf)
(T)
TO
RV
AN
E (
psf)
ST
D. P
EN
ET
RA
TIO
NT
ES
T (
blo
ws/ft)
MO
IST
UR
EC
ON
TE
NT
(%
)
DR
Y U
NIT
WE
IGH
T(p
cf)
LIQ
UID
LIM
IT(%
)
PLA
ST
ICIT
YIN
DE
X (
%)
CO
MP
RE
SS
IVE
ST
RE
NG
TH
(ts
f)
FA
ILU
RE
ST
RA
IN (
%)
CO
NF
ININ
GP
RE
SS
UR
E (
psi)
PA
SS
ING
#200
SIE
VE
(%
)
OT
HE
R T
ES
TS
PE
RF
OR
ME
D
1

0
4
8
12
16
20
24
28
Hard dark gray SANDY FAT CLAY (CH) with trace ofgypsum and ferrous deposits
-color changes to dark gray and gray
Hard tan and gray FAT CLAY with SAND (CH) withtrace of gypsum and ferrous deposits
-with calcareous nodules
Very stiff to hard tan and reddish brown SANDY LEANCLAY (CL) with trace of gypsum and ferrous deposits
-color changes to reddish brown
Medium dense to dense reddish brown CLAYEY SAND(SC) with ferrous deposits
-color changes to tan
Bottom @ 25'
(P) 4.50+
(P) 4.50+
(P) 4.50+
(P) 4.50+
(P) 4.50+
5/6"7/6"9/6"
6/6"9/6"10/6"
3/6"6/6"7/6"
8/6"18/6"18/6"
15
20
14
12
7
112
108
63
38
48
24
8.46 8
64
73
52
42
23
TOLUNAY-WONG ENGINEERS, INC.
LOG OF BORING B-2PROJECT: North Corpus Christi Honda
Corpus Christi, TexasCLIENT: Zamora Automotive
COMPLETION DEPTH: 25 ft REMARKS: Free water was not encountered during dry auger drilling. At completion ofboring, the open borehole was backfilled with soil cuttings.DATE BORING STARTED: 09/26/2016
DATE BORING COMPLETED: 09/26/2016LOGGER: J. GonzalezPROJECT NO.: 16.53.065
Page of1
DE
PT
H (
ft)
SA
MP
LE
TY
PE
SY
MB
OL/U
SC
S
MATERIAL DESCRIPTION
COORDINATES: N 27° 50' 47.0"W 97° 37' 49.8"
SURFACE ELEVATION: --DRILLING METHOD:
Dry Augered: 0-ft. to 25-ft.Wash Bored: -- to --
(P)
PO
CK
ET
PE
N (
tsf)
(T)
TO
RV
AN
E (
psf)
ST
D. P
EN
ET
RA
TIO
NT
ES
T (
blo
ws/ft)
MO
IST
UR
EC
ON
TE
NT
(%
)
DR
Y U
NIT
WE
IGH
T(p
cf)
LIQ
UID
LIM
IT(%
)
PLA
ST
ICIT
YIN
DE
X (
%)
CO
MP
RE
SS
IVE
ST
RE
NG
TH
(ts
f)
FA
ILU
RE
ST
RA
IN (
%)
CO
NF
ININ
GP
RE
SS
UR
E (
psi)
PA
SS
ING
#200
SIE
VE
(%
)
OT
HE
R T
ES
TS
PE
RF
OR
ME
D
1
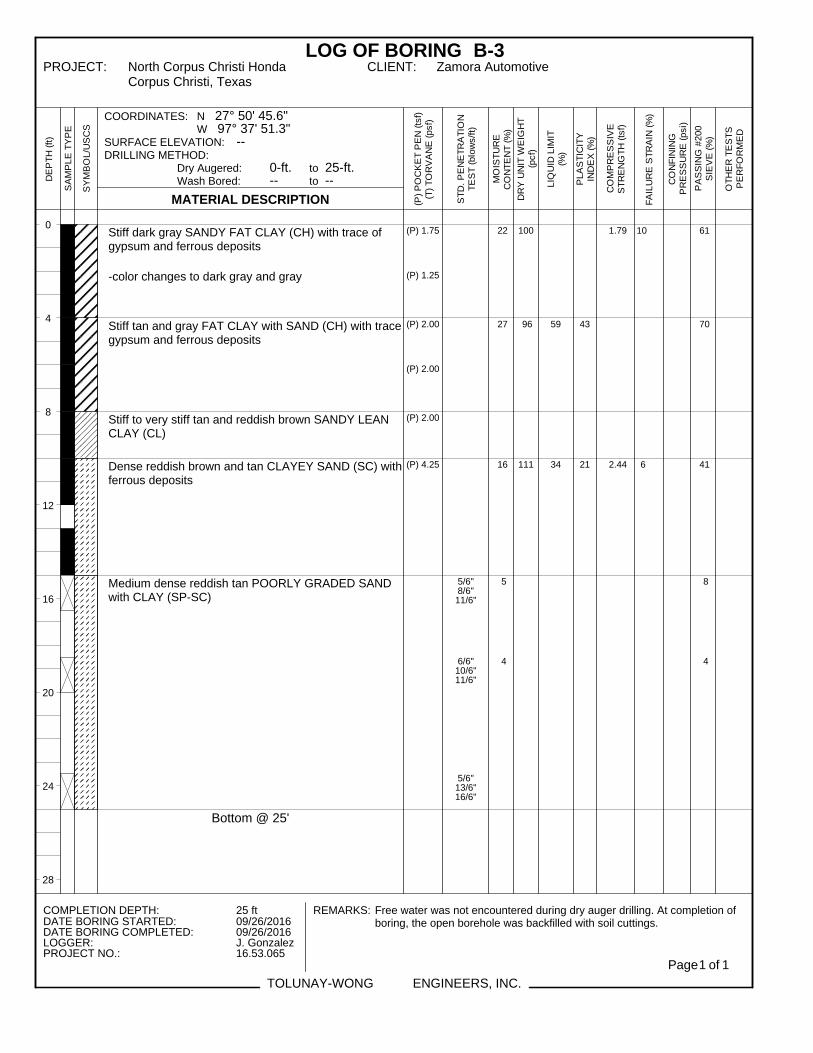
0
4
8
12
16
20
24
28
Stiff dark gray SANDY FAT CLAY (CH) with trace ofgypsum and ferrous deposits
-color changes to dark gray and gray
Stiff tan and gray FAT CLAY with SAND (CH) with tracegypsum and ferrous deposits
Stiff to very stiff tan and reddish brown SANDY LEANCLAY (CL)
Dense reddish brown and tan CLAYEY SAND (SC) withferrous deposits
Medium dense reddish tan POORLY GRADED SANDwith CLAY (SP-SC)
Bottom @ 25'
(P) 1.75
(P) 1.25
(P) 2.00
(P) 2.00
(P) 2.00
(P) 4.25
5/6"8/6"11/6"
6/6"10/6"11/6"
5/6"13/6"16/6"
22
27
16
5
4
100
96
111
59
34
43
21
1.79
2.44
10
6
61
70
41
8
4
TOLUNAY-WONG ENGINEERS, INC.
LOG OF BORING B-3PROJECT: North Corpus Christi Honda
Corpus Christi, TexasCLIENT: Zamora Automotive
COMPLETION DEPTH: 25 ft REMARKS: Free water was not encountered during dry auger drilling. At completion ofboring, the open borehole was backfilled with soil cuttings.DATE BORING STARTED: 09/26/2016
DATE BORING COMPLETED: 09/26/2016LOGGER: J. GonzalezPROJECT NO.: 16.53.065
Page of1
DE
PT
H (
ft)
SA
MP
LE
TY
PE
SY
MB
OL/U
SC
S
MATERIAL DESCRIPTION
COORDINATES: N 27° 50' 45.6"W 97° 37' 51.3"
SURFACE ELEVATION: --DRILLING METHOD:
Dry Augered: 0-ft. to 25-ft.Wash Bored: -- to --
(P)
PO
CK
ET
PE
N (
tsf)
(T)
TO
RV
AN
E (
psf)
ST
D. P
EN
ET
RA
TIO
NT
ES
T (
blo
ws/ft)
MO
IST
UR
EC
ON
TE
NT
(%
)
DR
Y U
NIT
WE
IGH
T(p
cf)
LIQ
UID
LIM
IT(%
)
PLA
ST
ICIT
YIN
DE
X (
%)
CO
MP
RE
SS
IVE
ST
RE
NG
TH
(ts
f)
FA
ILU
RE
ST
RA
IN (
%)
CO
NF
ININ
GP
RE
SS
UR
E (
psi)
PA
SS
ING
#200
SIE
VE
(%
)
OT
HE
R T
ES
TS
PE
RF
OR
ME
D
1

0
4
8
12
16
20
24
28
Hard dark gray and tan LEAN CLAY (CL) [Possible Fill]
Hard dark gray SANDY FAT CLAY (CH) with ferrousdeposits
-with trace of gypsum and color changes to tan andgray
Bottom @ 6.75'
(P) 4.50
(P) 3.50
(P) 3.25
22
24
97
100
44 31
4.30 5
60
TOLUNAY-WONG ENGINEERS, INC.
LOG OF BORING B-4PROJECT: North Corpus Christi Honda
Corpus Christi, TexasCLIENT: Zamora Automotive
COMPLETION DEPTH: 6.75 ft REMARKS: 2" of asphalt and 7" of base material encountered at surface of boringlocation. Free water was not encountered during dry auger drilling. Atcompletion of boring, the open borehole was backfilled with soil cuttings.
DATE BORING STARTED: 09/26/2016DATE BORING COMPLETED: 09/26/2016LOGGER: J. GonzalezPROJECT NO.: 16.53.065
Page of1
DE
PT
H (
ft)
SA
MP
LE
TY
PE
SY
MB
OL/U
SC
S
MATERIAL DESCRIPTION
COORDINATES: N 27° 50' 46.3"W 97° 37' 52.3"
SURFACE ELEVATION: --DRILLING METHOD:
Dry Augered: 0-ft. to 6-ft.Wash Bored: -- to --
(P)
PO
CK
ET
PE
N (
tsf)
(T)
TO
RV
AN
E (
psf)
ST
D. P
EN
ET
RA
TIO
NT
ES
T (
blo
ws/ft)
MO
IST
UR
EC
ON
TE
NT
(%
)
DR
Y U
NIT
WE
IGH
T(p
cf)
LIQ
UID
LIM
IT(%
)
PLA
ST
ICIT
YIN
DE
X (
%)
CO
MP
RE
SS
IVE
ST
RE
NG
TH
(ts
f)
FA
ILU
RE
ST
RA
IN (
%)
CO
NF
ININ
GP
RE
SS
UR
E (
psi)
PA
SS
ING
#200
SIE
VE
(%
)
OT
HE
R T
ES
TS
PE
RF
OR
ME
D
1
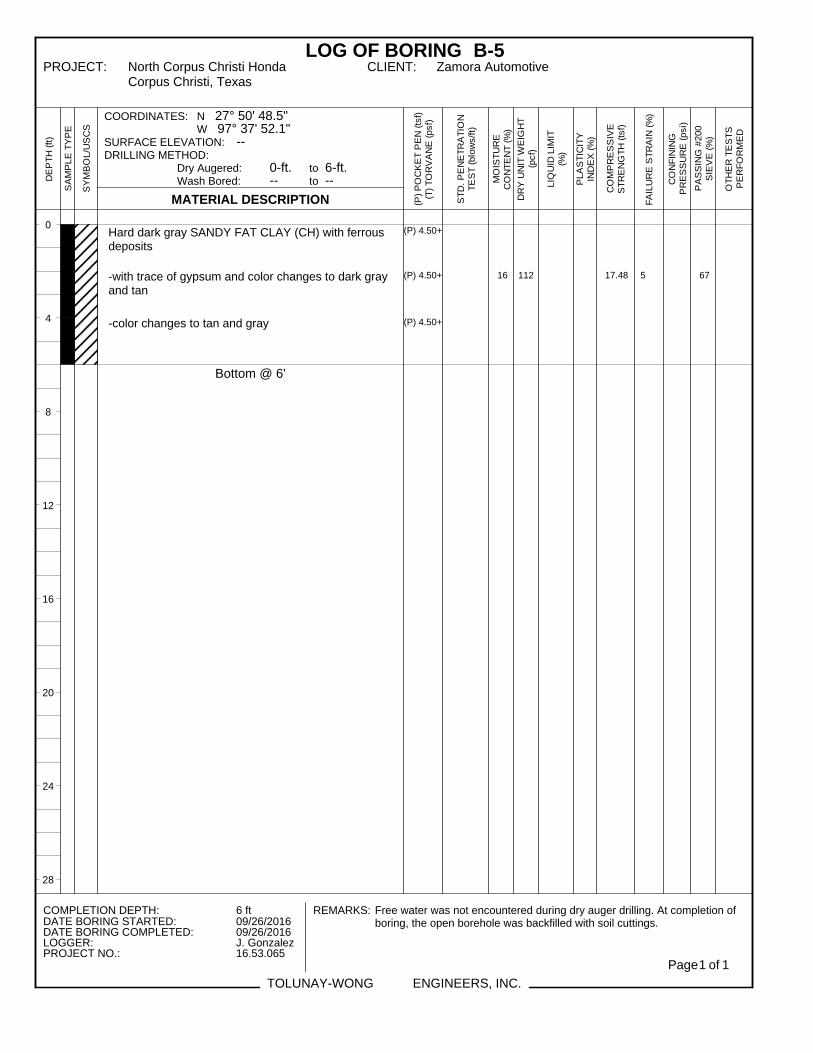
0
4
8
12
16
20
24
28
Hard dark gray SANDY FAT CLAY (CH) with ferrousdeposits
-with trace of gypsum and color changes to dark grayand tan
-color changes to tan and gray
Bottom @ 6'
(P) 4.50+
(P) 4.50+
(P) 4.50+
16 112 17.48 5 67
TOLUNAY-WONG ENGINEERS, INC.
LOG OF BORING B-5PROJECT: North Corpus Christi Honda
Corpus Christi, TexasCLIENT: Zamora Automotive
COMPLETION DEPTH: 6 ft REMARKS: Free water was not encountered during dry auger drilling. At completion ofboring, the open borehole was backfilled with soil cuttings.DATE BORING STARTED: 09/26/2016
DATE BORING COMPLETED: 09/26/2016LOGGER: J. GonzalezPROJECT NO.: 16.53.065
Page of1
DE
PT
H (
ft)
SA
MP
LE
TY
PE
SY
MB
OL/U
SC
S
MATERIAL DESCRIPTION
COORDINATES: N 27° 50' 48.5"W 97° 37' 52.1"
SURFACE ELEVATION: --DRILLING METHOD:
Dry Augered: 0-ft. to 6-ft.Wash Bored: -- to --
(P)
PO
CK
ET
PE
N (
tsf)
(T)
TO
RV
AN
E (
psf)
ST
D. P
EN
ET
RA
TIO
NT
ES
T (
blo
ws/ft)
MO
IST
UR
EC
ON
TE
NT
(%
)
DR
Y U
NIT
WE
IGH
T(p
cf)
LIQ
UID
LIM
IT(%
)
PLA
ST
ICIT
YIN
DE
X (
%)
CO
MP
RE
SS
IVE
ST
RE
NG
TH
(ts
f)
FA
ILU
RE
ST
RA
IN (
%)
CO
NF
ININ
GP
RE
SS
UR
E (
psi)
PA
SS
ING
#200
SIE
VE
(%
)
OT
HE
R T
ES
TS
PE
RF
OR
ME
D
1
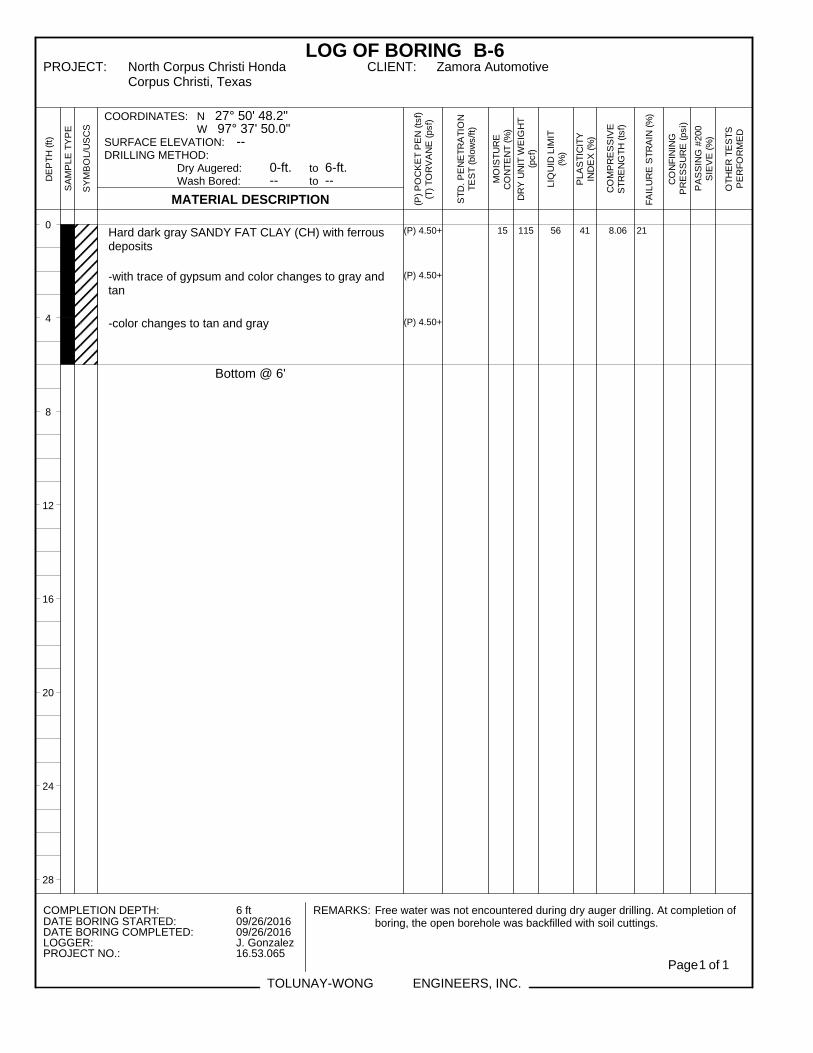
0
4
8
12
16
20
24
28
Hard dark gray SANDY FAT CLAY (CH) with ferrousdeposits
-with trace of gypsum and color changes to gray andtan
-color changes to tan and gray
Bottom @ 6'
(P) 4.50+
(P) 4.50+
(P) 4.50+
15 115 56 41 8.06 21
TOLUNAY-WONG ENGINEERS, INC.
LOG OF BORING B-6PROJECT: North Corpus Christi Honda
Corpus Christi, TexasCLIENT: Zamora Automotive
COMPLETION DEPTH: 6 ft REMARKS: Free water was not encountered during dry auger drilling. At completion ofboring, the open borehole was backfilled with soil cuttings.DATE BORING STARTED: 09/26/2016
DATE BORING COMPLETED: 09/26/2016LOGGER: J. GonzalezPROJECT NO.: 16.53.065
Page of1
DE
PT
H (
ft)
SA
MP
LE
TY
PE
SY
MB
OL/U
SC
S
MATERIAL DESCRIPTION
COORDINATES: N 27° 50' 48.2"W 97° 37' 50.0"
SURFACE ELEVATION: --DRILLING METHOD:
Dry Augered: 0-ft. to 6-ft.Wash Bored: -- to --
(P)
PO
CK
ET
PE
N (
tsf)
(T)
TO
RV
AN
E (
psf)
ST
D. P
EN
ET
RA
TIO
NT
ES
T (
blo
ws/ft)
MO
IST
UR
EC
ON
TE
NT
(%
)
DR
Y U
NIT
WE
IGH
T(p
cf)
LIQ
UID
LIM
IT(%
)
PLA
ST
ICIT
YIN
DE
X (
%)
CO
MP
RE
SS
IVE
ST
RE
NG
TH
(ts
f)
FA
ILU
RE
ST
RA
IN (
%)
CO
NF
ININ
GP
RE
SS
UR
E (
psi)
PA
SS
ING
#200
SIE
VE
(%
)
OT
HE
R T
ES
TS
PE
RF
OR
ME
D
1
0
4
8
12
16
20
24
28
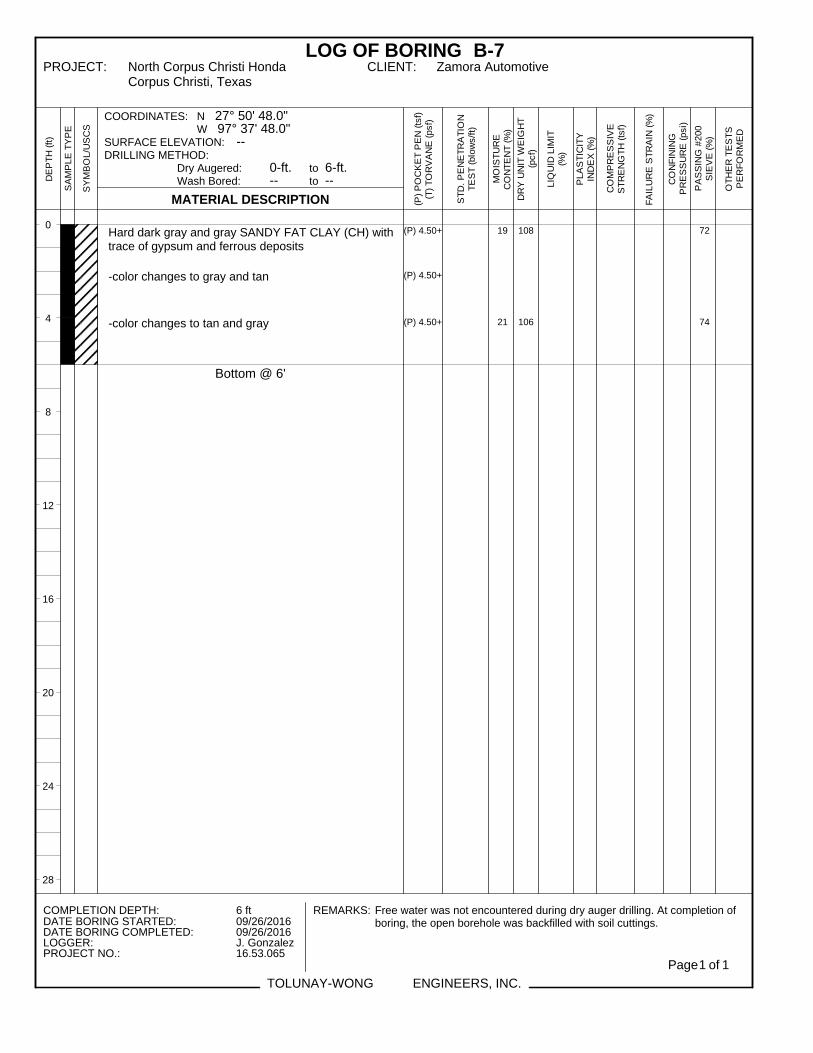
Hard dark gray and gray SANDY FAT CLAY (CH) withtrace of gypsum and ferrous deposits
-color changes to gray and tan
-color changes to tan and gray
Bottom @ 6'
(P) 4.50+
(P) 4.50+
(P) 4.50+
19
21
108
106
72
74
TOLUNAY-WONG ENGINEERS, INC.
LOG OF BORING B-7PROJECT: North Corpus Christi Honda
Corpus Christi, TexasCLIENT: Zamora Automotive
COMPLETION DEPTH: 6 ft REMARKS: Free water was not encountered during dry auger drilling. At completion ofboring, the open borehole was backfilled with soil cuttings.DATE BORING STARTED: 09/26/2016
DATE BORING COMPLETED: 09/26/2016LOGGER: J. GonzalezPROJECT NO.: 16.53.065
Page of1
DE
PT
H (
ft)
SA
MP
LE
TY
PE
SY
MB
OL/U
SC
S
MATERIAL DESCRIPTION
COORDINATES: N 27° 50' 48.0"W 97° 37' 48.0"
SURFACE ELEVATION: --DRILLING METHOD:
Dry Augered: 0-ft. to 6-ft.Wash Bored: -- to --
(P)
PO
CK
ET
PE
N (
tsf)
(T)
TO
RV
AN
E (
psf)
ST
D. P
EN
ET
RA
TIO
NT
ES
T (
blo
ws/ft)
MO
IST
UR
EC
ON
TE
NT
(%
)
DR
Y U
NIT
WE
IGH
T(p
cf)
LIQ
UID
LIM
IT(%
)
PLA
ST
ICIT
YIN
DE
X (
%)
CO
MP
RE
SS
IVE
ST
RE
NG
TH
(ts
f)
FA
ILU
RE
ST
RA
IN (
%)
CO
NF
ININ
GP
RE
SS
UR
E (
psi)
PA
SS
ING
#200
SIE
VE
(%
)
OT
HE
R T
ES
TS
PE
RF
OR
ME
D
1

0
4
8
12
16
20
24
28
Hard dark gray SANDY FAT CLAY (CH) with ferrousdeposits
-with trace of gypsum and color changes to gray andtan
-color changes to tan and gray
Bottom @ 6'
(P) 4.50+
(P) 4.50+
(P) 4.50+
19 103 79 61 11.55 3 75
TOLUNAY-WONG ENGINEERS, INC.
LOG OF BORING B-8PROJECT: North Corpus Christi Honda
Corpus Christi, TexasCLIENT: Zamora Automotive
COMPLETION DEPTH: 6 ft REMARKS: Free water was not encountered during dry auger drilling. At completion ofboring, the open borehole was backfilled with soil cuttings.DATE BORING STARTED: 09/26/2016
DATE BORING COMPLETED: 09/26/2016LOGGER: J. GonzalezPROJECT NO.: 16.53.065
Page of1
DE
PT
H (
ft)
SA
MP
LE
TY
PE
SY
MB
OL/U
SC
S
MATERIAL DESCRIPTION
COORDINATES: N 27° 50' 46.3"W 97° 37' 48.3"
SURFACE ELEVATION: --DRILLING METHOD:
Dry Augered: 0-ft. to 6-ft.Wash Bored: -- to --
(P)
PO
CK
ET
PE
N (
tsf)
(T)
TO
RV
AN
E (
psf)
ST
D. P
EN
ET
RA
TIO
NT
ES
T (
blo
ws/ft)
MO
IST
UR
EC
ON
TE
NT
(%
)
DR
Y U
NIT
WE
IGH
T(p
cf)
LIQ
UID
LIM
IT(%
)
PLA
ST
ICIT
YIN
DE
X (
%)
CO
MP
RE
SS
IVE
ST
RE
NG
TH
(ts
f)
FA
ILU
RE
ST
RA
IN (
%)
CO
NF
ININ
GP
RE
SS
UR
E (
psi)
PA
SS
ING
#200
SIE
VE
(%
)
OT
HE
R T
ES
TS
PE
RF
OR
ME
D
1