Content Marketing ROI: What's Your Content Formula?
102
MARKETING INSIDER GROUP The Content Formula Calculate the ROI of Content Marketing & Never Waste Money Again Michael Brenner CEO, Marketing Insider Group @BrennerMichael Liz Bedor Brand Strategist, NewsCred @lizbedor
-
Upload
michael-brenner -
Category
Marketing
-
view
54.985 -
download
0
Transcript of Content Marketing ROI: What's Your Content Formula?

MARKETING INSIDER GROUP
The Content FormulaCalculate the ROI of Content Marketing & Never Waste Money Again
Michael BrennerCEO, Marketing Insider Group@BrennerMichael
Liz BedorBrand Strategist, NewsCred@lizbedor

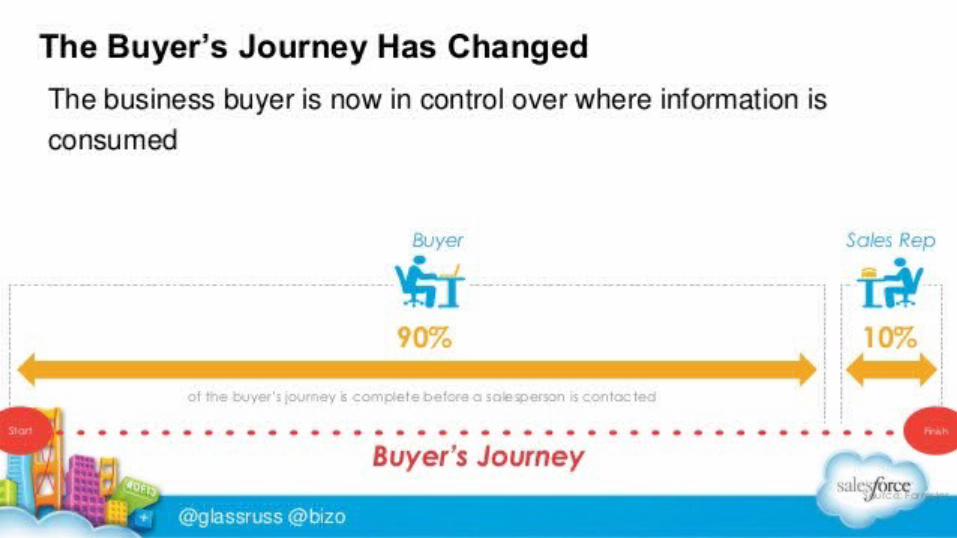
What is Marketing?@BrennerMichael
@LizBedor

What is the ROI?
@BrennerMichael @LizBedor

MARKETING INSIDER GROUPWhat is the ROI?
@BrennerMichael @LizBedor

What is the ROI?
@BrennerMichael @LizBedor
Let’s Talk About Banners?
@BrennerMichael @LizBedor
The 1st Banner (1994):
44% Click Thru Rate!


@BrennerMichael @LizBedor

MARKETING INSIDER GROUP
WARNING!
Math ahead! @BrennerMichael @LizBedor

@BrennerMichael @LizBedor

MARKETING INSIDER GROUP
Less likely to click on a banner than…
@BrennerMichael @LizBedor

MARKETING INSIDER GROUP@BrennerMichael @LizBedor

MARKETING INSIDER GROUP@BrennerMichael @LizBedor

MARKETING INSIDER GROUP
“We need to stop interrupting whatpeople are interested in and give
people what they are interested in.
”@BrennerMichael
@LizBedor

MARKETING INSIDER GROUP
Ann Handley: Take your brand out of the story and make your customers the hero.”
ContentMarketing
What Brands Publish
WhatCustomers
Want
Business Instinct CharityEmpathy@BrennerMichael
@LizBedor

MARKETING INSIDER GROUP@BrennerMichael @LizBedor

Marketers need to measure things that have quantifiable value that they can take to the bank.@BrennerMichael
@LizBedor

MARKETING INSIDER GROUP
We hear lots of questions about content marketing . . .
What is content marketing?
How do I get my content shared?
Should we hire journalists?
How can I create a viral video?
How do I map content to the buyer journey?
How do I convince my boss to fund content marketing?
What tools should I consider for my content marketing?
What is the cost of content marketing?
Is it ok to sell in my content marketing?
How do I perform a content audit?
Is content marketing the same as native advertising?Should our content be
gated?
What should we write about?
How do I get my boss to see the value in content marketing?
What are the factors of success with content marketing?
How can I get good at content marketing?
What does great content marketing look like?
Why is content marketing important?
@BrennerMichael @LizBedor

MARKETING INSIDER GROUP
HOW DO I CALCULATE CONTENT MARKETING ROI?
Is the most common question we hear from marketers struggling to build their
own business case internally.
“”
@BrennerMichael @LizBedor

MARKETING INSIDER GROUP
PART ONE
/ Build The Business Case
BUILD THE BUSINESS CASE FIND THE BUDGET MEASURE RESULTS
1

MARKETING INSIDER GROUP@BrennerMichael @LizBedor

MARKETING INSIDER GROUP@BrennerMichael @LizBedor

Marketing should be tied to
a business case that sales and
executives can understand.
@BrennerMichael @LizBedor
MARKETING INSIDER GROUP

MARKETING INSIDER GROUP
Reach early stage buyers
Engage new buyers with your
brand
Conversions you would have never
reached
= $
BUILD THE BUSINESS CASE
@BrennerMichael @LizBedor

MARKETING INSIDER GROUP
Early-stage Searches
Middle-stage
Brand Searches
Search / Social Volum
e
What is Content Marketing?(10-3000 X)
How do I succeed with Content Marketing?
(2-10 X)
What tools can help me with
content marketing?
(1)
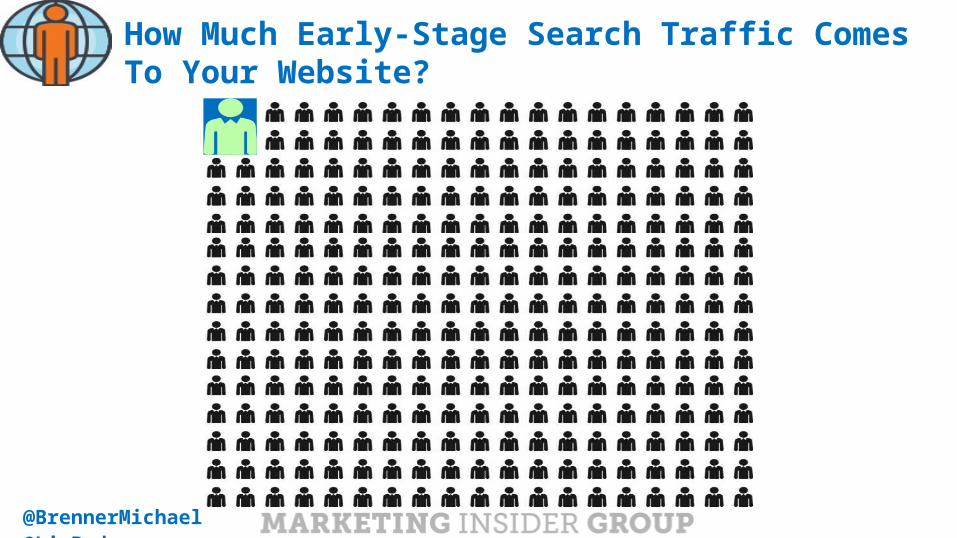
How Much Early-Stage Search Traffic Comes To Your Website?
@BrennerMichael @LizBedor
MARKETING INSIDER GROUP
How Much Early-Stage Search Traffic Comes To Your Website?
@BrennerMichael @LizBedor

MARKETING INSIDER GROUPOrganic search is
responsible for 64% of all web traffic
Only 2% of users travel to the 2nd page of Google
18% of users click on the first organic
listing
Do You Rank In Position 1-3 for Your Product Category?
@BrennerMichael @LizBedor

MARKETING INSIDER GROUP
Do You Rank In Position 1-3 for Your Product Category?
@BrennerMichael @LizBedor

MARKETING INSIDER GROUP
IMAGINE: YOU OWN THE CATEGORYwww.makeup.com -- (owned by L’Oreal)
@BrennerMichael @LizBedor

MARKETING INSIDER GROUP
IMAGINE: YOU OWN THE TARGET AUDIENCE www.CMO.com -- owned by Adobe
@BrennerMichael @LizBedor

MARKETING INSIDER GROUP
IMAGINE: YOU ARE A TOP SOURCE IN YOUR INDUSTRYwww.health.clevelandclinic.org -- Top source for healthcare information w/ +2M visitors per month
@BrennerMichael @LizBedor

MARKETING INSIDER GROUP
IMAGINE: MARKETING THAT ATTRACTS NEW BUYERSAMEX OPEN Forum is the largest source of new leads for AMEX’s Small Business Division
@BrennerMichael @LizBedor

MARKETING INSIDER GROUP@BrennerMichael @LizBedor

MARKETING INSIDER GROUP
PART TWO
/ Find The Budget
BUILD THE BUSINESS CASE FIND THE BUDGET MEASURE RESULTS
2

MARKETING INSIDER GROUP
Content Used30%
Content Not Used70%
60% -70% of Content Goes Completely Unused*$100 Billion Opportunity**
** Source: Econsultancy* Source: Sirius Decisions
= $@BrennerMichael
@LizBedor

MARKETING INSIDER GROUP
How much your organization is
wasting on unused content
Amount that gets used
Current content production costs
Calculate The Cost of Unused Content
@BrennerMichael @LizBedor

MARKETING INSIDER GROUP
What Do You Spend On Paid Search Because You Don’t Rank Organically?
=$@BrennerMichael
@LizBedor

MARKETING INSIDER GROUP
The average click-through rate of display ads is 0.1%. (DoubleClick)
.1%8% Only 8% of internet users account for 85% of
clicks on display ads (and some aren’t even humans!)(comScore)
50%About 50% of clicks on mobile ads are accidental(GoldSpot)
Reallocate Budget From Low Performing Marketing Programs (Advertising?)
@BrennerMichael @LizBedor

MARKETING INSIDER GROUP
Run CRM ROI Report. Rank Low to High
=$@BrennerMichael
@LizBedor
MARKETING INSIDER GROUP
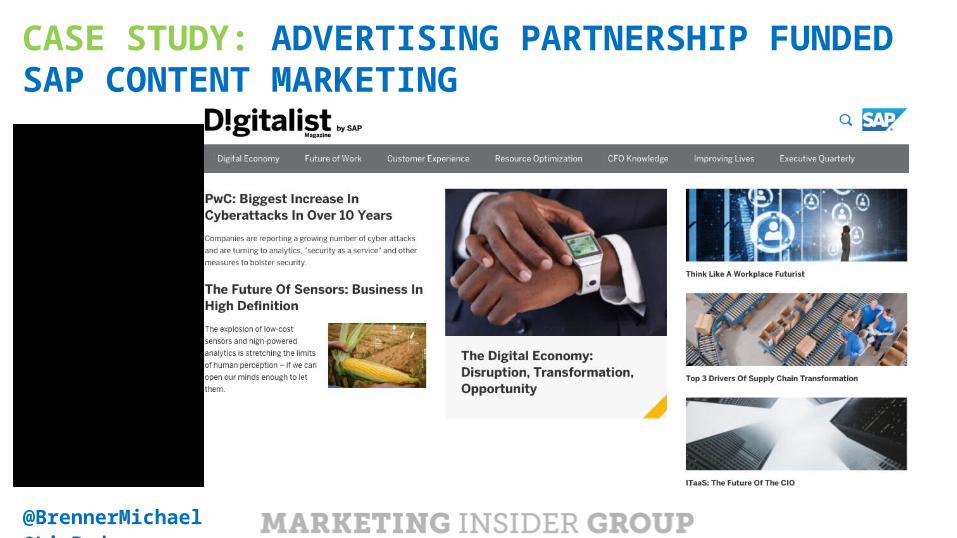
CASE STUDY: ADVERTISING PARTNERSHIP FUNDED SAP CONTENT MARKETING
@BrennerMichael @LizBedor

MARKETING INSIDER GROUP
CASE STUDY: ADVERTISING PARTNERSHIP FUNDED SAP CONTENT MARKETING
Saved / invested in content marketing platform$100,000
Reach, Engagement and LEADS SAP would have never seen.
1,000,000 Organic Visitors10,000 Subscribers1,000 Leads
@BrennerMichael @LizBedor

MARKETING INSIDER GROUP
We shifted investment from advertising to content
marketing so we could shout louder than we spend.
Beth ComstockCMO, GE
”
“
@BrennerMichael @LizBedor
MARKETING INSIDER GROUP
PART THREE
/ MeasureResults
BUILD THE BUSINESS CASE FIND THE BUDGET MEASURE RESULTS
3

MARKETING INSIDER GROUP
Content Marketing ROI is 4X our traditional marketing
spend. ”“
Julie FleischerFormer Sr. Director, Kraft
Foods
@BrennerMichael @LizBedor

MARKETING INSIDER GROUP
Paid vs. Organic Search Traffic
REACH
Organic Search Share of Voice
Unbranded Search Traffic
LEADS
CONVERT
OTHER CONVERSIONS
SUBSCRIBERS
Time on Site
ENGAGE
Social shares
Subscriptions
Bounce rate
Retention Rate
Upsells
RETAIN
CONTENT MARKETING ROI
@BrennerMichael @LizBedor
MARKETING INSIDER GROUP
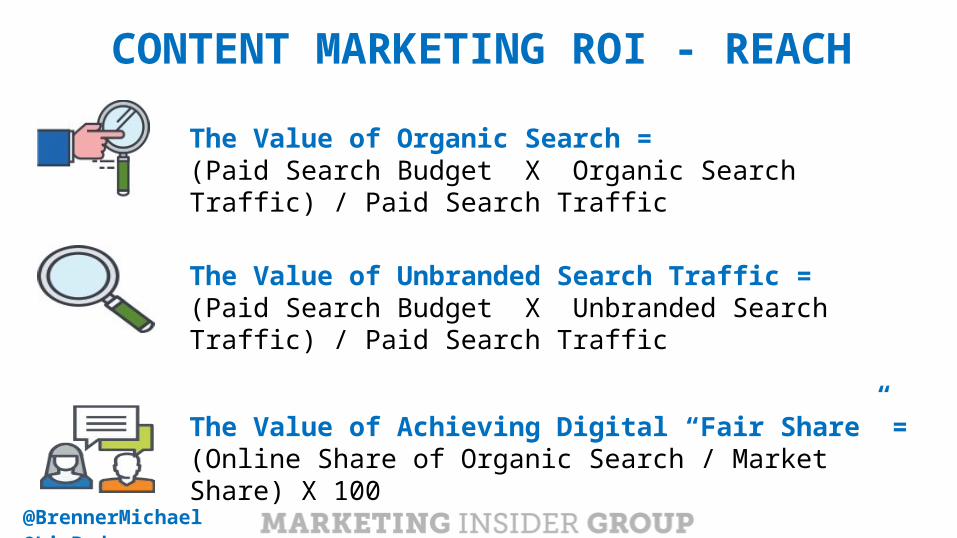
CONTENT MARKETING ROI - REACHThe Value of Organic Search = (Paid Search Budget X Organic Search Traffic) / Paid Search Traffic
The Value of Unbranded Search Traffic = (Paid Search Budget X Unbranded Search Traffic) / Paid Search Traffic
The Value of Achieving Digital “Fair Share” = (Online Share of Organic Search / Market Share) X 100
@BrennerMichael @LizBedor
HOW TO CALCULATE THE VALUE OF:PAID VS. ORGANIC SEARCH TRAFFIC

Organic search traffic can be calculated easily via Google Analytics:
1 Go to Acquisition2 Campaigns3 Organic Keywords

In this example, the site has received 359,953 visits from organic search traffic, totaling 25% of overall traffic.

Assume we spend $100,000 for 1,078,799 visits.
1,078,779 359,593
$100,000 X
CROSS MULTIPLY & DIVIDE TO FIND “X”
ALGEBRA DOES COME IN HANDY!
PAID ORGANIC
TRAFFIC PERCENTAGE 75% 25%TOTAL TRAFFIC 1,078,779 359,593
COST/VALUE $100,000 $33,333
ORGANIC SEARCH TRAFFIC IS WORTH $33,333

MARKETING INSIDER GROUP
CONTENT MARKETING ROI - ENGAGEMENT
The Value of Repeat Visitors = (Online Ad Budget / Ad Traffic) * Repeat Visitors
The Value of Subscribers= (Sales from Email Nurture) / # Subscribers
@BrennerMichael @LizBedor
HOW TO CALCULATE THE VALUE OF:Repeat Visitors

Source: Inc, 2 Web Metrics You Should be Watching All the Time, 2014
Repeat Visitor Ratio (RVR) measures the percentage of visitors who returnto your site after an initial visit during some specific time period.
Let’s say you got 4,000 visitors this month and 800 were repeat visitors.
800/4,000 = 20%

To put a monetary value on RVR, we need tolook at the average amount you’re spending
in advertising to drive net new traffic.

For our example, let’s say you’re spending $5,000 per month on advertising to drivenew visitors.If 80%, or 3,200 visitors are net new, you’re spending an average of $1.56 per visitor.$5,000 / 3,200 = $1.56Taking that finding, we can then calculate the value of our 800 repeat visitors.800 * $1.56 = $1,250Therefore, our repeat visitors are valued at $1,250 per month.

Don’t forget that while you want to increase the
percentage of repeat visitors, you also want to increase the total number of visitors…Otherwise you’ll be preaching to the same
choir.
MARKETING INSIDER GROUP
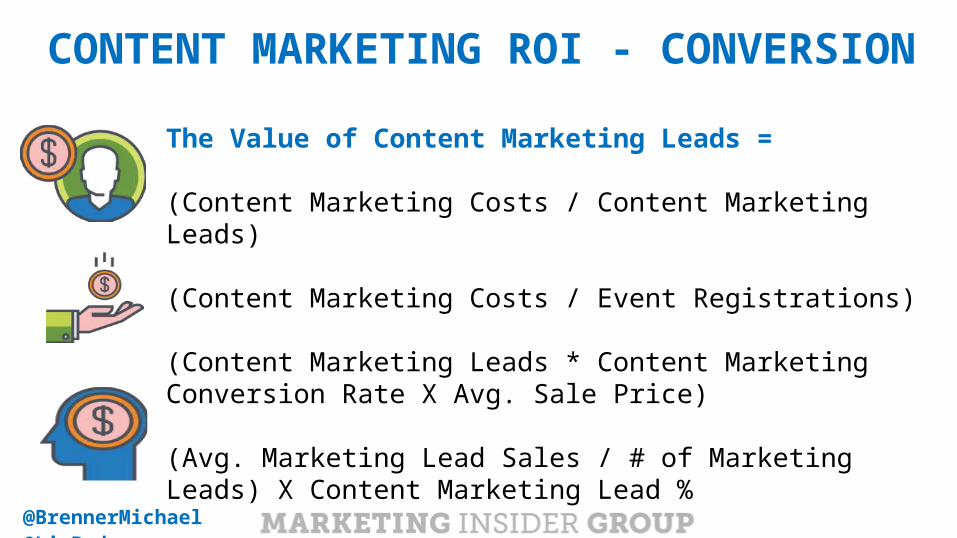
CONTENT MARKETING ROI - CONVERSION
The Value of Content Marketing Leads =
(Content Marketing Costs / Content Marketing Leads)
(Content Marketing Costs / Event Registrations)
(Content Marketing Leads * Content Marketing Conversion Rate X Avg. Sale Price)
(Avg. Marketing Lead Sales / # of Marketing Leads) X Content Marketing Lead %
@BrennerMichael @LizBedor

HOW TO CALCUATE THE VALUE OF:COST PER LEAD

In this example, we’ve created two pieces of content:• For the ROI Guide, we spent $3,000 to create and invested $10,000 to
distribute.
• For the Strategy Guide we also spent $3,000 to create, but spent $20,000 to distribute.
• Combining these costs, we can see that the ROI Guide cost us $13,000 and the Strategy Guide cost us $23,000.CONTENT ACTIVITY COST TOTAL COST
ROI Guide Creation $3,000$13,000
ROI Guide Sponsored Email $10,000
Strategy Guide Creation $3,000$23,000
Strategy Guide Sponsored Webinar $20,000

CHANNEL COST NEW LEADS MQLs CPMQL
ROI Guide $13,000 550 205 $63
Strategy Guide $23,000 700 130 $177
Now that we know how much our content cost to create and distribute, let’s see how the content did in terms of lead generation to calculate cost per qualified lead.• To calculate cost per lead, we want to take the total cost ($13,000) divided by the total number of
qualified leads (205).
• $13,000 / 205 = $63
• Therefore, our ROI Guide cost $63 per qualified lead.

CHANNEL COST NEW LEADS MQLs CPMQL
ROI Guide $13,000 550 205 $63
Strategy Guide $23,000 700 130 $177
To determine an accurate average total cost per lead of content marketing, we’d want to take a larger sample, but for the purpose of this guide, we’ll simplify and average these two costs.$63 + $177 / 2 = $120
Therefore our average total cost per lead for content marketing is $120.
MARKETING INSIDER GROUP
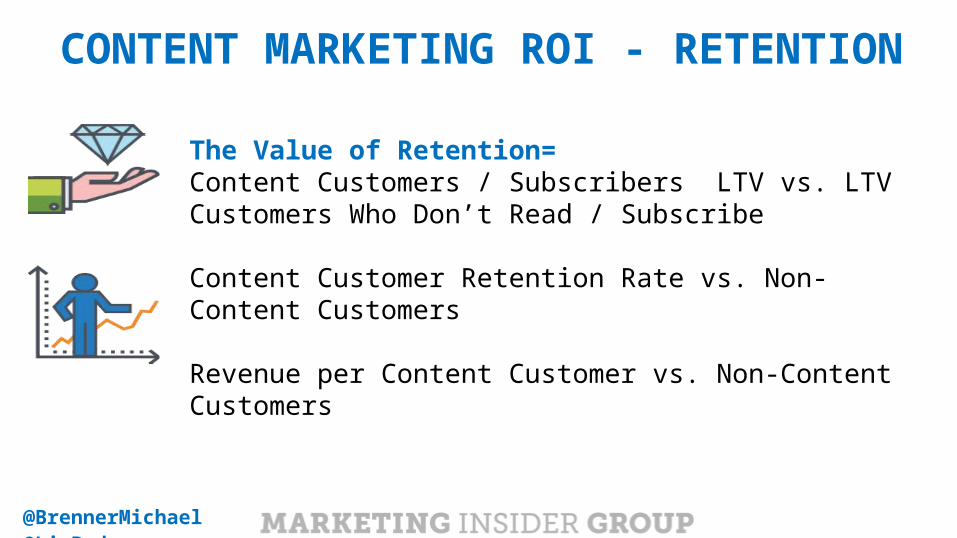
CONTENT MARKETING ROI - RETENTION
The Value of Retention= Content Customers / Subscribers LTV vs. LTV Customers Who Don’t Read / Subscribe
Content Customer Retention Rate vs. Non-Content Customers
Revenue per Content Customer vs. Non-Content Customers
@BrennerMichael @LizBedor

MARKETING INSIDER GROUP

MARKETING INSIDER GROUP
Thank you!Michael BrennerCEO, Marketing Insider Group@BrennerMichael
Liz BedorBrand Strategist, NewsCred@lizbedor

MARKETING INSIDER GROUP
APPENDIXMichael BrennerCEO, Marketing Insider Group@BrennerMichael
Liz BedorBrand Strategist, NewsCred@lizbedor

HOW TO CALCULATE THE VALUE OF:UNBRANDED ORGANIC SEARCH TRAFFIC
#ThinkContent @lizbedor

To calculate unbranded organic search, we need to exclude your brand or products’ name from the search.To do this, create an “Advanced Filter” that will exclude those branded keywords.In this example, our brand and products contain the word “Raspberry.”

Let’s say the results showed that now with excluding branded keywords, your site’s organic search
traffic accounts for 269,694 visits, or about 19% of total organic traffic.We go back to our table to calculate the value of this traffic.
1,078,779 269,692
$100,000 X
CROSS MULTIPLY & DIVIDE TO FIND “X”
PAID ORGANIC
TRAFFIC PERCENTAGE 75% 19%TOTAL TRAFFIC 1,078,779 269,692
COST/VALUE $100,000 $24,100
ORGANIC UNBRANDED SEARCH TRAFFIC IS WORTH $24,100

HOW TO CALCUATE THE VALUE OF:ORGANIC SEARCH SHARE OF VOICE

This essentially measures how much your brand or product is talked about
compared to your competitors.
COMPETITOR 2
COMPETITOR 3
COMPETITOR 1
YOU

Now record the rankings for each keyword you selected for yourself and your competitors.
If you do rank, record in what position. (Note: You can rank more than once)
KEYWORD RANKING #1 RANKING #2 RANKING #3
DANCE SHOES 1 2 3
DANCING SHOES 2 3 4
CHEAP DANCE SHOES 2
AFFORDABLE DANCE SHOES 5
BALLET SHOES
#ThinkContent @lizbedor

2014 GOOGLE CLICK THROUGH RATES
POSITION CTR1 31.242 14.043 9.854 6.975 5.56 3.737 08 09 0
10 0
Source: Moz, Google Organic Click-Through Rates in 2014.
Now that you have your rankings, calculate yourshare of voice for each keyword using the chart to the left.
KEYWORD RANKING #1
RANKING #2
RANKING #3
DANCE SHOES 1 2 3DANCING SHOES 2 3 4CHEAP DANCE SHOES 2AFFORDABLE DANCE SHOES 5
BALLET SHOES

2014 GOOGLE CLICK THROUGH RATES
POSITION CTR1 31.242 14.043 9.854 6.975 5.56 3.737 08 09 0
10 0
Source: Moz, Google Organic Click-Through Rates in 2014.
Now that you have your rankings, calculate yourshare of voice for each keyword using the chart to the left.
KEYWORD RANKING #1
RANKING #2
RANKING #3
DANCE SHOES 31.24 14.04 9.85DANCING SHOES 14.04 9.85 6.97CHEAP DANCE SHOES 14.04AFFORDABLE DANCE SHOES 5.5
BALLET SHOES

If your rank more than once, simply add the click through rates to find that keyword’s total share of voice.
KEYWORD RANKING #1 RANKING #2 RANKING #3 SOV
DANCE SHOES 31.24 14.04 9.85 55.13%
DANCING SHOES 14.04 9.85 6.97 30.86
CHEAP DANCE SHOES 14.04 14.04%
AFFORDABLE DANCE SHOES 5.5 5.5%
BALLET SHOES
55.13 + 30.86 + 14.04 + 5.5 + 0 / 5 = 26.38
@lizbedor#ThinkContent

To find your overall share of voice, average the share of voice for all your keywords.
KEYWORD RANKING #1 RANKING #2 RANKING #3 SOV
DANCE SHOES 31.24 14.04 9.85 55.13%
DANCING SHOES 14.04 9.85 6.97 30.86
CHEAP DANCE SHOES 14.04 14.04%
AFFORDABLE DANCE SHOES 5.5 5.5%
BALLET SHOES
TOTAL SHARE OF VOICE 26.38%
55.13 + 30.86 + 14.04 + 5.5 + 0 / 5 = 26.38

HOW TO CALCULATE THE VALUE OF:SUBSCRIPTIONS

MARKETING INSIDER GROUPSource: AMEX Open Forum, What’s Your Email List Worth (In Actual Dollars)?, 2013
Your email list is an asset, and should be valued as such.

Source: MarketingProfs, The Art and Science of Growing Your Email List, 2014
FIRST THING’S FIRST:

FIRST THING’S FIRST:
You must know your maximum allowable cost threshold for getting a new subscriber, otherwise, you’re spending in the dark.
POSITIVE RETURN
DIMINISHING POSTIIVE
RETURN
MAXIMUM ALLOWABLE
COST
Source: MarketingProfs, The Art and Science of Growing Your Email List, 2014

NEGATIVE
RETURNS!
FIRST THING’S FIRST:
You must know your maximum allowable cost threshold for getting a new subscriber, otherwise, you’re spending in the dark.
or, worse yet, to the point of negative returns.
POSITIVE RETURN
DIMINISHING POSTIIVE
RETURN
MAXIMUM ALLOWABLE
COST
Source: MarketingProfs, The Art and Science of Growing Your Email List, 2014

METHOD QUANTITY OF SUBSCRIBERS (QOS) COST PER ACQUISITION (CPA)
FACEBOOK AD 200 $2.30
TWITTER 400 $1.00
PAID SEARCH 300 $2.00
WEBINAR 100 $0.10
First, calculate what it actually costs you to get a new subscriber from each list-building method.
Source: MarketingProfs, The Art and Science of Growing Your Email List, 2014

Let’s say you’ve tested a few tactics anddecided that your maximum allowable CPA for a new email address is $1.50.
MAXIMUM ALLOWABLE
COST
$1.50
METHOD QUANTITY OF SUBSCRIBERS (QOS) COST PER ACQUISITION (CPA)
FACEBOOK AD 200 $2.30
TWITTER 400 $1.00
PAID SEARCH 300 $2.00
WEBINAR 100 $0.10
Moving forward, you’ll want to continue pursuing all methodscosting $1.50 or less.

METHOD QUANTITY OF SUBSCRIBERS (QOS)
COST PER ACQUISITION (CPA)
UNSUBSCRIBERATE (UR)
AVERAGE SALE VALUE (ASV)
FACEBOOK AD 200 $2.30 30% $100
TWITTER 400 $1.00 5% $100
PAID SEARCH 300 $2.00 15% $150
WEBINAR 100 $0.10 5% $200
Over time, we need to also measure the quality of the subscribers on your list by monitoring things like average sale value and unsubscribe rate.

METHOD QUANTITY OF SUBSCRIBERS (QOS)
COST PER ACQUISITION (CPA)
UNSUBSCRIBERATE (UR)
AVERAGE SALE VALUE (ASV)
FACEBOOK AD 200 $2.30 30% $100
TWITTER 400 $1.00 5% $100
PAID SEARCH 300 $2.00 15% $150
WEBINAR 100 $0.10 5% $200
To calculate the value per subscriber, we need find the difference between the sale value and cost per acquisition for the subscribers.To do this, we use the formula below:VALUE PER SUBSCRIBER = ( QOS * ASV * ( 1 – UR ) – QOS * CPA ) / QOS

METHOD QUANTITY OF SUBSCRIBERS
(QOS)
COST PER ACQUISITION
(CPA)
UNSUBSCRIBERATE (UR)
AVERAGE SALE VALUE
(ASV)
TOTAL VALUE
(TV)
VALUE PERSUBSCRIBER
(VPS)
FACEBOOK AD 200 $2.30 30% $100 $13,540 $67.70
TWITTER 400 $1.00 5% $100 $37,600 $94
PAID SEARCH 300 $2.00 15% $150 $37,650 $125.50
WEBINAR 100 $0.10 5% $200 $18,990 $189.90
We’ll use Facebook Ads as an example:VALUE PER SUBSCRIBER = ( QOS * ASV * ( 1 – UR ) – QOS * CPA ) / QOS
VALUE PER SUBSCRIBER = ( 200 * 100 * ( 1 – 0.30 ) – 200 * 2.30 ) / 200
Therefore, the value of each Facebook subscription is $67.70

METHOD QUANTITY OF SUBSCRIBERS
(QOS)
COST PER ACQUISITION
(CPA)
UNSUBSCRIBERATE (UR)
AVERAGE SALE VALUE
(ASV)
TOTAL VALUE
(TV)
VALUE PERSUBSCRIBER
(VPS)
FACEBOOK AD 200 $2.30 30% $100 $13,540 $67.70
TWITTER 400 $1.00 5% $100 $37,600 $94
PAID SEARCH 300 $2.00 15% $150 $37,650 $125.50
WEBINAR 100 $0.10 5% $200 $18,990 $189.90
Based on these calculations, we can see that paid search and webinar methodsreturn the most value per subscriber.
However, since paid search’s CPA is more expensive than our maximum allowance of$1.50, we should defer to webinar and Twitter tactics.

HOW TO CALCUATE THE VALUE OF:SOCIAL SHARES + FOLLOWERS

While social shares can be seen as anengagement metric, but should be quantified
as a free source of distribution and reach.

Let’s say you spend $1,000 on paid social distribution and reached 5,000 viewers.
For this campaign, each view was worth $0.20 ($1,000/5000).
Now let’s say a social post was shared organically by your followers and reached 500 viewers.
Based on the value of each view from our paid distribution, we can also value our 500 organic views at $0.20 each, or $100 total.

HOW TO CALCUATE THE VALUE OF:SHARE OF VOICE/OFFSITE SEO

How can you measure your off-site SEO?• Measure your inbound links and their value with Open Site Explorer.
(https://moz.com/researchtools/ose/)
• Do the same with your competitors’ sites and compare
Source: Altitude Marketing, SEO Checklist Part 2: Measure and Improve Off-site SEO Factors That Drive Organic Search Traffic to Your Site,
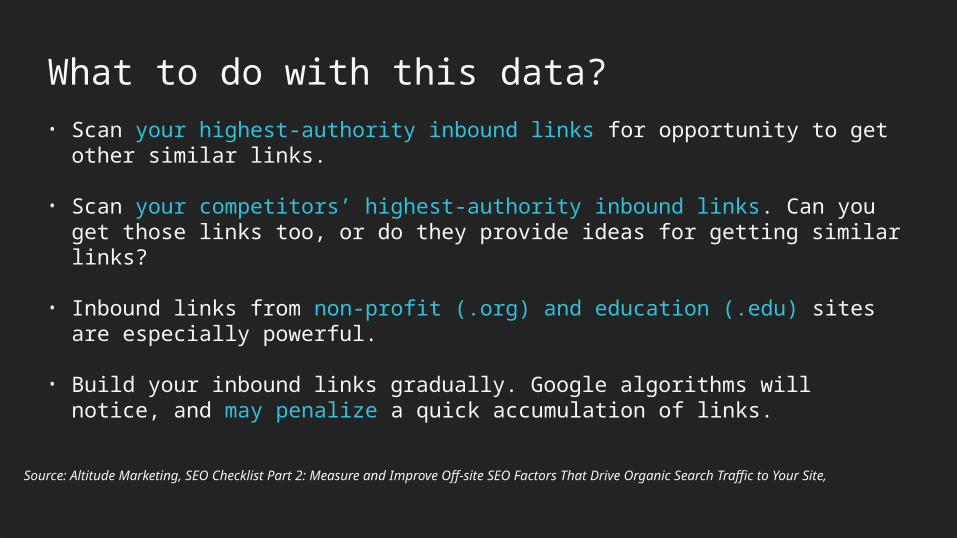
What to do with this data?• Scan your highest-authority inbound links for opportunity to get other similar
links.
• Scan your competitors’ highest-authority inbound links. Can you get those links too, or do they provide ideas for getting similar links?
• Inbound links from non-profit (.org) and education (.edu) sites are especially powerful.
• Build your inbound links gradually. Google algorithms will notice, and may penalize a quick accumulation of links.
Source: Altitude Marketing, SEO Checklist Part 2: Measure and Improve Off-site SEO Factors That Drive Organic Search Traffic to Your Site,

HOW TO CALCUATE THE VALUE OF:PERCENTAGE OF LEADS FROM CONTENT MARKETING

Looking at this gathered data, we see that content marketing accounts for 205 of thetotal 710 marketing qualified leads.
PROGRAM MQLs
Content 205
Events 300
Advertising 30
Email 100
Public Relations 75
Total 710
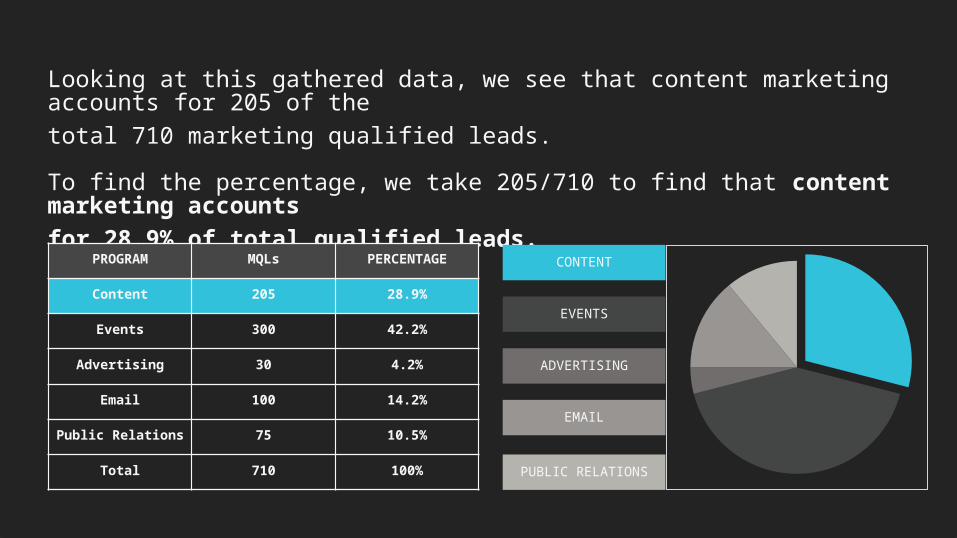
Looking at this gathered data, we see that content marketing accounts for 205 of thetotal 710 marketing qualified leads.To find the percentage, we take 205/710 to find that content marketing accountsfor 28.9% of total qualified leads.
PROGRAM MQLs PERCENTAGE
Content 205 28.9%
Events 300 42.2%
Advertising 30 4.2%
Email 100 14.2%
Public Relations 75 10.5%
Total 710 100%
EVENTS
ADVERTISING
CONTENT
PUBLIC RELATIONS
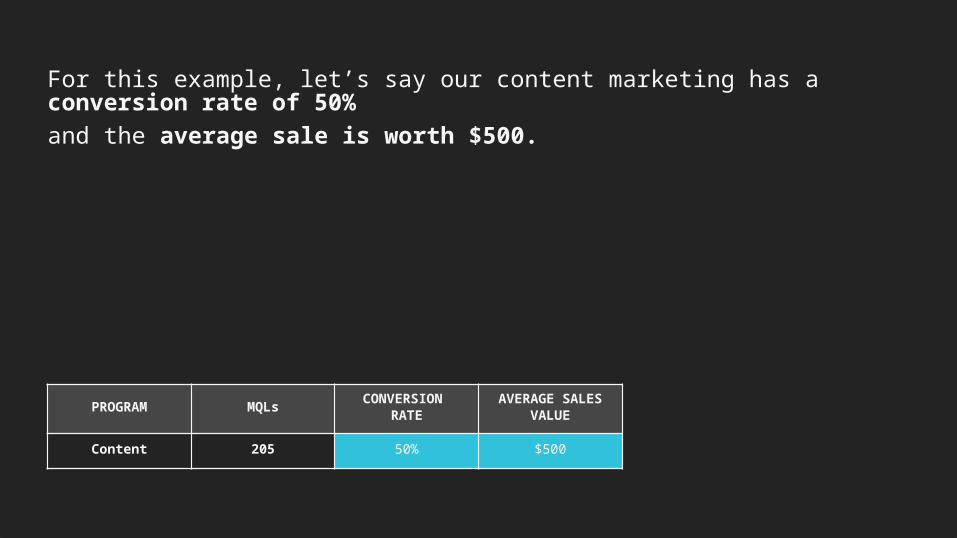
HOW TO CALCULATE THE VALUE OF:CONVERSIONS
PROGRAM MQLs CONVERSION RATE
AVERAGE SALESVALUE
Content 205 50% $500
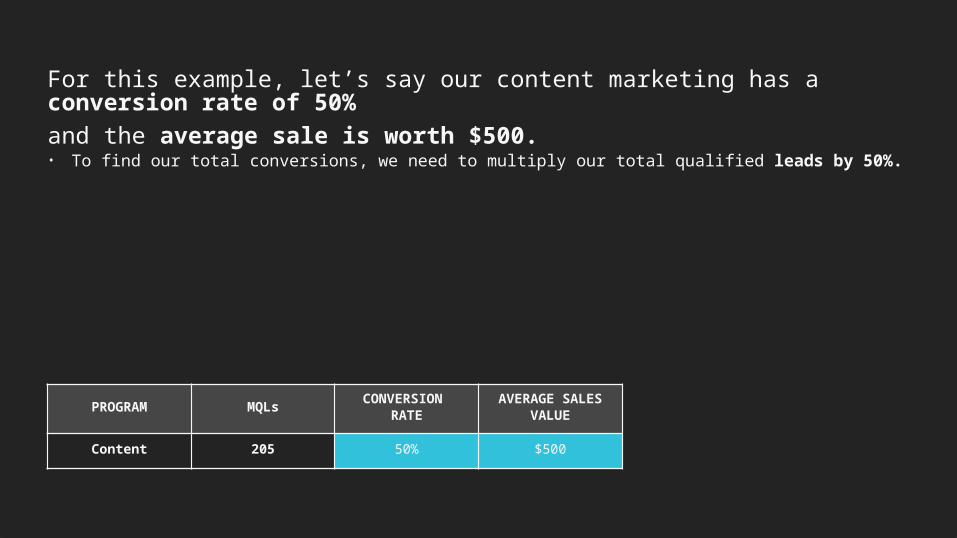
For this example, let’s say our content marketing has a conversion rate of 50% and the average sale is worth $500.
PROGRAM MQLs CONVERSION RATE
AVERAGE SALESVALUE
Content 205 50% $500
• To find our total conversions, we need to multiply our total qualified leads by 50%.
For this example, let’s say our content marketing has a conversion rate of 50% and the average sale is worth $500.

PROGRAM MQLs CONVERSION RATE
AVERAGE SALESVALUE CONVERSIONS
Content 205 50% $500 102.5
For this example, let’s say our content marketing has a conversion rate of 50% and the average sale is worth $500. • To find our total conversions, we need to multiply our total qualified leads by 50%.
• 205 * 50% = 102.5 conversions
• Based on that finding we assume these sales will average $500, so to find the total value we multiply 102.5 * $500 = $51,000

PROGRAM MQLs CONVERSION RATE
AVERAGE SALESVALUE CONVERSIONS
TOTAL CONVERSION
VALUE
Content 205 50% $500 102.5 $51,000
For this example, let’s say our content marketing has a conversion rate of 50% and the average sale is worth $500. • To find our total conversions, we need to multiply our total qualified leads by 50%.
• 205 * 50% = 102.5 conversions
• Based on that finding we assume these sales will average $500, so to find the total value we• multiply 102.5 * $500 = $51,000
• Therefore, our total content marketing conversions are worth $51,000