Consensus paper: Combining transcranial stimulation with ...
23
ORIGINAL RESEARCH Consensus paper: Combining transcranial stimulation with neuroimaging Hartwig R. Siebner, MD a,b , Til O. Bergmann, MD b , Sven Bestmann, MD c,d , Marcello Massimini, MD e , Heidi Johansen-Berg, MD f,g , Hitoshi Mochizuki, MD h , Daryl E. Bohning, MD i,j , Erie D. Boorman, MD f , Sergiu Groppa, MD b , Carlo Miniussi, MD k,l , Alvaro Pascual-Leone, MD m , Reto Huber, MD n , Paul C. J. Taylor, MD o , Risto J. Ilmoniemi, MD p,q , Luigi De Gennaro, MD k,r , Antonio P. Strafella, MD s , Seppo Ka ¨hko ¨nen, MD p,t , Stefan Klo ¨ppel, MD u , Giovanni B. Frisoni, MD v , Mark S. George, MD i,w , Mark Hallett, MD x , Stephan A. Brandt, MD y , Matthew F. Rushworth, MD z , Ulf Ziemann, MD aa , John C. Rothwell, MD c , Nick Ward, MD c,d , Leonardo G. Cohen, MD bb , Ju ¨rgen Baudewig, MD cc , Toma ´s ˇ Paus, MD dd,ee , Yoshikazu Ugawa, MD h , Paolo M. Rossini, MD ff,gg,hh a Danish Research Center for Magnetic Resonance, Copenhagen University Hospital-Hvidovre, Denmark b Department of Neurology, Christian-Albrechts-University, Kiel, Germany c Sobell Department of Motor Neuroscience and Movement Disorders, Institute of Neurology, Queen Square, London, UK d Wellcome Trust Center for Neuroimaging, Institute of Neurology, University College, London, UK e Department of Clinical Science, Faculty of Medicine, University of Milan, Italy f Centre for Functional Magnetic Resonance Imaging of the Brain, University of Oxford, Oxford, UK g Department of Clinical Neurology, University of Oxford, Oxford, UK h Department of Neurology, School of Medicine, Fukushima Medical University, Fukushima, Japan i Center for Advanced Imaging Research, Medical University of South Carolina, Charleston, South Carolina j Department of Radiology, Medical University of South Carolina, Charleston, South Carolina k IRCCS S. Giovanni di Dio Fatebenefratelli, Brescia, Italy l Department of Biomedical Sciences and Biotechnology, National Institute of Neuroscience, University of Brescia, Brescia, Italy m Department of Neurology, Berenson-Allen Center for Noninvasive Brain Stimulation, Beth Israel Deaconess Medical Center and Harvard Medical School, Boston, Massachusetts n University Children’s Hospital, Zurich, Switzerland o The Henry Wellcome Building, School of Psychology, Birkbeck College, Torrington Square, London, UK Correspondence: Dr. Hartwig R. Siebner, Danish Research Center for Magnetic Resonance, Copenhagen University Hospital-Hvidovre, Kettegaards Alle 30, 2650 Hvidovre, Denmark. E-mail address: [email protected] Submitted October 21, 2008. Accepted for publication November 30, 2008. 1935-861X/09/$ -see front matter Ó 2009 Elsevier Inc. All rights reserved. doi:10.1016/j.brs.2008.11.002 Brain Stimulation (2009) 2, 58–80 www.brainstimjrnl.com
Transcript of Consensus paper: Combining transcranial stimulation with ...

Corresponde
30, 2650 Hvidov
E-mail addre
Submitted O
1935-861X/09/$
doi:10.1016/j.br
Brain Stimulation (2009) 2, 58–80
www.brainstimjrnl.com
ORIGINAL RESEARCH
Consensus paper: Combining transcranial stimulationwith neuroimaging
Hartwig R. Siebner, MDa,b, Til O. Bergmann, MDb, Sven Bestmann, MDc,d,Marcello Massimini, MDe, Heidi Johansen-Berg, MDf,g, Hitoshi Mochizuki, MDh,Daryl E. Bohning, MDi,j, Erie D. Boorman, MDf, Sergiu Groppa, MDb,Carlo Miniussi, MDk,l, Alvaro Pascual-Leone, MDm, Reto Huber, MDn,Paul C. J. Taylor, MDo, Risto J. Ilmoniemi, MDp,q, Luigi De Gennaro, MDk,r,Antonio P. Strafella, MDs, Seppo Kahkonen, MDp,t, Stefan Kloppel, MDu,Giovanni B. Frisoni, MDv, Mark S. George, MDi,w, Mark Hallett, MDx,Stephan A. Brandt, MDy, Matthew F. Rushworth, MDz, Ulf Ziemann, MDaa,John C. Rothwell, MDc, Nick Ward, MDc,d, Leonardo G. Cohen, MDbb,Jurgen Baudewig, MDcc, Tomas Paus, MDdd,ee, Yoshikazu Ugawa, MDh,Paolo M. Rossini, MDff,gg,hh
aDanish Research Center for Magnetic Resonance, Copenhagen University Hospital-Hvidovre, DenmarkbDepartment of Neurology, Christian-Albrechts-University, Kiel, GermanycSobell Department of Motor Neuroscience and Movement Disorders, Institute of Neurology, Queen Square, London, UKdWellcome Trust Center for Neuroimaging, Institute of Neurology, University College, London, UKeDepartment of Clinical Science, Faculty of Medicine, University of Milan, ItalyfCentre for Functional Magnetic Resonance Imaging of the Brain, University of Oxford, Oxford, UKgDepartment of Clinical Neurology, University of Oxford, Oxford, UKhDepartment of Neurology, School of Medicine, Fukushima Medical University, Fukushima, JapaniCenter for Advanced Imaging Research, Medical University of South Carolina, Charleston, South CarolinajDepartment of Radiology, Medical University of South Carolina, Charleston, South CarolinakIRCCS S. Giovanni di Dio Fatebenefratelli, Brescia, ItalylDepartment of Biomedical Sciences and Biotechnology, National Institute of Neuroscience, University of Brescia, Brescia,ItalymDepartment of Neurology, Berenson-Allen Center for Noninvasive Brain Stimulation, Beth Israel Deaconess MedicalCenter and Harvard Medical School, Boston, MassachusettsnUniversity Children’s Hospital, Zurich, SwitzerlandoThe Henry Wellcome Building, School of Psychology, Birkbeck College, Torrington Square, London, UK
nce: Dr. Hartwig R. Siebner, Danish Research Center for Magnetic Resonance, Copenhagen University Hospital-Hvidovre, Kettegaards Alle
re, Denmark.
ctober 21, 2008. Accepted for publication November 30, 2008.
-see front matter � 2009 Elsevier Inc. All rights reserved.
s.2008.11.002

Combining TMS with neuroimaging 59
pBioMag Laboratory, Helsinki University Central Hospital, Helsinki, FinlandqDepartment of Biomedical Engineering and Computational Science, Helsinki University of Technology, Helsinki, FinlandrDepartment of Psychology, University of Rome ‘‘La Sapienza,’’ Rome, ItalysMovement Disorders Center, Toronto Western Hospital, Division of Neurology, University of Toronto, Ontario, CanadatPain Clinic, Helsinki University Central Hospital, Helsinki, FinlanduDepartment of Psychiatry and Psychotherapy, Freiburg Brain Imaging, University Clinic Freiburg, Freiburg, GermanyvThe National Centre for Alzheimer’s and Mental Diseases, Brescia, ItalywBrain Stimulation Laboratory, Medical University of South Carolina, Charleston, South CarolinaxHuman Motor Control Section, NINDS, NIH, Bethesda, MarylandyDepartment of Neurology, Berlin NeuroImaging Center, Charite, Berlin, GermanyzDepartment of Experimental Psychology, University of Oxford, Oxford, UKaaDepartment of Neurology, Goethe-University Frankfurt, GermanybbHuman Cortical Physiology and Stroke Neurorehabilitation Section, National Institute of Health, National Institute ofNeurological Disorders and Stroke, Bethesda, MarylandccMR-Research in Neurology and Psychiatry, Medical Faculty, Georg-August University, Goettingen, GermanyddBrain and Body Centre, University of Nottingham, Nottingham, UKeeMontreal Neurological Institute, McGill University, Montreal, Quebec, CanadaffCasa di Cura S. Raffaele Cassino and IRCCS S. Raffaele Pisana, Roma, ItalyggAFaR, Department of Neuroscience, Hosp. Fatebenefratelli, Isola Tiberina, Rome, ItalyhhNeurology Clinic, University Campus Biomedico, Rome, Italy
In the last decade, combined transcranial magnetic stimulation (TMS)-neuroimaging studies havegreatly stimulated research in the field of TMS and neuroimaging. Here, we review how TMS can becombined with various neuroimaging techniques to investigate human brain function. When appliedduring neuroimaging (online approach), TMS can be used to test how focal cortex stimulation acutelymodifies the activity and connectivity in the stimulated neuronal circuits. TMS and neuroimaging canalso be separated in time (offline approach). A conditioning session of repetitive TMS (rTMS) may beused to induce rapid reorganization in functional brain networks. The temporospatial patterns of TMS-induced reorganization can be subsequently mapped by using neuroimaging methods. Alternatively,neuroimaging may be performed first to localize brain areas that are involved in a given task. Thetemporospatial information obtained by neuroimaging can be used to define the optimal site and timepoint of stimulation in a subsequent experiment in which TMS is used to probe the functionalcontribution of the stimulated area to a specific task. In this review, we first address some generalmethodologic issues that need to be taken into account when using TMS in the context ofneuroimaging. We then discuss the use of specific brain mapping techniques in conjunction withTMS. We emphasize that the various neuroimaging techniques offer complementary information andhave different methodologic strengths and weaknesses.� 2009 Elsevier Inc. All rights reserved.
Keywords transcranial magnetic stimulation; TMS; neuroimaging; multimodal brain mapping; EEG;fMRI; MRI; PET; NIRS; MEG
Transcranial magnetic stimulation (TMS) is an impor-tant method for noninvasive stimulation of the humancortex through the intact skull without producing signifi-cant discomfort.1 TMS uses a rapidly changing magneticfield to induce brief electric current pulses in the brainthat can trigger action potentials in cortical neurons, espe-cially in superficial parts of the cerebral cortex. In a clinicalsetting, TMS is mainly used to examine the functionalintegrity of the corticospinal motor projections.
Since its introduction in 1985,1 the scientific applicationsof TMS have rapidly expanded. TMS has become a valuabletool to probe the excitability of intracortical circuits in themotor and visual cortex.2 TMS produces a synchronized
activation of cortical neurons, followed by a long-lastinginhibition. This explains why single pulses or short burstsof TMS can effectively perturb ongoing neuronal processingin the stimulated cortex. This transient disruptive effect ofTMS, often referred to as ‘‘virtual lesion,’’3 has been exten-sively used by cognitive neuroscientists to examine the func-tional relevance of the stimulated area for behavior.3-5 Itshould be noted, however, that the disruptive effect of TMSmay not always adversely affect task performance. Undercertain circumstances, the neurodisruptive effect of TMSmay even result in a paradoxical improvement of behaviorbecause of complex interactions at a systems level (eg, inter-hemispheric or intrahemispheric interactions).6,7

60 H.R. Siebner et al
Dual-site TMS can induce coordinated stimulation oftwo interconnected cortical areas. Using a conditioning-testapproach, dual-site TMS has been applied to assess cortico-cortical connectivity of pathways projecting onto the primarymotor hand area.8 When long continuous trains or short inter-mittent bursts are repeatedly applied to a cortical area, repet-itive TMS (rTMS) can induce changes in neuronalexcitability that persist beyond the time of stimulation.9,10
These neuromodulatory effects of TMS have been exploitedin many in vivo studies on cortical plasticity11,12 and may beof some use in patients with neurologic and psychiatricdiseases to maintain or restore brain function.13
Brain mapping benefits from transcranialstimulation
In the last 2 decades, advances in functional mappingtechniques have revolutionized human brain research,providing a sensitive means of identifying brain regionswhere neuronal activity correlates with behavior. Althoughbrain mapping can readily identify the spatial extent andthe temporal profile of brain activation during an experi-mental task, the ‘‘correlative nature’’ of these techniquesprecludes conclusions about the causal importance of anactivated brain area to task performance. In contrast toneuroimaging techniques, TMS is an interventional methodthat can be used to transiently and reversibly interfere withongoing neuronal activity in the stimulated neuronalcircuitries of the brain.14 The ‘‘interventional nature’’ ofTMS has added a new dimension to human brain mapping,opening up unique possibilities to probe causality at thesystems level of sensory, cognitive, and motor brainnetworks.8 For instance, when TMS is applied during anexperimental task, its perturbative effects can be used tomake causal inferences regarding the functional contribu-tion of the stimulated cortex to a specific brain function.4
In addition, the high temporal resolution of single-pulseTMS can be exploited to identify critical periods duringwhich the stimulated area and its connections to other brainregions make a critical contribution to the experimentaltask (often referred to as chronometry).3 Hence, thecombined TMS-neuroimaging approach is capable oftracing the temporospatial dynamics of causal interactionswithin functional brain networks.
TMS can also be used to activate and study mechanisms ofacute cortical reorganization in the healthy human brain. Thisis achieved by applying periods of rTMS over a target area toproduce effects on cortical circuits that outlast the duration ofthe rTMS session. The functional after effects that can beelicited with rTMS depend on the variables of stimulationsuch as intensity, frequency, and total number of stimuli andthe functional state of the cortex targeted by rTMS. Theseneuromodulatory effects have great potential for studies onadaptive neuroplasticity in the human brain.12 Critically, theconditioning effects of rTMS are not limited to the stimulated
cortex, but focal rTMS gives rise to functional changes in in-terconnected cortical areas as well.12 Functional brainmapping techniques offer a wide range of methods to mapthe temporospatial patterns of local and distal reorganiza-tional changes in brain function. As such, neuroimagingoffers a valuable means of exploring how rTMS impacts onthe human brain, providing new insights into the change-ability of functional brain networks.15-17
Transcranial stimulation benefits from brainmapping
It is worth bearing in mind that TMS represents a non-physiologic means of producing neuronal activity in thehuman brain. A key question is how this nonphysiologicmode of brain stimulation interacts with the intrinsicneuronal activity in the human brain. Motor evokedpotentials (MEPs) or TMS-induced percepts (eg, phos-phenes) have been used to explore how TMS excites thehuman cortex. Most of the knowledge about the physio-logic mechanisms of actions has been gathered with TMSof the primary motor hand area (M1-HAND) in studies thatrecorded MEPs elicited by single or paired transcranialstimuli in a contralateral hand muscle. Other studiesexamined the behavioral consequences of TMS in well-defined experimental tasks. Although these studies canhighlight the functional involvement of cortical areas inperception, cognition, and motor control, they provide noclues regarding the physiologic mechanisms that cause orprevent a TMS-evoked change in behavior. The limitedinsights into the mechanisms of action revealed by MEPrecordings or behavioral testing motivated the use ofneuroimaging techniques to map the acute and conditioningeffects of TMS on brain function.
General considerations
The timing of TMS relative to neuroimaging
The timing of TMS in relation to neuroimaging defines whichquestions can be tackled using a combined TMS-neuro-imaging approach (Figure 1). In principle, TMS can be appliedwhile neuroimaging is being performed (referred to as ‘‘on-line’’ TMS-neuroimaging approach). Online neuroimagingexperiments are technically demanding because TMS mayadversely affect data acquisition during neuroimaging. Thisrequires methodologic refinements to effectively avoid orcontrol for TMS induced artifacts, especially when combiningTMS with electroencephalography (EEG) or functionalmagnetic resonance imaging (fMRI).
Alternatively, TMS may be applied ‘‘offline’’ before orafter neuroimaging. This ‘‘offline’’ TMS-neuroimagingapproach is technically easier to establish because rTMSand neuroimaging are separated in time. TMS and

Figure 1 The ‘‘online’’ TMS-neuroimaging approach applies TMS while brain mapping is being performed (A). The ‘‘offline’’ TMS-neu-roimaging approach separates TMS from neuroimaging in (space and) time: neuroimaging may be performed before TMS is applied (B) orneuroimaging is performed after the brain has been conditioned with TMS (C). TMS 5 transcranial magnetic stimulation.
Combining TMS with neuroimaging 61
neuroimaging can also be separated in space. For instance,TMS can be applied outside the MRI suite when conduct-ing an offline rTMS-fMRI study. In practice, no specificmethodologic precautions are necessary when offline TMSis combined with any of the available neuroimagingtechniques. (Refer to Table 1 for terminology and definitionof the various TMS-neuroimaging approaches to which werefer in this consensus paper.)
Online approach: Neuroimaging during TMS
TMS may be performed during neuroimaging (ie, onlineTMS). In this case, neuroimaging provides a temporospatialassay of the immediate effects of TMS on neuronal activity(‘‘perturb-and-measure’’ approach; Table 1). If the experi-ment systematically varies the functional state of the brainat the time of stimulation, concurrent TMS-neuroimagingcan probe how the ‘‘neuronal context’’ at the time of
stimulation determines the induced activity changes locallyas well as in connected brain areas (also shown by transcra-nial electric stimulation18,19).
The interpretation of online neuroimaging studies iscomplicated by the fact that TMS results in multimodalsensory stimulation. In addition to the ‘‘direct’’ corticaleffects induced by the time-varying magnetic field, TMShas multiple ‘‘indirect’’ effects on brain activity.20 TMSelicits auditory and somatosensory sensations (eg,activation of the cochlea, trigeminal activation). TheTMS-associated sensory stimulation may produce a startleresponse or be perceived as unpleasant. All of these effectslargely depend on the site and intensity of the stimulationbeing delivered. These indirect effects related to the multi-sensory nature of TMS need to be considered andcontrolled for. Furthermore, experiments and subsequentanalysis must be carefully designed and executed, takinginto account these potential confounds.20 This includes

Table 1 Terminology and definition of TMS-neuroimaging approaches
Online TMS-neuroimaging Concurrent application of TMS and neuroimaging
‘‘perturb-and-measure’’ Neuroimaging during application of single-pulse or burst-rTMS to measure the immediate and transient neuronalresponses caused by TMS perturbation.*
Offline TMS-neuroimaging Consecutive application of TMS and neuroimaging‘‘map-and-perturb’’ Neuroimaging before TMS to map the brain regions/
networks involved in a given task to identify target sites forsubsequent(1) conditioning with rTMS to alter* neuronal processing in
a subsequent behavioural task or(2) single-pulse or burst-rTMS applied during a behavioural
task to transiently perturb* neuronal processing (so-called ‘‘virtual lesion’’) within specific time windows
‘‘condition-and-map’’ Neuroimaging after conditioning with rTMS to map brainareas/networks that show persistently altered* activityduring subsequent(1) resting-state (eg, due to metabolic changes) or(2) task performance (eg, due to rapid reorganisation)
TMS 5 transcranial magnetic stimulation; rTMS 5 repetitive TMS.
*Principally, despite the acute perturbation of neuronal processing, rTMS as well as single-pulse or burst-rTMS can both inhibit and facilitate task perfor-
mance on a behavioral level, critically depending on target area, timing of stimulation and the nature of the task.
62 H.R. Siebner et al
possible interactions among brain areas activated by thedirect effects of TMS on brain activity and indirect(cross-modal) effects on brain activity associated with themultisensory nature of TMS.
Offline approach: Neuroimaging before TMS
Neuroimaging may be performed before a TMS experimentto reveal the temporal (eg, with EEG) or spatial (eg, withfMRI) brain activation pattern during the performance of anexperimental task. The temporospatial information ofregional task-related activity can then be used to definethe optimal time window during which TMS should beapplied during a task and to guide the placement of the coilover the cortical target side. This a priori knowledge is ofparticular value when designing experiments in which TMSis used to interfere with task performance.
This ‘‘map-and-perturb’’ approach (Table 1) can be usedto make causal interferences about the contribution ofa cortical area or its interconnected network to a distinct brainfunction. Although functional brain mapping techniques canreliably identify networks that are activated during an exper-imental task, the correlational nature of neuroimagingprecludes any inference about the causal importance ofa regional brain activation for behavior. This question canbe addressed using TMS. TMS can be applied over the areaof interest to disrupt regular neuronal processing whileparticipants perform the same experimental task. If TMSmodulates task performance, it can be concluded that thestimulated cortical area or its closely interconnected areasmake a relevant contribution to the task.
An early demonstration of this approach was given byCohen et al21 in a TMS study on blind subjects. Previousneuroimaging studies had shown that Braille readingconsistently activated visual cortical areas in blind subjectsbut not in those with sight. To investigate the significance oftask-related activation in the occipital cortex, short trains of10-Hz rTMS were applied over several brain regions time-locked to Braille reading. Occipital rTMS induced errorsand distorted the tactile perceptions of congenitally blindsubjects but had no effects on tactile performance in thenormal sighted. This finding proved that the occipital visualcortex makes a relevant contribution to the processing oftactile input in blind subjects.
In addition, neuroimaging is of great value to localizefunctionally the optimal site for TMS in individual subjects.One possibility is to let subjects perform the experimentaltask during fMRI and use the regional peak activation todefine the target for subsequent TMS.22 Individual peakactivations can then be superimposed on the structuralimage of the subject’s brain and inform frameless stereo-taxy where to position the coil over the cortical regionthat is to be targeted with TMS. An alternative strategy isto base the coil placement on the group result revealed bya functional neuroimaging study that had used the sameor a similar experimental task. The stereotactic coordinatesof task-related peak activation in the area of interest definesthe site of stimulation. This voxel is marked in the normal-ized structural MRI of each subject who participates in theTMS experiment. The individual site of stimulation canthen be derived from the normalized MRIs by reversingthe normalization procedure.

Combining TMS with neuroimaging 63
Offline approach: Neuroimaging after TMS
Neuroimaging techniques have a great potential to maptemporospatial patterns of functional reorganization thatare induced in the human brain by rTMS.12 This scenariorequires that neuroimaging needs to be performed aftera conditioning session of rTMS. This ‘‘condition-and-map’’approach (Table 1) probes the changeability of functionalbrain networks. Among other possibilities, neuroimagingafter rTMS conditioning can map the lasting functionalimpact of rTMS on task-related neuronal activity ata systems level.16,17 Neuroimaging should start as quicklyas possible after rTMS to ensure that short-lasting after-effects of rTMS are captured. The task specificity of func-tional reorganization can be shown by having participantsperform an additional control task during the same fMRIsession.
One way of detecting the conditioning effects of rTMS onregional neuronal activity is to compare task-related activa-tion before and after rTMS. However, any change inactivation may simply be a time effect caused by the factthat the experimental task has been repeatedly performed inthe MRI scanner. To dissociate temporal order effects from‘‘real’’ effects that are causally related to rTMS, theexperimental design should include a control session inwhich subjects perform the same experimental task butwithout effective rTMS. The order of the ‘‘real rTMS’’session and control session should be counterbalanced acrosssubjects, or within the same subjects on different days. In thecontrol session, sham rTMS might be applied to the corticaltarget area. Ideally, sham rTMS should be matched to realrTMS in terms of auditory and somatosensory stimulationbut without effective transcranial stimulation of the cortex. Aspecific change in the pattern of task-related activation afterreal but not after sham rTMS would indicate a true reorgan-isation in response to rTMS conditioning.
Figure 2 Different temporal and spatial scales: Neurostimulation andand spatial resolution.
Temporal and spatial resolution
The temporal and spatial resolution of neuroimagingtechniques represents important selection criteria whenplanning a combined TMS-neuroimaging study (Figure 2).If temporal aspects of neuronal processing are the mainfocus, the use of a neuroimaging method with a hightemporal resolution such as EEG will be preferable.Conversely, a neuroimaging method with good spatial reso-lution and whole brain coverage such as fMRI will beappropriate if the goal of the experiment is to test thespatial pattern of TMS-induced changes in brain activity.
It is also worthwhile to consider the temporal and spatialresolution of TMS in the context of neuroimaging. Thespatial resolution and penetration depth of TMS are limited.When using a figure-8 shaped coil, the maximum electricfield induced in the brain lies in the junction region with thearea of effective stimulation being several square centime-ters. The volume of tissue stimulated by any TMS coildepends on many factors, including the geometry of thecoil, stimulus configuration, stimulus intensity, and theelectrical properties of the stimulated cortex. Anotherimportant feature of TMS is that the induced electric fielddecreases very rapidly with distance from the TMS coil.Hence, TMS induces stronger electric currents in superfi-cial regions than in deeper structures. This explains whysuperficial cortical areas are relatively easy to stimulate,whereas those cortical areas that are located far from thescalp surface are much harder to stimulate. The attenuationof the induced electric field with the distance from the coilalso explains why deep brain structures such as thethalamus and basal ganglia cannot be directly stimulatedwith conventional TMS coils. However, it is important toemphasize that TMS can effectively activate neuronaloutputs that project from the stimulated site to other distantareas of the brain. This means that TMS can modify
neuroimaging techniques are arranged according to their temporal

64 H.R. Siebner et al
ongoing neuronal activity within complex neuronal circuits,and not just those at the site of stimulation.
The temporal resolution of TMS depends on how TMS isapplied (Figure 2). A single TMS stimulus will induce anelectric current in the brain lasting less than 1 millisecond.The electric current in the brain tissue causes a synchronizedhigh frequency burst of discharge in a relatively large popu-lation of neurones that is terminated by a long-lasting GABA-ergic inhibition. This TMS-induced change in neuronalactivity can last for several hundred milliseconds dependingon the intensity of TMS. If short bursts of high-frequency (R5 Hz) TMS are applied, the influence of TMS on neuronalactivity can be prolonged, lowering the temporal resolutionof TMS. Finally, TMS protocols that apply prolonged trainsof TMS can induce changes in neuronal excitability that maylast for more than 1 hour after the end of TMS.9,12 These per-sisting offline effects on brain activity that can be observedafter rTMS conditioning are likely to differ substantiallyfrom the acute neuronal excitation that is directly inducedby the time-varying magnetic field. The bottom line is thatthe spatial and temporal resolution of both the neuroimagingmethod and the TMS protocol, have a substantial impact onthe scientific questions that can be tackled with the combinedTMS-neuroimaging approach.
Electroencephalography and magnetoence-phalography
Basic methodology
EEG is the most commonly used noninvasive recordingtechnique of electric brain activity in humans. By usingsurface electrodes, the EEG measures voltage changes onthe scalp that reflect ion flow caused by excitatory andinhibitory postsynaptic potentials. The scalp EEG is mostsensitive to postsynaptic currents of neuronal populationswhose dendrites are oriented radially to the scalp (locatedin the gyri), whereas currents tangential to the scalp(located in the sulci) do produce weaker EEG signals.
Nonradial (tangential or tilted) electric currents,however, are the main source for the magnetic fields thatare picked up by magnetoencephalography (MEG),rendering MEG and EEG complementary techniques withotherwise similar temporal characteristics. By usingmultiple small detector coils, the MEG principallymeasures the magnetic fields produced by the synchronouspostsynaptic currents of neuronal populations. The excel-lent temporal resolution of both methods lies on themillisecond scale. Spatial resolution, however, essentiallydepends on the number of recording sites. Although high-density EEG (hd-EEG) or MEG can achieve spatialaccuracy close to a few millimeters, the spatial resolutionof standard EEG recordings is in the range of severalcentimeters depending on the number of electrodes. As thesmall signals (microvolt and femtotesla for EEG and MEG,
respectively) rapidly decay over distance, activity in deepbrain structures may be difficult to locate with eithermethod. In the case of EEG, there is additional spatialsmoothing caused by the tissue compartments between theelectrodes and the cortex (skin, muscles, skull, meninges).
EEG can be recorded using a variety of differentelectrode configurations, ranging from a few electrodes(readiness potentials, somatosensory-evoked potentials) tohd-EEG using 64 or up to 256 channels, depending on thepurpose of the study. EEG recordings can reveal temporaland spatial information about externally triggered event-related (event-related potentials, ERPs) or spontaneousbrain activity. The measurement of ERPs requires aver-aging of many short EEG sweeps that are time locked to anexperimentally defined event to subtract ‘‘neural noise’’from the evoked cortical response. Event-related corticalactivity can be quantified by measuring latencies andamplitudes of distinct ERP components. SpontaneousEEG is usually recorded over long periods to assess statesof vigilance or consciousness like wakefulness and sleep. Itcan demonstrate transient spontaneous activity likeepileptic seizures or sleep spindles. EEG analysis ofoscillatory activity is often restricted to distinct frequencybands that are linked to specific neuronal processes.
Technical and safety aspects
When the application of TMS and EEG/MEG acquisitionare separated in time (offline approach), the combination ofTMS and EEG/MEG is methodologically relativelyunproblematic. In offline TMS-MEG studies, TMS shouldbe given outside the MEG room. For combined TMS-EEGstudies, the only point to consider is whether TMS shouldbe applied with electrodes being attached to the scalp. Thedecision might depend on the experimental design as wellas number and montage of electrodes. Standard electrodesincrease the distance between the TMS coil and the cortex.Therefore, TMS with electrodes in place will requirea higher intensity of stimulation to induce a stimulationeffect that matches the effect induced by TMS withoutelectrodes. However, extremely flat electrodes have becomeavailable to minimize this problem.
The simultaneous use of TMS and EEG/MEG is moreproblematic relative to the offline approach. Simultaneoususe of TMS and MEG is impossible with present techniquesbecause of the huge (15 orders of magnitude) differencebetween the magnetic field strengths relevant in MEG andTMS. MEG measures the weak time-varying magneticfields generated by nonradial electric currents in the brain,whereas TMS induces a very strong time-varying electricfield to produce a suprathreshold electric current in thecortex. In contrast, online TMS-EEG was first performed in1997.23 The main problem that one has to face whenapplying TMS during EEG is the powerful electric fieldthat is induced by the discharge of the TMS coils in theelectrode leads. Considering a typical pulse intensity of 1

Combining TMS with neuroimaging 65
Tesla and a rise time of 0.1 millisecond, the voltage inducedin the electrodes underlying the stimulator can reach anamplitude of 10 volts. This voltage, being several ordersof magnitude larger than the signal produced by the brain,can cause large artifacts in the recordings and may put anordinary EEG amplifier out of the operating range fora few seconds. In fact, high-quality EEG recording duringTMS can only be obtained with specifically designedamplifiers. Up to now, a few different technical solutionshave been implemented. Virtanen et al24 developeda 60-channel TMS-compatible EEG system that includesgain-control and sample-and-hold circuits to block theartifact induced by TMS in the leads. This system pinsthe acquired signal to a constant level for a couple ofmilliseconds around the pulse and records TMS-evokedEEG potentials (TEPs) that are completely free from arti-facts. An alternative way to deal with the TMS artifacthas been implemented by Thut et al.25 They use a slew-limited amplifier that prevents the electronics from satu-rating during the TMS pulse resulting in a short-lastingartifact that decays within 30 milliseconds. Finally, Bonatoet al26 have recently used an MRI-compatible DC ampli-fier with a wide dynamic range to successfully recordTEPs preceded by a short artifact (10-20 milliseconds).With this method, recordings have to be obtained withoutany filtering, as these might interact with the TMSartifact, producing ripples for up to a second. However,filtering can be applied after removing artifacts from thedata.27
Beside the artifact induced by discharging the trans-ducing coil, additional high-amplitude artifacts lastingseveral tens of milliseconds are caused by recharging thecapacitors of the stimulating device immediately after thestimulation. A possible workaround is to introduce a delaybetween discharge and the onset of recharging.
Even with an optimal amplifier, TEPs of sufficientquality can only be recorded at the stimulated site ifadditional measures are taken. During the application of theTMS pulse, some current can pass through the electrode-electrolyte interface, thereby causing a polarization and,possibly, an EEG baseline shift that can last for hundreds ofmilliseconds.24 In addition, especially when large tradi-tional electrodes are used, the induced currents can interactwith the magnetic field, causing a force and thus movementof the electrodes. Finally, overheating of the EEG elec-trodes may occur, particularly when long trains of pulsesare delivered.28 All these problems can be effectively ad-dressed using special electrodes, such as ring electrodeswith a slit,2 small Ag/AgCl pellet electrodes, or plasticsensors covered by silver epoxy.29 In addition, these prob-lems of drift, motion, and heating are only evident at elec-trode sites immediately underneath the stimulating coil.24
In all cases, it is strongly recommended to work carefullyon the electrode-to-scalp contact to minimize impedancesas much as possible. Gently scraping the skin with an abra-sive paste before applying the conductive gel normally
results in a suitable impedance level (, 5 kOhm). Recently,minipuncturing of the epithelium under the electrodecontacts has been suggested to reduce skin resistance andthereby TMS artifact size even further.30 Electrode leadsshould be kept relatively fixed and free of loops. Avoidanceof physical contact between TMS coil and electrodes (eg,by foam) can reduce some mechanical artifacts inducedby coil vibrations.27 However, this will increase the coil-to-cortex distance and thus, adversely affect the efficacyof TMS.27
If the TMS coil is positioned over scalp and facial nervesor muscles, these may be activated, resulting in a largebiologic muscle artifact lasting for tens of milliseconds.Unless new strategies, such as optimal pulse shapes orshielding devices, are developed to minimize scalp muscleactivation, this kind of artifact can not be eliminated. Fornow, the problem can be avoided only by moving the coil toa more favorable location (more central scalp regions), ororientation, and/or by reducing the strength of stimulation.The coil’s discharge is associated with a loud click (up to130 dB), which might trigger a blink reflex and thereby eyemovement artifacts in the EEG. More importantly, thisnoise obviously evokes an undesired auditory response thatoverlaps with TEPs.31 This major confound can be effec-tively eliminated by using earplugs and additionally mask-ing the coil’s click with white noise, or with a sound thathas an optimal spectral content.32 By stimulating sensorynerve fibers of the cranial nerves, TMS may also triggersomatosensory evoked potentials. However, their contribu-tion to the overall activation appears to be negligible.26,33
As for behavioral TMS studies, the stimulation of controlsites or the use of a proper sham stimulation can be helpfulto disentangle the contribution of the different sources.27
Although coil placement by means of MRI-guidedframeless stereotactical neuronavigation has alreadybecome state of the art, it is of superior importance incombined TMS-EEG studies. Small shifts in coil orienta-tion can cause marked changes in TEPs. Here neuronaviga-tion is able to provide a high degree of reproducibility, evenacross separate sessions.34 Some commercially availablenavigation systems even provide an estimation of locationand strength of the maximum electric field induced in thecortex based on realistic head models.35 Future navigationsystem might also incorporate information about theorientation of axons in the stimulated area.36
Neuroscientific and clinical applications
As pointed out above, the simultaneous use (online) is onlypossible when TMS is combined with EEG (but not withMEG), whereas TMS-MEG as well as TMS-EEG both canbe combined consecutively (offline). Furthermore, themajority of published articles in the field have combinedTMS with EEG rather than with MEG. Therefore, we willmainly focus on the combination of TMS and EEG in thisreview.

66 H.R. Siebner et al
The offline TMS-EEG approach can be applied in bothdirections. When using EEG (or MEG) before TMS, thespatial distribution of cortical activity (eg, ERPs) inmultichannel EEG can inform the experimenter where toplace the TMS coil. More importantly, the excellenttemporal resolution of EEG (and MEG) offers the possi-bility to optimize the timing of TMS based on the temporalsignature of task-related EEG activity of each subject. Thismay help to determine the optimal time window for theinduction of disruptive TMS effects in a subsequentbehavioral TMS experiment.
Likewise, recordings of ERPs or spontaneous EEG can beused to study the lasting impact of rTMS on corticalprocessing. For instance, multichannel EEG recordingsduring sleep demonstrated changes in sleep associatedoscillatory activity patterns (ie, slow oscillations and sleepspindles) in response to 5Hz rTMS of the dorsal premotorcortex37 or paired associative stimulation of the M1-HAND.38-40 Moreover, using a correlative approach, alteredEEG theta power after 40 hours of prolonged wakefulnesscould be related to changed motor cortical excitability asdetermined by paired-pulse TMS measurements.41
The online TMS-EEG approach offers several additionalpossibilities. First, the EEG activity just before a TMSstimulus is applied contains information about the func-tional state of the stimulated cortex at the time of TMS.This information may be used to study the state dependencyof the brain’s responsiveness to TMS. The regionalexpression of spontaneous oscillatory activity directlypreceding a TMS pulse may be predictive of the brainresponse to TMS. This has been shown for the expressionof occipital alpha activity and the capability to evokephosphenes with occipital TMS.42 Second, online EEGrecordings have revealed TMS induced changes in thefrequency domain. For instance, a single TMS pulse cantransiently synchronize activity in the beta range.43 Further-more, trains of 1-Hz and 5-Hz rTMS are associated withconcurrent changes in cortical alpha and beta activity.44,45
Third, functional connectivity between cortical areas ina given task can be investigated by probing the effect ofTMS over one cortical site on the ERPs evoked in anotherarea. This approach has been used to study the role of thefrontal eye fields in controlling visual processing in poste-rior visual brain areas during the orienting of spatial atten-tion46 and the influence of the dorsal medial frontal cortexon lateralized action potentials in primary motor corticesduring conflict resolution in an action selection task.47
Application of TMS to the posterior parietal cortex duringa visual search task also modulated the occipital N2pccomponent that is evoked by target detection.48
Finally, recording the TEPs provide a means of directlystudying the excitability and response characteristics ofpractically any cortical area that is accessible to TMS.Beforehand, this was possible only by using indirectmeasures such as MEPs in the primary motor cortex orphosphenes in visual areas. A single TMS-pulse evokes
a cortical potential waveform in the EEG, which stronglydiffers in polarity and amplitude of its peak componentsdepending on several factors such as position and orienta-tion of the TMS coil, stimulation intensity, electrodeposition, and reference. However, suprathreshold stimula-tion (biphasic pulse configuration) of the motor hand areawith a coil orientation eliciting a posterolateral-to-anterio-medial current in the brain reliably evokes a response at thevertex (referenced to linked mastoids) with the followingcomponents: N10, P14, N15/18, P30*, N40/45*, P55/60,N100*, P180/190, and N280 (* indicates the most reliableones).26,43,49 As an alternative to peak analysis, especiallyfor hd-EEG recordings, the calculation of global mean fieldpower (GMFP)50 has been introduced as a reference-freemeasure of local EEG variability. As the number of neuronsrecruited by a single TMS-pulse is directly related to theirexcitability, GMFP amplitude change has been proposed asa measure of cortical excitability, which is sensitive toTMS-induced changes in cortical plasticity.37,38,51 More-over, in combination with source localization, the temporo-spatial propagation of TMS-evoked cortical activity can betraced32,52,53 to gain insight into the temporospatialdynamics of the corticocortical connectivity patterns thatare activated by TMS. The online TMS-EEG approachcan directly probe regional cortical excitability and cortico-cortical connectivity in humans. During a typical TMS-EEG session it is possible to (1) measure the strength ofits immediate response in the cortical target area ofinterest,54 (2) detect the temporospatial dynamics of theensuing spread of activation,23,32 (3) calculate corticocorti-cal conduction times,33 and (4) quantify complex dynamicssuch as phase locking or power modulation of EEGrhythms.43-45,55
Excitability and connectivity are essential properties ofthe nervous system and are abnormal in many neurologicand psychiatric disorders. They also can be altered byagents affecting brain function such as alcohol.56,57 AsTMS-EEG stimulates and records from the cerebral cortex,by-passing sensory pathways, subcortical structures, andmotor pathways, the measurement does not depend on theintegrity and status of sensory and motor systems and canbe applied to any subject (deafferentiated, paralyzed,unconscious). Future clinical applications of TMS-EEGmay therefore include: (1) measuring the excitability andthe connectivity of frontal circuits in schizophrenia58 anddepressed patients, (2) measuring corticocortical conduc-tion times in multiple sclerosis and neurodegenerativedisorders, (3) monitoring the excitability of the lesionedand the contralateral homologous cortex after stroke, and(4) assessing the state of thalamocortical circuits in patientswith impaired consciousness that are unable to communi-cate. More generally, TMS-EEG can be used to prospec-tively track and monitor the excitability and connectivitychanges occurring in any cortical region during rehabilita-tion, pharmacologic therapy, TMS treatment, or sponta-neous recovery.

Combining TMS with neuroimaging 67
Conclusion/Summary
The main advantage of EEG, compared with other TMS-imaging approaches, is its millisecond-scale temporalresolution, which allows one to measure the immediatecortical response to TMS. TMS triggers a combination offast excitatory and inhibitory events in the stimulated area59
that may cancel each other if averaged over time. Indeed,although TEPs invariably detect a strong activation in thestimulated area, positron emission tomography (PET) andfMRI often fail to do so.60,61 In addition, TMS-EEGconveys precise information about the temporal order ofactivations of distant cortical areas. Likewise, the techniquecan also reveal, in real-time, TMS-induced oscillations withobvious safety implications and possible practical applica-tions.52 Its high-temporal resolution renders the EEGmethod a perfect complement to the transient perturbationscaused by TMS in the brain’s oscillatory processing modes.
Other advantages of TEPs are their high signal-to-noiseratio and the fact that they can be easily collected at thepatient bedside at a relatively low cost. The main disad-vantage of TEPs is their low spatial resolution, which canpartly be compensated for by increasing electrode densityand by performing advanced source modeling, yet thecombined TMS-EEG approach is of limited use to mapTMS induced activations in deep brain structures. Anotherlimit is its susceptibility to artifacts, such as muscleinterference and eye blinks, currently preventing thecollection of clean TEPs when temporal and orbitofrontalcortices are stimulated.
The combined TMS-EEG technique is still in its earlyage and much methodologic work is needed to fully unfoldits potential. For example, the contribution of differentartificial and noncortical biologic sources to the TEP hasyet to be disentangled to allow a fully comprehensiveinterpretation. Especially the very immediate corticalresponse to TMS within the first 10 or 20 millisecondsafter TMS is still not fully accessible. Further research hasto characterize the reproducibility of TEPs and gainnormative data as well as knowledge about their changesin health and disease.
Functional MRI
Basic methodology
Among the neuroimaging techniques, the elegance of fMRIlies in its ability to measure the metabolic consequences ofneural activity through changes in endogenous oxy- anddeoxyhemoglobin concentration. Deoxyhemoglobin isparamagnetic and causes local magnetic field inhomoge-neities that reduce the measured MR signal. Consequently,increased deoxyhemoglobin leads to a decreased MRIsignal intensity and therefore acts as an endogenous
contrast agent. Because this so-called blood-oxygenation-level-dependent (BOLD) contrast is tightly coupled tocerebral blood flow, neuronal activity, and energy use,regional changes in brain activity can be inferredthroughout the human brain, including subcortical struc-tures (for a comprehensive overview, ref. 62). FunctionalMRI can measure such activity changes with a spatial reso-lution of a few millimeters. Its temporal resolution is on theorder of seconds because changes in blood flow are delayedand more prolonged with respect to the underlying neuralresponses. Yet the hemodynamic lag is highly constant. There-fore, by using the appropriate design, one can ‘‘decorrelate’’events and differentiate neural population activity-changesto events only a few hundred milliseconds apart. 63,64 StandardfMRI experiments acquire a large series of brain volumes(images) while the subject performs a task. The ensuing MRsignal time series in each volume element (voxel) is then corre-lated with the experimental manipulation. Consequently, overthe past 2 decades, fMRI has been uniquely successful ininvestigating the functional neuroanatomy in health anddisease.
Technical and safety aspects
The high magnetic field strength of modern MRI scanners(between 1.5-7 T) imposes several limitations and chal-lenges for its simultaneous combination with TMS, whichwas first performed by Bohning et al.60,65 One can distin-guish two principle problems for combined TMS-fMRI:static and dynamic artifacts. The former arise through themere presence of the TMS setup itself, whereas the latterare due to operating the TMS setup, such as applyingTMS pulses during fMRI.
Static artifacts
For safety reasons, all ferromagnetic material must beremoved from any equipment (eg, TMS coils) entering theMRI scanner.60,66 At the same time, MRI-compatible TMScoils need to withstand the increased mechanical stressduring MRI. However, the presence of the MRI-compatibleTMS coil may still lead to geometric image distortions.67,68
These can be reduced by a shorter read-out time of echo-planar imaging (EPI) sequences, using stronger imaginggradients and/or parallel imaging. Oversampling of EPIimages in phase-encoding direction can shift so-called‘‘ghosting’’ artifacts outside the central field of viewwithout compromising image resolution and compromisingtemporal resolution only minimally. Other parts of the stim-ulator unit must be safely placed outside the scanner roomor in a radiofrequency-shielded cabinet inside the scannerroom, at sufficient distance from the magnetic fringe fieldof the MRI scanner. This requires an increase in TMScoil cable length that may bring about unwanted increasesin serial inductance, diminished effective TMS coil output,

68 H.R. Siebner et al
and increased power requirements. TMS coil movementcan be minimized with MR-compatible TMS coil holdersthat allow safe and accurate placement of the coil insidethe scanner. MR-compatible automatic and computer-oper-ated TMS-coil holder and positioning systems provideadditional accuracy and reproducible positioning,69 butare technically more challenging to implement.
Dynamic artifacts
Radiofrequency (RF) noise can additionally affect thesignal-to-noise ratio of MRIs, but this may vary widelybetween different TMS and scanner setups. TMS stimula-tors may directly generate RF noise (eg, around 64 MHz at1.5 T), and the antenna-like properties of the TMS coilcable can additionally guide RF noise into the scanner.Customized RF filtering can suppress this noise. Additionalimage distortions and artifactual signal changes may occurthrough leakage currents that originate through the high-voltage capacitors of the TMS stimulator. These leakagecurrents can change with different charge levels (outputlevel) of the TMS machine, and can potentially lead tosignal changes that are in the same order as physiologicBOLD signal changes. Remote-controlled high-voltagerelay-diode systems can reduce leakage currents flowingbetween the stimulator and the TMS coil by several ordersof magnitude, thus permitting BOLD-sensitive imaging inthe direct vicinity of the coil.70,71 The strong magneticpulses induced by TMS can furthermore distort MRIs.The size of such distortions depends on several factors,such as TMS coil orientation, TMS pulse intensity, andMRI magnetic field strength.66,68 The problem can be alle-viated by applying sufficient temporal gaps between TMSpulses and subsequent MRI acquisition.72 Increasingdistance between the imaged brain slice and the TMScoil67,68 further alleviates the problem. Direct TMSpulse–EPI excitation pulse interference should be avoided,and images being perturbed by TMS pulses must be re-placed. This can be achieved through interpolation betweenpreceding and subsequent (unperturbed) MRIs.70,72,73
While interleaving TMS with fMRI is technicallychallenging, offline studies in which TMS is given beforeor after an fMRI session are easy to perform because TMScan be given outside the room where fMRI is performed.
Neuroscientific and clinical applications
Concurrent TMS-fMRI holds great promise to supplementour understanding about the immediate and rapid changesTMS can evoke in cortical networks.74 One way is to useTMS-fMRI in a ‘‘perturb-and-measure’’ approach75 thatcan inform about the activity changes evoked by TMS ata systems level, by characterizing TMS-evoked BOLD-signal changes throughout the brain at rest.60,76-80 Here,TMS serves as a causal input into the operation of a corticalregion, whereas fMRI measures distributed activity changes
evoked by this input. This is of interest as one can in principlenow reveal the spatial topography of TMS effects at high-spatial resolution, including retinotopic early visual cortex81
and subcortical structures.78,80 In the motor60,76-80 and visualsystems,73,81 this has revealed that even short TMS pulseseries (500 milliseconds-10 seconds) can activate putativelyinterconnected cortical and subcortical brain regions ipsilat-erally and contralaterally to the stimulation site.
Furthermore, TMS-fMRI can disclose how such remoteTMS-induced activity changes interact with psychologicfactors such as task-state.70 Increasing evidence suggeststhat the effects of TMS are dependent on the state of acti-vation at the time of stimulation. Recently, Bestmann etal70 could show that the effects of short trains of TMS(11 Hz, 5 pulses) applied to left dorsal premotor cortex(PMd) reversed during performance of a weak left-handpower grip, compared to rest (Figure 3). During rest,TMS applied at a suprathreshold intensity decreasedcontralateral primary motor cortex and PMd activity,compared with a low-subthreshold intensity. By contrast,stimulation at the suprathreshold intensity increasedtask-related activity in these regions during power grip,compared with low-intensity stimulation. This findingillustrates how concurrent TMS-fMRI can map out causalinteractions among brain regions and their dependence onactivation state.
Online fMRI has also been successfully established inconjunction with TES, in which a strong rapidly varyingelectric current rather than a time varying magnetic field isapplied to stimulate cortical neurons.18,19 Single supra-threshold electrical stimuli induced a positive BOLDresponse both in the ipsilateral as well as in the homotopiccontralateral M1-HAND, with the latter presumably result-ing from transcallosal connections. Accordingly, whena contralateral conditioning stimulus preceded the test stim-ulus by 10 milliseconds (interhemispheric inhibition), thesubsequent ipsilateral BOLD signal was significantlyreduced.19 Thus, cortical inhibitory processes are accompa-nied by attenuation of the local neurovascular signal. TESduring fMRI has the advantage that there are no spatialconstraints when placing the stimulating electrodes. Incontrast, placing a bulky TMS coil between the head andthe MRI head coil is often problematic because of spacelimitations. A major drawback of combining TES withfMRI is that TES is more painful relative to TMS.
Concurrent TMS-fMRI has also been successfullyapplied to measure the distribution of activity changesduring behavioral studies,82 causal top-down influencesbetween brain regions in the visual system,73,81 sensoryprocessing,83 as well as the cortical signatures of anTMS-evoked sense of movement after upper limb amputa-tion.84 These findings suggest that attributing the behavioralconsequences of TMS to the stimulation site often neglectsremote activity changes induced by TMS and their contri-bution to possible behavioral consequences. ConcurrentTMS-fMRI can reveal how these behavioral consequences

Figure 3 State-dependent interregional interactions evoked by transcranial magnetic stimulation (TMS) (A) Main effect of left hand grip,irrespective of TMS stimulation intensity. This illustrates how one can obtain blood-oxygenation-level-dependent (BOLD) activation mapsduring concurrent application of TMS pulses (5 pulses, 11 Hz) inside an magnetic resonance image (MRI) scanner. (B) Task-state depen-dent effects of TMS on causal interactions in the human motor system. At rest, TMS applied to the left dorsal premotor cortex (PMd)increased activity in contralateral PMd and primary motor cortex (M1) at high stimulation intensity (110% of resting motor threshold),compared with stimulation at a lower control intensity (70% active motor threshold). By contrast, this effect was reversed during a simplemotor task that activated right PMd and M1. Now high-intensity stimulation increased task-related activity, compared with lower intensitystimulation. The results show how TMS can causally affect activity in contralateral regions, and that these influences are dependent on theactivation state of these regions (adapted from Bestmann et al70,72).
Combining TMS with neuroimaging 69
emerge through concerted causal interplay among intercon-nected brain regions; alternatively, concurrent TMS-fMRIcan show rapid compensatory activity changes that mayprevent behavioral perturbation. Therefore, anotherexciting prospect of concurrent TMS-fMRI is to study thecapacity of the brain to rapidly react to perturbations(caused by TMS), owing to the degeneracy in cognitiveanatomy.85
In general, these approaches provide unique insight intothe physiologic underpinnings of TMS, and the interre-gional layout of causal interactions. For clinical applica-tions of TMS, this may be of critical importance becausetheir effectiveness is commonly inferred indirectly throughan improvement of clinical symptoms. It is often unknown,however, whether TMS actually targets and affects thebrain regions implied in a specific clinical symptom. Liet al86 have used concurrent TMS-fMRI in chronicallydepressed patients to investigate the brain regions affectedby stimulation of left dorsolateral prefrontal cortex(DLPFC), a region often linked to major depression. Notonly was 1-Hz TMS associated with increased activity atthe site of stimulation, but also affected putatively intercon-nected regions including the bilateral middle PFC, rightorbital frontal cortex, and insula. This study demonstratesthat TMS to DLPFC can indeed affect entire brain
networks associated with depression. Concurrent TMS-fMRI therefore holds promise to identify the brain regionstargeted by clinical TMS applications, and thereby toincrease their safety and effectiveness as well as pointout novel strategies for TMS therapy. Li et al86 have alsoshown how the interleaved TMS technique can be usedto assess the modulatory effects of medications. Healthysubjects were scanned with interleaved TMS-fMRI overmotor cortex while they were on or off lamotrigine, an anti-convulsant. Predictably, there was less TMS-induced motorcortex activation when subjects were on medication. Para-doxically, the exact opposite pattern occurred when thesesame subjects were stimulated over the PFC. There, the la-motrigine caused an increase in TMS-induced prefrontalactivation.87
There is also a substantial potential for offline TMS-fMRI studies. First, fMRI can be used to guide the coilplacement in a subsequent behavioral TMS experiment(fMRI-guided TMS).22 Second, fMRI can map the func-tional consequences of a conditioning rTMS session onneuronal activity across the whole brain.88,89 For instance,offline fMRI has been successfully applied to examineshort-term reorganization in the right PMd after 1-HzrTMS to the left PMd.17 Although rTMS had no effect onbehavior, fMRI revealed increased activity in the right

70 H.R. Siebner et al
PMd and connected medial premotor areas during actionselection but not simple action execution. Because subse-quent online TMS of the reorganized right PMd impairedaction selection, it was concluded that the functional reor-ganization as revealed by fMRI played a causal role inmaintaining behavior after an rTMS induced interferencewith neuronal processing in the left PMd.
Conclusion/Summary
The future of TMS critically relies on identifying itsmechanisms of action across the brain in more detail. Onepromising approach is the combination of TMS and BOLDfMRI. In measuring causal interactions throughout the brain inhealthy humans, TMS-fMRI can therefore address questionsthat otherwise would be difficult to approach. In addition toBOLD sensitive MRI, several groups have started to combineTMS with other MR techniques such as MR spectroscopy90,91
or arterial spin labeling,92 which will reveal further valuableinsights into the impact of TMS on brain function.
Structural MRI
Basic methodology
There are various MRI sequences that provide differentinsights into brain structure. Conventional structural imagingprotocols include T1-weighted, T2-weighted, diffusion-weighted, and proton-density scans. These different proto-cols result in different tissue contrast, allowing particularanatomic or pathologic features to be visualized more easily.In the clinical setting, for example, T2-weighted images areparticularly sensitive to inflammation, such as acute multiplesclerosis lesions; diffusion-weighted scans are most sensitiveto very early pathologic changes following stroke; whereasT1-weighted images provide optimal contrast between greyand white matter and are therefore commonly used to providefine anatomic detail. In a research setting, novel protocolshave been developed to provide even richer anatomicinformation. For example, quantitative mapping of therelaxation contrasts, T1 and T2, can now be achieved overthe whole brain at reasonable resolution in a feasible time.Such parameters are sensitive to pathologic factors and toanatomic microstructure. Extensions to conventional diffu-sion-weighted imaging (DWI) include acquisition of greaternumbers of diffusion directions, which allows measurementof the directional dependence, or fractional anisotropy (FA),of the diffusion signal. This is a useful property to measure asFA reflects white matter integrity, and is therefore sensitive tochanges in development, ageing, and disease. In addition, inwhite matter fiber bundles, the principal diffusion directioncorresponds to the principal fiber direction and therefore, byfollowing these directional estimates through white matter, itis possible to reconstruct the path of fiber bundles, to perform‘‘diffusion tractography.’’
Technical and safety aspects
Given that structural imaging techniques, on the whole,provide static information, there is no particular reason foracquiring simultaneous TMS and structural MRI data (incontrast to the situation with fMRI, for example). Yet, as anMRI scanner can actually image the magnetic field createdby a TMS coil, Bohning et al93 demonstrated that one couldacquire a phase map of the magnetic field distortionscaused by running a constant current through a TMS coil.This TMS phase map, with appropriate scaling, can thendirectly image the magnetic field of the TMS coil overthe subject’s anatomy. However, in general, researchershave tended to relate TMS effects to structural dataacquired separately. Therefore, there are no major technicalchallenges raised by combining these techniques.
Generic methodologic issues arise over acquisition,analysis, and interpretation of structural MRI data. Typicalapproaches to processing T1-weighted structural datainclude voxel-based and tensor-based morphometry(VBM94 and TBM,95 respectively) analyses. The VBM/TBM data processing includes segmentation of imagesinto different tissue types (grey matter, white matter, cere-brospinal fluid), smoothing of resulting partial volume esti-mates, coregistration of images into standard space, andstatistical comparison of voxel density values (VBM) orvoxel displacement vectors (TBM) across subjects. Eachstep of this process raises issues. For example, the size ofthe smoothing kernel will greatly influence sensitivity toeffects of different sizes. A number of groups are nowalso running VBM-style analyses of diffusion parameters,most commonly FA, which can be correlated with, forexample, behavioral measures or the size of TMSeffects.96-99 Interpretation of FA correlates should vary de-pending on whether effects are seen in white matter or greymatter, and whether this localization is consistent acrosssubjects after normalization. It is therefore important thatregions of FA correlation are carefully localized in indi-vidual subjects, or that alternatives to VBM, such astract-based spatial statistics,100 or tractography-based defi-nition of regions of interest, are used.
DWI can also be combined with TMS by using theanisotropic conductivity information to inform models ofthe current spread induced by a TMS pulse.36
Neuroscientific and clinical applications
The relationship between neuroanatomy and neurophysi-ology is a fundamental issue in neuroscience and is of clinicalrelevance. Caused in part by recent technologic advances inMRI, the neurosciences have seen an explosion of studiesrelating brain structure to function, where function is oftenassessed via behavior. Behavioral measures of function,however, reflect the aggregate operation of multiple brainregions. By contrast, TMS enables researchers to probe thephysiology of a specific brain region, or functional

Combining TMS with neuroimaging 71
interactions between regions, both during resting andparticular cognitive states. Such physiologic indices mayprovide more sensitive and informative measures with whichto compare structural measures.
TMS-EMG measures of primary motor cortical excit-ability have been shown to correlate with gross conventionalMRI volumetric measures, such as white matter hyper-intensity volume and ventricular volume.101 The majorityof studies relating TMS to structural measures, however,have used measures derived from DWI. Recent work indi-cates that individual differences in cortical excitability andfunctional connectivity are associated with normal variationin white matter integrity in healthy adults. Primary motorcortical excitability, for example, was shown to correlatepositively with FA in white matter underlying primary motorand premotor cortex, as well as parts of the corona radiata,internal capsule, cerebral peduncles, and corpus callosum(Figure 4A),99 suggesting a substantial corticocortical contri-bution to motor threshold variation in healthy adults. Paired-pulse TMS, giving a measure of physiologic connectivitybetween stimulated cortical regions, has been recently usedto interrogate the microstructural correlates of functionalconnectivity in healthy adults.96-97 In one study, resting-statephysiologic connectivity between hand regions of the left andright primary motor cortex was correlated positively with FAin hand callosal motor fibers identified with combined fMRIand diffusion tractography, but not adjacent foot fibers(Figure 4B), demonstrating an impressive degree of selec-tivity even within subregions of the same fiber bundle.97 Inthe only study to date testing the importance of cognitivecontext to these relationships, functional connectivity fromPMd to contralateral primary motor cortex, specificallyduring an action selection task, was positively correlatedwith FA in white matter underlying the premotor and primarymotor cortex, the corpus callosum, and the superior longitu-dinal fascicles (Figure 4C).96 Moreover, diffusion tractogra-phy from these regions of correlation reproduced the specificparietal-dorsal premotor-contralateral premotor-motornetworks predicted to mediate the physiologic effects byprevious fMRI findings.
The potential power of this approach is also evident ina clinical setting, where longer central motor conduction timeto both the hands and legs has been associated with reducedFA in motor, premotor, and corticospinal tract white matter inpatients with amyotrophic lateral sclerosis (ALS) with andwithout clinical symptoms of upper motor neuron disease.102
Moreover, the presence of MEPs and the degree of cortico-spinal tract FA asymmetry predict the extent of functionalrecovery in chronic stroke.98 These findings highlight thepotential complementary value of combining TMS withDWI in both clinical diagnosis and prognosis.
Conclusion/Summary
Combination of TMS and structural MRI provides powerfulapproaches for testing the relationship between structure
and function in the human brain. This approach enables usto address questions relating to development, ageing, andindividual differences, as well as providing measures thatcould have important clinical application.
PET
Basic methodology
PET maps the regional binding and metabolism ofcompounds that have been tagged with short-lived posi-tron-emitting isotopes such as carbon-11, oxygen-15, orfluorine-18. The emitted positrons, when they annihilatewith electrons, produce pairs of gamma rays that aredetected by the PET scanner. The resulting PET imagesprovide three-dimensional (3D) maps of the tracer distri-bution in tissue. PET offers a range of possibilities to studyhuman brain function.103 Using different radioactive tracers(radioligands), PET can quantify changes in regional cere-bral blood flow (rCBF) or regional cerebral metabolic rateof glucose (rCMRglc).104 Because rCBF and rCMRglc aretightly coupled with synaptic activity, PET imaging ofregional blood flow or glucose metabolism provides anindex of regional synaptic activity at rest and duringspecific tasks. Other radioligands can be used to examinespecific neurotransmitter and receptor systems, or to mapamino-acid uptake or microglial activation.104,105 Theradioisotope-based imaging technique with the highestresolution and greatest sensitivity to differentiate betweennormal and abnormal functional states is 3D PET. Themost available technique, however, is single-photon emis-sion computed tomography (SPECT). SPECT uses radio-isotopes with a long half-life and does not require an on-site cyclotron. SPECT and PET are discussed togetherbecause the general issues regarding the combined use ofSPECT and TMS are identical to those encountered whencombining TMS with PET.
Technical and safety aspects
The most important drawback of PET and SPECT is theexposure to radiation. This limits the number of measure-ments that can be performed in human subjects. It alsoadversely affects the general acceptance of the method.Because radiation exposure is far less problematic inanimals, serial PET measurements in animals are veryuseful to assess long-term effects of TMS on brainactivity. In anesthetized monkeys, Hayashi et al106 per-formed four 18FDG-PET measurements before, during,as well as 8 and 16 days after 2000 stimuli of 5-HzrTMS were applied over the right precentral gyrus.They found that the rTMS decreased rCMRglc in motor/premotor cortices, whereas rCMRglc in the anterior/posterior cingulate and orbitofrontal cortices wasenhanced. Critically, these changes in regional

Figure 4 (A) Correlations between fractional anisotropy (FA) and primary motor cortical excitability (as measured by resting motorthreshold) for left (left) and right (right) M1 (after Kloeppel et al99). (B) fMRI-defined M1 representations (lip: light red; hand: light green;foot: yellow) and tracked CMFs (lip: dark red; hand: dark green; foot: orange) visualized as three-dimensional objects in one subject (top).Hand but not foot FA measured from the midbody of CMFs correlated significantly with the degree of interhemispheric inhibition betweenthe hand areas of M1 (bottom) (after Wahl et al97). (C) Local regions of correlation between functional connectivity from left dorsal pre-motor cortex (LPMd) to right M1 during action selection and FA in white matter underlying LPMd, RPMd, and the superior longitudinalfascilculus (SLF) (left column). Probabilistic diffusion tractography from the clusters of correlation demonstrating the white matter tracts inwhich local correlations were found and their gray matter targets (right column) (after Boorman et al96).
72 H.R. Siebner et al
metabolism persisted for at least 8 days.106 Such a longitu-dinal study would be impossible to perform in humansbecause of the excessive exposure to radiation.
No specific methodologic precautions are required ifTMS is given outside the scanner before or after PET
measurements (ie, offline TMS). TMS during PET (ie,online TMS) is also easy to establish. After initialconcerns,107 there is now consensus that the phasicmagnetic field produced by each TMS pulse does not affectthe function of the PET detectors.108 The TMS coil on the

Combining TMS with neuroimaging 73
subject’s head, however, attenuates the radiation that ispicked up by the PET detectors. Therefore, it is necessaryto acquire a transmission scan with the TMS coil in situto correct for coil-induced signal attenuation during prepro-cessing. If two cortical areas are sequentially targetedduring the same PET experiment, one needs to have sepa-rate transmission scans for each of the coil positions.
An advantage of the combined PET-TMS approach isthat all currently available rTMS protocols can be given inthe PET scanner since PET does not impose any temporalconstraints on TMS. The PET environment imposes lessspatial constraints to position the coil than MRI, renderingit possible to use frameless stereotaxy to place and monitorthe coil position during online imaging.109,110 Alternatively,correct coil position can be identified with frameless stereo-taxy outside the scanner and marked on the subject’s head.The coil can then be centered on the marked area after thesubject has been positioned in the scanner. Correct place-ment of the coil can be verified on the transmission scanwhere the coil is clearly visible. The anatomic location ofthe coil can be determined by coregistering the transmis-sion scan on the individual structural MRI scan.110 In addi-tion, a vitamin E capsule can be taped on the scalp underthe center of the coil, and the correct placement of thecoil can be confirmed with standard T1-weighted structuralMRI after the end of PET measurements.
For target areas close to the central sulcus, the TMS-induced motor response can alternatively be used tolocalize the primary motor cortex, which can be used asa reference area to locate somatosensory or premotorareas.15 Some groups have also used the international 10-20 system for placement of EEG electrodes to localizethe site of TMS. A drawback of this approach is that the10-20 system does not take into account interindividualdifferences in cortical anatomy. In addition to correct coilplacement, it is essential to ensure a constant coil positionduring consecutive PET measurements. A mechanical orrobotic fixation unit should be integrated in the bore ofthe PET scanner for positioning and fixating the coil overthe cortical target area. In addition, coil position shouldbe checked between consecutive PET measurements.
Neuroscientific and clinical applications
Most studies combined TMS with PET techniques thatmeasure regional synaptic activity over several tens ofseconds (H2
15O-PET of rCBF) or minutes (18FDG-PET ofrCMRglc). Because of its low temporal resolution, contin-uous train or intermittent bursts of rTMS need to be givento induce a detectable change in regional neuronal activity.A single PET scan always represents the cumulative effectsof individual stimuli on regional synaptic activity duringthe period of measurement. This feature defines thestrength and weakness of the combined TMS-PETapproach: On the one hand, the combined TMS-PETapproach is not suited to examine the effects of a single
pulse or a short train of TMS on regional neuronal activity.On the other hand, combined TMS-PET measurements canreadily probe cumulative changes in regional neuronalactivity in the stimulated cortex and connected brainregions during rTMS because the neuronal effects of eachstimulus can sum up during a single PET scan.
TMS can be applied during concurrent PET measure-ment of regional neural activity to visualize immediateeffects of TMS on regional synaptic activity in thestimulated cortical area and connected brain regions. PETof rCBF or rCMRglc during the administration of TMS canmap immediate TMS-induced changes in regional activityand connectivity independent of behavior. This ‘‘online’’approach has been successfully used to assess how TMS-induced changes in neuronal activity depend on theintensity, frequency, or site of TMS.109-114 Most studiesexamined the acute effects of TMS on rCBF or rCMRglcwhile participants were at rest, but online TMS-PETimaging can also be used to examine how focal TMS inter-acts with the regional activation pattern during a specifictask.115,116
Although early TMS-PET studies focused on acuteeffects on rCBF or rCMRglc produced during TMS, morerecent studies examined how rTMS shapes regionalneuronal activity in the human brain beyond the time ofTMS. Serial PET measurements of rCBF can track thetime-course of functional after effects induced by rTMSboth at rest and during a task.16,117 A H2
15O-PET studyshowed that 1-Hz rTMS given at an intensity of 90%resting motor threshold to left primary motor cortex (M1)caused bilateral increases in regional neuronal activity inprimary motor and premotor cortices and cerebellum rela-tive to sham rTMS.16 The same 1-Hz rTMS protocolapplied to left PMd yielded bilateral decreases in activity(compared with sham rTMS) in primary motor, premotor,prefrontal, and subcortical areas.15 Changes in rCBF per-sisted for at least 1 hour after the end of rTMS, showingthat rTMS can produce lasting effects on regional neuronalactivity in the stimulated cortex and connected brainregions.
From measurements of the MEP, it is known that 1-HzrTMS to M1 or PMd can reduce the amplitude of MEPselicited in the conditioned M1. Despite of similar suppres-sive effects on corticospinal excitability, the PET measure-ments revealed marked differences in the effects of 1-HzrTMS over M1 or PMd on regional neuronal activity. TwoPET studies examined changes both in cortical excitability(by measuring MEPs) and in regional neuronal activity (bymeasuring rCBF) in response to focal rTMS.118,119 Choui-nard et al118 correlated changes in MEP amplitude after1-Hz rTMS to M1 or PMd with changes in rCBF beforeand after rTMS. They identified a number of brain regionsin which decreases in MEP amplitude were associated withincreased rCBF after rTMS. The regional patterns of corre-lations differed according to whether rTMS had been givento PMd or M1. Taken together, these results provide

74 H.R. Siebner et al
converging evidence that the after effects of rTMS criticallydepend on the site of rTMS. They also highlight that it isproblematic to draw simple parallels between changes inoverall regional neuronal activity (as indexed by rCBF)and electrophysiologic tests of neural excitability (asindexed by the amplitude of the MEP).
Another line of research used rTMS to induce acutereorganization in functional brain networks. Several PETstudies have shown that rTMS has lasting effects on task-related regional activity and interregional coupling duringa given task.16,120 Lee et al16 reported marked changes infunctional brain activity after 1-Hz rTMS of left M1 inthe absence of any overt behavioral change. Movement-related activity increased in the right PMd and the infero-medial portion of the left M1 along with increased couplingbetween the inferomedial M1 and premotor areas duringmovement. These changes indicate rapid compensatoryreorganization within the motor system that may help tomaintain functional integrity. It was proposed that theseacute reorganization patterns may be analogous to plasticchanges associated with natural recovery of function afterbrain injury.16 Lasting changes in interregional connectivitycan also be tested by applying focal rTMS to a cortical areaand subsequently probing the responsiveness of the stimu-lated network with online PET during focal TMS. A condi-tioning session of 10-Hz rTMS applied to the mid-DLPFCmodulated the acute response of the frontocingulate circuitto TMS.121
Only a relatively small number of studies have used thecombined TMS-PET approach in patients, mainly toexamine the therapeutic effects of repeated sessions ofprefrontal rTMS on rCBF and rCMRglc as a treatment fordepression,122-125 as introduced by George et al.126 Thesestudies show that serial metabolic PET or SPECT studiesprovide important insights into the mechanism of actionof rTMS in patients and may help to predict antidepressantefficacy of different stimulation paradigms. The combinedTMS-PET approach can also shed new light on the patho-physiology of neurologic and psychiatric disorders. Forinstance, patients with focal hand dystonia showed a greatersuppression of regional synaptic activity in lateral andmedial premotor areas, putamen, and thalamus after 1-HzrTMS of left PMd, indicating enhanced plasticity of thecorticobasal gangliathalamic loop in focal hand dystonia.15
Finally, PET provides the unique opportunity to inves-tigate the effects of TMS on specific neurotransmittersystems (eg, the dopaminergic system) or cell populations(eg, the microglia). In healthy volunteers, 11C-raclopridePET was used to measure changes in extracellular dopa-mine concentration after high-frequency rTMS of the leftDLPFC127 or the M1.128 Focal rTMS to the DLPFC andM1-HAND led to spatially restricted decreases of11C-raclopride binding in ipsilateral corticostriatal projec-tion zones of the stimulated cortical area. This regionallyspecific decrease in 11C-raclopride binding potential indi-cates that focal rTMS can induce a lasting increase in
endogenous dopamine release in the corresponding striatalprojection zone, presumably through repetitive stimulationof corticostriatal connections during rTMS.
The rTMS/11C-raclopride PET methodology offers theopportunity to investigate corticostriatal functional interac-tions in neurologic and psychiatric diseases. In fact, abnor-malities in corticostriatal interactions are believed to playan important role in the pathophysiology of Parkinson’sdisease (PD).129 The evidence of a spatially enlarged areaof dopamine release in the symptomatic hemisphere afterM1-TMS/11C-raclopride PET may represent a possible invivo expression of a loss of functional segregation ofcortical information to the striatum and an indirect evidenceof abnormal corticostriatal transmission in early PD.129
Investigations of corticostriatal transmission have alsobeen described in psychiatric conditions such as primarydepression using SPECT130,131 as well as in differentanimal models.132-135 Ever since the adoption of rTMS asa research tool, there has been great interest regarding itspotential clinical role. To date, studies addressing thecontribution of placebo during TMS are limited. Theplacebo effect has been shown to be associated eitherwith release of dopamine in the striatum.136 Recently, Stra-fella et al137 showed in patients with PD that expectation oftherapeutic benefit from sham rTMS (placebo-rTMS)induced a diffuse, bilateral reduction in [11C] racloprideBP (ie, release of dopamine) in dorsal and ventral stria-tum.137 These observations confirm earlier evidence thatexpectation of clinical benefit (either from drugs or medicaldevices) induces significant dopaminergic placebo effectssuggesting the importance of placebo-controlled studiesfor clinical trials involving brain stimulation techniques.
Conclusion/Summary
The combined use of TMS and PET has considerablyexpanded the applications of TMS in basic neuroscienceand clinical research. The existing data convincingly showthat online PET during TMS provides a behavior-indepen-dent assay of cortical excitability and connectivity. OfflinePET after a conditioning session of rTMS provides a valu-able means to investigate how rTMS shapes regionalneuronal activity in the intact human brain. In recent years,several new protocols of rTMS have been introduced whichconsist of repeated bursts or paired stimuli.9 Here, offlinePET will be of great value to compare the topographicand temporal profiles of changes in regional activityproduced by various rTMS protocols. As such, offlinePET imaging can make an important contribution to theunderstanding of the mechanisms of action of rTMS. Aunique strength of the combined TMS-PET is to map theeffects of rTMS on regional neurotransmission. AlthoughPET has only been used to map TMS-induced changes indopaminergic neurotransmission, it would be very helpfulto extend this approach to other neurotransmitter systems,including the serotoninergic and cholinergic system. Other

Combining TMS with neuroimaging 75
interesting extensions of the TMS-PET approach includethe use of PET ligands that label activated microglia oramyloid deposits.
Near infrared spectroscopy
Basic methodology
Near infrared spectroscopy (NIRS) is a spectroscopicmethod measuring the wavelength and intensity of theabsorption of near-infrared light by the tissue. NIRS can beused to probe brain function through the intact skull bydetecting changes in blood hemoglobin concentrationsassociated with neural activity. Devices designed to esti-mate blood gas levels in the brain commonly use the lightwithin the lower near infrared spectrum rather than visiblelight because of its greater penetration through the scalp.NIRS measures tissue absorbance and scattering of light attwo or more wavelengths in the spectral region from 700-1000 nm, thus enabling the determination of concentrationchanges of oxygenated hemoglobin (oxy-Hb), deoxygen-ated hemoglobin (deoxy-Hb), and blood volume (total-Hb;oxy-Hb 1 deoxy-Hb) using mathematical models based onthe modified Lambert-Beer law.138
Technical and safety aspects
Instrumentation for NIRS consists of a source (transmitter)that emits infrared light into the tissue, a detector (receiver)and a dispersive element (eg, a prism or a diffractiongrating) to allow the intensity at different wavelengths to berecorded. A distance of each pair is adjusted to about 3 cm,which is suitable for detecting the Hb concentration at thecerebral cortex and reducing the influence of skin Hbchanges.139 Conventional NIRS has been limited tomeasurements from a few specific sites. Recent technologicadvances enable to perform NIRS simultaneously frommultiple sites and to display the results of multisite NIRSas cortical maps.
NIRS can be used to visualize the effects of TMS oncortical activity.140 The NIRS method has several advan-tages over other neuroimaging techniques. It has a highsignal-to-noise ratio. NIRS can be performed while TMSis being applied because the time-varying electromagneticfield induced by the TMS pulse does not interfere withNIRS. NIRS can be used in newborns and infants becauseof the lack of any side effects. NIRS devices are portable,enabling investigations in freely moving subjects.141
Furthermore, NIRS has a temporal resolution that is compa-rable to fMRI.
There are also several limitations: The technique hasa relatively poor spatial resolution when compared withfMRI. Because of the limited depth penetration of theinfrared light, NIRS can only probe activity in superficialcortical regions. Because NIRS is highly sensitive to
fluctuations in the light intensity of the environment,recordings need to be performed in a slightly darkenedroom and repeated at least 10 times. Trials need to beaveraged to obtain stable results.
Although TMS has been successfully combined withNIRS, several issues remain to be solved. The placement ofthe probe interferes with the placement of the coil,increasing the distance between the TMS coil and thecortical target region. There is still some debate whichwavelengths should be preferentially used and how stronglights should be used in combined TMS-NIRS studies.Another problem is that NIRS is difficult to perform inindividuals with black hair. It is possible to record goodresponses in these subjects by increasing the intensity of thelight that is emitted in the tissue. However, the safetyguidelines for light exposure may limit the possibility toincrease the intensity of the emitted infrared light, espe-cially when studying children or infants. Finally, headmovements induced by the vibration of the stimulating coilmay sometimes disturb a good recording because of themovements of the NIRS probes in simultaneous NIRS-TMS studies.
Neuroscience and clinical applications
During physiologic brain activation (eg, in response toa sensory stimulus), NIRS typically shows a large oxy-Hbincrease along with a small deoxy-Hb decrease.138 Ifa region is deactivated, this is reflected by NIRS as andecrease in oxy-Hb and an increase in deoxy-Hb.142 Onlya few studies combined NIRS recordings with TMS. Inter-estingly, Hb concentration changes evoked during or afterTMS appear to be different from the normal physiologicresponse profile. The first study that combined TMS andoptical imaging reported a right-hemisphere responsewhen the left motor cortex was stimulated.143 The firststudy with two wavelengths reported local changes in Hbconcentration just beneath the coil.144 A significantincrease in oxy-Hb was observed after single-pulse TMS(90% or 110% active motor threshold) when the subjectsvoluntarily contracted a target hand muscle. This spectro-scopic response was similar to the physiologic activationpattern. On the other hand, single-pulse TMS (120% or140% active motor threshold) induced large deoxy-Hbdecreases and no significant oxy-Hb changes when thecontralateral target muscle was relaxed.145 This atypicalresponse pattern may be explained by TMS-inducedchanges in the intrinsic firing rate of cortical and corticospi-nal neurons because of the lasting inhibition provoked byhigh-intensity TMS.
NIRS has also been used to measure regional changes inHb concentration in the right PFC, PMd, M1-HAND, andprimary sensory hand area (S1-HAND) during and afterintermittent theta burst rTMS over the left PMd, M1 andS1, or sham stimulation. Intermittent theta burst rTMS overpremotor or sensorimotor cortices induced large oxy-Hb
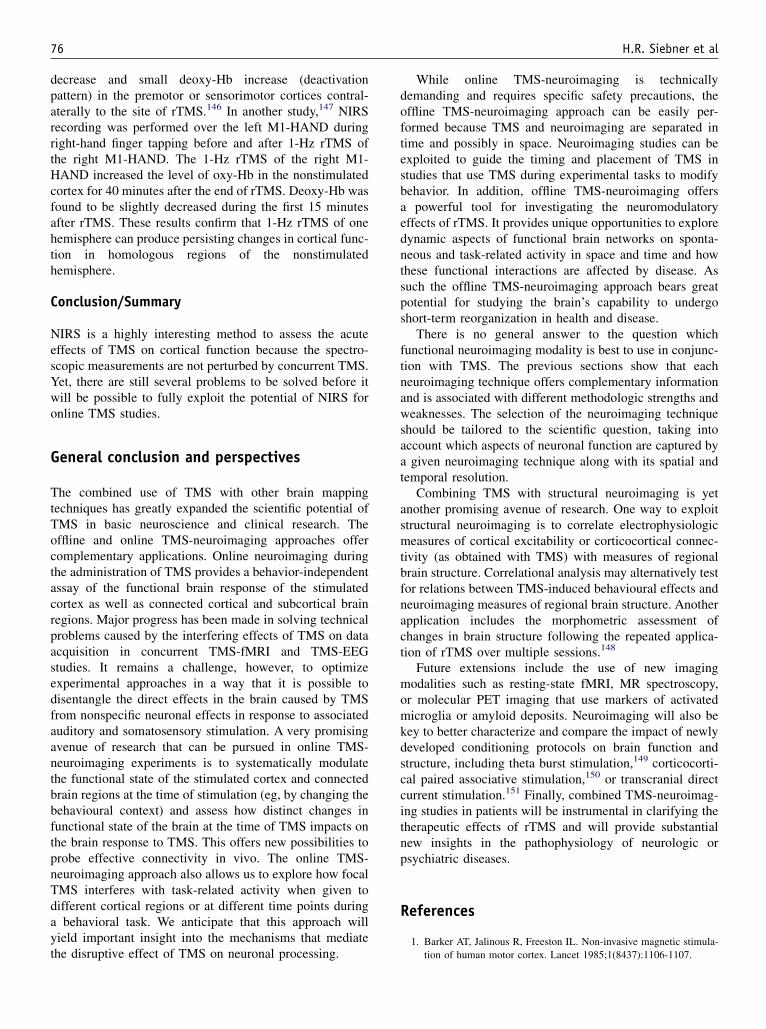
76 H.R. Siebner et al
decrease and small deoxy-Hb increase (deactivationpattern) in the premotor or sensorimotor cortices contral-aterally to the site of rTMS.146 In another study,147 NIRSrecording was performed over the left M1-HAND duringright-hand finger tapping before and after 1-Hz rTMS ofthe right M1-HAND. The 1-Hz rTMS of the right M1-HAND increased the level of oxy-Hb in the nonstimulatedcortex for 40 minutes after the end of rTMS. Deoxy-Hb wasfound to be slightly decreased during the first 15 minutesafter rTMS. These results confirm that 1-Hz rTMS of onehemisphere can produce persisting changes in cortical func-tion in homologous regions of the nonstimulatedhemisphere.
Conclusion/Summary
NIRS is a highly interesting method to assess the acuteeffects of TMS on cortical function because the spectro-scopic measurements are not perturbed by concurrent TMS.Yet, there are still several problems to be solved before itwill be possible to fully exploit the potential of NIRS foronline TMS studies.
General conclusion and perspectives
The combined use of TMS with other brain mappingtechniques has greatly expanded the scientific potential ofTMS in basic neuroscience and clinical research. Theoffline and online TMS-neuroimaging approaches offercomplementary applications. Online neuroimaging duringthe administration of TMS provides a behavior-independentassay of the functional brain response of the stimulatedcortex as well as connected cortical and subcortical brainregions. Major progress has been made in solving technicalproblems caused by the interfering effects of TMS on dataacquisition in concurrent TMS-fMRI and TMS-EEGstudies. It remains a challenge, however, to optimizeexperimental approaches in a way that it is possible todisentangle the direct effects in the brain caused by TMSfrom nonspecific neuronal effects in response to associatedauditory and somatosensory stimulation. A very promisingavenue of research that can be pursued in online TMS-neuroimaging experiments is to systematically modulatethe functional state of the stimulated cortex and connectedbrain regions at the time of stimulation (eg, by changing thebehavioural context) and assess how distinct changes infunctional state of the brain at the time of TMS impacts onthe brain response to TMS. This offers new possibilities toprobe effective connectivity in vivo. The online TMS-neuroimaging approach also allows us to explore how focalTMS interferes with task-related activity when given todifferent cortical regions or at different time points duringa behavioral task. We anticipate that this approach willyield important insight into the mechanisms that mediatethe disruptive effect of TMS on neuronal processing.
While online TMS-neuroimaging is technicallydemanding and requires specific safety precautions, theoffline TMS-neuroimaging approach can be easily per-formed because TMS and neuroimaging are separated intime and possibly in space. Neuroimaging studies can beexploited to guide the timing and placement of TMS instudies that use TMS during experimental tasks to modifybehavior. In addition, offline TMS-neuroimaging offersa powerful tool for investigating the neuromodulatoryeffects of rTMS. It provides unique opportunities to exploredynamic aspects of functional brain networks on sponta-neous and task-related activity in space and time and howthese functional interactions are affected by disease. Assuch the offline TMS-neuroimaging approach bears greatpotential for studying the brain’s capability to undergoshort-term reorganization in health and disease.
There is no general answer to the question whichfunctional neuroimaging modality is best to use in conjunc-tion with TMS. The previous sections show that eachneuroimaging technique offers complementary informationand is associated with different methodologic strengths andweaknesses. The selection of the neuroimaging techniqueshould be tailored to the scientific question, taking intoaccount which aspects of neuronal function are captured bya given neuroimaging technique along with its spatial andtemporal resolution.
Combining TMS with structural neuroimaging is yetanother promising avenue of research. One way to exploitstructural neuroimaging is to correlate electrophysiologicmeasures of cortical excitability or corticocortical connec-tivity (as obtained with TMS) with measures of regionalbrain structure. Correlational analysis may alternatively testfor relations between TMS-induced behavioural effects andneuroimaging measures of regional brain structure. Anotherapplication includes the morphometric assessment ofchanges in brain structure following the repeated applica-tion of rTMS over multiple sessions.148
Future extensions include the use of new imagingmodalities such as resting-state fMRI, MR spectroscopy,or molecular PET imaging that use markers of activatedmicroglia or amyloid deposits. Neuroimaging will also bekey to better characterize and compare the impact of newlydeveloped conditioning protocols on brain function andstructure, including theta burst stimulation,149 corticocorti-cal paired associative stimulation,150 or transcranial directcurrent stimulation.151 Finally, combined TMS-neuroimag-ing studies in patients will be instrumental in clarifying thetherapeutic effects of rTMS and will provide substantialnew insights in the pathophysiology of neurologic orpsychiatric diseases.
References
1. Barker AT, Jalinous R, Freeston IL. Non-invasive magnetic stimula-
tion of human motor cortex. Lancet 1985;1(8437):1106-1107.

Combining TMS with neuroimaging 77
2. Kobayashi M, Pascual-Leone A. Transcranial magnetic stimulation
in neurology. Lancet Neurol 2003;2(3):145-156.
3. Pascual-Leone A, Walsh V, Rothwell J. Transcranial magnetic stim-
ulation in cognitive neuroscience–virtual lesion, chronometry, and
functional connectivity. Curr Opin Neurobiol 2000;10(2):232-237.
4. Walsh V, Cowey A. Transcranial magnetic stimulation and cognitive
neuroscience. Nature Rev 2000;1(1):73-79.
5. Jahanshahi M, Dirnberger G. The left dorsolateral prefrontal cortex
and random generation of responses: studies with transcranial
magnetic stimulation. Neuropsychologia 1999;37(2):181-190.
6. Grosbras MH, Paus T. Transcranial magnetic stimulation of the
human frontal eye field facilitates visual awareness. Eur J Neurosci
2003;18(11):3121-3126.
7. Walsh V, Ellison A, Battelli L, Cowey A. Task-specific impairments
and enhancements induced by magnetic stimulation of human visual
area V5. Proc Biol Sci 1998;265(1395):537-543.
8. O’Shea J, Taylor PC, Rushworth MF. Imaging causal interactions
during sensorimotor processing. Cortex 2008;44(5):598-608.
9. Thickbroom GW. Transcranial magnetic stimulation and synaptic
plasticity: experimental framework and human models. Exp Brain
Res 2007;180(4):583-593.
10. Ziemann U, Paulus W, Nitsche MA, et al. Consensus: motor cortex
plasticity protocols. Brain Stimulation 2008;1(3):164-182.
11. Siebner HR, Lang N, Rizzo V, et al. Preconditioning of
low-frequency repetitive transcranial magnetic stimulation with
transcranial direct current stimulation: evidence for homeostatic
plasticity in the human motor cortex. J Neurosci 2004;24(13):
3379-3385.
12. Siebner HR, Rothwell J. Transcranial magnetic stimulation: new
insights into representational cortical plasticity. Exp Brain Res
2003;148(1):1-16.
13. Ridding MC, Rothwell JC. Is there a future for therapeutic use of
transcranial magnetic stimulation? Nature Rev 2007;8(7):559-567.
14. Siebner HR, Hartwigsen G, Kassuba T, Rothwell JC. How does
transcranial magnetic stimulation modify neuronal activity in the
brain?dimplications for studies of cognition. Cortex [in press].
15. Siebner HR, Filipovic SR, Rowe JB, et al. Patients with focal arm dys-
tonia have increased sensitivity to slow-frequency repetitive TMS of
the dorsal premotor cortex. Brain 2003;126(Pt 12):2710-2725.
16. Lee L, Siebner HR, Rowe JB, et al. Acute remapping within the
motor system induced by low-frequency repetitive transcranial
magnetic stimulation. J Neurosci 2003;23(12):5308-5318.
17. O’Shea J, Johansen-Berg H, Trief D, Gobel S, Rushworth MF. Func-
tionally specific reorganization in human premotor cortex. Neuron
2007;54(3):479-490.
18. Brandt SA, Brocke J, Roricht S, Ploner CJ, Villringer A, Meyer BU.
In vivo assessment of human visual system connectivity with trans-
cranial electrical stimulation during functional magnetic resonance
imaging. Neuroimage 2001;14(2):366-375.
19. Brocke J, Schmidt S, Irlbacher K, Cichy RM, Brandt SA. Transcra-
nial cortex stimulation and fMRI: electrophysiological correlates of
dual-pulse BOLD signal modulation. Neuroimage 2008;40(2):
631-643.
20. Siebner HR, Peller M, Willoch F, et al. Imaging functional activation
of the auditory cortex during focal repetitive transcranial magnetic
stimulation of the primary motor cortex in normal subjects. Neurosci
Lett 1999;270(1):37-40.
21. Cohen LG, Celnik P, Pascual-Leone A, et al. Functional relevance of
cross-modal plasticity in blind humans. Nature 1997;389(6647):
180-183.
22. Neggers SF, Huijbers W, Vrijlandt CM, Vlaskamp BN, Schutter DJ,
Kenemans JL. TMS pulses on the frontal eye fields break coupling
between visuospatial attention and eye movements. J Neurophysiol
2007;98(5):2765-2778.
23. Ilmoniemi RJ, Virtanen J, Ruohonen J, et al. Neuronal responses to
magnetic stimulation reveal cortical reactivity and connectivity. Neu-
roreport 1997;8(16):3537-3540.
24. Virtanen J, Ruohonen J, Naatanen R, Ilmoniemi RJ. Instrumentation
for the measurement of electric brain responses to transcranial
magnetic stimulation. Med Biol Eng Comput 1999;37(3):322-326.
25. Thut G, Ives JR, Kampmann F, Pastor MA, Pascual-Leone A. A new
device and protocol for combining TMS and online recordings of
EEG and evoked potentials. J Neurosci Methods 2005;141(2):
207-217.
26. Bonato C, Miniussi C, Rossini PM. Transcranial magnetic stimula-
tion and cortical evoked potentials: a TMS/EEG co-registration
study. Clin Neurophysiol 2006;117(8):1699-1707.
27. Taylor PC, Walsh V, Eimer M. Combining TMS and EEG to study
cognitive function and cortico-cortico interactions. Behav Brain
Res 2008;191(2):141-147.
28. Roth BJ, Pascual-Leone A, Cohen LG, Hallett M. The heating of metal
electrodes during rapid-rate magnetic stimulation: a possible safety
hazard. Electroencephalogr Clin Neurophysiol 1992;85(2):116-123.
29. Ives JR, Rotenberg A, Poma R, Thut G, Pascual-Leone A. Electroen-
cephalographic recording during transcranial magnetic stimulation in
humans and animals. Clin Neurophysiol 2006;117(8):1870-1875.
30. Julkunen P, Paakkonen A, Hukkanen T, et al. Efficient reduction of
stimulus artefact in TMS-EEG by epithelial short-circuiting by
mini-punctures. Clin Neurophysiol 2008;119(2):475-481.
31. Nikouline V, Ruohonen J, Ilmoniemi RJ. The role of the coil click in
TMS assessed with simultaneous EEG. Clin Neurophysiol 1999;
110(8):1325-1328.
32. Massimini M, Ferrarelli F, Huber R, Esser SK, Singh H, Tononi G.
Breakdown of cortical effective connectivity during sleep. Science
2005;309(5744):2228-2232.
33. Komssi S, Aronen HJ, Huttunen J, et al. Ipsi- and contralateral EEG
reactions to transcranial magnetic stimulation. Clin Neurophysiol
2002;113(2):175-184.
34. Lioumis P, Kicic D, Savolainen P, Makela JP, Kahkonen S. Repro-
ducibility of TMS-Evoked EEG responses. Hum Brain Mapp 2008
Jun 6. [Published online ahead of print].
35. Ruohonen J, Ilmoniemi RJ. Modeling of the stimulating field gener-
ation in TMS. Electroencephalogr Clin Neurophysiol 1999;51:30-40.
36. De Lucia M, Parker GJ, Embleton K, Newton JM, Walsh V. Diffusion
tensor MRI-based estimation of the influence of brain tissue anisot-
ropy on the effects of transcranial magnetic stimulation. NeuroImage
2007;36(4):1159-1170.
37. Huber R, Esser SK, Ferrarelli F, Massimini M, Peterson MJ, Tononi G.
TMS-induced cortical potentiation during wakefulness locally
increases slow wave activity during sleep. PLoS ONE 2007;2:e276.
38. Huber R, Maatta S, Esser SK, et al. Measures of cortical plasticity
after transcranial paired associative stimulation predict changes in
electroencephalogram slow-wave activity during subsequent sleep.
J Neurosci 2008;28(31):7911-7918.
39. Bergmann TO, Molle M, Marshall L, Kaya-Yildiz L, Born J,
Siebner HR. A local signature of LTP- and LTD-like plasticity in
human NREM sleep. Eur J Neurosci 2008;27(9):2241-2249.
40. De Gennaro L, Fratello F, Marzano C, et al. Cortical plasticity
induced by transcranial magnetic stimulation during wakefulness
affects electroencephalogram activity during sleep. PLoS ONE
2008;3(6):e2483.
41. De Gennaro L, Marzano C, Veniero D, et al. Neurophysiological
correlates of sleepiness: a combined TMS and EEG study. Neuro-
image 2007;36(4):1277-1287.
42. Romei V, Brodbeck V, Michel C, Amedi A, Pascual-Leone A,
Thut G. Spontaneous fluctuations in posterior alpha-band EEG
activity reflect variability in excitability of human visual areas. Cereb
Cortex 2008;18(9):2010-2018.
43. Paus T, Sipila PK, Strafella AP. Synchronization of neuronal activity
in the human primary motor cortex by transcranial magnetic stimula-
tion: an EEG study. J Neurophysiol 2001;86(4):1983-1990.
44. Brignani D, Manganotti P, Rossini PM, Miniussi C. Modulation of
cortical oscillatory activity during transcranial magnetic stimulation.
Hum Brain Mapp 2008;29(5):603-612.

78 H.R. Siebner et al
45. Fuggetta G, Pavone EF, Fiaschi A, Manganotti P. Acute modulation
of cortical oscillatory activities during short trains of high-frequency
repetitive transcranial magnetic stimulation of the human motor
cortex: a combined EEG and TMS study. Hum Brain Mapp 2008;
29(1):1-13.
46. Taylor PC, Nobre AC, Rushworth MF. FEF TMS affects visual
cortical activity. Cereb Cortex 2007;17(2):391-399.
47. Taylor PC, Nobre AC, Rushworth MF. Subsecond changes in top
down control exerted by human medial frontal cortex during conflict
and action selection: a combined transcranial magnetic stimulation
electroencephalography study. J Neurosci 2007;27(42):11343-11353.
48. Fuggetta G, Pavone EF, Walsh V, Kiss M, Eimer M. Cortico-cortical
interactions in spatial attention: a combined ERP/TMS study. J Neu-
rophysiol 2006;95(5):3277-3280.
49. Komssi S, Kahkonen S. The novelty value of the combined use of
electroencephalography and transcranial magnetic stimulation for
neuroscience research. Brain Res Rev 2006;52(1):183-192.
50. Lehmann D, Skrandies W. Reference-free identification of compo-
nents of checkerboard-evoked multichannel potential fields. Electro-
encephalogr Clin Neurophysiol 1980;48(6):609-621.
51. Esser SK, Huber R, Massimini M, Peterson MJ, Ferrarelli F,
Tononi G. A direct demonstration of cortical LTP in humans:
a combined TMS/EEG study. Brain Res Bull 2006;69(1):86-94.
52. Massimini M, Ferrarelli F, Esser SK, et al. Triggering sleep slow
waves by transcranial magnetic stimulation. Proc Natl Acad Sci U
S A 2007;104(20):8496-8501.
53. Litvak V, Komssi S, Scherg M, et al. Artifact correction and source
analysis of early electroencephalographic responses evoked by trans-
cranial magnetic stimulation over primary motor cortex. Neuroimage
2007;37(1):56-70.
54. Komssi S, Savolainen P, Heiskala J, Kahkonen S. Excitation
threshold of the motor cortex estimated with transcranial magnetic
stimulation electroencephalography. Neuroreport 2007;18(1):13-16.
55. Fuggetta G, Fiaschi A, Manganotti P. Modulation of cortical oscilla-
tory activities induced by varying single-pulse transcranial magnetic
stimulation intensity over the left primary motor area: a combined
EEG and TMS study. Neuroimage 2005;27(4):896-908.
56. Kahkonen S, Kesaniemi M, Nikouline VV, et al. Ethanol modulates
cortical activity: direct evidence with combined TMS and EEG.
Neuroimage 2001;14(2):322-328.
57. Kahkonen S, Wilenius J, Nikulin VV, Ollikainen M, Ilmoniemi RJ.
Alcohol reduces prefrontal cortical excitability in humans:
a combined TMS and EEG study. Neuropsychopharmacol 2003;
28(4):747-754.
58. Ferrarelli F, Massimini M, Peterson MJ, et al. Reduced evoked
gamma oscillations in the frontal cortex in schizophrenia patients:
a TMS/EEG study. Am J Psychiatry 2008;165:996-1005.
59. Esser SK, Hill SL, Tononi G. Modeling the effects of transcranial
magnetic stimulation on cortical circuits. J Neurophysiol 2005;
94(1):622-639.
60. Bohning DE, Shastri A, Nahas Z, et al. Echoplanar BOLD fMRI of
brain activation induced by concurrent transcranial magnetic stimula-
tion. Invest Radiol 1998;33(6):336-340.
61. Ferrarelli F, Haraldsson HM, Barnhart TE, et al. A [17F]-fluorome-
thane PET/TMS study of effective connectivity. Brain Res Bull
2004;64(2):103-113.
62. Logothetis NK. The neural basis of the blood-oxygen-level-depend-
ent functional magnetic resonance imaging signal. Philos Trans R
Soc Lond B Biol Sci 2002;357(1424):1003-1037.
63. Formisano E, Goebel R. Tracking cognitive processes with functional
MRI mental chronometry. Curr Opin Neurobio 2003;13(2):174-181.
64. Josephs O, Henson RN. Event-related functional magnetic resonance
imaging: modelling, inference and optimization. Philos Trans R Soc
Lond B Biol Sci 1999;354(1387):1215-1228.
65. Bohning DE, Shastri A, McConnell KA, et al. A combined
TMS/fMRI study of intensity-dependent TMS over motor cortex.
Biol Psychiatry 1999;45(4):385-394.
66. Shastri A, George MS, Bohning DE. Performance of a system for
interleaving transcranial magnetic stimulation with steady-state
magnetic resonance imaging. Electroencephalogr Clin Neurophysiol
Suppl 1999;51:55-64.
67. Baudewig J, Paulus W, Frahm J. Artifacts caused by transcranial
magnetic stimulation coils and EEG electrodes in T(2)*-weighted
echo-planar imaging. Magn Reson Imaging 2000;18(4):479-484.
68. Bestmann S, Baudewig J, Frahm J. On the synchronization of trans-
cranial magnetic stimulation and functional echo-planar imaging.
J Magn Reson Imaging 2003;17(3):309-316.
69. Denslow S, Bohning DE, Bohning PA, Lomarev MP, George MS. An
increased precision comparison of TMS-induced motor cortex BOLD
fMRI response for image-guided versus function-guided coil place-
ment. Cogn Behav Neurol 2005;18(2):119-126.
70. Bestmann S, Swayne O, Blankenburg F, et al. Dorsal premotor cortex
exerts state-dependent causal influences on activity in contralateral
primary motor and dorsal premotor cortex. Cereb Cortex 2008;
18(6):1281-1291.
71. Weiskopf N, Josephs O, Ruff CC. et al. Image artifacts in concurrent
transcranial magnetic stimulation (TMS) and fMRI caused by
leakage currents: Modeling and compensation. J Magn Reson
Imaging [in press].
72. Bestmann S, Ruff CC, Driver J, Blankenburg F. Concurrent TMS and
functional magnetic resonance imaging: methods and current
advances. In: Wassermann EM, Epstein CM, Ziemann U, Walsh V,
Paus T, Lisanby S, editors. The Oxford Handbook of Transcranial
Stimulation. Oxford: Oxford University Press; 2008. p. 569-592.
73. Ruff CC, Bestmann S, Blankenburg F, et al. Distinct causal influ-
ences of parietal versus frontal areas on human visual cortex:
evidence from concurrent TMS-fMRI. Cereb Cortex 2008;18(4):
817-827.
74. Bestmann S, Ruff CC, Blankenburg F, Weiskopf W, Driver J,
Rothwell JC. Mapping causal interregional influences with concur-
rent TMS-fMRI. Exp Brain Res 2008;191:383-402.
75. Paus T. Inferring causality in brain images: a perturbation approach.
Philos Trans R Soc Lond B Biol Sci 2005;360(1457):1109-1114.
76. Bohning DE, Shastri A, Wassermann EM, et al. BOLD-f MRI
response to single-pulse transcranial magnetic stimulation (TMS).
J Magn Reson Imaging 2000;11(6):569-574.
77. Bestmann S, Baudewig J, Siebner HR, Rothwell JC, Frahm J. BOLD
MRI responses to repetitive TMS over human dorsal premotor
cortex. Neuroimage 2005;28(1):22-29.
78. Denslow S, Lomarev M, George MS, Bohning DE. Cortical and
subcortical brain effects of transcranial magnetic stimulation
(TMS)-induced movement: an interleaved TMS/functional magnetic
resonance imaging study. Biol Psychiatry 2005;57(7):752-760.
79. Bestmann S, Baudewig J, Siebner HR, Rothwell JC, Frahm J.
Subthreshold high-frequency TMS of human primary motor cortex
modulates interconnected frontal motor areas as detected by inter-
leaved fMRI-TMS. Neuroimage 2003;20(3):1685-1696.
80. Bestmann S, Baudewig J, Siebner HR, Rothwell JC, Frahm J. Func-
tional MRI of the immediate impact of transcranial magnetic stimu-
lation on cortical and subcortical motor circuits. Eur J Neurosci
2004;19(7):1950-1962.
81. Ruff CC, Blankenburg F, Bjoertomt O, et al. Concurrent TMS-fMRI
and psychophysics reveal frontal influences on human retinotopic
visual cortex. Curr Biol 2006;16(15):1479-1488.
82. Sack AT, Kohler A, Bestmann S, et al. Imaging the brain activity
changes underlying impaired visuospatial judgments: simultaneous
FMRI, TMS, and behavioral studies. Cereb Cortex 2007;17(12):
2841-2852.
83. Blankenburg F, Ruff CC, Bestmann S, et al. Interhemispheric effect of
parietal TMS on somatosensory response confirmed directly with
concurrent TMS-fMRI. J Neurosci 2008;28(49):13202-13208.
84. Bestmann S, Oliviero A, Voss M, et al. Cortical correlates of
TMS-induced phantom hand movements revealed with concurrent
TMS-fMRI. Neuropsychologia 2006;44(14):2959-2971.
Combining TMS with neuroimaging 79
85. Friston KJ, Price CJ. Degeneracy and redundancy in cognitive
anatomy. Trends Cogn Sci 2003;7(4):151-152.
86. Li X, Nahas Z, Kozel FA, Anderson B, Bohning DE, George MS.
Acute left prefrontal transcranial magnetic stimulation in depressed
patients is associated with immediately increased activity in
prefrontal cortical as well as subcortical regions. Biol Psychiatry
2004;55(9):882-890.
87. Li X, Teneback CC, Nahas Z, et al. Interleaved transcranial magnetic
stimulation/functional MRI confirms that lamotrigine inhibits
cortical excitability in healthy young men. Neuropsychopharmacol
2004;29(7):1395-1407.
88. Tegenthoff M, Ragert P, Pleger B, et al. Improvement of tactile
discrimination performance and enlargement of cortical somatosen-
sory maps after 5 Hz rTMS. PLoS Biol 2005;3(11):e362.
89. Pleger B, Blankenburg F, Bestmann S, et al. Repetitive transcranial
magnetic stimulation-induced changes in sensorimotor coupling
parallel improvements of somatosensation in humans. J Neurosci
2006;26(7):1945-1952.
90. Rango M, Cogiamanian F, Marceglia S, et al. Myoinositol content in
the human brain is modified by transcranial direct current stimulation
in a matter of minutes: a 1H-MRS study. Magn Reson Med 2008;
60(4):782-789.
91. Stagg CJ, Best J, Stephenson M, et al. Imaging the functional and
neurochemical effects of transcranial direct current stimulation:
a rationale for rehabilitation (Abstract). Special issue: Proceedings
from the Third International Conference on TMS and tDCS.
October 1-4, Gottingen, Germany. Brain Stimulation 2008;1(3):
260-261.
92. Moisa M, Pohmann R, Uludag K, Thielscher A. Interleaved
TMS/CASL: a motor cortex study (Abstract). Special Issue: Proceed-
ings from the Third International Conference on TMS and tDCS.
October 1-4, Gottingen, Germany. Brain Stimulation 2008;1(3):
290-291.
93. Bohning DE, Pecheny AP, Epstein CM, et al. Mapping transcranial
magnetic stimulation (TMS) fields in vivo with MRI. Neuroreport
1997;8(11):2535-2538.
94. Ashburner J, Friston KJ. Voxel-based morphometry–the methods.
Neuroimage 2000;11(6 Pt 1):805.
95. Ashburner J, Csernansky JG, Davatzikos C, Fox NC, Frisoni GB,
Thompson PM. Computer-assisted imaging to assess brain structure
in healthy and diseased brains. Lancet Neurol 2003;2(2):79-88.
96. Boorman ED, O’Shea J, Sebastian C, Rushworth MF,
Johansen-Berg H. Individual differences in white-matter microstruc-
ture reflect variation in functional connectivity during choice. Curr
Biol 2007;17(16):1426-1431.
97. Wahl M, Lauterbach-Soon B, Hattingen E, et al. Human motor
corpus callosum: topography, somatotopy, and link between micro-
structure and function. J Neurosci 2007;27(45):12132-12138.
98. Stinear CM, Barber PA, Smale PR, Coxon JP, Fleming MK,
Byblow WD. Functional potential in chronic stroke patients depends
on corticospinal tract integrity. Brain 2007;130(Pt 1):170-180.
99. Kloppel S, Baumer T, Kroeger J, et al. The cortical motor threshold
reflects microstructural properties of cerebral white matter. Neuro-
image 2008;40(4):1782-1791.
100. Smith SM, Jenkinson M, Johansen-Berg H, et al. Tract-based spatial
statistics: voxelwise analysis of multi-subject diffusion data. Neuro-
image 2006;31(4):1487-1505.
101. Silbert LC, Nelson C, Holman S, et al. Cortical excitability and
age-related volumetric MRI changes. Clin Neurophysiol 2006;
117(5):1029-1036.
102. Sach M, Winkler G, Glauche V, et al. Diffusion tensor MRI of early
upper motor neuron involvement in amyotrophic lateral sclerosis.
Brain 2004;127(Pt 2):340-350.
103. Piccini P, Whone A. Functional brain imaging in the differential
diagnosis of Parkinson’s disease. Lancet Neuro 2004;3(5):284-290.
104. Herholz K, Heiss WD. Positron emission tomography in clinical
neurology. Mol Imaging Biol 2004;6(4):239-269.
105. Cagnin A, Gerhard A, Banati RB. In vivo imaging of neuroinflamma-
tion. Eur Neuropsychopharmacol 2002;12(6):581-586.
106. Hayashi T, Ohnishi T, Okabe S, et al. Long-term effect of motor
cortical repetitive transcranial magnetic stimulation [correction].
Ann Neurol 2004;56(1):77-85.
107. Thompson CJ, Paus T, Clancy R. Magnetic schielding requirements
for PET detectors during transcranial magnetic stimulation. IEEE
Trans Nuclear Sci 1998;20:1923-1927.
108. Siebner HR, Peller M, Lee L. TMS and positron emission tomog-
raphy: methods and current advances. In: Wassermann EM,
Epstein CM, Ziemann U, Walsh V, Paus T, Lisanby S, editors. The
Oxford Handbook of Transcranial Stimulation. Oxford: Oxford
University Press; 2008. p. 549-567.
109. Paus T, Jech R, Thompson CJ, Comeau R, Peters T, Evans AC.
Transcranial magnetic stimulation during positron emission tomog-
raphy: a new method for studying connectivity of the human cerebral
cortex. J Neurosci 1997;17(9):3178-3184.
110. Paus T, Wolforth M. Transcranial magnetic stimulation during PET:
reaching and verifying the target site. Hum Brain Mapp 1998;6(5-6):
399-402.
111. Siebner H, Peller M, Bartenstein P, et al. Activation of frontal premo-
tor areas during suprathreshold transcranial magnetic stimulation of
the left primary sensorimotor cortex: a glucose metabolic PET study.
Hum Brain Mapp 2001;12(3):157-167.
112. Speer AM, Willis MW, Herscovitch P, et al. Intensity-dependent
regional cerebral blood flow during 1-Hz repetitive transcranial
magnetic stimulation (rTMS) in healthy volunteers studied with
H215O positron emission tomography: II, effects of prefrontal cortex
rTMS. Biol Psychiatry 2003;54(8):826-832.
113. Speer AM, Willis MW, Herscovitch P, et al. Intensity-dependent
regional cerebral blood flow during 1-Hz repetitive transcranial
magnetic stimulation (rTMS) in healthy volunteers studied with
H215O positron emission tomography: I, effects of primary motor
cortex rTMS. Biol Psychiatry 2003;54(8):818-825.
114. Siebner HR, Takano B, Peinemann A, Schwaiger M, Conrad B,
Drzezga A. Continuous transcranial magnetic stimulation during
positron emission tomography: a suitable tool for imaging
regional excitability of the human cortex. Neuroimage 2001;
14(4):883-890.
115. Mottaghy FM, Krause BJ, Kemna LJ, et al. Modulation of the
neuronal circuitry subserving working memory in healthy human
subjects by repetitive transcranial magnetic stimulation. Neurosci
Lett 2000;280(3):167-170.
116. Mottaghy FM, Pascual-Leone A, Kemna LJ, et al. Modulation of
a brain-behavior relationship in verbal working memory by rTMS.
Brain Res Cogn Brain Res 2003;15(3):241-249.
117. Siebner HR, Peller M, Lee L. Applications of combined TMS-PET
studies in clinical and basic research. Suppl Clin Neurophysiol
2003;56:63-72.
118. Chouinard PA, Van Der Werf YD, Leonard G, Paus T. Modulating
neural networks with transcranial magnetic stimulation applied
over the dorsal premotor and primary motor cortices. J Neurophysiol
2003;90(2):1071-1083.
119. Takano B, Drzezga A, Peller M, et al. Short-term modulation of
regional excitability and blood flow in human motor cortex following
rapid-rate transcranial magnetic stimulation. Neuroimage 2004;
23(3):849-859.
120. Rounis E, Lee L, Siebner HR, et al. Frequency specific changes in
regional cerebral blood flow and motor system connectivity
following rTMS to the primary motor cortex. Neuroimage 2005;
26(1):164-176.
121. Paus T, Castro-Alamancos MA, Petrides M. Cortico-cortical connec-
tivity of the human mid-dorsolateral frontal cortex and its modulation
by repetitive transcranial magnetic stimulation. Eur J Neurosci 2001;
14(8):1405-1411.
122. Catafau AM, Perez V, Gironell A, et al. SPECT mapping of cerebral
activity changes induced by repetitive transcranial magnetic

80 H.R. Siebner et al
stimulation in depressed patients: a pilot study. Psychiatry Res 2001;
106(3):151-160.
123. Nadeau SE, McCoy KJ, Crucian GP, et al. Cerebral blood flow
changes in depressed patients after treatment with repetitive transcra-
nial magnetic stimulation: evidence of individual variability. Neuro-
psychiatry Neuropsychol Behav Neurol 2002;15(3):159-175.
124. Shajahan PM, Glabus MF, Steele JD, et al. Left dorso-lateral repeti-
tive transcranial magnetic stimulation affects cortical excitability and
functional connectivity, but does not impair cognition in major
depression. Prog Neuropsychopharmacol Biol Psychiatry 2002;
26(5):945-954.
125. Speer AM, Kimbrell TA, Wassermann EM, et al. Opposite effects of
high and low frequency rTMS on regional brain activity in depressed
patients. Biol Psychiatry 2000;48(12):1133-1141.
126. George MS, Wassermann EM, Williams WA, et al. Daily repetitive
transcranial magnetic stimulation (rTMS) improves mood in depres-
sion. Neuroreport 1995;6(14):1853-1856.
127. Strafella AP, Paus T, Barrett J, Dagher A. Repetitive transcranial
magnetic stimulation of the human prefrontal cortex induces dopa-
mine release in the caudate nucleus. J Neurosci 2001;21(15):RC157.
128. Strafella AP, Paus T, Fraraccio M, Dagher A. Striatal dopamine
release induced by repetitive transcranial magnetic stimulation of
the human motor cortex. Brain 2003;126(Pt 12):2609-2615.
129. Strafella AP, Ko JH, Grant J, Fraraccio M, Monchi O. Corticostriatal
functional interactions in Parkinson’s disease: a rTMS/[11C]raclopr-
ide PET study. Eur J Neurosci 2005;22(11):2946-2952.
130. Pogarell O, Koch W, Popperl G, et al. Acute prefrontal rTMS
increases striatal dopamine to a similar degree as D-amphetamine.
Psychiatry Res 2007;156(3):251-255.
131. Pogarell O, Koch W, Popperl G, et al. Striatal dopamine release after
prefrontal repetitive transcranial magnetic stimulation in major
depression: preliminary results of a dynamic [123I] IBZM SPECT
study. J Psychiatr Res 2006;40(4):307-314.
132. Keck ME, Welt T, Muller MB, et al. Repetitive transcranial magnetic
stimulation increases the release of dopamine in the mesolimbic and
mesostriatal system. Neuropharmacology 2002;43(1):101-109.
133. Erhardt A, Sillaber I, Welt T, Muller MB, Singewald N, Keck ME.
Repetitive transcranial magnetic stimulation increases the release
of dopamine in the nucleus accumbens shell of morphine-sensitized
rats during abstinence. Neuropsychopharmacology 2004;29(11):
2074-2080.
134. Kanno M, Matsumoto M, Togashi H, Yoshioka M, Mano Y. Effects of
acute repetitive transcranial magnetic stimulation on dopamine
release in the rat dorsolateral striatum. J Neurol Sci 2004;217(1):73-81.
135. Ohnishi T, Hayashi T, Okabe S, et al. Endogenous dopamine release
induced by repetitive transcranial magnetic stimulation over the
primary motor cortex: an [11C]raclopride positron emission tomog-
raphy study in anesthetized macaque monkeys. Biol Psychiatry
2004;55(5):484-489.
136. de la Fuente-Fernandez R, Ruth TJ, Sossi V, Schulzer M, Calne DB,
Stoessl AJ. Expectation and dopamine release: mechanism of the
placebo effect in Parkinson’s disease. Science 2001;293(5532):
1164-1166.
137. Strafella AP, Ko JH, Monchi O. Therapeutic application of transcra-
nial magnetic stimulation in Parkinson’s disease: the contribution of
expectation. Neuroimage 2006;31(4):1666-1672.
138. Villringer A, Chance B. Non-invasive optical spectroscopy and
imaging of human brain function. Trends Neurosci 1997;20(10):
435-442.
139. Germon TJ, Evans PD, Barnett NJ, Wall P, Manara AR, Nelson RJ.
Cerebral near infrared spectroscopy: emitter-detector separation must
be increased. Br J Anaesth 1999;82(6):831-837.
140. Oliviero A, Di Lazzaro V, Piazza O, et al. Cerebral blood flow and
metabolic changes produced by repetitive magnetic brain stimula-
tion. J Neurol 1999;246(12):1164-1168.
141. Miyai I, Tanabe HC, Sase I, et al. Cortical mapping of gait in hu-
mans: a near-infrared spectroscopic topography study. Neuroimage
2001;14(5):1186-1192.
142. Wenzel R, Wobst P, Heekeren HH, et al. Saccadic suppression
induces focal hypooxygenation in the occipital cortex. J Cereb Blood
Flow Metab 2000;20(7):1103-1110.
143. Nissila I, Kotilahti K, Komssi S, et al. Optical measurement of hemo-
dynamic changes in the contralateral motor cortex induced by trans-
cranial magnetic stimulation. In: Nowak H, Haueisen J, Gießler F,
Huonker R, edis, editors. Proceedings of the 13th International
Conference on Biomagnetism (BIOMAG 2002). Berlin: VDE Verlag;
2002. p. 851-854.
144. Noguchi Y, Watanabe E, Sakai KL. An event-related optical topog-
raphy study of cortical activation induced by single-pulse transcranial
magnetic stimulation. Neuroimage 2003;19(1):156-162.
145. Mochizuki H, Ugawa Y, Terao Y, Sakai KL. Cortical hemoglobin-
oncentration changes under the coil induced by single-pulse TMS
in humans: a simultaneous recording with near-infrared spectroscopy.
Exp Brain Res 200;169(3):302–310.
146. Mochizuki H, Furubayashi T, Hanajima R, et al. Hemoglobin
concentration changes in the contralateral hemisphere during and
after theta burst stimulation of the human sensorimotor cortices.
Exp Brain Res 2007;180(4):667-675.
147. Chiang TC, Vaithianathan T, Leung T, Lavidor M, Walsh V,
Delpy DT. Elevated haemoglobin levels in the motor cortex
following 1 Hz transcranial magnetic stimulation: a preliminary
study. Exp Brain Res 2007;181(4):555-560.
148. May A, Hajak G, Ganssbauer S, et al. Structural brain alterations
following 5 days of intervention: dynamic aspects of neuroplasticity.
Cereb Cortex 2007;17(1):205-210.
149. Huang YZ, Edwards MJ, Rounis E, Bhatia KP, Rothwell JC. Theta
burst stimulation of the human motor cortex. Neuron 2005;45(2):
201-206.
150. Rizzo V, Siebner HS, Morgante F, Mastroeni C, Girlanda P,
Quartarone A. Paired associative stimulation of left and right human
motor cortex shapes interhemispheric motor inhibition based on
a Hebbian mechanism. Cereb Cortex 2008 Sep 12. [Published online
ahead of print.].
151. Lang N, Siebner HR, Ward NS, et al. How does transcranial DC stim-
ulation of the primary motor cortex alter regional neuronal activity in
the human brain? Eur J Neurosci 2005;22(2):495-504.