Low frequency transcranial electrical stimulation...
14
ARTICLE Low frequency transcranial electrical stimulation does not entrain sleep rhythms measured by human intracranial recordings Belen Lafon 1 , Simon Henin 2,3 , Yu Huang 1 , Daniel Friedman 2,3 , Lucia Melloni 2,3,4 , Thomas Thesen 3,5 , Werner Doyle 2,6 , György Buzsáki 3,7 , Orrin Devinsky 2,3 , Lucas C. Parra 1 & Anli A. Liu 2,3 Transcranial electrical stimulation has widespread clinical and research applications, yet its effect on ongoing neural activity in humans is not well established. Previous reports argue that transcranial alternating current stimulation (tACS) can entrain and enhance neural rhythms related to memory, but the evidence from non-invasive recordings has remained inconclusive. Here, we measure endogenous spindle and theta activity intracranially in humans during low-frequency tACS and find no stable entrainment of spindle power during non-REM sleep, nor of theta power during resting wakefulness. As positive controls, we find robust entrainment of spindle activity to endogenous slow-wave activity in 66% of electrodes as well as entrainment to rhythmic noise-burst acoustic stimulation in 14% of electrodes. We conclude that low-frequency tACS at common stimulation intensities neither acutely mod- ulates spindle activity during sleep nor theta activity during waking rest, likely because of the attenuated electrical fields reaching the cortical surface. DOI: 10.1038/s41467-017-01045-x OPEN 1 Department of Biomedical Engineering, City College of New York, 160 Convent Ave, New York, NY 10031, USA. 2 New York University Comprehensive Epilepsy Center, 223 East 34th Street, New York, NY 10016, USA. 3 Department of Neurology, New York University School of Medicine, 240 East 38th St, 20th Floor, New York, NY 10016, USA. 4 Department of Neuroscience, Max Planck Institute for Empirical Aesthetics, Gruneburgweg 14, 60322 Frankfurt am Main, Germany. 5 Department of Physiology and Neuroscience, St. George’s University, St. George’s, Grenada. 6 Department of Neurosurgery NYU School of Medicine, 530 1st Avenue, Suite 7W, New York, NY 10016, USA. 7 New York University Neuroscience Institute, 450 East 29th St, New York, NY 10016, USA. Belen Lafon and Simon Henin contributed equally to this work. Lucas C. Parra and Anli Liu jointly supervised this work. Correspondence and requests for materials should be addressed to A.Liu. (email: [email protected]) NATURE COMMUNICATIONS | 8: 1199 | DOI: 10.1038/s41467-017-01045-x | www.nature.com/naturecommunications 1 1234567890
Transcript of Low frequency transcranial electrical stimulation...

ARTICLE
Low frequency transcranial electrical stimulationdoes not entrain sleep rhythms measured byhuman intracranial recordingsBelen Lafon 1, Simon Henin 2,3, Yu Huang 1, Daniel Friedman 2,3, Lucia Melloni 2,3,4,
Thomas Thesen 3,5, Werner Doyle2,6, György Buzsáki 3,7, Orrin Devinsky 2,3, Lucas C. Parra 1 &
Anli A. Liu 2,3
Transcranial electrical stimulation has widespread clinical and research applications, yet its
effect on ongoing neural activity in humans is not well established. Previous reports argue
that transcranial alternating current stimulation (tACS) can entrain and enhance neural
rhythms related to memory, but the evidence from non-invasive recordings has remained
inconclusive. Here, we measure endogenous spindle and theta activity intracranially in
humans during low-frequency tACS and find no stable entrainment of spindle power during
non-REM sleep, nor of theta power during resting wakefulness. As positive controls, we find
robust entrainment of spindle activity to endogenous slow-wave activity in 66% of electrodes
as well as entrainment to rhythmic noise-burst acoustic stimulation in 14% of electrodes. We
conclude that low-frequency tACS at common stimulation intensities neither acutely mod-
ulates spindle activity during sleep nor theta activity during waking rest, likely because of the
attenuated electrical fields reaching the cortical surface.
DOI: 10.1038/s41467-017-01045-x OPEN
1 Department of Biomedical Engineering, City College of New York, 160 Convent Ave, New York, NY 10031, USA. 2 New York University ComprehensiveEpilepsy Center, 223 East 34th Street, New York, NY 10016, USA. 3 Department of Neurology, New York University School of Medicine, 240 East 38th St,20th Floor, New York, NY 10016, USA. 4Department of Neuroscience, Max Planck Institute for Empirical Aesthetics, Gruneburgweg 14, 60322 Frankfurt amMain, Germany. 5 Department of Physiology and Neuroscience, St. George’s University, St. George’s, Grenada. 6 Department of Neurosurgery NYU School ofMedicine, 530 1st Avenue, Suite 7W, New York, NY 10016, USA. 7New York University Neuroscience Institute, 450 East 29th St, New York, NY 10016, USA.Belen Lafon and Simon Henin contributed equally to this work. Lucas C. Parra and Anli Liu jointly supervised this work. Correspondence and requests formaterials should be addressed to A.Liu. (email: [email protected])
NATURE COMMUNICATIONS |8: 1199 |DOI: 10.1038/s41467-017-01045-x |www.nature.com/naturecommunications 1
1234
5678
90
The therapeutic potential of transcranial electrical stimula-tion (TES) has been examined in over 70 diverse condi-tions, including major depression, epilepsy, pain, stroke
rehabilitation, Parkinson’s disease, and tinnitus1. TES is motivatedby the well-established biophysical observation that externallyapplied electric fields can affect neuronal excitability2–4. However,behavioral effects in human are often weak and difficult to repli-cate, which underscores a lack of basic mechanistic understandingof how applied electrical fields interact with brain activity5–9.
Here, we focus on transcranial alternating current stimulation(tACS)10, which has potential to affect neural oscillations relevantto normal cognition and neurological disease11. Specific oscilla-tion frequencies characterize different arousal states and cognitiveprocesses, and oscillations coordinate activity between local anddistant brain regions12, 13. For example, in non-REM (NREM)sleep, neocortical slow-wave activity coordinates thalamocorticalsleep spindles14, 15. It has been argued that low-frequency tACS,applied during NREM in healthy human subjects, can boostassociative memory, presumably by entraining these nestedrhythms16–21. Furthermore, low-frequency tACS applied duringwaking rest has resulted in widespread increases in theta activity,associated with improved encoding22. It has been proposed thattACS applied at the dominant network oscillations may entrainthese endogenous rhythms in the gamma23–25, beta26, alpha27, 28,theta29, and slow frequencies16, 30, 31.
In this study, we tested a widely cited protocol16, which showedthat declarative memory performance could be enhanced byapplying low-frequency tACS during NREM sleep. This work hassince inspired a number of replication studies, which have showneither positive results18, 19, 21 or no effects5, 7, 32, 33. To validate thephysiological underpinnings of this promising memory effect, weapplied low-frequency tACS during sleep while measuring neuralresponses intracranially in surgical epilepsy patients. We test, inparticular, the widely held belief that brain rhythms are entrainedby tACS applied at the frequency that matches the endogenousrhythm. In the case of NREM sleep this is particularly advanta-geous as one can measure spindle and gamma activity, which isstrongly coupled to the slow wave, yet is uncontaminated by thelow-frequency stimulation artifact34, 35.
Thirteen patients undergoing invasive monitoring for epilepsysurgery were tested with sinusoidal tACS (0.75 and 1Hz) during a
period of NREM sleep and/or waking rest. The primary outcomemeasure during sleep is phase-amplitude coupling (PAC), whichcaptures the modulation of spindle amplitude (at 10 and 14Hz)with the phase of tACS. This measure is motivated by the relevanceof spindles to sleep-dependent cognitive processes, the strongentrainment of spindles to native slow oscillations36, and the pre-vious reports of tACS enhancement of endogenous slow-wave andspindle activity16, 17, 20, 37, 38. Our primary outcome measure duringwakefulness is PAC of theta frequency (7 Hz) amplitude to tACSphase, as theta power has previously been implicated in tACS22.Secondary outcome measures include gamma (70–110Hz) mod-ulation during NREM sleep39 and alpha (10 Hz) and gammamodulation during waking rest. We also tested on an additionalsubject the configuration of Marshall et al.16 with identical electrodelocation, charge density, waveform, frequency, and intensity.Finally, we measured the intensity of induced electric fields at thecortical surface, and leveraged validated computational models toestimate field strengths across the brain40. We do not find an acuteeffect of the applied tACS on brain rhythms and attribute theoutcome to the weak-induced fields.
As a positive control, we confirm that spindle power ismodulated with the endogenous slow-wave rhythm during sleepin the same subjects across a majority of electrodes. Additionally,we find that acoustic stimulation with brief noise bursts reliablyevokes slow-wave and related spindle activity comparable toeffects found in healthy subjects using scalp electro-encephalography (EEG)41. The null findings on entrainmenttogether with these positive controls rule out the hypothesis thatlow-frequency tACS applied at conventional current intensitiescan acutely entrain slow-wave, spindle, gamma, or theta activity.We conclude that previous reports of behavioral effects of slowoscillating tACS applied during NREM sleep and waking rest onmemory consolidation are not the result of direct neuronalentrainment. We discuss alternative mechanisms and proposenew directions for research.
ResultsIntracranial measurements of induced electric fields. Weapplied low-frequency sinusoidal tACS (0.75, 1 Hz), on 13patients with medication-refractory epilepsy with implanted
S1LH
S7RH
S13RH
S14RH
S8RH
S9RH
A2RH
Grid Strip Depth
A3LH
A4LH
S2LH
S3LH
S10LH
A1LH
S5LH
S6LH
S4RH
S11RH
S12RH
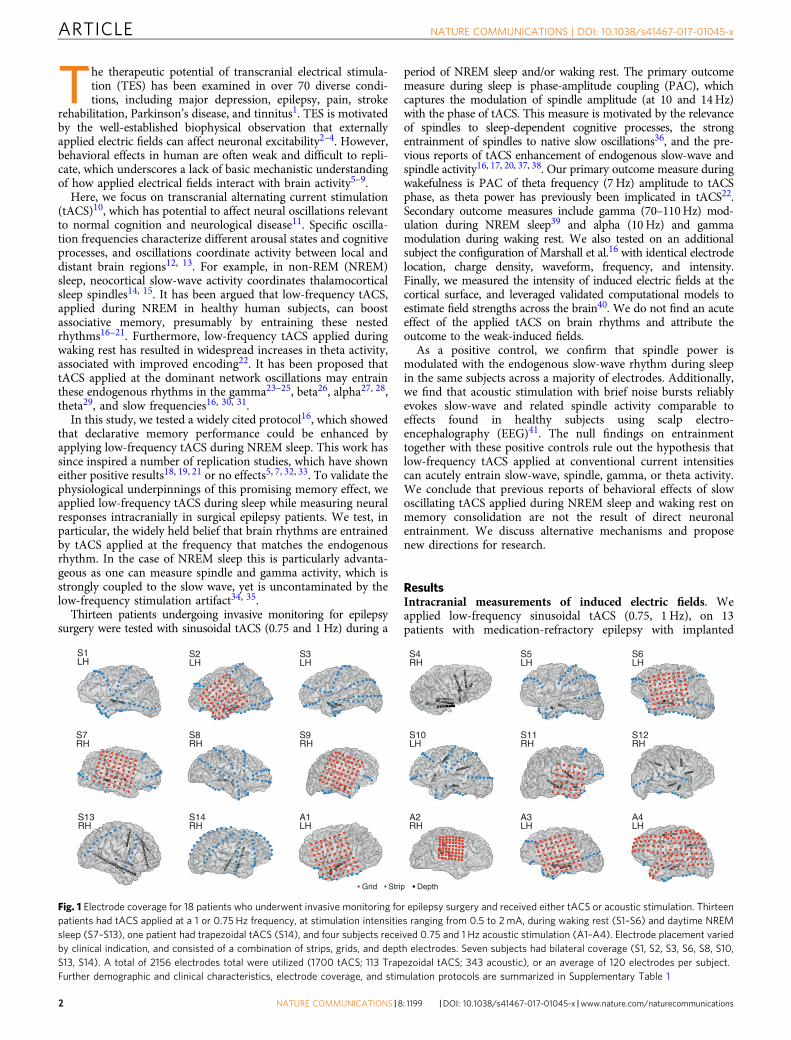
Fig. 1 Electrode coverage for 18 patients who underwent invasive monitoring for epilepsy surgery and received either tACS or acoustic stimulation. Thirteenpatients had tACS applied at a 1 or 0.75 Hz frequency, at stimulation intensities ranging from 0.5 to 2mA, during waking rest (S1–S6) and daytime NREMsleep (S7–S13), one patient had trapezoidal tACS (S14), and four subjects received 0.75 and 1 Hz acoustic stimulation (A1–A4). Electrode placement variedby clinical indication, and consisted of a combination of strips, grids, and depth electrodes. Seven subjects had bilateral coverage (S1, S2, S3, S6, S8, S10,S13, S14). A total of 2156 electrodes total were utilized (1700 tACS; 113 Trapezoidal tACS; 343 acoustic), or an average of 120 electrodes per subject.Further demographic and clinical characteristics, electrode coverage, and stimulation protocols are summarized in Supplementary Table 1
ARTICLE NATURE COMMUNICATIONS | DOI: 10.1038/s41467-017-01045-x
2 NATURE COMMUNICATIONS |8: 1199 |DOI: 10.1038/s41467-017-01045-x |www.nature.com/naturecommunications

subdural and depth electrodes (Fig. 1; Methods; SupplementaryTable 1). Overall, we recorded and analyzed signals from 1700electrodes (mean 131 electrodes per subject) from the 13 patientsreceiving TES using this protocol. The positions of the recordingelectrodes sites in each patient are shown in Fig. 1. For stimula-tion, two scalp electrodes (2 cm × 2 cm rubber electrodes) wereplaced over the frontopolar and occipital poles, accessible underthe surgical bandage. The aim was to generate the strongestpossible fields in the brain by keeping electrodes at the furthestdistance on the skull42, while remaining apart from temporalcraniotomies so as to replicate the current flow of normal headanatomy43. We confirmed that the craniotomy defect had onlyminor effects on field intensities as models of current flow withand without the defect yield comparable field intensities (0.05±0.02 V/m and 0.04± 0.02 V/m, respectively, mean± Std acrosssubjects). In one patient (S10), the stimulation electrodes wereplaced at three additional locations to examine the effects ofelectrode placement on extracerebral and intracerebral currentspread. For three subjects (subjects S11–S13), frontal electrodeswere offset to the left or right (Fp1 or Fp2) so that intracranialelectrode coverage, which was largely constrained to one hemi-sphere, covered areas of maximal electric fields and therebyoptimize recording of potential entrainment effects. Maximalstimulation intensity of tACS was adjusted for each subject basedon amplifier saturation and patient sensation. Intensity rangedfrom 0.5 to 2.5 mA (current density 0.125–0.625 mAmA/cm2),which is stronger than in previous reports5, 7, 16, 18, 19, 32.
Since the electrical field, or the voltage gradient (V/m), inducedin cortex critically determines neuronal polarization44 and thusneuronal activity4, 45, we measured the local gradients inelectrodes across all subdural and depth electrodes. We calculatedthe electric fields in the direction of neighboring electrodes(i.e., the projected field; Fig. 2a) scaled to correspond to 1 mA ofstimulation (voltages scale linearly with applied currents up tosaturation levels of the amplifiers40). The median projected fieldmeasured across all electrode locations and subjects is 0.02 V/m.At the highest current intensity tested (2.5 mA), peak intensityreaches only 0.16 V/m across recording electrodes (S10).
To assess the induced electric fields over brain areas notsampled by electrode recordings and in the direction of maximalfield intensity, we used previously established modeling techni-ques40. Briefly, computational models were individualized foreach patient based on their magnetic resonance imaging (MRI)images and calibrated with the measured electric fields in each
patient. The models were then used to predict field intensitiesthroughout the brain. For one patient (subject S13), electric fielddistribution for four different stimulation electrode configura-tions were estimated. The simulated electric fields predict themeasured fields well (r= 0.81± 0.12, mean and standarddeviation across N= 10 subjects modeled, all p< 10−5). Themodeling results show larger fields for some locations of the brainas compared to the recorded fields (Fig. 2b, c), as expected giventhe limited electrode coverage. Maximal field magnitudes athippocampal depth electrodes have a median of 0.05 mV/mmand a maximum of 0.11 V/m, for 2 mA stimulation intensity(N= 8 subjects). Median value across all the brains and electrodelocations is 0.08 V/m (Fig. 2).
Spindles entrain to the phase of endogenous slow waves. Of the13 subjects with tACS, 7 were stimulated with several 5 or 10-minblocks at 0.75 and 1 Hz during either daytime or nocturnalNREM sleep (Supplementary Table 1). Four subjects werestimulated during daytime NREM sleep; three were stimulatedduring nocturnal NREM sleep; and six were stimulated duringwaking rest. Duration and conditions of stimulation for eachsubject varied based on clinical constraints and the total time inNREM sleep (sleep stages N2 and N3, American Academy ofSleep Medicine 2012 convention46).
Sleep data from the seven subjects (subjects S7–S13) wereanalyzed over two separate nights without stimulation. We firstvisually identified periods of NREM sleep in the intracranialrecordings. The average duration of the NREM recorded was30.0± 10.5 min. Slow-wave activity spans broad frequencyspectrum between 0.5 and 4 Hz with no clear peak in thefrequency spectrum within these three octaves (SupplementaryFig. 6 and Supplementary Note 1) consistent with scalp EEGrecordings in normal subjects47–49. Therefore, we analyzedactivity and stimulated at both 0.75 and 1 Hz, values previouslyused in the literature16, 22, 31. As a primary outcome measure, wetested the modulation of spindle amplitude (for fast spindles: 14Hz bandpass filter with 7 Hz bandwidth; for slow spindles: 10 Hzbandpass with 5 Hz bandwidth) by the phase of the endogenousslow oscillations (1 Hz bandpass filter with 1 Hz bandwidth).PAC was measured with the modulation index for individualelectrodes and statistical significance was established usingsurrogate data with randomized phase (see “Methods”),here and in the remainder of the text. Recording sites that
0.4
a b cField proj. (recordings)
Subject Subject Subject
Field mag. (models, at electrodes) Field mag. (models, entire brain)
1 2 3 4 5 6 7 8 910
A10
B10
C10
D 11 12 13 1 2 3 4 5 6 7 8 910
A10
B10
C10
D 11 12 13 1 2 3 4 5 6 7 8 910
A10
B10
C10
D 11 12 13
0.3
0.2V/m
0.1
0
0.4
0.3
0.2V/m
0.1
0
0.4
0.3
0.2V/m
0.1
0
Fig. 2 Measured and estimated electric field magnitudes. a Field projections calculated as the difference in recorded voltages between neighboringelectrodes divided by electrode distance for each subject (with four montage orientations shown for S10), b field magnitudes at electrode locationspredicted by calibrated current-flow models, and c model-predicted field magnitude across the entire brain. Red lines indicate the medians, and boxes spanfrom 5 to 95% of the data, with whiskers extending to the minima and maxima. All values shown here correspond to the maximal current intensity appliedfor each subject during stimulation (S1: 1 mA; S2: 0.75mA; S3: 1 mA; S4: 1 mA; S5: 1 mA; S6: 1 mA; S7: 1.5 mA; S8: 2 mA; S9: 1.5 mA; S10A: 0.3 mA; S10B: 1mA; S10C: 1 mA; S10D: 0.3 mA; S11: 0.3 mA; S12: 1 mA; S13: 1 mA). The difference in magnitude across subjects is primarily due to these varying stimulationintensities
NATURE COMMUNICATIONS | DOI: 10.1038/s41467-017-01045-x ARTICLE
NATURE COMMUNICATIONS |8: 1199 |DOI: 10.1038/s41467-017-01045-x |www.nature.com/naturecommunications 3
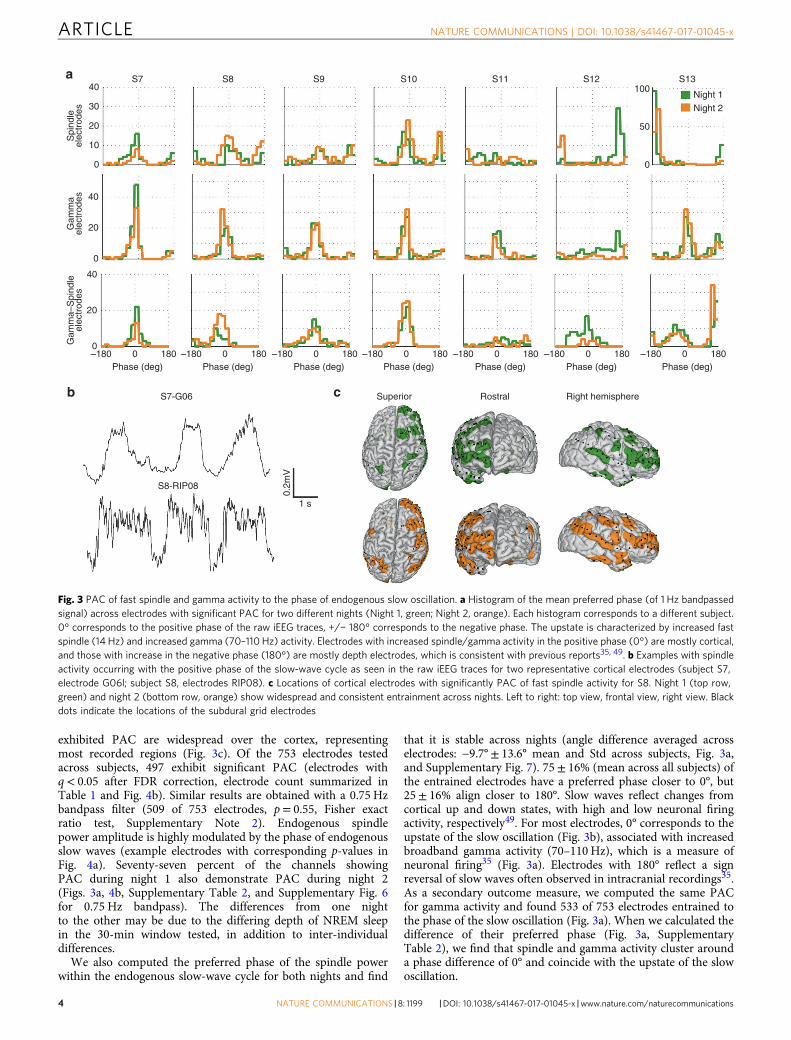
exhibited PAC are widespread over the cortex, representingmost recorded regions (Fig. 3c). Of the 753 electrodes testedacross subjects, 497 exhibit significant PAC (electrodes withq< 0.05 after FDR correction, electrode count summarized inTable 1 and Fig. 4b). Similar results are obtained with a 0.75 Hzbandpass filter (509 of 753 electrodes, p= 0.55, Fisher exactratio test, Supplementary Note 2). Endogenous spindlepower amplitude is highly modulated by the phase of endogenousslow waves (example electrodes with corresponding p-values inFig. 4a). Seventy-seven percent of the channels showingPAC during night 1 also demonstrate PAC during night 2(Figs. 3a, 4b, Supplementary Table 2, and Supplementary Fig. 6for 0.75 Hz bandpass). The differences from one nightto the other may be due to the differing depth of NREM sleepin the 30-min window tested, in addition to inter-individualdifferences.
We also computed the preferred phase of the spindle powerwithin the endogenous slow-wave cycle for both nights and find
that it is stable across nights (angle difference averaged acrosselectrodes: −9.7°± 13.6° mean and Std across subjects, Fig. 3a,and Supplementary Fig. 7). 75± 16% (mean across all subjects) ofthe entrained electrodes have a preferred phase closer to 0°, but25± 16% align closer to 180°. Slow waves reflect changes fromcortical up and down states, with high and low neuronal firingactivity, respectively49. For most electrodes, 0° corresponds to theupstate of the slow oscillation (Fig. 3b), associated with increasedbroadband gamma activity (70–110 Hz), which is a measure ofneuronal firing35 (Fig. 3a). Electrodes with 180° reflect a signreversal of slow waves often observed in intracranial recordings35.As a secondary outcome measure, we computed the same PACfor gamma activity and found 533 of 753 electrodes entrained tothe phase of the slow oscillation (Fig. 3a). When we calculated thedifference of their preferred phase (Fig. 3a, SupplementaryTable 2), we find that spindle and gamma activity cluster arounda phase difference of 0° and coincide with the upstate of the slowoscillation.
S7S
pind
leel
ectr
odes
Gam
ma
elec
trod
esG
amm
a–S
pind
leel
ectr
odes
40a
b c
100Night 1Night 2
50
0
40
30
20
20
10
0
0
40
20
0–180 0 180
Phase (deg) Phase (deg)
S7-G06
S8-RIP08
0.2m
V
1 s
Superior Rostral Right hemisphere
Phase (deg) Phase (deg) Phase (deg) Phase (deg) Phase (deg)–180 0 180 –180 0 180 –180 0 180 –180 0 180 –180 0 180 –180 0 180
S8 S9 S10 S11 S12 S13
Fig. 3 PAC of fast spindle and gamma activity to the phase of endogenous slow oscillation. a Histogram of the mean preferred phase (of 1 Hz bandpassedsignal) across electrodes with significant PAC for two different nights (Night 1, green; Night 2, orange). Each histogram corresponds to a different subject.0° corresponds to the positive phase of the raw iEEG traces, +/− 180° corresponds to the negative phase. The upstate is characterized by increased fastspindle (14 Hz) and increased gamma (70–110 Hz) activity. Electrodes with increased spindle/gamma activity in the positive phase (0°) are mostly cortical,and those with increase in the negative phase (180°) are mostly depth electrodes, which is consistent with previous reports35, 49. b Examples with spindleactivity occurring with the positive phase of the slow-wave cycle as seen in the raw iEEG traces for two representative cortical electrodes (subject S7,electrode G06l; subject S8, electrodes RIP08). c Locations of cortical electrodes with significantly PAC of fast spindle activity for S8. Night 1 (top row,green) and night 2 (bottom row, orange) show widespread and consistent entrainment across nights. Left to right: top view, frontal view, right view. Blackdots indicate the locations of the subdural grid electrodes
ARTICLE NATURE COMMUNICATIONS | DOI: 10.1038/s41467-017-01045-x
4 NATURE COMMUNICATIONS |8: 1199 |DOI: 10.1038/s41467-017-01045-x |www.nature.com/naturecommunications

In addition to measuring PAC, we implemented a spindledetection algorithm50 and computed their preferred phase withinthe slow-wave cycle. We obtain similar results with this spindledetection algorithm albeit with a smaller number of significantlyentrained electrodes (187 instead of 497 of 753 electrodes;Supplementary Table 2).
Low-frequency tACS does not entrain sleep spindles. In fourpatients during an afternoon nap, and three patients duringnight-time sleep, we applied several 5–10-min blocks of con-tinuous stimulation during NREM sleep (Stages 2 and 3). Wetested tACS at 0.75 and 1 Hz consistent with previousstudies16, 17. We reasoned that if the applied low-frequency tACSentrains endogenous slow-wave activity, then spindle power,which is coupled to slow-wave activity, should occur in phasewith the applied fields. Because slow-wave activity cannot bedirectly assessed during tACS due to the stimulation artifact,spindle power (14, 10 Hz) was used as an index of the slow-waverhythm. We used identical PAC processing and statistical tests aswith endogenous sleep (modulation index r, assessed for sig-nificance with phase-randomized surrogate data), with theexception that phase could now be inferred exactly from thestimulation artifact, readily observed in the raw recordings(Supplementary Fig. 4). In subject S8, we find significant PAC offast spindle power (14 Hz band) in one 1 of 116 electrodes aftercorrecting for multiple comparisons across electrodes (FDR, q<0.05; Fig. 4b, for this single electrode N= 292 cycles,p= 0.0003 prior for FDR correction). However, PAC in thiselectrode does not persist in following stimulation blocks sepa-rated by only 5-min intervals. The strength of evidence for PAC iscompared across blocks in Supplementary Fig. 8. Other subjects(S7, S9, S10) do not demonstrate significant fast spindleentrainment (at q< 0.05) during any stimulation blocks.Figure 4b shows a summary of all electrodes tested at 1 Hz. Forslow spindle power (10 Hz), only 1 of 98 electrodes demonstratessignificant entrainment after correcting for multiple comparisons(FDR, q< 0.05, r= 7.48, N= 216 cycles, p= 0.0005 prior to FDRcorrection), but this was not maintained across stimulation blocks(Table 1).
To further increase the power of the statistical test wecombined the data across tACS blocks. The total stimulationtime tested after concatenating all blocks was 30 min (subject S7),30 min (subject S8), 20 min (subject S9, 1 Hz), 10 min (subject S9,0.75 Hz), 10 min (subject S10), 20 min (subject S11), 7.5 min(subject S12), 20 min (subject S13, 1 Hz), and 20 min (subject S13,0.75 Hz). After concatenating all blocks and FDR correction, wefind no electrodes demonstrating significant spindle entrainmentat 14 or 10 Hz.
In three subjects (S9, S11, S13) we also tested entrainment ofspindle power during tACS at 0.75 Hz as this frequency is acommonly used parameter in previously published studies16, 17.Figure 4b shows a summary of all electrodes tested at 0.75 and 1Hz. Only one electrode (out of 93 total electrodes) in one of thethree subjects (S9) tested demonstrates fast spindle entrainmentwith 0.75 Hz tACS comparisons (FDR, q< 0.05, r= 1.18, N= 216cycles, p= 0.0001 prior to FRD correction), and only in one out oftwo stimulation blocks. In summary, no stable entrainment ofspindle activity to the applied electric fields was detected for low-frequency tACS applied for intensities of up to 2.5 mA duringNREM sleep.
Low-frequency tACS does not alter spindle-gamma alignment.Unlike applied stimulation waveforms, which remain steadyduring application, the endogenous slow waves remain periodicfor at most two cycles (Supplementary Fig. 5), and are more oftenisolated events. This lack of temporal coherence is the source ofthe broadness of the slow-wave activity spectrum and lack of awell-defined peak in most electrodes (Supplementary Fig. 6).Because the endogenous slow-wave oscillation is not reliablydiscerned during stimulation due to the overwhelming stimula-tion artifact, we used gamma activity to infer the phase of theendogenous slow-wave rhythm. It is possible that tACS did notentrain spindle activity, but nonetheless interferes with the slow-wave rhythm, which is thought to coordinate activity in higherfrequency bands. We therefore tested whether low-frequencytACS disrupts the temporal alignment of gamma and spindleactivity, as measured by the cross-correlation of the instantaneousamplitude of these two rhythms (Fig. 5). As expected from the
Table 1 Summary of PAC results across all subjects and conditions tested
Stimulation(subject ID)
Frequency Arousalstate
Subjects Total #electr.
# electr.tested
Freq. bandtested
# electr.entrained
Consistent acrossblocks (%)
None (S7–S13) 1 Hzendogenous
NREM 7 860 753 14 Hz (fastspindle)
497 77
None (S7–S13) 1 Hzendogenous
NREM 7 860 753 10 Hz (slowspindle)
361 57
tACS (S7–S13) 1 Hz (.75 Hz) NREM 7 860 598 14 Hz (fastspindle)
2 (1) 0
tACS (S7–S13) 1 Hz (.75 Hz) NREM 7 860 598 10 Hz (slowspindle)
1 0
tACS (S1–S6) 1 Hz Wake 5 716 584 7 Hz (theta) 0 0tACS (S1–S6) 1 Hz Wake 5 714 578 90Hz (high
gamma)1 0
tACS (S1–S6) 1 Hz Wake 6 840 695 10 Hz (alpha) 8 0Acoustic (A1–A4) 1 Hz (0.75
Hz)NREM 4 448 343 14 Hz (fast
spindle)20 (51) 4
Acoustic (A1–A4) 1 Hz (0.75Hz)
NREM 4 448 343 10 Hz (slowspindle)
16 (33) 4
Trapezoidal (S14) 0.75 Hz NREM 1 126 113 1 Hz (slow-wave)
0 0
Columns indicate (from left to right): the type of stimulation, if any, along with the subject ID; the frequency of stimulation or analysis that provided the phase for the PAC measure; the arousal state ofthe subject; number of subjects tested; total number of electrodes tested across all subjects; frequency band that provided the amplitude for the PAC measure; total number of electrodes that showedsignificant entrainment in at least one block of stimulation/night; fraction of electrodes that entrained consistently across two or more blocks/nights of all electrodes tested
NATURE COMMUNICATIONS | DOI: 10.1038/s41467-017-01045-x ARTICLE
NATURE COMMUNICATIONS |8: 1199 |DOI: 10.1038/s41467-017-01045-x |www.nature.com/naturecommunications 5
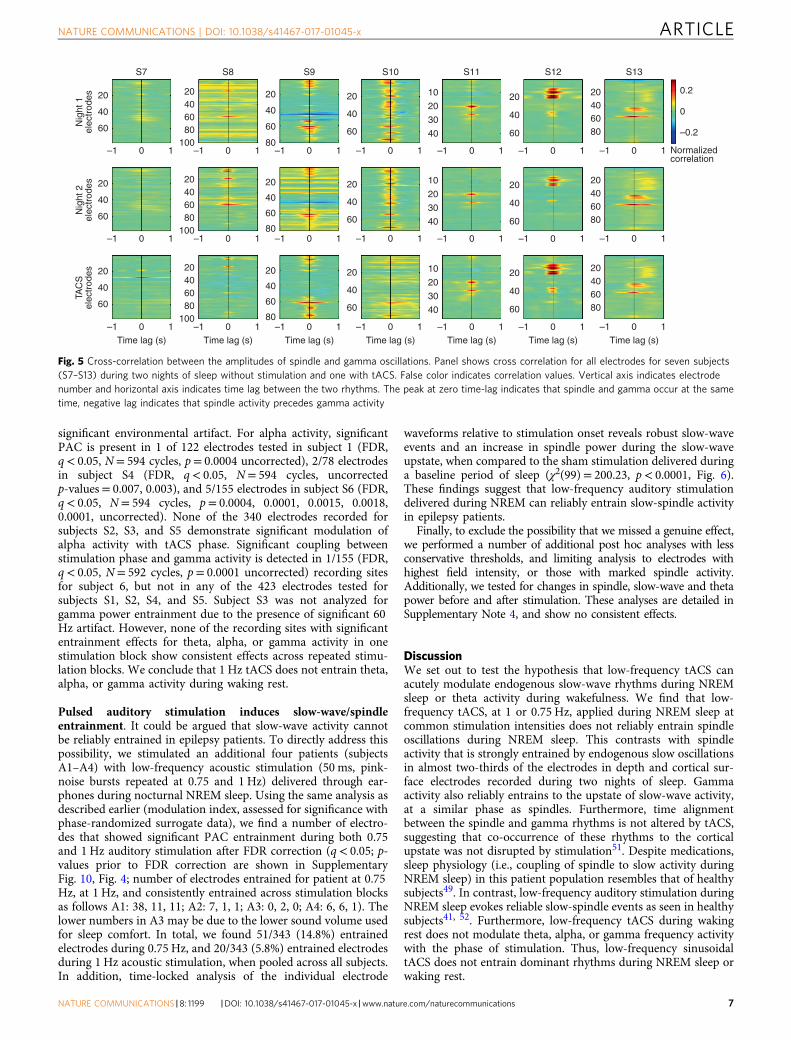
alignment of the two rhythms to the 0° phase or cortical upstateduring endogenous sleep (Fig. 3a), the cross-correlation of thegamma and spindle power is maximal at zero-time delay (themedian across electrodes and subjects S7–S13± the interquartilerange is 0.0020± 0.16 s) for endogenous NREM sleep (Fig. 5,Nights 1 and 2). During stimulation, the temporal relationship ofspindle with gamma activity (with a time lag of zero. Night 1:−0.0156± 0.020 s; Night 2: −0.0078± 0.023 s) is maintained(Fig. 5). This suggests that tACS does not disrupt the temporalcoordination of spindle and gamma activity.
Low-frequency trapezoidal tACS does not entrain slow waves.To further test our null findings, we performed a close replicationof the original study in which tACS was found to enhance slow-wave activity16. This was performed in one additional surgicalpatient (subject S14), during night-time sleep. We used the samemontage, electrodes, waveform, and (lower) stimulation intensityof that earlier study16 (bilateral ring electrodes on F3/F4 andmastoids with 0.75 Hz on/off trapezoid at 0.52 mA) and stimu-lated during NREM sleep periods. This electrode placement wasfacilitated in this one subject by a custom surgical bandage. Thetrapezoidal waveform does not permit analysis during stimulationdue to the broad band artifacts they generate (for this reason weused sinusoidal stimulation for the majority of the experiments).
Thus, here we analyzed whether the slow-wave activity immedi-ately after stimulation remained time-aligned across trials fol-lowing previous methods16, 37. To achieve comparable statisticalpower to these earlier studies in a single subject we stimulated in80 short blocks (8 cycles, or 10 s duration each; see also discussionon statistical power in Supplementary Note 3). After correctingfor multiple comparisons (FDR, q< 0.05), none of the 113 elec-trodes exhibit phase-locked slow-wave oscillations (0.5–1.5 Hz) inthe subsequent stimulation-free intervals (using Rayleigh test fornon-uniformity, see “Methods”; uncorrected p-values reported inSupplementary Fig. 12). Remarkably, subsequent clinical evalua-tion did not reveal any electrical after-discharge or interictalabnormalities; the patient was diagnosed as non-epileptic.
Low-frequency tACS does not modulate theta during wake-fulness. During waking rest, we also tested whether the appliedfield modulates theta activity (7 Hz bandpass, 3.5 Hz bandwidth)as a primary outcome measure, and alpha (10 Hz bandpass, 5 Hzbandwidth) or gamma activity (90 Hz bandpass, 40 Hz band-width) as exploratory outcome measures. We applied 1 Hz tACSto six patients during wakeful rest. After correcting for multiplecomparisons (FDR, q< 0.05), none of the 584 electrodes testedfor subjects S1–S4 and S6 exhibit significant PAC. Subject S5 wasnot analyzed for theta entrainment due to the presence of
S7p<0.0001
p=0.0105
p=0.1506 p=0.0100 p=0.8540 p=0.0474 p=0.2342 p=0.4517 p=0.9433 p=0.0005 p=0.0007 p=0.0006 p<0.0001
p=0.0002 p=0.0003 p=0.0006 p=0.0006 p=0.0046 p<0.0001 p<0.0001 p<0.0001 p<0.0001p<0.0001
0.2
aN
ight
1
Night 1 Night 2 tACS Acoustic
Stim
ulat
ion
Nig
ht 2
Spi
ndle
am
p. (
a.u)
0.1
0
0.2
0.1
0
0.2
0.1
0
–180 0 180
S8p=0.0002
–180 0 180
S9p<0.0001
–180 0 180
S10p<0.0001
–180 0 180
S11p<0.0001
–180 0 180
S12p<0.0001
–180 0 180
S13p=0.0027
–180 0 180
A1p=0.0084
–180 0 180
A2p<0.0001
–180 0 180
A3p=0.0052
–180 0 180
A4
b
Night Night Night Night Night Night Night Night Night Night TACS(1 Hz)
TACS(1 Hz)
TACS(1 Hz | 0.75 Hz)
TACS(1 Hz | 0.75 Hz)
AS(0.75|1 Hz)
AS(0.75|1 Hz)
AS(0.75|1 Hz)
AS(0.75|1 Hz)
TACS(1 Hz)
TACS(0.75 Hz)
TACS(1 Hz)
Ele
ctro
des
(#)
150
100
50
0
S7 S8 S9 S10 S11 S12 S13 A1 A2 A3 A4
p=0.0034
–180 0 180
–180 0 180 –180 0 180 –180 0 180 –180 0 180 –180 0 180 –180 0 180 –180 0 180 –180 0 180 –180 0 180 –180 0 180 –180 0 180
–180 0 180 –180 0 180 –180 0 180 –180 0 180 –180 0 180 –180 0 180 –180 0 180 –180 0 180 –180 0 180 –180 0 180 –180 0 180Phase (deg) Phase (deg) Phase (deg) Phase (deg) Phase (deg) Phase (deg) Phase (deg) Phase (deg) Phase (deg) Phase (deg) Phase (deg)
Night
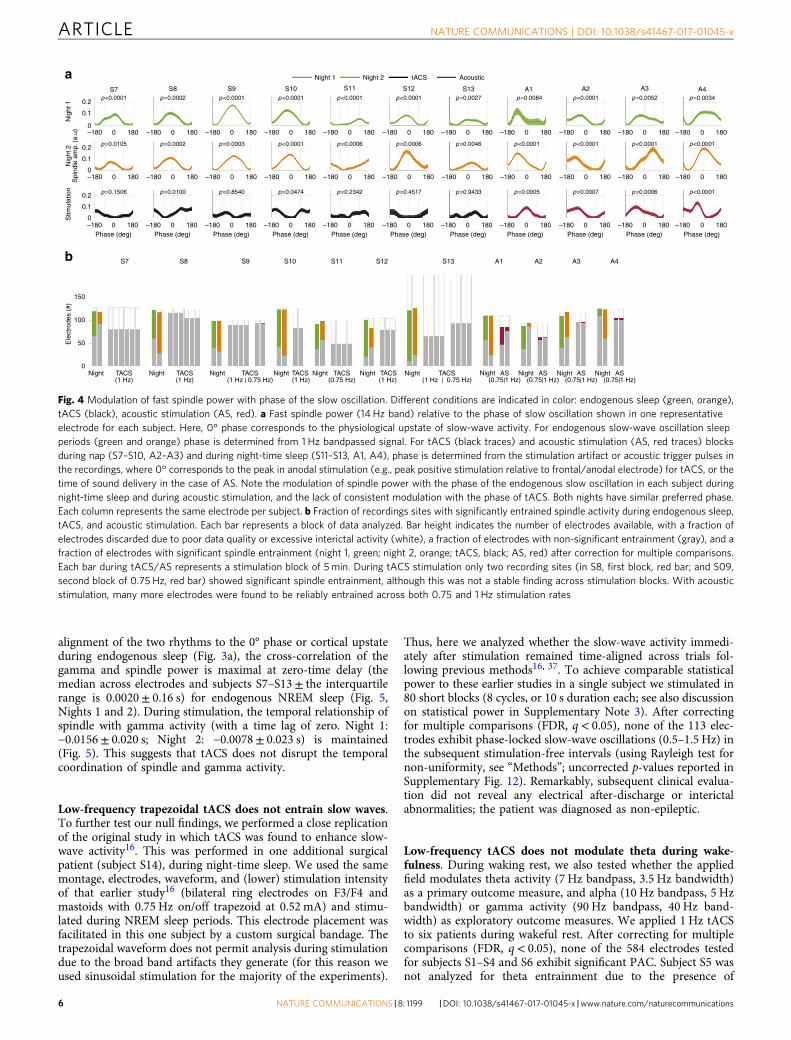
Fig. 4 Modulation of fast spindle power with phase of the slow oscillation. Different conditions are indicated in color: endogenous sleep (green, orange),tACS (black), acoustic stimulation (AS, red). a Fast spindle power (14 Hz band) relative to the phase of slow oscillation shown in one representativeelectrode for each subject. Here, 0° phase corresponds to the physiological upstate of slow-wave activity. For endogenous slow-wave oscillation sleepperiods (green and orange) phase is determined from 1 Hz bandpassed signal. For tACS (black traces) and acoustic stimulation (AS, red traces) blocksduring nap (S7–S10, A2–A3) and during night-time sleep (S11–S13, A1, A4), phase is determined from the stimulation artifact or acoustic trigger pulses inthe recordings, where 0° corresponds to the peak in anodal stimulation (e.g., peak positive stimulation relative to frontal/anodal electrode) for tACS, or thetime of sound delivery in the case of AS. Note the modulation of spindle power with the phase of the endogenous slow oscillation in each subject duringnight-time sleep and during acoustic stimulation, and the lack of consistent modulation with the phase of tACS. Both nights have similar preferred phase.Each column represents the same electrode per subject. b Fraction of recordings sites with significantly entrained spindle activity during endogenous sleep,tACS, and acoustic stimulation. Each bar represents a block of data analyzed. Bar height indicates the number of electrodes available, with a fraction ofelectrodes discarded due to poor data quality or excessive interictal activity (white), a fraction of electrodes with non-significant entrainment (gray), and afraction of electrodes with significant spindle entrainment (night 1, green; night 2, orange; tACS, black; AS, red) after correction for multiple comparisons.Each bar during tACS/AS represents a stimulation block of 5 min. During tACS stimulation only two recording sites (in S8, first block, red bar; and S09,second block of 0.75 Hz, red bar) showed significant spindle entrainment, although this was not a stable finding across stimulation blocks. With acousticstimulation, many more electrodes were found to be reliably entrained across both 0.75 and 1 Hz stimulation rates
ARTICLE NATURE COMMUNICATIONS | DOI: 10.1038/s41467-017-01045-x
6 NATURE COMMUNICATIONS |8: 1199 |DOI: 10.1038/s41467-017-01045-x |www.nature.com/naturecommunications
significant environmental artifact. For alpha activity, significantPAC is present in 1 of 122 electrodes tested in subject 1 (FDR,q< 0.05, N= 594 cycles, p= 0.0004 uncorrected), 2/78 electrodesin subject S4 (FDR, q< 0.05, N= 594 cycles, uncorrectedp-values= 0.007, 0.003), and 5/155 electrodes in subject S6 (FDR,q< 0.05, N= 594 cycles, p= 0.0004, 0.0001, 0.0015, 0.0018,0.0001, uncorrected). None of the 340 electrodes recorded forsubjects S2, S3, and S5 demonstrate significant modulation ofalpha activity with tACS phase. Significant coupling betweenstimulation phase and gamma activity is detected in 1/155 (FDR,q< 0.05, N= 592 cycles, p= 0.0001 uncorrected) recording sitesfor subject 6, but not in any of the 423 electrodes tested forsubjects S1, S2, S4, and S5. Subject S3 was not analyzed forgamma power entrainment due to the presence of significant 60Hz artifact. However, none of the recording sites with significantentrainment effects for theta, alpha, or gamma activity in onestimulation block show consistent effects across repeated stimu-lation blocks. We conclude that 1 Hz tACS does not entrain theta,alpha, or gamma activity during waking rest.
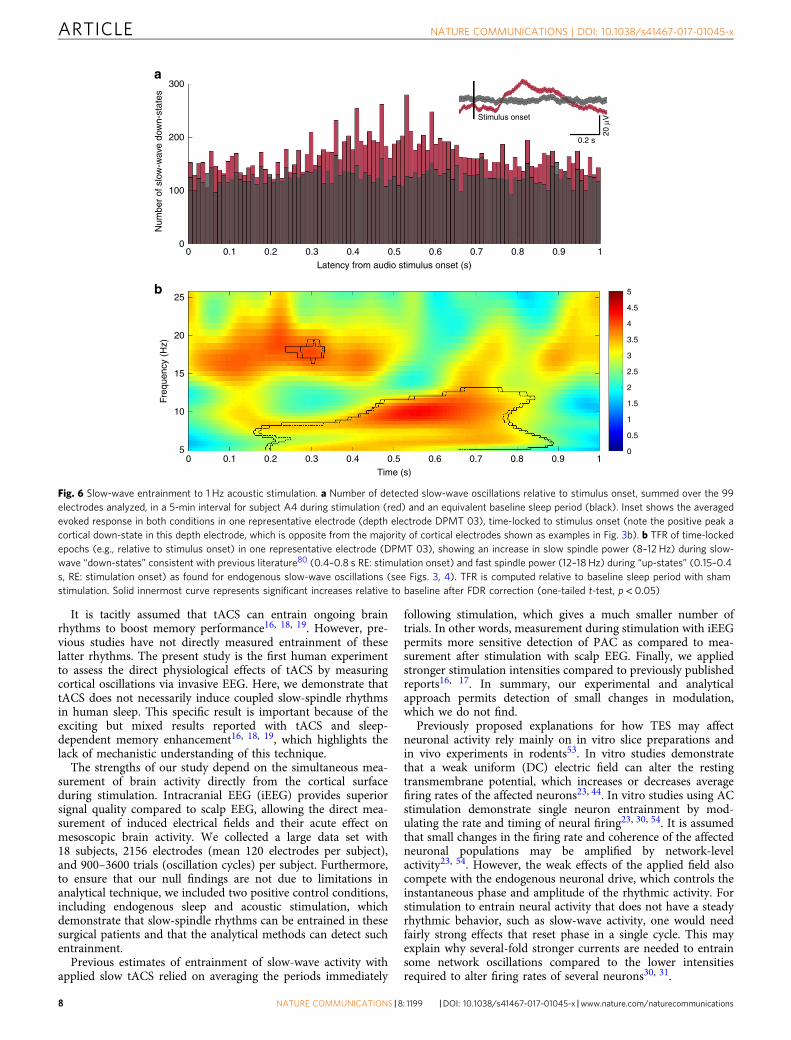
Pulsed auditory stimulation induces slow-wave/spindleentrainment. It could be argued that slow-wave activity cannotbe reliably entrained in epilepsy patients. To directly address thispossibility, we stimulated an additional four patients (subjectsA1–A4) with low-frequency acoustic stimulation (50 ms, pink-noise bursts repeated at 0.75 and 1 Hz) delivered through ear-phones during nocturnal NREM sleep. Using the same analysis asdescribed earlier (modulation index, assessed for significance withphase-randomized surrogate data), we find a number of electro-des that showed significant PAC entrainment during both 0.75and 1 Hz auditory stimulation after FDR correction (q< 0.05; p-values prior to FDR correction are shown in SupplementaryFig. 10, Fig. 4; number of electrodes entrained for patient at 0.75Hz, at 1 Hz, and consistently entrained across stimulation blocksas follows A1: 38, 11, 11; A2: 7, 1, 1; A3: 0, 2, 0; A4: 6, 6, 1). Thelower numbers in A3 may be due to the lower sound volume usedfor sleep comfort. In total, we found 51/343 (14.8%) entrainedelectrodes during 0.75 Hz, and 20/343 (5.8%) entrained electrodesduring 1 Hz acoustic stimulation, when pooled across all subjects.In addition, time-locked analysis of the individual electrode
waveforms relative to stimulation onset reveals robust slow-waveevents and an increase in spindle power during the slow-waveupstate, when compared to the sham stimulation delivered duringa baseline period of sleep (χ2(99)= 200.23, p< 0.0001, Fig. 6).These findings suggest that low-frequency auditory stimulationdelivered during NREM can reliably entrain slow-spindle activityin epilepsy patients.
Finally, to exclude the possibility that we missed a genuine effect,we performed a number of additional post hoc analyses with lessconservative thresholds, and limiting analysis to electrodes withhighest field intensity, or those with marked spindle activity.Additionally, we tested for changes in spindle, slow-wave and thetapower before and after stimulation. These analyses are detailed inSupplementary Note 4, and show no consistent effects.
DiscussionWe set out to test the hypothesis that low-frequency tACS canacutely modulate endogenous slow-wave rhythms during NREMsleep or theta activity during wakefulness. We find that low-frequency tACS, at 1 or 0.75 Hz, applied during NREM sleep atcommon stimulation intensities does not reliably entrain spindleoscillations during NREM sleep. This contrasts with spindleactivity that is strongly entrained by endogenous slow oscillationsin almost two-thirds of the electrodes in depth and cortical sur-face electrodes recorded during two nights of sleep. Gammaactivity also reliably entrains to the upstate of slow-wave activity,at a similar phase as spindles. Furthermore, time alignmentbetween the spindle and gamma rhythms is not altered by tACS,suggesting that co-occurrence of these rhythms to the corticalupstate was not disrupted by stimulation51. Despite medications,sleep physiology (i.e., coupling of spindle to slow activity duringNREM sleep) in this patient population resembles that of healthysubjects49. In contrast, low-frequency auditory stimulation duringNREM sleep evokes reliable slow-spindle events as seen in healthysubjects41, 52. Furthermore, low-frequency tACS during wakingrest does not modulate theta, alpha, or gamma frequency activitywith the phase of stimulation. Thus, low-frequency sinusoidaltACS does not entrain dominant rhythms during NREM sleep orwaking rest.
S7
20 20406080
20
40
60
80
20
40
60
80
20
40
60
80
20
40
10
2020 20 0.2
0
–0.2
Normalizedcorrelation
406080
20406080
20406080
30
40
10
20
30
40
10
20
30
40
40
60
20
40
60
20
40
60
60
20
40
60
20
40
60
100
20406080
100
20406080
100
Nig
ht 1
elec
trod
es
40
60
20
Nig
ht 2
elec
trod
es
40
60
20
TAC
Sel
ectr
odes
40
60
–1 0 1 –1 0 1 –1 0 1 –1 0 1 –1 0 1 –1 0 1 –1 0 1
–1 0 1 –1 0 1 –1 0 1 –1 0 1 –1 0 1 –1 0 1 –1 0 1
–1 0
Time lag (s) Time lag (s) Time lag (s) Time lag (s) Time lag (s) Time lag (s) Time lag (s)
1 –1 0 1 –1 0 1 –1 0 1 –1 0 1 –1 0 1 –1 0 1
S8 S9 S10 S11 S12 S13
Fig. 5 Cross-correlation between the amplitudes of spindle and gamma oscillations. Panel shows cross correlation for all electrodes for seven subjects(S7–S13) during two nights of sleep without stimulation and one with tACS. False color indicates correlation values. Vertical axis indicates electrodenumber and horizontal axis indicates time lag between the two rhythms. The peak at zero time-lag indicates that spindle and gamma occur at the sametime, negative lag indicates that spindle activity precedes gamma activity
NATURE COMMUNICATIONS | DOI: 10.1038/s41467-017-01045-x ARTICLE
NATURE COMMUNICATIONS |8: 1199 |DOI: 10.1038/s41467-017-01045-x |www.nature.com/naturecommunications 7
It is tacitly assumed that tACS can entrain ongoing brainrhythms to boost memory performance16, 18, 19. However, pre-vious studies have not directly measured entrainment of theselatter rhythms. The present study is the first human experimentto assess the direct physiological effects of tACS by measuringcortical oscillations via invasive EEG. Here, we demonstrate thattACS does not necessarily induce coupled slow-spindle rhythmsin human sleep. This specific result is important because of theexciting but mixed results reported with tACS and sleep-dependent memory enhancement16, 18, 19, which highlights thelack of mechanistic understanding of this technique.
The strengths of our study depend on the simultaneous mea-surement of brain activity directly from the cortical surfaceduring stimulation. Intracranial EEG (iEEG) provides superiorsignal quality compared to scalp EEG, allowing the direct mea-surement of induced electrical fields and their acute effect onmesoscopic brain activity. We collected a large data set with18 subjects, 2156 electrodes (mean 120 electrodes per subject),and 900–3600 trials (oscillation cycles) per subject. Furthermore,to ensure that our null findings are not due to limitations inanalytical technique, we included two positive control conditions,including endogenous sleep and acoustic stimulation, whichdemonstrate that slow-spindle rhythms can be entrained in thesesurgical patients and that the analytical methods can detect suchentrainment.
Previous estimates of entrainment of slow-wave activity withapplied slow tACS relied on averaging the periods immediately
following stimulation, which gives a much smaller number oftrials. In other words, measurement during stimulation with iEEGpermits more sensitive detection of PAC as compared to mea-surement after stimulation with scalp EEG. Finally, we appliedstronger stimulation intensities compared to previously publishedreports16, 17. In summary, our experimental and analyticalapproach permits detection of small changes in modulation,which we do not find.
Previously proposed explanations for how TES may affectneuronal activity rely mainly on in vitro slice preparations andin vivo experiments in rodents53. In vitro studies demonstratethat a weak uniform (DC) electric field can alter the restingtransmembrane potential, which increases or decreases averagefiring rates of the affected neurons23, 44. In vitro studies using ACstimulation demonstrate single neuron entrainment by mod-ulating the rate and timing of neural firing23, 30, 54. It is assumedthat small changes in the firing rate and coherence of the affectedneuronal populations may be amplified by network-levelactivity23, 54. However, the weak effects of the applied field alsocompete with the endogenous neuronal drive, which controls theinstantaneous phase and amplitude of the rhythmic activity. Forstimulation to entrain neural activity that does not have a steadyrhythmic behavior, such as slow-wave activity, one would needfairly strong effects that reset phase in a single cycle. This mayexplain why several-fold stronger currents are needed to entrainsome network oscillations compared to the lower intensitiesrequired to alter firing rates of several neurons30, 31.
300a
b
200
Num
ber
of s
low
-wav
e do
wn-
stat
esFr
eque
ncy
(Hz)
100
00 0.1 0.2 0.3 0.4 0.5
Latency from audio stimulus onset (s)
0.6 0.7 0.8
Stimulus onset
0.2 s
20 µ
V
0.9 1
5
4.5
4
3.5
3
2.5
2
1.5
1
0.5
00 0.1 0.2 0.3 0.4 0.5
Time (s)
0.6 0.7 0.8 0.9 1
25
20
15
10
5
Fig. 6 Slow-wave entrainment to 1 Hz acoustic stimulation. a Number of detected slow-wave oscillations relative to stimulus onset, summed over the 99electrodes analyzed, in a 5-min interval for subject A4 during stimulation (red) and an equivalent baseline sleep period (black). Inset shows the averagedevoked response in both conditions in one representative electrode (depth electrode DPMT 03), time-locked to stimulus onset (note the positive peak acortical down-state in this depth electrode, which is opposite from the majority of cortical electrodes shown as examples in Fig. 3b). b TFR of time-lockedepochs (e.g., relative to stimulus onset) in one representative electrode (DPMT 03), showing an increase in slow spindle power (8–12 Hz) during slow-wave “down-states” consistent with previous literature80 (0.4–0.8 s RE: stimulation onset) and fast spindle power (12–18 Hz) during “up-states” (0.15–0.4s, RE: stimulation onset) as found for endogenous slow-wave oscillations (see Figs. 3, 4). TFR is computed relative to baseline sleep period with shamstimulation. Solid innermost curve represents significant increases relative to baseline after FDR correction (one-tailed t-test, p< 0.05)
ARTICLE NATURE COMMUNICATIONS | DOI: 10.1038/s41467-017-01045-x
8 NATURE COMMUNICATIONS |8: 1199 |DOI: 10.1038/s41467-017-01045-x |www.nature.com/naturecommunications

Our null findings likely result from the weak-induced electricalfields. At the highest current intensity applied (2.5 mA), peakintensities reach only 0.16 V/m across recording electrodes.Although the recording electrodes may not capture the maximalelectric fields induced by a given stimulation montage, ourmodel-based extrapolations suggest that peak fields do not exceed0.43 V/m intracranially when stimulating at 2 mA40, which iscomparable to a recent report of 0.5 V/m as maximal intensities55.Thus, field magnitudes may be an order of magnitude smallerthan required to entrain slow-wave rhythms, which may explainwhy experimental attempts to entrain sleep rhythms for memoryenhancement have been inconsistent5, 7. To place these weak-induced fields into perspective, synchronous neuronal activityunder physiological conditions can generate approximately 1–2V/m gradient across the CA1 pyramidal layer during thetaoscillations in the hippocampus56 and during slow oscillations inthe neocortex30. Under ideal circumstances when the electricfields are applied in a phase-locked manner coupling directly withthe cellular membrane in vitro, 0.25 V/m can bias a single neu-ron’s spike threshold to induce cumulative effects and entrainnetwork oscillations23, 57. In behaving rats, hippocampal firingrate, but not local field potential oscillations, was modulated at athreshold of 1 V/m31. In other scenarios, 5 V/m or more may beneeded to entrain network oscillations30, 53.
The weak electric fields measured in our study suggest thathigher intensity stimulation may be required to instantaneouslyaffect network-level neuronal activity. The practical implicationof our findings is that new methods of neuromodulation, whichincrease the amount of current reaching the brain, are needed toadvance the field. However, transcranial stimulation intensity islimited by clinical considerations such as sensory perception.These constraints are especially relevant for sleep studies (one ofour subjects was wakened by >2 mA stimulation and we had todecrease the intensity), subject blinding58, and patient safety59.
Another possible explanation for our null findings is theobservation that endogenous slow-wave activity does not have asteady rhythm, but rather spans wide frequency range (0.5–4 Hz).In human sleep, slow waves appear to be unitary events, and aregular rhythm is preserved for at most two cycles. Thus, thecontinuous application of a weak, low-frequency stimulationwaveform aligns imprecisely to these irregular events. In order forspindle activity to align to the stimulation phase, the effect ofstimulation would have to be nearly instantaneous. This wouldrequire pacing of the endogenous rhythm on a nearly cycle-by-cycle basis. By contrast, the most sensitive effects of stimulation23
(at weak fields of 0.2 V/m) occur when the endogenous rhythm isnarrow-band such that stimulation effects can accumulate overmany cycles, leading to resonant phenomena. Our results there-fore do not rule out more sensitive resonant effects of tACS formore rhythmic narrow-band activity such as alpha and spindleoscillations38.
Finally, these null effects may result from the anatomical dif-ferences seen when scaling from in vitro to rodent to humanstudies. Due to complex cortical folding in humans, portions ofthe network that are differently oriented relative to the inducedpotential field may demonstrate both excitatory and inhibitorybehavior.
We acknowledge the difference in stimulating electrode pla-cement between our protocol and previously published protocols,yet do not conclude that the null effect is because of thisexperimental difference. Because of the clinical limitations of thesurgical bandage, we were able to place electrodes in the fron-topolar and occipital regions, directly below the surgical dressing.The advantage of maximizing electrode distance as in our pro-tocol is to decrease the amount of current shunted by the scalp(compared to electrode placement in the bilateral frontal regions
(F3/F4) and mastoids as prior). This generally should lead tostronger electric fields in the brain as compared to theF3/F4 montage42, as supported by our recently validated currentflow models40.
The positive control of acoustic stimulation demonstrates thatslow-wave and spindle activity can be modulated during NREMsleep in our patients. Acoustic stimulation has previously beenshown to enhance sleep oscillations in healthy subjects52 with anincrease in sleep-dependent memory consolidation41. Using alow-frequency acoustic analog of tACS during NREM, we observesleep spindles are modulated by the rhythmic stimulation in8–14.3% of the electrodes analyzed. Additionally, the timing ofspindle activity coincides with the upstate for both acoustic sti-mulation and endogenous slow waves. Together this suggests thatendogenous slow wave may have been entrained by the rhythmicstimulation. Regardless of the mechanism (entrained vs. inducedspindle), this indicates that modulation of sleep oscillations ispossible, and that the analytic techniques used to assessentrainment are sensitive to the PAC of slow-wave/spindle events.
There are, however, limitations of our study. First, because therecording electrodes are placed according to clinical indication,they do not necessarily capture the maximal electric fieldsinduced by a given stimulation montage. Despite broad coverageof the cortical surface, peak electric fields may occur outside therecorded areas (but should not exceed 0.43 V/m for 2 mA).Nonetheless, spindle entrainment during endogenous sleep andacoustic stimulation show the widespread nature of these corticalrhythms. Even if our electrodes did not capture the maximalelectric fields, we would have expected to see a small number ofelectrodes entrained from tACS. Second, while we did examinechanges in power before and after stimulation, the experimentswere not optimally designed for this purpose, and thus fluctua-tions that were found cannot be attributed to tACS, but are likelythe result for natural fluctuations of power within and acrossnights of sleep. Third, we only considered low-frequency stimu-lation. Given the dependence of oscillatory stimulation of thespecific of network rhythms53, these findings may not generalizeto other tACS frequencies. In summary, as with all null results,one cannot rule out effects outside the parameters tested here. Inparticular, it is possible that there were lasting effects on spindlepower, which we did not resolve here because of their naturalfluctuations during sleep on the time scales of minutes. Suchchanges were reported in past studies16, 21, 60 by averaging overmany subjects and may have resulted from the net-DC currentsused there, which we did not test here.
Patients with refractory focal-onset epilepsy undergoing sur-gical evaluation represent a unique opportunity to record directlyfrom the cortical surface during non-invasive stimulation. Whileaberrant local networks involved in seizure propagation areobserved, other cortical and subcortical functions are often con-sidered normal. The potential effects of antiepileptic medicationsmay decrease overall excitability, although some patients weretapered off all medications during stimulation. Widespread andstrong spindle entrainment by native slow oscillations duringsleep demonstrates that our methods detected physiologicallymeaningful changes despite medication use, similar to what hasbeen reported previously regarding sleep rhythms recorded inepilepsy surgical patients61. We demonstrate that entrainment ofspindle activity in epilepsy patients is possible with acoustic sti-mulation. Finally, an exact replication experiment of previouslypublished protocols, delivered to a healthy brain, confirmed theabsence of acute entrainment of slow waves and furtherstrengthens the generalizability of our results.
We emphasize that our null results for tACS do not contradictthe reported behavioral effects. While positive behavioral resultshave been found in rodents20, a meta-analysis on memory effects
NATURE COMMUNICATIONS | DOI: 10.1038/s41467-017-01045-x ARTICLE
NATURE COMMUNICATIONS |8: 1199 |DOI: 10.1038/s41467-017-01045-x |www.nature.com/naturecommunications 9
reports mixed results in humans33. There may be other means bywhich non-invasive stimulation affects brain activity in multipleindirect ways, including activation of afferent nerves58, 62, retinaand the vestibular apparatus63, astrocytes and perivascularelements64, 65, glial activation65, synaptic plasticity66, as well asthrough placebo effects67, which merit further exploration.
Our findings suggest that investigation of novel methods ofstimulation delivery are needed. This may include methods thatinduce stronger electric fields at the cortical surface (whileminding patient safety and sensation), or may be based onacoustic and other modes of sensory stimulation. Furthermore,applying current at the optimal phase of endogenous rhythms ina closed-loop manner may be more effective68. However, suchresponsive methods can be therapeutic only if the impaired net-work pattern is identified and continually monitored69, 70.
In some medically justified cases, chronic closed-loop feedbackstimulation may be beneficial. Electrode plates may be placeddirectly onto the skull or on the cortical surface to bypass theskin, as illustrated by an FDA-approved therapeutic device, usedto detect and disrupt electrographic seizures71. Further progressrequires the investigation of novel electrode arrangements andstimulation delivery to produce meaningful and reproduciblephysiological and behavioral effects.
At a minimum, the present data suggests that tACS at stimu-lation intensities of up to 2.5 mA does not entrain slow-waveactivity during NREM sleep. More generally, our result challengesthe common assumption that tACS entrains and enhance endo-genous rhythms. Thus, future studies will now have the burden ofproof when such claims are made.
MethodsHuman subjects. This study was performed in epilepsy patients undergoing sur-gical evaluation with iEEG monitoring at New York University Medical Center(NYUMC). The protocol was approved by the NYUMC Institutional Review Boardand the Clinical Trials Registration number was NCT02263274 (www.clinicaltrials.gov). Subjects were eligible according to pre-established criteria, including: (1) ageover 18 years old; (2) undergoing invasive monitoring for seizure localization forepilepsy surgery; and (3) ability to provide informed consent or have a legalguardian who could consent. Exclusion criteria included (1) significant cognitiveimpairment (IQ< 70), (2) facial or forehead skin breakdown that would interferewith surface electrode placement, (3) contraindication to MRI, (4) known adhesiveallergy, (5) space occupying lesion, and (6) subjects who had an electrographicseizure for 1 h prior to the stimulation procedure. All patients (n= 17) or theircaregivers provided informed consent. Subjects were enrolled between December2013 and May 2017. A table listing subject characteristics is included in Supple-mentary Table 1.
Sleep staging. Stimulation was performed after patients had entered at least 5 minof continuous NREM sleep, during a daytime nap or nocturnal sleep. Initial sleepstaging was performed by visual online analysis, for the presence of a slow-waveand spindle activity as detected in the real-time iEEG seen at the bedside by aphysician board-certified in clinical neurophysiology, as well as by direct clinicalobservation. As part of standard practice at NYU, an extradural lead is customarilyplaced near the vertex of the craniotomy to aid with spindle detection. When thepatient aroused or drifted into a lighter stage of sleep, stimulation was stopped. TheiEEG segments were later confirmed by a second board-certified physician to beconsistent with N2 and N3 sleep. During offline processing, we selected segmentsof NREM sleep for analysis by comparing raw spectrograms of sleep (after artifactsubtraction), to demonstrate that the depth of NREM sleep is similar across testingconditions (Supplementary Fig. 6).
iEEG recordings. iEEG was recorded from implanted subdural platinum-iridiumelectrodes embedded in silastic sheets (2.3 mm diameter contacts, 10 mmcenter–center spacing, Ad-Tech Medical Instrument, Racine, WI) or depth elec-trodes (1.1 mm diameter, 5–10 mm center–center spacing). The decision toimplant, placement or recording electrodes, and the duration of invasive mon-itoring were determined solely on clinical grounds and without reference to thisstudy. Electrodes were arranged as grid arrays (8 × 8 contacts, 10 or 5 mm center-to-center spacing), linear strips (1 × 4 to 12 contacts), or depth electrodes (1 × 8 or12 contacts), or some combination thereof. Subdural electrodes covered extensiveportions of lateral and medial frontal, parietal, occipital, and temporal cortex of theleft and/or right hemisphere.
Within 24 h after surgical implantation of electrodes, patients underwent apost-operative brain MRI to confirm subdural electrode placement. Electrode werelocalized and mapped onto the pre-implant and post-implant MRI using geometricmodels of the electrode strips/girds and the cortical surface72.
Here, we present an efficient method to accurately localize intracranial electrodearrays based on pre-implantation and post-implantation MR images thatincorporates array geometry and the individual’s cortical surface.
Clinical (macroelectrode) recording equipment. Recordings from grid, strip, anddepth electrode arrays were made using a NicoletOne C64 clinical amplifier (NatusNeurologics, Middleton, WI), bandpass filtered from 0.16–250 Hz and digitized at512 Hz. ECoG signals were referenced to a two-contact subdural strip facingtoward the skull near the craniotomy site. A similar two-contact strip screwed tothe skull was used for the instrument ground.
NeuroConn DC stimulator. The DC-STIMULATOR PLUS (NeuroConn, Ger-many) is a CE-certified medical device for conducting noninvasive TES in humans.The stimulator is a micro-processor-controlled constant current source, whichcontinuously monitors electrode impedance, and detect insufficient contact withthe skin. The device is battery powered, and therefore electrically isolated from theclinical recording electrodes and equipment.
Low-frequency tACS. We performed 0.75 and 1 Hz sinusoidal tACS on 13 epi-leptic patients with implanted subdural and depth electrodes. Seven subjects werestimulated during NREM sleep (four daytime nap; three nocturnal sleep) and sixsubjects were stimulated during waking rest, eyes closed. Patients were over 18years old and fluent in English. Subjects were excluded if they had frequent (>2)electroclinical seizures in the 24 h preceding stimulation. Patient characteristics andelectrode coverage are summarized in Supplementary Table 1 and Fig. 1.
All subjects tolerated scalp stimulation. All subjects who were stimulated duringnight-time sleep (N= 3, subjects 11–13) and most subjects during an afternoon nap(N= 4, subjects 7–10) were able to sleep through trials at stimulation intensitiesbetween 0.5 and 2 mA. One subject (subject 13) woke from sleep and reported anitching sensation during one stimulation block with 2.5 mA current intensity. Forthe tACS experiments, we recorded and analyzed from 1700 electrodes withoutartifacts (mean of 131 electrodes per subject, example electrode in Fig. 3b). Therewere no complications from stimulation, and no induced electrographic seizures.One patient (subject 7) had a typical electroclinical seizure during stimulation.Because this patient had frequent spontaneous seizures, it was determined by thepatient’s epileptologist that stimulation was unlikely to have caused the seizure.
Furthermore, we enrolled one subject (S14) who had a bilateral subdural stripand depth survey, to perform a precise replication experiment of prior protocols.This patient had multiple target clinical events captured, which were non-epilepticin nature. He did not have any interictal or ictal activity captured during 1 week ofmonitoring, even while medications were being withdrawn. In other words, thepatient did not demonstrate any epilepsy-related pathophysiology.
We reviewed the hour of iEEG recording prior to stimulation to exclude recentseizures. We performed a pre-stimulation clinical assessment (includingassessment of the stimulation skin site and neurologic examination). A physician(AL) was present at the bedside during the entire procedure to monitor for safety.The patient’s iEEG recording was monitored in real time at the bedside duringstimulation for seizures.
For patients S1–S13, two stimulating electrodes were placed medially over thefrontal and occipital poles (2 cm × 2 cm rubber electrodes) for patients S1–S10. Inpatients S10–S13 the frontal electrode was offset from midline by 3 cm (S10 andS13 left frontal; S11 and S12 right frontal) to minimize distance from stimulatingelectrodes to recording electrodes. In one patient S10, the stimulation electrodeswere placed at three additional locations to examine the effects of electrodeplacement on extracerebral and intracerebral current spread. Subjects were coveredwith a nickel-cadmium shroud to reduce environmental artifact during recording,and other sources of environmental noise (60 Hz) were minimized in the patientarea. The stimulation protocol used the NeuroConn DC Stimulator Plus(NeuroConn, Germany), with a biphasic sinusoidal waveform at 0.75 and 1 Hz, atvariable intensities between 0.3 and 2 mA, for 10 s (cycles) to determine the peakintensity at which amplifier saturation occurred. Thereafter, subjects werestimulated with TES at 0.75 and 1 Hz, at variable intensities up to the peakintensity, for a duration between 5 and 10 min (10 min for A1–A6 and 5min forS1–S4). Up to four blocks of stimulation were applied, until subjects woke up. Themore than ten-fold increase of the subdurally recorded iEEG amplitude, comparedto the EEG signal73, allowed for simultaneous recording and stimulation (up tosaturation levels of the amplifiers). Stimulation was immediately stopped in theevent of an electrographic seizure (S7). A repeat clinical assessment (includingassessment of stimulation skin site and neurologic examination) was performedafter stimulation.
For S14, who was enrolled to perform a replication experiment of priorprotocols, we selected a surgical patient who had a bilateral strip and depth survey.There were two windows that were cut into the patient’s surgical bandage to allowelectrode placement at the F3/F4 positions. Stimulation electrodes (8 mm Ag/Clring type) were applied bilaterally, with anodes at F3/F4 and cathodes on eachmastoid. To test for acute effects, we utilized a stimulation protocol using
ARTICLE NATURE COMMUNICATIONS | DOI: 10.1038/s41467-017-01045-x
10 NATURE COMMUNICATIONS |8: 1199 |DOI: 10.1038/s41467-017-01045-x |www.nature.com/naturecommunications
trapezoidal waveform (0.33 s ramp up/0.33 s steady state/0.33 s ramp down/0.33 szero current), 0.75 Hz, 0–0.26 mA, for 8 cycles on/8 cycles off (10.66 s ON/10.66 sOFF), for 80 cycles. Stimulation was started after the first 5 min of NREM sleep.
Low-frequency noise-burst auditory stimulation. Auditory stimulation consistedof 50 ms pink-noise bursts (1/f spectrum) repeated at a rate of 1 of 0.75 Hz to fourpatients (subjects A1–A4). Sound was delivered via flat-profile headphones (Bed-phones, Millwood, NY), which were placed on the patient’s ears. Placement of theheadphones required access under the surgical bandage and was administered byan epilepsy physician (AL), with patient verification of correct positioning.Acoustic pulses (50 ms, pink noise, 5 ms on/off ramps) were digitally generated anddelivered via a laptop placed at the bedside. The sound level of the stimulation wasmanually adjusted for each patient to maximize comfort (e.g., ability to sleep withsound playing in the background). The volume was recorded and estimates of thesound level presented to each subject were assessed via an ear simulator (KEMARHead and Torso simulator, Knowles Research, coupled to a B&K type 3134Pressure microphone and B&K type 2230 Sound Level Meter, Bruel & Kjaer,Denmark). Resultant peak sound pressure level estimates for each subject are 72 dBSPL (subject A1), 68 dB SPL (subject A2), 46 dB SPL (subject A3), 70 dB SPL(subject A4).
Similar to the procedure used during tACS stimulation, acoustic stimulationwas presented at repetition rates of 0.75 and 1 Hz, in blocks of 5 min during NREMsleep. For each subject, we collected a block at each stimulation rate during NREMsleep, which was visually confirmed offline. The order of the presentation blockswas randomized across subjects. An awake control condition was performed foreach patient, to verify the presence of acoustic ERPs. Additional time-locked TTLtriggers were generated for each stimulus presentation and recorded by the EEGamplifier’s DC input to aid in offline analysis.
iEEG data preprocessing. All electrodes were inspected for signal quality byplotting spectrogram, raw voltage, and the power spectrum. We recorded from atotal of 1700 electrodes for this analysis. Electrodes were discarded based on high60 Hz noise (likely due to poor contact impedance), amplifier saturation (clipping),or poor removal of the tACS artifact (due to non-stationarity of stimulationartefact, typically resulting from patient movement). Example of artefact-freerecording electrodes are shown in Supplementary Figs. 2 and 3. The electrodesremaining for each subject during tACS were: 122/126 (S1), 112/126 (S2), 117/126(S3), 78/84 (S4), 111/124 (S5), 155/254 (S6), 80/128 (S7), 116/122 (S8), 89/100 (S9,1 Hz tACS), 93/100 (S9, 0.75 Hz), 83/124 (S10), 49/98 (S11), 79/102 (S12), 88/188(S13, 1 Hz tACS), 93/188 (S13, 0.75 Hz tACS). During endogenous sleep theelectrodes remaining for each subject during night 1 were: 123/126 (S7), 103/122(S8), 96/100 (S9), 91/124 (S10), 70/98 (S11), 94/102 (S12), 170/188 (S13). Duringnight 2: 121/126 (S7), 113/122 (S8), 89/100 (S9), 96/124 (S10), 82/98 (S11), 93/102(S12), 164/188 (S13).
Measurement and modeling of electric fields. During tACS, the current alter-nates in directionality between two stimulating electrodes. This alternation resultsin a sinusoidal signal that can be used to determine the magnitude of the stimu-lation voltages. Magnitude was estimated by fitting a sinusoid to the signal at eachelectrode location and estimating the magnitude of the fitted signal. The output ofthis processing was plotted and manually inspected electrode by electrode.
The measured voltage in each location is then used to derive the projectedelectric field, by subtracting potential values between adjacent electrode pairs anddividing by their distance, resulting in V/m. The adjacent electrode was defined asthe closest electrode within a 10 mm vicinity for cortical electrodes on the samegrid array and linear strip, and 5 mm vicinity for depth electrodes on the samestrip, to reflect the different inter-electrode distance. It is important to realize thatthis only captures a fraction of the field magnitude at any given location as the fieldorientation may not be parallel to the direction of two neighboring electrodes. Thedistant stimulating electrodes were expected to generate the strongest fieldintensities on the cortical surface directly under the scalp electrodes40. However,recording electrodes lay predominantly orthogonal to field direction (parallel to thecortical surface). Thus, the measured field projections will not capture maximalintensities, except in the rare circumstance that a depth array is preciselyunderneath one of the stimulating electrode and oriented toward a second, distantstimulating electrode.
The computational models were built following our previous work74. Briefly,the MRI for each patient was automatically segmented by the New Segmenttoolbox75 in Statistical Parametric Mapping 8 (Wellcome Trust Centre forNeuroimaging, London, UK) in Matlab (R2013a, MathWorks, Natick, MA).Segmentation errors were corrected first by a customized Matlab script74 and thenby hand in ScanIP software (v4.2, Simpleware Ltd., Exeter, UK). The field of viewof the clinical MRI scans was extended down to the neck by co-registering astandard head74, and pasting the lower portion of the standard head to the model.The 2 × 2 cm stimulation electrodes were positioned on the model using CADsoftware. For each patient, a finite element model was generated from thesegmentation data and then the electric potential distribution was computedassuming 1 mA current through the stimulation electrodes. Tissue conductivitieswere adjusted to minimize the mean-square difference between predicted andmeasured potentials. With these calibrated models, we then computed electric
fields throughout the brain. Electric potentials of model and measurementscorresponded closely, with correlation values of r= 0.95 ± 0.04 (mean± Std acrosspatients, N= 1545 electrodes across 10 subjects). Electric field is the spatialderivative of these potentials. They are estimated as the difference in electricpotential between neighboring electrodes, divided by the distance. This is theelectric field projected on the orientation of the electrode pair40.
Phase-amplitude coupling. PAC measures the degree to which the amplitude of ahigh-frequency oscillations, AHF(t), is aligned with the phase of a lower frequency,ϕHF(t). We were interested in the interaction between the amplitude of spindleactivity band at 14 Hz with the phase of endogenous slow oscillations at 1 Hz (or0.75 Hz) during sleep as well as entrainment to the applied stimulation (tACS andacoustic). This section refers to 14 Hz activity, but the identical analysis was donefor power amplitudes in the theta, alpha, and gamma bands (see next paragraph).To measure entrainment of spindle oscillations during endogenous sleep, wecompared spindle power against the phase of the endogenous slow oscillationactivity (ϕLFE(t), low-frequency endogenous). To measure entrainment to tACS, weused the phase of the electrical stimulation artifact (ϕLFS(t),low-frequency stimulation; Supplementary Fig. 1). To obtain the phase duringacoustic stimulation we used the delay from the onset of each noise burst. Toobtain the phase during tACS and remove the stimulation artifact, we first modeledthe 1 Hz artifact as a linear superposition of sines and cosines at multiples of a basefrequency (harmonics up to 40 Hz) by fitting the amplitude of each sine/cosine andthe base frequency. An example of this fitting procedure is shown in Supple-mentary Fig. 4 with the top row indicating the raw signals and the bottom rowshowing the signals after the fitted harmonic artifact has been subtracted. Theresulting harmonic fit captures the 1 Hz stimulation artifact including any har-monic distortion that may have resulted from amplifier nonlinearities. We calcu-lated the stimulation phase from the harmonic fit (Supplementary Fig. 1D). Toobtain the phase during endogenous sleep, first we applied a complex-valuedMorlet wavelet filter centered at 1 Hz (or 0.75 Hz) with a bandwidth of 1 Hz (or0.75 Hz; in humans, the center frequency of slow-wave activity is often assumed tobe <1 Hz)48. The instantaneous phase can be directly extracted from the complex-valued filtered signal. Peak and trough of the slow oscillation are indicated by 0°and 180°, respectively, which represent the cortical upstate and downstate as dis-cussed in the main text.
To obtain the instantaneous amplitude of the high-frequency rhythm duringtACS we subtract the harmonic fit (Supplementary Fig. 4) and filtered the residualiEEG signal with a complex-valued Morlet bandpass for spindle activity (fc= 14Hz, bandwidth= 7 Hz), for alpha activity (fc= 10 Hz, 5 Hz bandwidth) and forgamma activity (fc= 90 Hz, bandwidth= 40 Hz, Supplementary Fig. 1C). Theinstantaneous HF power was obtained by taking the absolute value of the filteredsignal (Supplementary Fig. 1E). Patient movement and other artifacts resulted inoutliers in the HF amplitude estimates. We removed these by removing cycles withexcessive power as follows. For each electrode and each LF cycle we compute themean power of the HF band (square amplitude averaged over one LF cycle). Cyclesare removed as outliers if their mean power exceeds two times the interquartilerange across all cycles in an electrode. To obtain the amplitude of the high-frequency rhythm during endogenous sleep and auditory stimulation we used thesame procedures starting with the raw iEEG signal (no harmonic fit is needed).Outlier rejection was done as before based on the mean power in the high-frequency band. In addition, for endogenous slow wave we excluded cycles forwhich the slow oscillation amplitude was below 50 µV. For the analysis of theacoustic stimulation we used the same procedures as with the endogenous sleepexcept that the phase was defined based on the time since the onset of the noiseburst, and cycle duration determined from the average inter-stimulus interval (TTLpulse) for each subject.
PAC is measured here using the modulation index r, which is defined as theabsolute value of the time average, r= | < z(t)> |, of the complex-valued quantity,zðtÞ ¼ AHFðtÞeiϕLF ðtÞ (Supplementary Fig. 1F). Time average < z(t) > is computedover cycles and time within a cycle. If z(t) does not have a radially symmetricdistribution this will cause the time average r (modulation index) to be differentfrom zero. This can be a result of (1) the amplitude AHF(t) is consistently higher ata certain phase, or (2) ϕLF(t) is not uniformly distributed in time. The phase isuniformly distributed in the case of tACS and acoustic stimulation. However,during endogenous sleep, phase is extracted from the slow oscillations, which is notsinusoidal resulting in non-uniform phase distributions. Consequently, we applieda histogram equalization to the phase distribution, ensuring that non-zeromodulation index is only a result of modulated amplitude coupling, which weconfirmed by testing for significance using surrogate data with constant HFamplitude.
Randomized surrogate data to estimate statistical significance of PAC. Sig-nificance was determined by randomizing the phase of each LF cycle and thuscreating the distribution of the modulation index r, under the null hypothesis of noPAC. Phase randomization makes no assumptions on the distribution of the data,except that the phase is uniform, which has been addressed in the paragraph above.For each slow oscillation cycle the low-frequency phase, ϕLF(t), was incremented bya random value uniformly distributed between 0° and 180°. The phase was shiftedby the same random phase for all electrodes but independently for different cycles.
NATURE COMMUNICATIONS | DOI: 10.1038/s41467-017-01045-x ARTICLE
NATURE COMMUNICATIONS |8: 1199 |DOI: 10.1038/s41467-017-01045-x |www.nature.com/naturecommunications 11

The randomizing procedure was repeated 10,000 times and the p-value wasmeasured as the rate of a random phase having a modulation index higher than theoriginal data. The minimum numerical p-value possible, given the number ofrandomizations, was 10−4 (1/number of shuffles). All the p-values were correctedfor multiple comparisons across electrodes using FDR correction76 with q< 0.05.No correction was performed across segments (as we use segments to determinehow reliable a potential entrainment is over longer periods of time) or frequencybands (as these were planned comparison). Uncorrected p-values for electrodesthat had p< 0.05 in at least one stimulation block are shown in SupplementaryFigs. 7–9 for tACS, endogenous slow-wave (no stimulation), and acoustic stimu-lation, respectively.
Note that we examine the acute effects of modulation within a single cycle, thuspermitting many single “trials” (N= 300 cycles for 1 Hz and N = 225 for 0.75 Hzwithin each 5-min block, repeated 2–6 times for each stimulation intensity; seenumber of blocks tested for each subject in Supplementary Table 1). This largenumber of trials permits, in principle, detection of small changes in power within acycle, on the order of a few percent (e.g., assuming independent noise: sqrt(1/300)= 5.6%). See Supplementary Note 3 for an extended discussion on statistical power.
To aid comparison with endogenous sleep and tACS stimulation condition, weanalyzed entrainment for different sleep duration segments. The longer therecordings (approximately 20 min), the more accurate the mean vector strengthtechnique is at measuring entrainment (approximately 50% of electrodesentrained). For shorter durations of endogenous sleep (5 min of iEEG) comparableto the duration of tACS blocks, there is still modulation of spindle activity but inonly 10% of the electrodes.
Spindle event detection. Spindle detection follows existing methods50. Briefly, thesignal is bandpass filtered in the spindle band as above, and instantaneous power isobtained as the square amplitude of the filtered signal. For each channel a detectionthreshold is defined as six times the median of the instantaneous power. Forsegments that cross this threshold a lower threshold (1 standard deviation of thepower) is applied to detect onset and offset of the spindle event. Only spindleswhose duration was between 0.2 and 2 s were considered for further analysis50, 77.To avoid false positive detections due to patient movements or high-frequencyartifacts spindle events that coincide with increases in broadband power werediscarded. Events exhibiting broadband power increases (p> 0.10, comparing themaximum broadband power in that event vs. the distribution of broadband powerduring the whole recording) were excluded.
Slow-wave detection during auditory stimulation. Additional analyses wereperformed on the acoustic stimulation data to assess the physiological origin of thePAC entrainment. First, a slow-wave detection algorithm was applied during sti-mulation segments to assess whether underlying slow-wave activity was alteredduring stimulation. In contrast to tACS, this is possible for auditory stimulation asthere are no electric stimulation artefacts in the iEEG signal. Following previousliterature61, 78, slow-wave detection consisted of bandpass filtering the waveform(fc= 0.75 Hz, bandwidth = 0.75 Hz) and using a zero-crossing algorithm to identifyevents where two subsequent negative zero-crossing (e.g., from positive to negative)were within the range of 0.5–2 s (2–0.5 Hz, bandwidth = 1.5 Hz). Subsequently,once a slow-wave event was identified, the down-state was identified as theminimum voltage within this event. Second, time-frequency response (TFR)functions were calculated to assess whether stimulation trials consisted of phy-siological sleep spindles. TFRs were computed using a 6-cycle Morlet waveletsbetween 5 and 25 Hz and averaging the resulting spectrograms (locked to stimu-lation onset) across all noise bursts (Fig. 6). Significance between conditions (sleepvs. baseline) was assessed via paired sample t-test (one-tailed, p< 0.05) comparedacross all stimulation trials (n= 300).
Analysis of changes in power before and after stimulation. Qualitative com-parison between the NREM during the two nights without stimulation and thestimulation period show no evident changes in the power spectrum (Supplemen-tary Fig. 6). To determine if there were significant changes in power at the differentfrequency bands before vs. after stimulation we used the Chronux toolbox79 (http://chronux.org/; version 2.12). Briefly, for each electrode, 30 s immediately after each5-min stimulation block were compared against 30 s preceding the first block.Differences in power in the slow oscillation (0.5–1 Hz) and spindle bands (10 and14 Hz) are shown in Supplementary Fig. 12. Statistical significance of powerchanges is computed with the Chronux toolbox for the fast spindle band and slowoscillation band and FDR corrected (q< 0.05).
Entrainment with electric stimulation assessed after stimulation block. Insubject S14 we collected enough stimulation blocks to evaluate slow-waveentrainment in the intervals immediately following tACS. For this, slow-waveentrainment was tested following previous reports37. Briefly, the 10-s stimulation-free interval immediately after stimulation was fit with a sinusoid (0.5–1.5 Hz) andphase coherence was calculated across all trials. Statistical significance was calcu-lated using a circular test statistic (Rayleigh test for non-uniformity). In addition, totest for after-effects, we utilized the same trapezoidal waveform, frequency, andintensity in five separate 5-min blocks during NREM sleep (5 min ON/5 min OFF).
We compared these sessions against two control periods of endogenous NREMsleep for spindle (10, 14 Hz) entrainment. The power in the stimulation-freeintervals was calculated for slow oscillations (0.5–1 Hz), slow spindle activity (8–12Hz), and fast spindle activity (12–15 Hz). This quantity was then compared to thepower during a different night, when the subject was in an equal sleep state. Slowoscillations and slow spindle activity were averaged across locations close to Fz.And fast spindle activity was determined across parietal locations.
Code availability. The code used to generate the main findings of the current studyare available from the corresponding author upon reasonable request.
Data availability. The data sets generated during and/or analyzed during thecurrent study are available from the corresponding author upon reasonable request.
Received: 3 June 2017 Accepted: 15 August 2017
References1. Liu A., Fregni F., Hummel F. & Pascual-Leone A. in Transcranial Brain
Stimulation Eds. Miniussi, C., Paulus, W. & Rossini, P. M. (CRC Press, 2012).2. Bindman, L. J., Lippold, O. C. & Redfearn, J. W. Long-lasting changes in the
level of the electrical activity of the cerebral cortex produced bypolarizingcurrents. Nature 196, 584–585 (1962).
3. Purpura, D. P. & Mcmurtry, J. G. Intracellular activities and evoked potentialchanges during polarization of motor cortex. J. Neurophysiol. 28, 166–185(1965).
4. Jefferys, J. G. Nonsynaptic modulation of neuronal activity in the brain: electriccurrents and extracellular ions. Physiol. Rev. 75, 689–723(1995).
5. Eggert, T. et al. No effects of slow oscillatory transcranial direct currentstimulation (tDCS) on sleep-dependent memory consolidation in healthyelderly subjects. Brain Stimulation 6, 938–945 (2013).
6. Brignani, D., Ruzzoli, M., Mauri, P. & Miniussi, C. Is transcranial alternatingcurrent stimulation effective in modulating brain oscillations? PLoS ONE 8,e56589 (2013).
7. Sahlem, G. L. et al. Oscillating square wave transcranial direct currentstimulation (tDCS) delivered during slow wave sleep does not improvedeclarative memory more than sham: a randomized sham controlled crossoverstudy. Brain Stimulation 8, 528–534 (2015).
8. Horvath, J. C., Forte, J. D. & Carter, O. Quantitative review finds no evidence ofcognitive effects in healthy populations from single-session transcranial directcurrent stimulation (tDCS). Brain Stimulation 8, 535–550 (2015).
9. Horvath, J. C., Forte, J. D. & Carter, O. Evidence that transcranial direct currentstimulation (tDCS) generates little-to-no reliable neurophysiologic effectbeyond MEP amplitude modulation in healthy human subjects: a systematicreview. Neuropsychologia 66, 213–236 (2015).
10. Merton, P. A. & Morton, H. B. Stimulation of the cerebral cortex in the intacthuman subject. Nature 285, 227–227 (1980).
11. Antal, A. & Paulus, W. Transcranial alternating current stimulation (tACS).Front. Hum. Neurosci. 7, 317 (2013).
12. Buzsáki, G. & Draguhn, A. Neuronal oscillations in cortical networks. Science304, 1926–1929 (2004).
13. Maris, E., van Vugt, M. & Kahana, M. Spatially distributed patterns ofoscillatory coupling between high-frequency amplitudes and low-frequencyphases in human iEEG. Neuroimage 54, 836–850 (2011).
14. Steriade, M. & Timofeev, I. Neuronal plasticity in thalamocortical networksduring sleep and waking oscillations. Neuron 37, 563–576 (2003).
15. Steriade, M., Contreras, D., Curro Dossi, R. & Nunez, A. The slow (<1 Hz)oscillation in reticular thalamic and thalamocortical neurons: scenario of sleeprhythm generation in interacting thalamic and neocortical networks. J.Neurosci. 13, 3284 (1993).
16. Marshall, L., Helgadóttir, H., Mölle, M. & Born, J. Boosting slow oscillationsduring sleep potentiates memory. Nature 444, 610–613 (2006).
17. Antonenko, D., Diekelmann, S., Olsen, C., Born, J. & Molle, M. Napping torenew learning capacity: enhanced encoding after stimulation of sleep slowoscillations. Eur. J. Neurosci. 37, 1142–1151 (2013).
18. Westerberg, C. E. et al. Memory improvement via slow-oscillatory stimulationduring sleep in older adults. Neurobiol. Aging 36, 2577–2586 (2015).
19. Prehn-Kristensen, A. et al. Transcranial oscillatory direct current stimulationduring sleep improves declarative memory consolidation in children withattention-deficit/hyperactivity disorder to a level comparable to healthycontrols. Brain Stimulation 7, 793–799 (2014).
20. Binder, S. et al. Transcranial slow oscillation stimulation during sleep enhancesmemory consolidation in rats. Brain Stimulation 7, 508–515 (2014).
ARTICLE NATURE COMMUNICATIONS | DOI: 10.1038/s41467-017-01045-x
12 NATURE COMMUNICATIONS |8: 1199 |DOI: 10.1038/s41467-017-01045-x |www.nature.com/naturecommunications
21. Ladenbauer, J. et al. Promoting sleep oscillations and their functional couplingby transcranial stimulation enhances memory consolidation in mild cognitiveimpairment. J. Neurosci. 37, 7111–7124 (2017).
22. Kirov, R., Weiss, C., Siebner, H. R., Born, J. & Marshall, L. Slow oscillationelectrical brain stimulation during waking promotes EEG theta activityand memory encoding. Proc. Natl. Acad. Sci. USA 106, 15460–15465(2009).
23. Reato, D., Rahman, A., Bikson, M. & Parra, L. C. Low-intensity electricalstimulation affects network dynamics by modulating population rate and spiketiming. J. Neurosci. 30, 15067–15079 (2010).
24. Strüber, D., Rach, S., Trautmann-Lengsfeld, S. A., Engel, A. K. & Herrmann, C.S. Antiphasic 40 Hz oscillatory current stimulation affects bistable motionperception. Brain Topogr. 27, 158–171 (2014).
25. Voss, U. et al. Induction of self awareness in dreams through frontal lowcurrent stimulation of gamma activity. Nat. Neurosci. 17, 810–812(2014).
26. Pogosyan, A., Gaynor, L. D., Eusebio, A. & Brown, P. Boosting cortical activityat beta-band frequencies slows movement in humans. Curr. Biol. 19, 1637–1641(2009).
27. Zaehle, T., Rach, S. & Herrmann, C. S. Transcranial alternating currentstimulation enhances individual alpha activity in human EEG. PLoS ONE 5,e13766 (2010).
28. Merlet, I. et al. From oscillatory transcranial current stimulation to scalp EEGchanges: a biophysical and physiological modeling study. PLoS ONE 8, e57330(2013).
29. Marshall, L., Kirov, R., Brade, J., Molle, M. & Born, J. Transcranial electricalcurrents to probe EEG brain rhythms and memory consolidation during sleepin humans. PLoS ONE 6, e16905 (2011).
30. Fröhlich, F. & McCormick, D. A. Endogenous electric fields may guideneocortical network activity. Neuron 67, 129–143 (2010).
31. Ozen, S. et al. Transcranial electric stimulation entrains cortical neuronalpopulations in rats. J. Neurosci. 30, 11476–11485 (2010).
32. Garside, P., Arizpe, J., Lau, C. I., Goh, C. & Walsh, V. Cross-hemisphericalternating current stimulation during a nap disrupts slow waveactivity and associated memory consolidation. Brain Stimulation 8, 520–527(2015).
33. Barham, M. P., Enticott, P. G., Conduit, R. & Lum, J. A. Transcranial electricalstimulation during sleep enhances declarative (but not procedural) memoryconsolidation: evidence from a meta-analysis. Neurosci. Biobehav. Rev. 63,65–77 (2016).
34. Rasch, B. & Born, J. About sleep’s role in memory. Physiol. Rev. 93, 681–766(2013).
35. Cash, S. S. et al. The human K-complex represents an isolated cortical down-state. Science 324, 1084 (2009).
36. Dudai, Y., Karni, A. & Born, J. The consolidation and transformation ofmemory. Neuron 88, 20–32 (2015).
37. Reato, D. et al. Transcranial electrical stimulation accelerates human sleephomeostasis. PLoS Comput. Biol. 9, e1002898 (2013).
38. Lustenberger, C. et al. Feedback-controlled transcranial alternating currentstimulation reveals a functional role of sleep spindles in motor memoryconsolidation. Curr. Biol. 26, 2127–2136 (2016).
39. Le Van Quyen, M. et al. Large-scale microelectrode recordings of high-frequency gamma oscillations in human cortex during sleep. J. Neurosci. 30,7770–7782 (2010).
40. Huang Y. et al. Measurements and models of electric fields in the in vivohuman brain during transcranial electric stimulation. Elife 6, e18834 (2017).
41. Ngo, H.-V. V., Martinetz, T., Born, J. & Mölle, M. Auditory closed-loopstimulation of the sleep slow oscillation enhances memory. Neuron 78, 545–553(2013).
42. Dmochowski, J. P., Datta, A., Bikson, M., Su, Y. & Parra, L. C. Optimized multi-electrode stimulation increases focality and intensity at target. J. Neural. Eng. 8,046011 (2011).
43. Datta, A., Bikson, M. & Fregni, F. Transcranial direct current stimulation inpatients with skull defects and skull plates: high-resolution computational FEMstudy of factors altering cortical current flow. Neuroimage 52, 1268–1278(2010).
44. Bikson, M. et al. Effects of uniform extracellular DC electric fields onexcitability in rat hippocampal slices in vitro. J. Physiol. 557, 175–190(2004).
45. Ranck, J. B. Jr. Which elements are excited in electrical stimulation ofmammalian central nervous system: a review. Brain Res. 98, 417–440(1975).
46. Berry, R. B. et al. The AASM Manual for the Scoring of Sleep and AssociatedEvents. Rules, Terminology and Technical Specifications (American Academy ofSleep Medicine, Darien, IL, 2012).
47. Finelli, L. A., Borbely, A. A. & Achermann, P. Functional topography of thehuman nonREM sleep electroencephalogram. Eur. J. Neurosci. 13, 2282–2290(2001).
48. Achermann, P. & Borbely, A. A. Low-frequency (<1 Hz) oscillations in thehuman sleep electroencephalogram. Neuroscience 81, 213–222(1997).
49. Nir, Y. et al. Regional slow waves and spindles in human sleep. Neuron 70,153–169 (2011).
50. Andrillon, T. et al. Sleep spindles in humans: insights from intracranial EEGand unit recordings. J. Neurosci. 31, 17821–17834 (2011).
51. Valencia, M., Artieda, J., Bolam, J. P. & Mena-Segovia, J. Dynamicinteraction of spindles and gamma activity during cortical slow oscillationsand its modulation by subcortical afferents. PLoS ONE 8, e67540(2013).
52. Ngo, H. V., Claussen, J. C., Born, J. & Molle, M. Induction of slow oscillationsby rhythmic acoustic stimulation. J. Sleep Res. 22, 22–31 (2013).
53. Reato, D., Rahman, A., Bikson, M. & Parra, L. C. Effects of weaktranscranial alternating current stimulation on brain activity—a reviewof known mechanisms from animal studies. Front. Hum. Neurosci. 7, 687(2013).
54. Radman, T., Su, Y., An, J. H., Parra, L. C. & Bikson, M. Spike timing amplifiesthe effect of electric fields on neurons: implications for endogenous field effects.J. Neurosci. 27, 3030–3036 (2007).
55. Opitz, A. et al. Spatiotemporal structure of intracranial electric fields inducedby transcranial electric stimulation in humans and nonhuman primates. Sci.Rep. 6, 31236 (2016).
56. Buzsaki, G. Theta oscillations in the hippocampus. Neuron 33, 325–340(2002).
57. Francis, J. T., Gluckman, B. J. & Schiff, S. J. Sensitivity of neurons to weakelectric fields. J. Neurosci. 23, 7255–7261 (2003).
58. Fertonani, A., Ferrari, C. & Miniussi, C. What do you feel if I apply transcranialelectric stimulation? Safety, sensations and secondary induced effects. Clin.Neurophysiol. 126, 2181–2188 (2015).
59. Shiozawa, P. et al. Safety of repeated transcranial direct current stimulation inimpaired skin: a case report. J. ECT 29, 147–148 (2013).
60. Marshall, L., Molle, M., Hallschmid, M. & Born, J. Transcranial direct currentstimulation during sleep improves declarative memory. J. Neurosci. 24,9985–9992 (2004).
61. Staresina, B. P. et al. Hierarchical nesting of slow oscillations, spindles andripples in the human hippocampus during sleep. Nat. Neurosci. 18, 1679–1686(2015).
62. Tyler, W. J. et al. Transdermal neuromodulation of noradrenergic activitysuppresses psychophysiological and biochemical stress responses in humans.Sci. Rep. 5, 13865 (2015).
63. Schutter, D. J. L. G. & Hortensius, R. Retinal origin of phosphenes totranscranial alternating current stimulation. Clin. Neurophysiol. 121,1080–1084 (2010).
64. Ruohonen, J. & Karhu, J. tDCS possibly stimulates glial cells. Clin.Neurophysiol. 123, 2006–2009 (2012).
65. Monai, H. et al. Calcium imaging reveals glial involvement in transcranialdirect current stimulation-induced plasticity in mouse brain. Nat. Commun. 7,11100 (2016).
66. Kronberg, G., Bridi, M., Abel, T., Bikson, M. & Parra, L. C. Direct currentstimulation modulates LTP and LTD: activity dependence and dendritic effects.Brain Stimulation 10, 51–58 (2017).
67. Horvath, J. C. Are current blinding methods for transcranial direct currentstimulation (tDCS) effective in healthy populations? Clin. Neurophysiol. 126,2045–2046 (2015).
68. Berényi, A., Belluscio, M., Mao, D. & Buzsáki, G. Closed-loop control ofepilepsy by transcranial electrical stimulation. Science 337, 735 (2012).
69. Krook-Magnuson, E., Gelinas, J. N., Soltesz, I. & Buzsáki, G. Neuroelectronicsand biooptics: closed-loop technologies in neurological disorders. JAMANeurol. 72, 823–829 (2015).
70. Krook-Magnuson, E. & Soltesz, I. Beyond the hammer and the scalpel:selective circuit control for the epilepsies. Nat. Neurosci. 18, 331–338(2015).
71. Morrell, M. J. Responsive cortical stimulation for the treatment of medicallyintractable partial epilepsy. Neurology 77, 1295–1304 (2011).
72. Yang, A. I. et al. Localization of dense intracranial electrode arrays usingmagnetic resonance imaging. Neuroimage 63, 157–165 (2012).
73. Engel, A. K., Moll, C. K. E., Fried, I. & Ojemann, G. A. Invasive recordings fromthe human brain: clinical insights and beyond. Nat. Rev. Neurosci. 6, 35–47(2005).
74. Huang, Y. et al. Automated MRI segmentation for individualizedmodeling of current flow in the human head. J. Neural. Eng. 10, 066004(2013).
75. Ashburner, J. & Friston, K. J. Unified segmentation. Neuroimage 26, 839–851(2005).
76. Benjamini Y. & Hochberg Y. Controlling the false discovery rate: a practicaland powerful approach to multiple testing. J. R. Stat. Soc. B Stat. Methodol. 57,289–300 (1995).
NATURE COMMUNICATIONS | DOI: 10.1038/s41467-017-01045-x ARTICLE
NATURE COMMUNICATIONS |8: 1199 |DOI: 10.1038/s41467-017-01045-x |www.nature.com/naturecommunications 13

77. Warby, S. C. et al. Sleep-spindle detection: crowdsourcing and evaluatingperformance of experts, non-experts and automated methods. Nat. Methods 11,385–392 (2014).
78. Molle, M., Marshall, L., Gais, S. & Born, J. Grouping of spindle activity duringslow oscillations in human non-rapid eye movement sleep. J. Neurosci. 22,10941–10947 (2002).
79. Bokil, H., Purpura, K., Schoffelen, J. M., Thomson, D. & Mitra, P. Comparingspectra and coherences for groups of unequal size. J. Neurosci. Methods 159,337–345 (2007).
80. Klinzing, J. G. et al. Spindle activity phase-locked to sleep slow oscillations.Neuroimage 134, 607–616 (2016).
AcknowledgementsThis work was supported by R01 MH107396-01, R44 NS092144, R01 MH-092926,NS095123, R41 NS076123, NYU Program Project Grant Development Initiative(PPG-DI), NYU Clinical and Translational Science Institute (CTSI), NYU Finding aCure for Epilepsy (FACES), and the Zimin Foundation. The authors would also like tothank Xiuyuan (Hugh) Wang for his work on the electrode reconstruction, as well asPreet Minhas for her early work in data collection and patient coordination.
Author contributionsConception and design: G.B., O.D., A.A.L., D.F., L.C.P.; institutional review boardapproval: A.A.L., T.T., L.M.; acquisition of data: A.A.L., B.L., W.D., D.F., S.H.; analysisand interpretation of data: B.L., Y.H., L.C.P., A.A.L., D.F., G.B., O.D., S.H.; figure pre-paration: B.L., Y.H., L.C.P., S.H.; drafting the manuscript: A.A.L., L.P., G.B., O.D.; criticalrevisions: all authors.
Additional informationSupplementary Information accompanies this paper at doi:10.1038/s41467-017-01045-x.
Competing interests: L.P. has shares in Soterix Medical Devices. The remaining authorsdeclare no competing financial interests.
Reprints and permission information is available online at http://npg.nature.com/reprintsandpermissions/
Publisher's note: Springer Nature remains neutral with regard to jurisdictional claims inpublished maps and institutional affiliations.
Open Access This article is licensed under a Creative CommonsAttribution 4.0 International License, which permits use, sharing,
adaptation, distribution and reproduction in any medium or format, as long as you giveappropriate credit to the original author(s) and the source, provide a link to the CreativeCommons license, and indicate if changes were made. The images or other third partymaterial in this article are included in the article’s Creative Commons license, unlessindicated otherwise in a credit line to the material. If material is not included in thearticle’s Creative Commons license and your intended use is not permitted by statutoryregulation or exceeds the permitted use, you will need to obtain permission directly fromthe copyright holder. To view a copy of this license, visit http://creativecommons.org/licenses/by/4.0/.
© The Author(s) 2017
ARTICLE NATURE COMMUNICATIONS | DOI: 10.1038/s41467-017-01045-x
14 NATURE COMMUNICATIONS |8: 1199 |DOI: 10.1038/s41467-017-01045-x |www.nature.com/naturecommunications