
Transcranial direct current stimulation: A computer … direct current stimulation: A computer-based...
12
Transcranial direct current stimulation: A computer-based human model study Tim Wagner, a,b,c, ⁎ Felipe Fregni, a Shirley Fecteau, a Alan Grodzinsky, b,d Markus Zahn, b and Alvaro Pascual-Leone a, ⁎ a Center for Non-invasive Brain Stimulation, Beth Israel Deaconess Medical Center, Harvard Medical School, Boston, MA 02115, USA b Department of Electrical Engineering and Computer Science, Massachusetts Institute of Technology, Cambridge, MA 02139, USA c Division of Health Sciences and Technology, Harvard Medical School/Massachusetts Institute of Technology, Boston, MA 02114, USA d Center for Biomedical Engineering, Massachusetts Institute of Technology, Cambridge, MA 02115, USA Received 1 June 2006; revised 9 November 2006; accepted 3 January 2007 Available online 4 February 2007 Objectives: Interest in transcranial direct current stimulation (tDCS) in clinical practice has been growing, however, the knowledge about its efficacy and mechanisms of action remains limited. This paper presents a realistic magnetic resonance imaging (MRI)-derived finite element model of currents applied to the human brain during tDCS. Experimental design: Current density distributions were analyzed in a healthy human head model with varied electrode montages. For each configuration, we calculated the cortical current density distributions. Analogous studies were completed for three pathological models of cortical infarcts. Principal observations: The current density magnitude maxima injected in the cortex by 1 mA tDCS ranged from 0.77 to 2.00 mA/cm 2 . The pathological models revealed that cortical strokes, relative to the non- pathological solutions, can elevate current density maxima and alter their location. Conclusions: These results may guide optimized tDCS for application in normal subjects and patients with focal brain lesions. © 2007 Elsevier Inc. All rights reserved. Keywords: Finite element model; Stroke; Neuro-model; Brain polarization; MRI; Brain stimulation Introduction Transcranial direct current stimulation (tDCS) is a noninvasive brain stimulation technique that utilizes low amplitude direct currents applied via scalp electrodes to inject currents in the brain and modulate the level of cortical excitability (Nitsche and Paulus, 2000). Although forms of DC stimulation have been used since the inception of modern electrophysiology (Aldini, 1804), there has been a recent upsurge in interest in tDCS as a tool for neuroscience research (Nitsche and Paulus, 2001; Antal et al., 2003) and for the treatment and assessment of various neurological and psychiatric disorders (Fregni et al., 2005a, 2006a,b; Nitsche, 2002). tDCS saw a similar increase in interest in the 1960s (Bindman et al., 1964; Purpura and McMurtry, 1965), but was largely abandoned due to inconsistent results in human trials (Bindman et al., 1964; Sheffield and Mowbray, 1968; Hall et al., 1970; Lolas, 1976). As in the 1960s, there are still many fundamental unresolved questions concerning the stimulating current densities injected by tDCS, including questions as to whether currents of sufficient magnitude even reach the cortex to influence neural activity (Barker, 1994; Nathan et al., 1993); how differences in the electrode configurations influence the stimulating currents (Nitsche and Paulus, 2000, 2001; Priori, 2003); and how various differences in brain anatomy induced by neurological disorders, such as stroke, influence the stimulating currents (Fregni et al., 2005a). Thus, although behavioral (Nitsche et al., 2002) and imaging studies (Nitsche et al., 2004b) suggest the ‘brain effects’ of tDCS, little has been done to quantify the current densities injected during stimulation, to compare them to published current density magnitudes necessary for neural stimulation, or to analyze how different stimulation parameters can influence the stimulating currents. Therefore, we analyzed several magnetic resonance imaging (MRI)-derived finite element models (FEM) of electrical current applied to the human cortex during tDCS to: (i) determine cortical current density distributions from various electrode montages used in clinical investigations; (ii) determine the role that tissue heterogeneities and anatomical variations play on the final current www.elsevier.com/locate/ynimg NeuroImage 35 (2007) 1113 – 1124 ⁎ Corresponding authors. Harvard Center for Non-invasive Brain Stimulation-330 Brookline Ave #KS452-Boston, MA 02115, USA. Fax: +1 617 975 5322. E-mail addresses: [email protected] (T. Wagner), [email protected] (A. Pascual-Leone). Available online on ScienceDirect (www.sciencedirect.com). 1053-8119/$ - see front matter © 2007 Elsevier Inc. All rights reserved. doi:10.1016/j.neuroimage.2007.01.027
Transcript of Transcranial direct current stimulation: A computer … direct current stimulation: A computer-based...
www.elsevier.com/locate/ynimgNeuroImage 35 (2007) 1113–1124
Transcranial direct current stimulation: A computer-basedhuman model study
Tim Wagner, a,b,c,⁎ Felipe Fregni, a Shirley Fecteau, a Alan Grodzinsky, b,d
Markus Zahn, b and Alvaro Pascual-Leonea,⁎
aCenter for Non-invasive Brain Stimulation, Beth Israel Deaconess Medical Center, Harvard Medical School, Boston, MA 02115, USAbDepartment of Electrical Engineering and Computer Science, Massachusetts Institute of Technology, Cambridge, MA 02139, USAcDivision of Health Sciences and Technology, Harvard Medical School/Massachusetts Institute of Technology, Boston, MA 02114, USAdCenter for Biomedical Engineering, Massachusetts Institute of Technology, Cambridge, MA 02115, USA
Received 1 June 2006; revised 9 November 2006; accepted 3 January 2007Available online 4 February 2007
Objectives: Interest in transcranial direct current stimulation (tDCS) inclinical practice has been growing, however, the knowledge about itsefficacy and mechanisms of action remains limited. This paper presentsa realistic magnetic resonance imaging (MRI)-derived finite elementmodel of currents applied to the human brain during tDCS.Experimental design: Current density distributions were analyzed in ahealthy human head model with varied electrode montages. For eachconfiguration, we calculated the cortical current density distributions.Analogous studies were completed for three pathological models ofcortical infarcts.Principal observations: The current density magnitude maxima injectedin the cortex by 1 mA tDCS ranged from 0.77 to 2.00 mA/cm2. Thepathological models revealed that cortical strokes, relative to the non-pathological solutions, can elevate current density maxima and altertheir location.Conclusions: These results may guide optimized tDCS for applicationin normal subjects and patients with focal brain lesions.© 2007 Elsevier Inc. All rights reserved.
Keywords: Finite element model; Stroke; Neuro-model; Brain polarization;MRI; Brain stimulation
Introduction
Transcranial direct current stimulation (tDCS) is a noninvasivebrain stimulation technique that utilizes low amplitude direct
⁎ Corresponding authors. Harvard Center for Non-invasive BrainStimulation-330 Brookline Ave #KS452-Boston, MA 02115, USA. Fax:+1 617 975 5322.
E-mail addresses: [email protected] (T. Wagner),[email protected] (A. Pascual-Leone).
Available online on ScienceDirect (www.sciencedirect.com).
1053-8119/$ - see front matter © 2007 Elsevier Inc. All rights reserved.doi:10.1016/j.neuroimage.2007.01.027
currents applied via scalp electrodes to inject currents in the brainand modulate the level of cortical excitability (Nitsche and Paulus,2000). Although forms of DC stimulation have been used since theinception of modern electrophysiology (Aldini, 1804), there hasbeen a recent upsurge in interest in tDCS as a tool for neuroscienceresearch (Nitsche and Paulus, 2001; Antal et al., 2003) and for thetreatment and assessment of various neurological and psychiatricdisorders (Fregni et al., 2005a, 2006a,b; Nitsche, 2002). tDCS saw asimilar increase in interest in the 1960s (Bindman et al., 1964;Purpura and McMurtry, 1965), but was largely abandoned due toinconsistent results in human trials (Bindman et al., 1964; SheffieldandMowbray, 1968; Hall et al., 1970; Lolas, 1976). As in the 1960s,there are still many fundamental unresolved questions concerningthe stimulating current densities injected by tDCS, includingquestions as to whether currents of sufficient magnitude even reachthe cortex to influence neural activity (Barker, 1994; Nathan et al.,1993); how differences in the electrode configurations influence thestimulating currents (Nitsche and Paulus, 2000, 2001; Priori, 2003);and how various differences in brain anatomy induced byneurological disorders, such as stroke, influence the stimulatingcurrents (Fregni et al., 2005a). Thus, although behavioral (Nitsche etal., 2002) and imaging studies (Nitsche et al., 2004b) suggest the‘brain effects’ of tDCS, little has been done to quantify the currentdensities injected during stimulation, to compare them to publishedcurrent density magnitudes necessary for neural stimulation, or toanalyze how different stimulation parameters can influence thestimulating currents.
Therefore, we analyzed several magnetic resonance imaging(MRI)-derived finite element models (FEM) of electrical currentapplied to the human cortex during tDCS to: (i) determine corticalcurrent density distributions from various electrode montages usedin clinical investigations; (ii) determine the role that tissueheterogeneities and anatomical variations play on the final current
1114 T. Wagner et al. / NeuroImage 35 (2007) 1113–1124
density distributions; (iii) explore the effects of anatomical–pathological alterations that occur in stroke on the stimulatingcortical current densities.
Material and methods
MRI guided finite element head model
Multiple MRI-derived finite element head models usingdifferent electrodes montages were constructed. An initial sinu-soidal steady-state FEM was developed using the Ansoft 3D FieldSimulator software package with the conduction solver (Ansoft,2005b). The FEM method allows one to break down structures intosmaller geometric units, that comprise the FEM mesh, and assigndistinct electrical properties to the individual elements, based onthe corresponding tissue characteristics, on which discreteapproximations of the governing physical equations can moreeasily and fully be solved. The FEM geometrical mesh structurewas constructed from an MRI guided three-dimensional ComputerAided Design (CAD) rendering of the human head. The MRIimages were used to segment the modeled tissues in the FEMspace, guiding the mesh generation based on the MRI-derivedtissue boundaries, the process of which is detailed in Wagner et al.
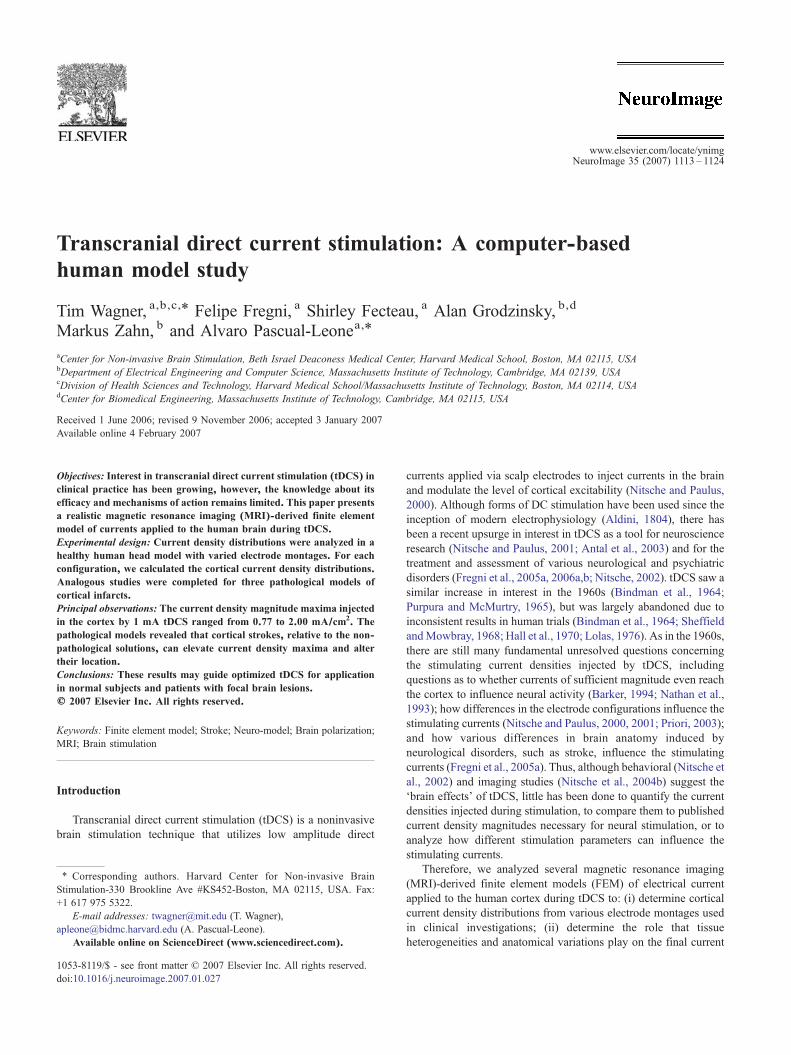
Fig. 1. Model system. (A) Here is an example of the healthy head model with the anelectrode montage (Montage 1A). In the right most part of the figure the coordinate sand the gray matter surface current density solution for this solution. (B) The gray mthe model are shown in the left part of the figure. The gray matter mesh outlines forof 18.5 cm3 with a maximum 2.5 cm inferior to superior length along the cortical faand a maximum depth of 2.8 cm measured from the cortical face. Stroke 2 had an a4 mm along the cortical face, a maximum anterior to posterior length of 4 mm alongface. Stroke 3 had a 350 cm3 volume and was designed by removing the cortical
(2004). We refer to this as the healthy head model (see Fig. 1A;note that the coordinate system used in this paper is defined in thefigure). This model was generated to include the skin, skull,cerebrospinal fluid (CSF), gray matter, and white matter. The tissueconductivities of the base healthy head model were assigned themean value from multiple references: skin: 0.465 S/m; bone:0.010 S/m; CSF: 1.654 S/m; gray matter: 0.276 S/m; white matter:0.126 S/m (Akhtari et al., 2002; Burger and Van Milaan, 1943;Crille et al., 1922; De Mercato and Garcia Sanchez, 1992;Freygang and Landau, 1955; Gabriel and Gabriel, 1996; Geddes,1987; Hasted, 1973; Lepeschkin, 1951; Oswald, 1937; Radvan-Ziemnowicz et al., 1964; Ranck, 1963).
Field solver
The Ansoft FEM solver was set to solve for the currentdensities in terms of the electric potential (ϕ), by solving theequation: ∇·(σi∇ϕ)=0, where σi is the conductivity of the tissue(Ansoft). The solution method followed an adaptive iterativeprocess with convergence limits determined by the energy error inthe system (for more details, see Ansoft, 2005a; Bogdan and Zhou,2004; Wagner et al., 2004). The criterion for model convergencewas defined as an energy error below 1.0%.
ode at the right primary motor cortex (M1)–cathode on the left supra-orbitalystem is defined in the image that shows the outline of FEMmesh of the skinatter FEMmesh outline for Stroke 1 and a slice from the MRI used to developStrokes 2 and 3 are shown on the right. Stroke 1 had an approximate volumece, a maximum anterior to posterior length of 3.5 cm along the cortical face,pproximate volume of 5.3 cm3 with a maximum inferior to superior length ofthe cortical face, and a maximum depth of 4 mm measured from the corticalmantle of the left hemisphere from the model.
1115T. Wagner et al. / NeuroImage 35 (2007) 1113–1124
Model specification
The following specific electrode montages and head modelswere implemented to explore the effects of electrodes, tissues, andpathologies on tDCS stimulating currents.
Electrode size/current densityThe effects of varying the area of the surface electrodes were
analyzed. Rectangular electrode pairs of 7×7 cm2, 7×5 cm2,5×5 cm2, and 1×1 cm2 were placed on the scalp overlaying theright M1 (anode) and the contralateral supra-orbital region(cathode). We chose these electrode sizes as several tDCS studieshave been conducted in humans using 5×7 cm2 electrodes (Fregniet al., 2005a, 2006a,b; Nitsche et al., 2004a; Nitsche and Paulus,2000, 2001) and 5×5 cm2 electrodes (Hummel et al., 2005; Iyer etal., 2005). We then chose extreme boundaries (7×7 and 1×1 cm2
electrodes) to further explore the effects of contact area. Theelectrodes were modeled as planar current boundaries on the scalpsurface, where 1 mA total current was applied at the anodelocation. The electrode placement schemes and average electrodecurrent density magnitudes are included in Table 1.
The current density distributions were analyzed for eachelectrode montage. The magnitude and location of the maximumcortical current density were evaluated for each electrodemontage and individually for each electrode (i.e., the maximumcortical current density proximal to the anode was not alwaysequivalent to the maximum near the cathode). Additionally, thesurface area on the cortex where the current density was greaterthan 90% of its maximum value, referred to as the maximumcortical current surface area, was calculated for each electrode.
Table 1Electrode montages
Montage Electrode Size Plac
1 Anode 7×7 RighCathode 7×7 Left
2 Anode 5×7 RighCathode 5×7 Left
3 Anode 5×5 RighCathode 5×5 Left
4 Anode 1×1 RighCathode 1×1 Left
7 Anode 5×7 RighCathode 5×7 Left
8 Anode 5×7 RighCathode 5×7 Left
9 Anode 5×7 V1Cathode 5×7 Left
10 Anode 5×7 RighCathode 5×7 Left
11 Anode 5×7 RighCathode 5×7 Left
12 Anode 5×7 V1Cathode 5×7 Verte
Strokes 1–3 Anode 5×7 RighCathode 5×7 Left
Stroke 1B Anode 5×7 RighCathode 5×7 Left
Electrode Montages: The Montage name is provided in the left column, anode and cin the third column, electrode placement in the fourth column, the total current in thedensity at each contact point in the sixth column (in mA/cm2). The average electroddivided by the total electrode area.
Finally, the variation in the current density across the differenttissues was evaluated. To quantify the shunting effect, we dividedthe average maximum skin current density by the maximumcortical current density, where the average maximum skin currentdensity was defined as the current density magnitude on the skinfor which at least 0.5 cm2 in area was covered and which wasnot confined to the electrode boundary edge effects (Kim et al.,1984; Lindemanns et al., 1975; Nathan et al., 1993). The exactcurrent density analysis was also completed for reversed polarityelectrode montages, where the anode was made the cathode andvice versa.
Electrode placementThe effects of varying the position of the surface electrodes on
the tDCS current densities were analyzed. The following electrodeplacements were analyzed: (1) anode over the right M1–cathodeover the left supra-orbital region; (2) anode over the right M1–cathode over the left M1; (3) anode over the primary visual cortex(V1)–cathode over the vertex; (4) anode over V1–cathode over theleft supra-orbital region; (5) anode over the left dorsolateralprefrontal cortex (DLPFC)–cathode over the right supra-orbitalregion; and (6) anode over the right DLPFC–cathode over the leftDLPFC. In these cases the electrodes were 5×7 cm2 with a totalapplied current of 1 mA. Solutions were also obtained for a5×7 cm2 anode above the right M1 and a 5×7 cm2 cathodeelectrode on the contralateral lower neck. For each solution, thecurrent densities were analyzed as detailed above (see Fig. 1A foran example of the anode over the right M1–cathode over the leftsupra-orbital region electrode montage; the full list of montages istabulated in Table 1).
ement Total current Current density
t M1 1 2.0supra-orbital −2.0t M1 1 2.9supra-orbital −2.9t M1 1 4.0supra-orbital −4.0t M1 1 100.0supra-orbital −100.0t M1 1 2.9M1 −2.9t DLPFC 1 2.9supra-orbital −2.9
1 2.9supra-orbital −2.9t M1 1 2.9lower neck −2.9t DLPFC 1 2.9DLPFC −2.9
1 2.9x −2.9t M1 1 2.9supra-orbital −2.9t M1 1 2.9M1 −2.9
athode distinction in the second column, electrode area in square centimetersclosed loop circuit which drives stimulation (in mA), and the average currente current density magnitudes are reported as the total current in the electrode
1116 T. Wagner et al. / NeuroImage 35 (2007) 1113–1124
Stroke models
We implemented three stroke models of various geometries toexplore the effects of anatomical perturbations on the currentinjected by tDCS. To represent the infarction site in the FEMgeometry, CSF was used to replace the damaged tissue as shown byboth imaging and histopathology studies in the post acute stage(Jacobs et al., 2001; Soltanian-Zadeh et al., 2003). As there havebeen no studies reporting the conductivity alterations at the graymatter white matter interface proximal to the infarction region(Foster and Schwan, 1996), the tissue was considered continuouscerebral tissue (conductivity=0.276 S/m). Strokes 1 and 2 werelocated in the right frontal lobe and modeled to represent infarctionsof the superior branches of the right middle cerebral artery. Stroke 1had an approximate volume of 18.5 cm3 with a maximum 2.5 cminferior to superior length along the cortical face, a maximumanterior to posterior length of 3.5 cm along the cortical face, and amaximum depth of 2.8 cm measured from the cortical face. Stroke 2had an approximate volume of 2.6 cm3 with a maximum inferior tosuperior length of 40 mm along the cortical face, a maximumanterior to posterior length of 20 mm along the cortical face, and amaximum depth of 4 mm measured from the cortical face. Finally,
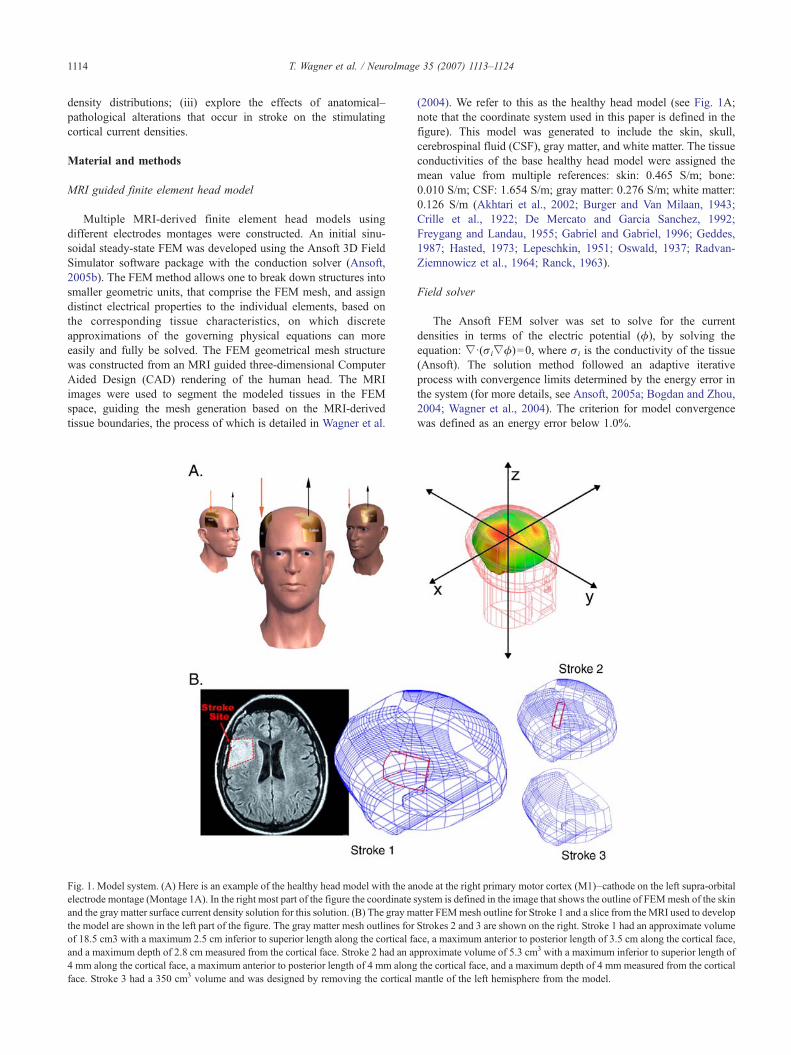
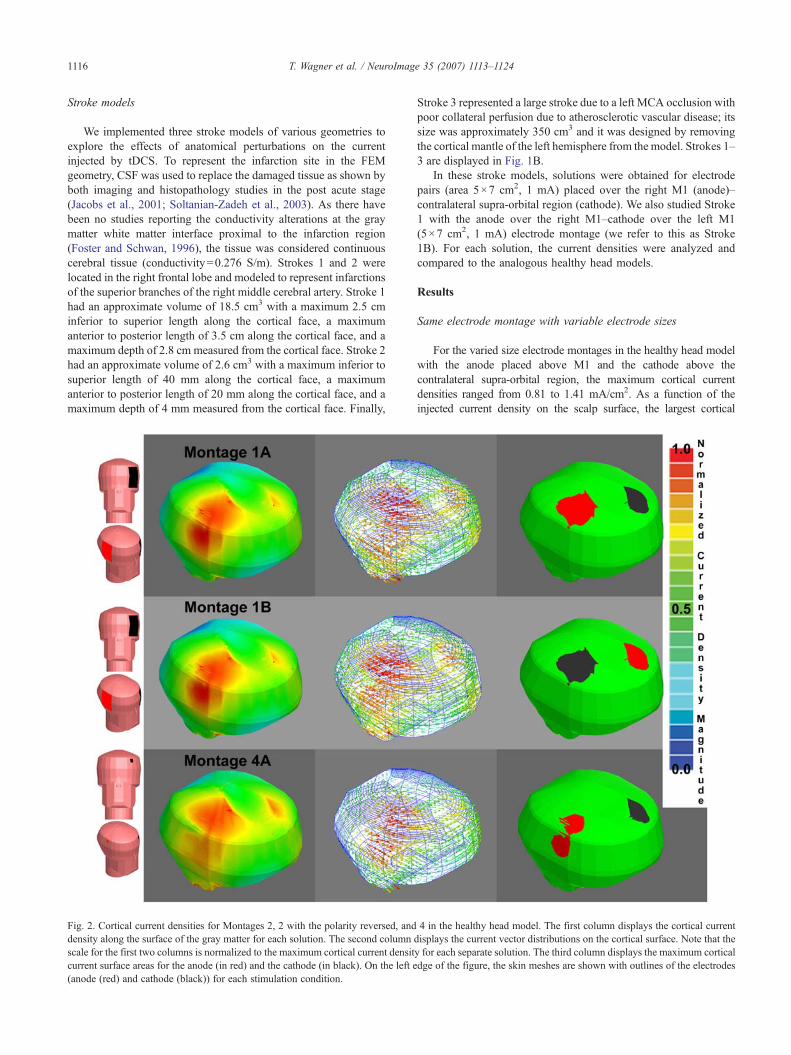
Fig. 2. Cortical current densities for Montages 2, 2 with the polarity reversed, anddensity along the surface of the gray matter for each solution. The second columnscale for the first two columns is normalized to the maximum cortical current densitcurrent surface areas for the anode (in red) and the cathode (in black). On the left e(anode (red) and cathode (black)) for each stimulation condition.
Stroke 3 represented a large stroke due to a left MCA occlusion withpoor collateral perfusion due to atherosclerotic vascular disease; itssize was approximately 350 cm3 and it was designed by removingthe cortical mantle of the left hemisphere from the model. Strokes 1–3 are displayed in Fig. 1B.
In these stroke models, solutions were obtained for electrodepairs (area 5×7 cm2, 1 mA) placed over the right M1 (anode)–contralateral supra-orbital region (cathode). We also studied Stroke1 with the anode over the right M1–cathode over the left M1(5×7 cm2, 1 mA) electrode montage (we refer to this as Stroke1B). For each solution, the current densities were analyzed andcompared to the analogous healthy head models.
Results
Same electrode montage with variable electrode sizes
For the varied size electrode montages in the healthy head modelwith the anode placed above M1 and the cathode above thecontralateral supra-orbital region, the maximum cortical currentdensities ranged from 0.81 to 1.41 mA/cm2. As a function of theinjected current density on the scalp surface, the largest cortical
4 in the healthy head model. The first column displays the cortical currentdisplays the current vector distributions on the cortical surface. Note that they for each separate solution. The third column displays the maximum corticaldge of the figure, the skin meshes are shown with outlines of the electrodes
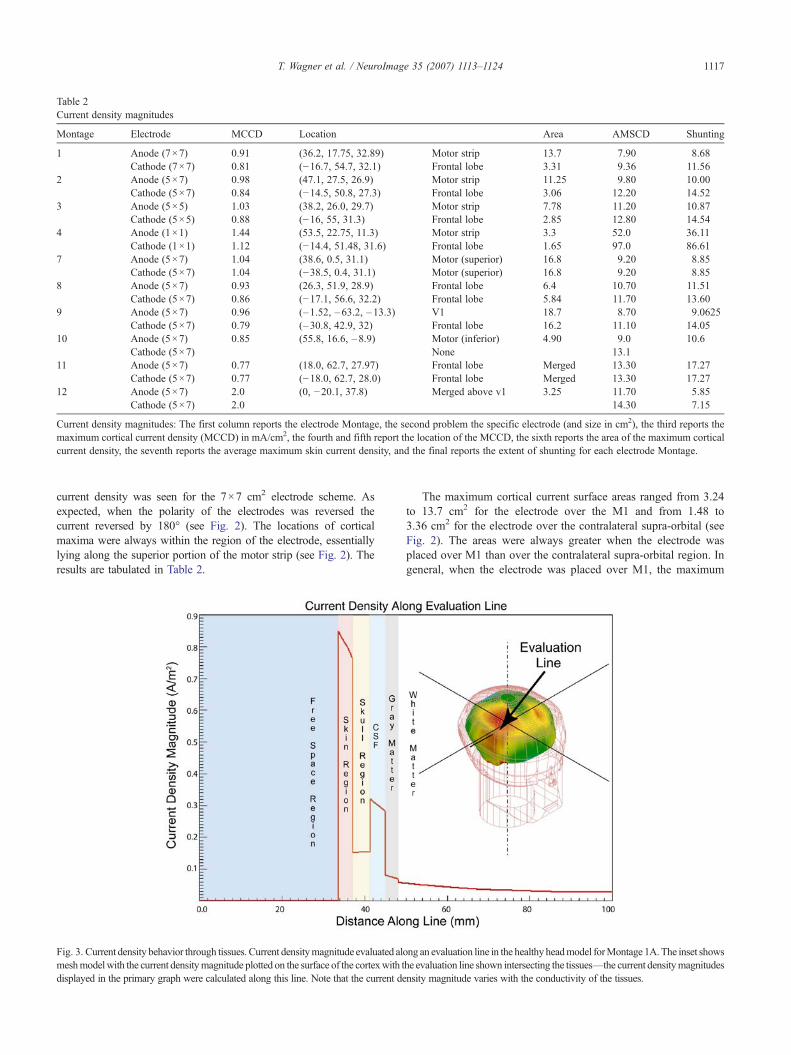
Table 2Current density magnitudes
Montage Electrode MCCD Location Area AMSCD Shunting
1 Anode (7×7) 0.91 (36.2, 17.75, 32.89) Motor strip 13.7 7.90 8.68Cathode (7×7) 0.81 (−16.7, 54.7, 32.1) Frontal lobe 3.31 9.36 11.56
2 Anode (5×7) 0.98 (47.1, 27.5, 26.9) Motor strip 11.25 9.80 10.00Cathode (5×7) 0.84 (−14.5, 50.8, 27.3) Frontal lobe 3.06 12.20 14.52
3 Anode (5×5) 1.03 (38.2, 26.0, 29.7) Motor strip 7.78 11.20 10.87Cathode (5×5) 0.88 (−16, 55, 31.3) Frontal lobe 2.85 12.80 14.54
4 Anode (1×1) 1.44 (53.5, 22.75, 11.3) Motor strip 3.3 52.0 36.11Cathode (1×1) 1.12 (−14.4, 51.48, 31.6) Frontal lobe 1.65 97.0 86.61
7 Anode (5×7) 1.04 (38.6, 0.5, 31.1) Motor (superior) 16.8 9.20 8.85Cathode (5×7) 1.04 (−38.5, 0.4, 31.1) Motor (superior) 16.8 9.20 8.85
8 Anode (5×7) 0.93 (26.3, 51.9, 28.9) Frontal lobe 6.4 10.70 11.51Cathode (5×7) 0.86 (−17.1, 56.6, 32.2) Frontal lobe 5.84 11.70 13.60
9 Anode (5×7) 0.96 (–1.52, –63.2, –13.3) V1 18.7 8.70 9.0625Cathode (5×7) 0.79 (–30.8, 42.9, 32) Frontal lobe 16.2 11.10 14.05
10 Anode (5×7) 0.85 (55.8, 16.6, –8.9) Motor (inferior) 4.90 9.0 10.6Cathode (5×7) None 13.1
11 Anode (5×7) 0.77 (18.0, 62.7, 27.97) Frontal lobe Merged 13.30 17.27Cathode (5×7) 0.77 (−18.0, 62.7, 28.0) Frontal lobe Merged 13.30 17.27
12 Anode (5×7) 2.0 (0, −20.1, 37.8) Merged above v1 3.25 11.70 5.85Cathode (5×7) 2.0 14.30 7.15
Current density magnitudes: The first column reports the electrode Montage, the second problem the specific electrode (and size in cm2), the third reports themaximum cortical current density (MCCD) in mA/cm2, the fourth and fifth report the location of the MCCD, the sixth reports the area of the maximum corticalcurrent density, the seventh reports the average maximum skin current density, and the final reports the extent of shunting for each electrode Montage.
1117T. Wagner et al. / NeuroImage 35 (2007) 1113–1124
current density was seen for the 7×7 cm2 electrode scheme. Asexpected, when the polarity of the electrodes was reversed thecurrent reversed by 180° (see Fig. 2). The locations of corticalmaxima were always within the region of the electrode, essentiallylying along the superior portion of the motor strip (see Fig. 2). Theresults are tabulated in Table 2.
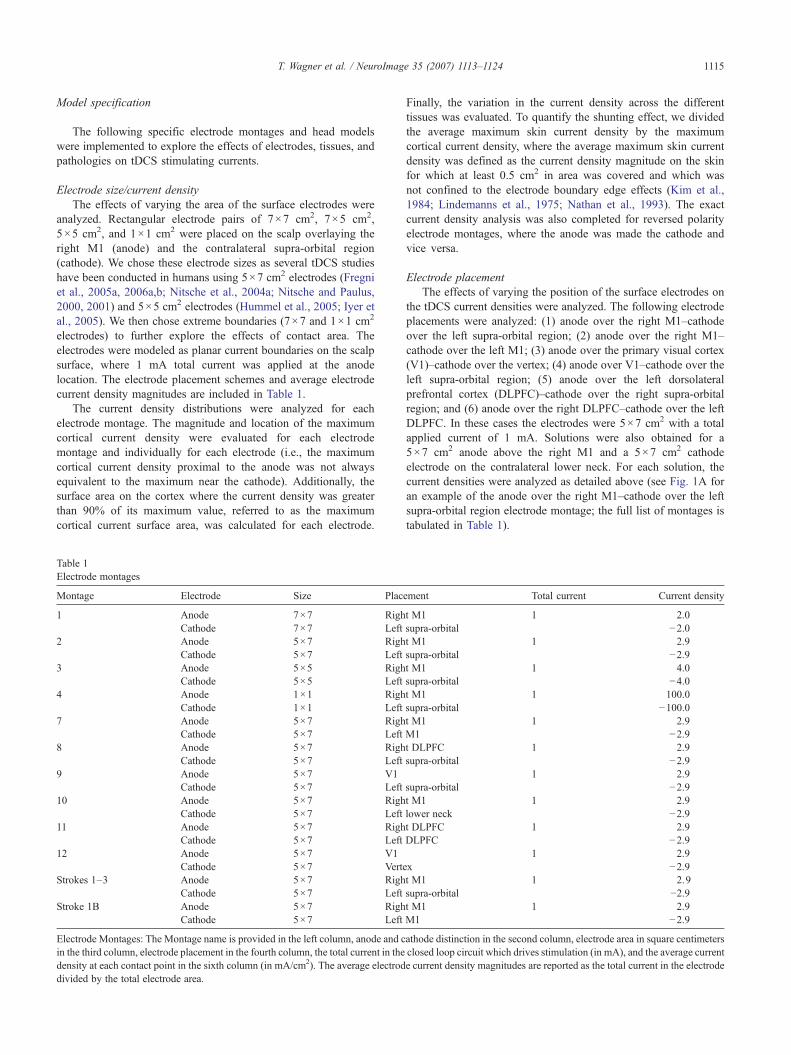
Fig. 3. Current density behavior through tissues. Current densitymagnitude evaluated alomeshmodelwith the current densitymagnitude plotted on the surface of the cortexwith tdisplayed in the primary graph were calculated along this line. Note that the current de
The maximum cortical current surface areas ranged from 3.24to 13.7 cm2 for the electrode over the M1 and from 1.48 to3.36 cm2 for the electrode over the contralateral supra-orbital (seeFig. 2). The areas were always greater when the electrode wasplaced over M1 than over the contralateral supra-orbital region. Ingeneral, when the electrode was placed over M1, the maximum
ng an evaluation line in the healthy headmodel forMontage 1A.The inset showshe evaluation line shown intersecting the tissues—the current densitymagnitudesnsity magnitude varies with the conductivity of the tissues.
1118 T. Wagner et al. / NeuroImage 35 (2007) 1113–1124
cortical current surface areas increased with increasing electrodesurface area. However, when the electrode was placed above thecontralateral supra-orbital region, the maximum cortical currentsurface areas did not vary much between the 7×7 cm2, 5×7 cm2,and 5×5 cm2 electrode schemes (slightly decreasing withdecreasing surface area), and only decreased by a factor ofapproximately two for the 1×1 cm2 electrodes. These results aretabulated in Table 2.
The current density vector distribution followed largely the samecourse and orientation for all of the varied electrode sizes (withdifferences in the relative magnitudes). The greatest difference wasobserved between the 7×7 and 1×1 cm2 electrode schemes, wherethe larger electrode surface area corresponded to a less focaldistribution. For all of the electrode schemes, the largest currentswere oriented along the superior part of the right motor strip acrossthe hemispheres and through the left superior medial frontal lobe(see Fig. 2 for a graphical representation of the distributions).
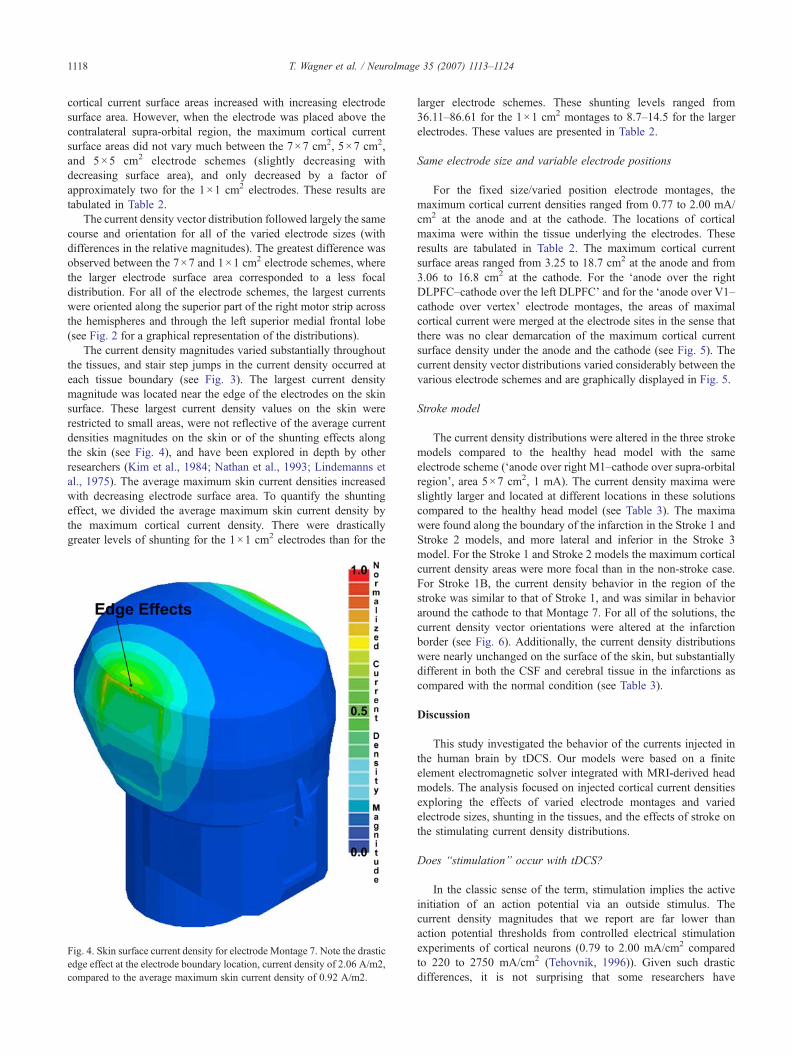
The current density magnitudes varied substantially throughoutthe tissues, and stair step jumps in the current density occurred ateach tissue boundary (see Fig. 3). The largest current densitymagnitude was located near the edge of the electrodes on the skinsurface. These largest current density values on the skin wererestricted to small areas, were not reflective of the average currentdensities magnitudes on the skin or of the shunting effects alongthe skin (see Fig. 4), and have been explored in depth by otherresearchers (Kim et al., 1984; Nathan et al., 1993; Lindemanns etal., 1975). The average maximum skin current densities increasedwith decreasing electrode surface area. To quantify the shuntingeffect, we divided the average maximum skin current density bythe maximum cortical current density. There were drasticallygreater levels of shunting for the 1×1 cm2 electrodes than for the
Fig. 4. Skin surface current density for electrode Montage 7. Note the drasticedge effect at the electrode boundary location, current density of 2.06 A/m2,compared to the average maximum skin current density of 0.92 A/m2.
larger electrode schemes. These shunting levels ranged from36.11–86.61 for the 1×1 cm2 montages to 8.7–14.5 for the largerelectrodes. These values are presented in Table 2.
Same electrode size and variable electrode positions
For the fixed size/varied position electrode montages, themaximum cortical current densities ranged from 0.77 to 2.00 mA/cm2 at the anode and at the cathode. The locations of corticalmaxima were within the tissue underlying the electrodes. Theseresults are tabulated in Table 2. The maximum cortical currentsurface areas ranged from 3.25 to 18.7 cm2 at the anode and from3.06 to 16.8 cm2 at the cathode. For the ‘anode over the rightDLPFC–cathode over the left DLPFC’ and for the ‘anode over V1–cathode over vertex’ electrode montages, the areas of maximalcortical current were merged at the electrode sites in the sense thatthere was no clear demarcation of the maximum cortical currentsurface density under the anode and the cathode (see Fig. 5). Thecurrent density vector distributions varied considerably between thevarious electrode schemes and are graphically displayed in Fig. 5.
Stroke model
The current density distributions were altered in the three strokemodels compared to the healthy head model with the sameelectrode scheme (‘anode over right M1–cathode over supra-orbitalregion’, area 5×7 cm2, 1 mA). The current density maxima wereslightly larger and located at different locations in these solutionscompared to the healthy head model (see Table 3). The maximawere found along the boundary of the infarction in the Stroke 1 andStroke 2 models, and more lateral and inferior in the Stroke 3model. For the Stroke 1 and Stroke 2 models the maximum corticalcurrent density areas were more focal than in the non-stroke case.For Stroke 1B, the current density behavior in the region of thestroke was similar to that of Stroke 1, and was similar in behavioraround the cathode to that Montage 7. For all of the solutions, thecurrent density vector orientations were altered at the infarctionborder (see Fig. 6). Additionally, the current density distributionswere nearly unchanged on the surface of the skin, but substantiallydifferent in both the CSF and cerebral tissue in the infarctions ascompared with the normal condition (see Table 3).
Discussion
This study investigated the behavior of the currents injected inthe human brain by tDCS. Our models were based on a finiteelement electromagnetic solver integrated with MRI-derived headmodels. The analysis focused on injected cortical current densitiesexploring the effects of varied electrode montages and variedelectrode sizes, shunting in the tissues, and the effects of stroke onthe stimulating current density distributions.
Does “stimulation” occur with tDCS?
In the classic sense of the term, stimulation implies the activeinitiation of an action potential via an outside stimulus. Thecurrent density magnitudes that we report are far lower thanaction potential thresholds from controlled electrical stimulationexperiments of cortical neurons (0.79 to 2.00 mA/cm2 comparedto 220 to 2750 mA/cm2 (Tehovnik, 1996)). Given such drasticdifferences, it is not surprising that some researchers have
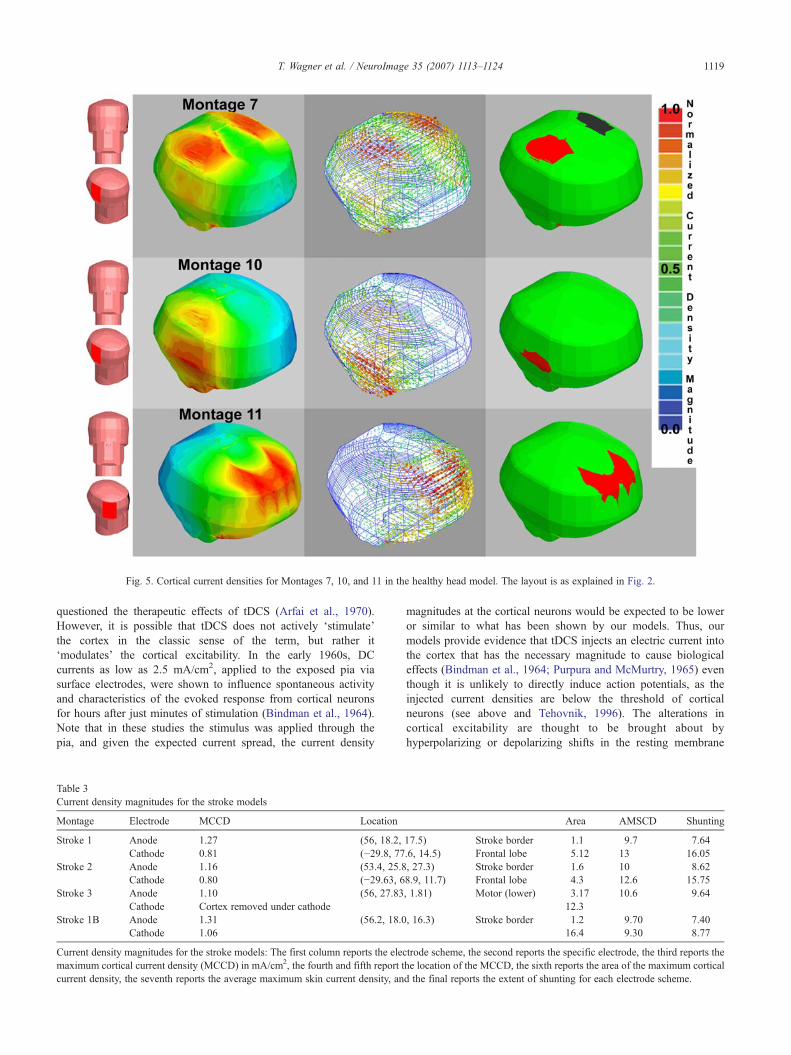
Fig. 5. Cortical current densities for Montages 7, 10, and 11 in the healthy head model. The layout is as explained in Fig. 2.
1119T. Wagner et al. / NeuroImage 35 (2007) 1113–1124
questioned the therapeutic effects of tDCS (Arfai et al., 1970).However, it is possible that tDCS does not actively ‘stimulate’the cortex in the classic sense of the term, but rather it‘modulates’ the cortical excitability. In the early 1960s, DCcurrents as low as 2.5 mA/cm2, applied to the exposed pia viasurface electrodes, were shown to influence spontaneous activityand characteristics of the evoked response from cortical neuronsfor hours after just minutes of stimulation (Bindman et al., 1964).Note that in these studies the stimulus was applied through thepia, and given the expected current spread, the current density
Table 3Current density magnitudes for the stroke models
Montage Electrode MCCD Location
Stroke 1 Anode 1.27 (56, 18.2,Cathode 0.81 (−29.8, 77
Stroke 2 Anode 1.16 (53.4, 25.8Cathode 0.80 (−29.63, 6
Stroke 3 Anode 1.10 (56, 27.83Cathode Cortex removed under cathode
Stroke 1B Anode 1.31 (56.2, 18.0Cathode 1.06
Current density magnitudes for the stroke models: The first column reports the elecmaximum cortical current density (MCCD) in mA/cm2, the fourth and fifth report tcurrent density, the seventh reports the average maximum skin current density, an
magnitudes at the cortical neurons would be expected to be loweror similar to what has been shown by our models. Thus, ourmodels provide evidence that tDCS injects an electric current intothe cortex that has the necessary magnitude to cause biologicaleffects (Bindman et al., 1964; Purpura and McMurtry, 1965) eventhough it is unlikely to directly induce action potentials, as theinjected current densities are below the threshold of corticalneurons (see above and Tehovnik, 1996). The alterations incortical excitability are thought to be brought about byhyperpolarizing or depolarizing shifts in the resting membrane
Area AMSCD Shunting
17.5) Stroke border 1.1 9.7 7.64.6, 14.5) Frontal lobe 5.12 13 16.05, 27.3) Stroke border 1.6 10 8.628.9, 11.7) Frontal lobe 4.3 12.6 15.75, 1.81) Motor (lower) 3.17 10.6 9.64
12.3, 16.3) Stroke border 1.2 9.70 7.40
16.4 9.30 8.77
trode scheme, the second reports the specific electrode, the third reports thehe location of the MCCD, the sixth reports the area of the maximum corticald the final reports the extent of shunting for each electrode scheme.
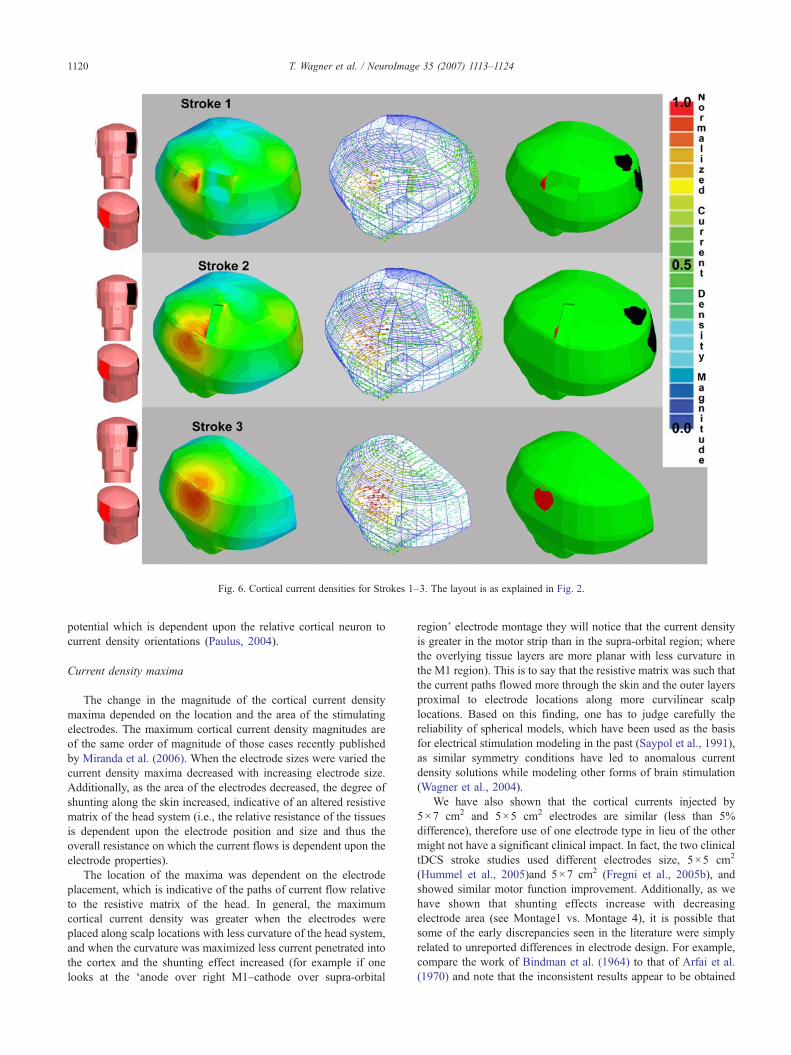
Fig. 6. Cortical current densities for Strokes 1–3. The layout is as explained in Fig. 2.
1120 T. Wagner et al. / NeuroImage 35 (2007) 1113–1124
potential which is dependent upon the relative cortical neuron tocurrent density orientations (Paulus, 2004).
Current density maxima
The change in the magnitude of the cortical current densitymaxima depended on the location and the area of the stimulatingelectrodes. The maximum cortical current density magnitudes areof the same order of magnitude of those cases recently publishedby Miranda et al. (2006). When the electrode sizes were varied thecurrent density maxima decreased with increasing electrode size.Additionally, as the area of the electrodes decreased, the degree ofshunting along the skin increased, indicative of an altered resistivematrix of the head system (i.e., the relative resistance of the tissuesis dependent upon the electrode position and size and thus theoverall resistance on which the current flows is dependent upon theelectrode properties).
The location of the maxima was dependent on the electrodeplacement, which is indicative of the paths of current flow relativeto the resistive matrix of the head. In general, the maximumcortical current density was greater when the electrodes wereplaced along scalp locations with less curvature of the head system,and when the curvature was maximized less current penetrated intothe cortex and the shunting effect increased (for example if onelooks at the ‘anode over right M1–cathode over supra-orbital
region’ electrode montage they will notice that the current densityis greater in the motor strip than in the supra-orbital region; wherethe overlying tissue layers are more planar with less curvature inthe M1 region). This is to say that the resistive matrix was such thatthe current paths flowed more through the skin and the outer layersproximal to electrode locations along more curvilinear scalplocations. Based on this finding, one has to judge carefully thereliability of spherical models, which have been used as the basisfor electrical stimulation modeling in the past (Saypol et al., 1991),as similar symmetry conditions have led to anomalous currentdensity solutions while modeling other forms of brain stimulation(Wagner et al., 2004).
We have also shown that the cortical currents injected by5×7 cm2 and 5×5 cm2 electrodes are similar (less than 5%difference), therefore use of one electrode type in lieu of the othermight not have a significant clinical impact. In fact, the two clinicaltDCS stroke studies used different electrodes size, 5×5 cm2
(Hummel et al., 2005)and 5×7 cm2 (Fregni et al., 2005b), andshowed similar motor function improvement. Additionally, as wehave shown that shunting effects increase with decreasingelectrode area (see Montage1 vs. Montage 4), it is possible thatsome of the early discrepancies seen in the literature were simplyrelated to unreported differences in electrode design. For example,compare the work of Bindman et al. (1964) to that of Arfai et al.(1970) and note that the inconsistent results appear to be obtained
1121T. Wagner et al. / NeuroImage 35 (2007) 1113–1124
with the same experimental design, however neither reports theirelectrode sizes.
Different electrode montages
The various electrode montages showed similar cortical currentdensity magnitudes for all of the cases. The maximum corticalcurrent density was found for the ‘anode over V1–cathode over thevertex’ electrode montage. In this case the electrodes were over alocation on the cortex that was fairly flat and the electrodes werevery close (less than 3.5 cm at shortest distance). However, itappears that the distance between the electrodes is less importantthan the overall relative location because we found the lowestcortical current density in the ‘anode over the right DLPFC–cathode over the left DLPFC’ electrode montage where theelectrodes were also very close (less than 3.8 cm at shortestdistance). In the case of the ‘anode over the right M1–cathode overthe left M1’, the current density magnitudes in the cortex wereactually larger than the case where the second electrode was placedover the contralateral supra-orbital region. This is again indicativeof the resulting current density paths and the overall resistivematrix of the head tissue system.
Current density orientation
Since the 1960s it has been known that the orientation of thecurrent densities is a key determinant in whether the cortex isfacilitated or suppressed (i.e., whether the spontaneous activity isincreased or decreased and whether the magnitudes of evokedpotentials are greater or smaller following stimulation). Previousstudies (Bindman et al., 1964; Landau et al., 1964; Purpura andMcMurtry, 1965) showed that surface-positive cortical polarizia-tion (anode placement) excites the cortex and that the oppositeeffect is seen with surface negative polarization. Landau et al.(1964) showed that the surface effects could be reversed by placingthe stimulating source within the cortex, such that the currentdensity orientations were reversed relative to the stimulatedneurons. In addition, Terzuolo and Bullock (1956) showed asimilar effect in neural preparations. They observed that the changein the neural firing frequency with weak DC currents could bemodulated based on the relative current to neural orientations. Inmore recent tDCS studies, Nitsche and Paulus (2000) showed thatstimulation with the cathode placed above the motor cortexsuppresses subsequent cortico-spinal responses, whereas facilita-tion of cortico-spinal responses is observed with the anode placedabove the motor cortex. Additionally, behavioral task differenceshave been shown to be dependent on the use of anodal or cathodaltDCS over the same area. For instance, Fregni et al. (2005c)showed that anodal stimulation of the left dorsolateral prefrontalcortex leads to an enhancement of working memory that was notobserved when the polarity was reversed. Similarly, while anodalstimulation of M1 or V5 increases significantly the percentage ofcorrect tracking movements in the early learning phase, cathodalstimulation induces no significant effect on the performance of thistask (Antal et al., 2004).
Thus, with the different electrode schemes studied, one canclearly see that changing the polarity of the electrodes is not theonly way to alter the orientation of the injected current densitiesas varied anode and cathode positioning clearly alters the finalcurrent density orientations. For instance, when one compares thedifferent current orientations (see Figs. 2 and 5) for the varied
electrode positions it is apparent that changes in the position canhave a drastic effect on the injected current orientations. Andthus, it could be possible that multi-polar electrode schemes couldbe devised which could more accurately focus the currents inspecific brain regions and future research based on thismethodology should be explored.
Stroke model
Fields were altered in the stroke model, relative to the healthyhead, such that the current density maxima were elevated andlocated directly along the stroke border for Stroke 1 and Stroke 2and more inferior along the cortical surface for Stroke 3. TheCSF in the infarction region provided a different conductive pathfor the currents away from the maximum current density locationin the healthy head model. The kind of perturbations observed inthe stroke models might occur with other pathologies. Therefore,in applying tDCS to abnormal patients, just as with other formsof brain stimulation (Wagner et al., 2006), it is critical to considerthe location, geometry, and tissue characteristics of the patholo-gical region, as adjustments of the stimulation montage might beneeded to safely affect the desired cortical target. As we onlyreport for 3 different models here, further research needs to becompleted in this area. Additionally, we believe that theimplications of the results should also be assessed whenstimulation is applied in regions of major convolutions and gyrion the cortical surface as such inhomogeneities have been shownto alter the fields in other forms of stimulation (Miranda et al.,2003; Wagner et al., 2006).
Physics as a foundation for future studies
By exploring the current densities injected into the cortex duringtDCS, this paper provides a foundation based on physics by whichone can guide future clinical studies and explore fundamentalaspects of this technique. In the healthy headmodel themagnitude ofthe cortical current density in the region of the cortex under a singleelectrode is primarily dependent on the scalp position of theelectrode, the electrode size, the injected current density, and therelative electrical and anatomical properties of the tissues in theregion. However, the current density orientations are dependent onthe position of both electrodes. For example, if one comparesMontage 2 with Montage 7, see Figs. 2 and 5, one will note thatmagnitude of the cortical current densities are not drasticallydifferent between the two montages (0.98 vs. 1.04 mA/cm2 at theanode and 0.84 vs. 1.04 mA/cm2 at the cathode respectively) but thatthe orientation of the current density vectors points in differentdirections. The cortical currents of Montage 2 are directed in a moredorsal to ventral orientation than the lateral tomedial currents seen inMontage 7, see Figs. 2 and 5. This type of information provided byour modeling approach can guide future clinical studies. Forexample, clinical investigators could use the current densitymagnitude information to establish that induction of relativelyselective changes in neural excitability in just one M1 could best beaccomplished with Montage 2, or that Montage 7 is most likely toinduce comparable changes in both the right and left M1s.Additionally a more pronounced effect in M1 could be achievedwith Montage 7 than Montage 2 due to the increased cortical currentdensity. From the general polarity of the currents, one would expectan overall inhibitory response under the cathode and a facilitatoryresponse under the anode for both Montages 2 and 7, but one could
1122 T. Wagner et al. / NeuroImage 35 (2007) 1113–1124
expect more subtle local changes based on the differences in thecurrent density orientations. M1 is located under the anode in bothmontages, but the orientation of the currents in M1 depends on thecathode location and is thus different for each montage (see Figs. 2and 5). In fact when one examines the study of Nitsche and Paulus(2000), they found that tDCS modulation of the cortical response ofthe abductor digiti minimi muscle was dependent on the relativeelectrode placement when comparing these two electrode montages(finding Montage 2 superior for modulation). As previouslydiscussed, the relative current to axonal axis orientation is importantin determining the degree of neural excitability changes, and thuswith these two facts it is possible to expect that different neuralpopulations would be affected unequally. Additionally, it should benoted that one would expect subtle differences dependent onindividual anatomical variations (neural architecture and grossanatomical differences).
With the broad electrodes currently used in tDCS it is difficultto say how easy it will be for a clinician to harness these effects,but with future improvements in the technique such focal controlmight be possible. One could postulate the use of multipleelectrodes of smaller dimensions and unequal current densities toinfluence neural populations based on their anatomical orienta-tions relative to the calculated current densities. In the future, onecould use the electromagnetic approach presented here to furtherincrease the focality of tDCS without relying on complicatedsurgical procedures and studies and one could conceive of aclinical tracking system that predicts the current densitydistribution in patients relative to their individual MRIs andunique pathologies.
Clinical implications
Results of this study have several clinical implications and theycan guide the design of future clinical studies using tDCS. First wewill focus on major depression and stroke, where recent studiessuggest a therapeutic potential of tDCS (Fregni et al., 2006a;Nitsche, 2002).
Several studies have shown that another noninvasive techniquefor brain stimulation (repetitive transcranial magnetic stimulation orrTMS) might be useful in the treatment of depression (see meta-analysis, Holtzheimer et al., 2001 or Couturier, 2005). The leadinghypothesis to account for the antidepressant effects of rTMS (seereview, Gershon et al., 2003) is that when high-frequency rTMS,which has been shown to increase cortical excitability, is applied tothe left DLPFC it can normalize a pathological state of hypoactivityin depressed patients (or conversely low-frequency rTMS, whichhas been shown to decrease cortical excitability, to the right DLPFCcan normalize the opposite hemisphere's state of hyperactivity) andstabilize an interhemispheric imbalance in activity thought to becausally related to the mood disturbance. The existing results wouldsuggest that anodal tDCS of the left DLPFC or cathodal tDCS of theright DLPFC might both result in depression amelioration. Indeed,tDCS treatment using the electrode montage of anodal–left DLPFCand cathodal–contralateral supra-orbital (reference electrode) isassociated with mood improvement in patients with treatmentresistant depression (Fregni et al., 2006a). The results of our studyshow that this electrode montage with the supra-orbital reference,will result in adequate current magnitude in the area under the activeelectrode (i.e., the DLPFC electrode). An alternative approachwould be the bilateral stimulation in which the excitability-enhancing anode electrode is placed over the left DLPFC and the
excitability-diminishing cathode electrode is placed over the rightDLPFC. Bilateral stimulation has been investigated before usingrTMS (Hausmann et al., 2004), but due to technical limitations firstone and then the other hemisphere were targeted. However, with thetechnique of tDCS, bilateral stimulation could be performedsimultaneously, placing the anode and cathode over homologousregions of the right and left hemispheres. Our study shows that such amontage would lead to rather large shunting of currents given theproximity of both electrodes. Nevertheless, we show that the corticalcurrent density in the DLPFCwould be comparable for the “bilateral”montage when compared to the “unilateral” montage (anode on theDLPFC and cathode on the contralateral supra-orbital).
In stroke, recent research suggests that the facilitation ofactivity in the lesioned hemisphere and the suppression of activityin the undamaged hemisphere might both have a desirabletherapeutic impact and promote recovery of function in thesepatients (Ward and Cohen, 2004). Given these aims, three tDCSapproaches would seem to be reasonable: (1) anodal tDCS of theaffected hemisphere with the expectation that activity will beincreased; (2) cathodal tDCS of the unaffected hemisphere with theaim of reducing cortical excitability; and (3) bilateral stimulation inwhich both motor cortices are stimulated simultaneously byapplying anodal tDCS to the affected and cathodal tDCS to theunaffected hemisphere. The results of our study show that theapproaches (1) and (2) might induce significant and reliablecurrents in the cortex if the reference electrode is placed over thecontralateral supra-orbital area. This finding is in accordance withrecent clinical data (Fregni et al., 2005a; Hummel et al., 2005).Furthermore, our results show that bihemispheric stimulation willalso induce currents in the motor cortices of adequate magnitudeand thus may in fact allow for an even greater desirable modulationof bihemispheric activity and a larger behavioral effect size.
An important question when using tDCS in stroke is whetherthe stroke lesion would disturb the electric current similarly to whatis observed in rTMS (Wagner et al., 2006). However, when onecompares tDCS with rTMS in the case of stroke it is apparent thatthere are large differences in the degree of perturbation of thestimulating currents caused by the infarction depending on thestimulation methodology. We show that, differently from rTMS,the cortical current densities injected by tDCS in head models ofstroke remain relatively unchanged. There certainly is a dis-turbance to the injected currents, with an increased current densityat the location of the infarction border, but these remain in therange of magnitudes of stimulation in the healthy head model.
Our results should help the delineation of future clinical trials inother neuropathologies. For instance, we showed that the position ofthe electrode reference will not affect significantly the corticalcurrent density magnitudes under the active electrode (see the‘5×7 cm2 right M1 anode–5×7 cm2 contralateral lower neckcathode’montage). This might be particularly important for patientswith epilepsy on whom the localization of the electrodes might needto vary according to the epileptogenic focus (see Fregni et al.,2006b). When one examines this ‘5×7 cm2 right M1 anode–5×7 cm2 contralateral lower neck cathode’ montage it should benoted that negligible current densities were found in the brain stemregion (most likely due to the neck electrode being placed on thecontralateral ventral portion of the neck and the smaller area of theelectrode contributing to shunting). However, one could clearlyimplement electrode montages that could influence brain stemactivity, although this has been discouraged due to safety reasons(Nitsche et al., 2003).

1123T. Wagner et al. / NeuroImage 35 (2007) 1113–1124
Limitations and future improvements
Some limitations of this study suggest specific areas of possiblefuture research. First, the resolution of the model is limited by theCAD rendering of the human head and does not share the sameresolution as the MRI that was used to derive it. Additionally,further research needs to be completed on the DC tissue electricalproperties to account for their anisotropies and heterogeneities. Themodel should be expanded in the future to account for these tissueproperties as more data become available. Another limitationrequiring further exploration comes from the fact that true strokelesions have irregular borders and shapes that were not completelyreproduced by our model. Work in this area should be pursued inthe future.
Conclusions
This paper has presented models of the injected cortical currentdensities during tDCS. For the different electrode schemes studied,the calculated current density magnitudes are sufficient to concludethat in humans tDCS is indeed capable of altering ongoing corticalneural activity. Additionally, this study has demonstrated that tDCSeffects are altered in the presence of cortical damage, though theeffect is relatively small as compared with other brain stimulationtechniques. The kind of perturbations observed in the strokemodels will occur in other pathological cases in which thegeometry or electrical characteristics of brain tissue are altered. Webelieve future studies focused on the effects of tissue anisotropieson the injected field, pathology effects on the injected fields, andthe relative current orientation to the cellular micro-architectureshould be pursued. Future efforts and model refinements will helpoptimize stimulation strategies for future clinical studies.
References
Akhtari, M., Bryant, H.C., Mamelak, A.N., Flynn, E.R., Heller, L., Shih, J.J.,Mandelkern, M., Matlachov, A., Ranken, D.M., Best, E.D., et al., 2002.Conductivities of three-layer live human skull. Brain Topogr. 14 (3),151–167.
Aldini, G., 1804. Essai theorique et experimental sur le galvanisme.Fournier, Paris.
Ansoft, 2005a. Asoft 3D Manual. Ansoft, Pittsburgh.Ansoft, 2005b. Maxwell. Version 10 3D. Ansoft, Pittsburgh.Antal, A., Kincses, T.Z., Nitsche, M.A., Paulus, W., 2003. Modulation of
moving phosphene thresholds by transcranial direct current stimulationof V1 in human. Neuropsychologia 41 (13), 1802–1807.
Antal, A., Kincses, T.Z., Nitsche, M.A., Bartfai, O., Paulus, W., 2004.Excitability changes induced in the human primary visual cortex bytranscranial direct current stimulation: direct electrophysiologicalevidence. Investig. Ophthalmol. Vis. Sci. 45 (2), 702–707.
Arfai, E., Theano, G., Montagu, J.D., Robin, A.A., 1970. A controlled studyof polarization in depression. Br. J. Psychiatry 116 (533), 433–434.
Barker, A.T., 1994. Magnetic nerve stimulation: principles, advantages, anddisadvantages. In: Ueno, S. (Ed.), Biomagnetic Stimulation. PlenumPress, New York.
Bindman, L.J., Lippold, O.C., Redfearn, J.W., 1964. The action of briefpolarizing currents on the cerebral cortex of the rat (1) during currentflow and (2) in the production of long-lasting after-effects. J. Physiol.172, 369–382.
Bogdan, I., Zhou, P., 2004. 3D software levels of the electromagnetic field.Eng. Technol. 18–20.
Burger, H.C., Van Milaan, J.B., 1943. Measurement of the specific resistanceof the human body to direct current. Acta Med. Scand. 114, 584–607.
Couturier, J.L., 2005. Efficacy of rapid-rate repetitive transcranial magneticstimulation in the treatment of depression: a systematic review and meta-analysis. J. Psychiatry Neurosci. 30 (2), 83–90.
Crille, G.W., Hosmer, H.R., Rowland, A.F., 1922. The electricalconductivity of animal tissues under normal and pathological conditions.Am. J. Physiol. 60, 59–106.
De Mercato, G., Garcia Sanchez, F.J., 1992. Correlation between low-frequency electric conductivity and permittivity in the diaphysis ofbovine femoral bone. IEEE Trans. Biomed. Eng. 39 (5), 523–526.
Foster, K.R., Schwan, H.P., 1996. Dielectric properties of tissues. In: Polk,C., Postow, E. (Eds.), Biological Effects of Electromagnetic Fields. CRCPress, New York, pp. 25–102.
Fregni, F., Boggio, P.S., Mansur, C.G., Wagner, T., Ferreira, M.J., Lima,M.C., Rigonatti, S.P., Marcolin, M.A., Freedman, S.D., Nitsche, M.A.,et al., 2005a. Transcranial direct current stimulation of the unaffectedhemisphere in stroke patients. NeuroReport 16 (14), 1551–1555.
Fregni, F., Boggio, P.S., Mansur, C.G., Wagner, T., Ferreira, M.J., Lima,M.C., Rigonatti, S.P., Marcolin, M.A., Freedman, S.D., Nitsche, M.A.,et al., 2005b. Transcranial direct current stimulation of the unaffectedhemisphere in stroke patients. NeuroReport 16 (14), 1551–1555.
Fregni, F., Boggio, P.S., Nitsche, M., Bermpohl, F., Antal, A., Feredoes, E.,Marcolin, M.A., Rigonatti, S.P., Silva, M.T., Paulus, W., et al., 2005c.Anodal transcranial direct current stimulation of prefrontal cortexenhances working memory. Exp. Brain Res. 166 (1), 23–30.
Fregni, F., Boggio, P.S., Nitsche, M., Marcolin, M.A., Rigonatti, S.P.,Pascual-Leone, A., 2006a. Treatment of major depression withtranscranial direct current stimulation. Bipolar Disord 8 (2), 203–204.
Fregni, F., Thome-Souza, S., Nitsche, M., Freedman, S.D., Valente, K.D.,Pascual, A.P, 2006b. A controlled clinical trial of cathodal DC polarizationin patients with refractory epilepsy. Epilepsia 47 (2), 335–342.
Freygang, W.H., Landau, W.M., 1955. Some relations between resistivityand electrical activity in the cerebral cortex of the cat. J. Cell Comp.Physiol. 45, 377–392.
Gabriel, C., Gabriel, S. 1996. Compilation of the dielectric properties ofbody tissues at RF and microwave frequencies. San Antonio: Air ForceMaterial Command, Brooks Air Force Base, TX. Report nr AL/OE-TR-1996-0037.
Geddes, L.A., 1987. Optimal stimulus duration for extracranial corticalstimulation. Neurosurgery 20 (1), 94–99.
Gershon, A.A., Dannon, P.N., Grunhaus, L., 2003. Transcranial magneticstimulation in the treatment of depression. Am. J. Psychiatry 160 (5),835–845.
Hall, K.M., Hicks, R.A., Hopkins, H.K., 1970. The effects of low level DCscalp positive and negative current on the performance of various tasks.Br. J. Psychiatry 117, 689–691.
Hasted, J.B., 1973. Aqueous Dielectrics. Halsted Press, New York. 302 pp.Hausmann, A., Pascual-Leone, A., Kemmler, G., Rupp, C.I., Lechner-
Schoner, T., Kramer-Reinstadler, K., Walpoth, M., Mechtcheriakov, S.,Conca, A., Weiss, E.M., 2004. No deterioration of cognitiveperformance in an aggressive unilateral and bilateral antidepressantrTMS add-on trial. J. Clin. Psychiatry 65 (6), 772–782.
Holtzheimer III, P.E., Russo, J., Avery, D.H., 2001. A meta-analysis ofrepetitive transcranial magnetic stimulation in the treatment ofdepression. Psychopharmacol. Bull. 35 (4), 149–169.
Hummel, F., Celnik, P., Giraux, P., Floel, A., Wu, W.H., Gerloff, C., Cohen,L.G., 2005. Effects of non-invasive cortical stimulation on skilled motorfunction in chronic stroke. Brain 128 (Pt. 3), 490–499.
Iyer, M.B., Mattu, U., Grafman, J., Lomarev, M., Sato, S., Wassermann,E.M., 2005. Safety and cognitive effect of frontal DC brainpolarization in healthy individuals. Neurology 64 (5), 872–875.
Jacobs, M.A., Zhang, Z.G., Knight, R.A., Soltanian-Zadeh, H., Goussev,A.V., Peck, D.J., Chopp, M., 2001. A model for multiparametric MRItissue characterization in experimental cerebral ischemia with histolo-gical validation in rat. Part 1. Stroke 32 (4), 943–949.
Kim, Y., Webster, J.G., Tomkins, W.J., 1984. Simulated and experimentalstudies of temperature elevation around electrosurgical dispersiveelectrodes. IEEE Trans. Biomed. Eng. 31, 681–692.
1124 T. Wagner et al. / NeuroImage 35 (2007) 1113–1124
Landau, W.M., Bishop, G.H., Clare, M.H., 1964. Analysis of the form anddistribution of evoked cortical potentials under the influence ofpolarizing currents. J. Neurophysiol. 27, 788–813.
Lepeschkin, E., 1951. Modern Electrophysiology. Williams and Wilkins,Baltimore.
Lindemanns, F.W., Heethaar, R.M., Denier van der Gon, J.J., Zimmer-man, A.N.E., 1975. Site of initial excitation and current threshold asa function of electrode radius in heart muscle. Cardiac. Res. 9,95–104.
Lolas, F., 1976. Brain polarization: behavioral and therapeutic effects. Br. J.Psychiatry 12 (1), 1977.
Miranda, P.C., Hallett, M., Basser, P.J., 2003. The electric field induced inthe brain by magnetic stimulation: a 3-D finite-element analysis of theeffect of tissue heterogeneity and anisotropy. IEEE Trans. Biomed. Eng.50 (9), 1074–1085.
Miranda, P.C., Lomarev, M., Hallett, M., 2006. Modeling the currentdistribution during transcranial direct current stimulation. Clin. Neuro-physiol. 117 (7), 1623–1629.
Nathan, S.S., Sinha, S.R., Gordon, B., Lesser, R.P., Thakor, N.V., 1993.Determination of current density distributions generated by electricalstimulation of the human cerebral cortex. Electroencephalogr. Clin.Neurophysiol. 86 (3), 183–192.
Nitsche, M.A., 2002. Transcranial direct current stimulation: a newtreatment for depression? Bipolar Disord. 4 (Suppl 1), 98–99.
Nitsche, M.A., Paulus, W., 2000. Excitability changes induced in the humanmotor cortex by weak transcranial direct current stimulation. J. Physiol.527 (Pt 3), 633–639.
Nitsche, M.A., Paulus, W., 2001. Sustained excitability elevations inducedby transcranial DC motor cortex stimulation in humans. Neurology 57(10), 1899–1901.
Nitsche, M.A., Liebetanz, D., Tergau, F., Paulus, W., 2002. Modulation ofcortical excitability by transcranial direct current stimulation. Nervenarzt73 (4), 332–335.
Nitsche, M.A., Liebetanz, D., Lang, N., Antal, A., Tergau, F., Paulus, W.,2003. Safety criteria for transcranial direct current stimulation (tDCS) inhumans. Clin. Neurophysiol. 114 (11), 2220–2222 (author reply 2222-3).
Nitsche, M.A., Grundey, J., Liebetanz, D., Lang, N., Tergau, F., Paulus, W.,2004a. Catecholaminergic consolidation of motor cortical neuroplasti-city in humans. Cereb. Cortex 14 (11), 1240–1245.
Nitsche, M.A., Niehaus, L., Hoffmann, K.T., Hengst, S., Liebetanz, D.,Paulus, W., Meyer, B.U., 2004b. MRI study of human brain exposed to
weak direct current stimulation of the frontal cortex. Clin. Neurophysiol.115 (10), 2419–2423.
Oswald, K., 1937. Messung der leitfahigkeit und Dielektrizitatkonstantebiologischer Gewebe un Flussigkeiten bei kurzen Wellen. Hochfre-quenztech. Elektroakust. 49, 40–49.
Paulus, W., 2004. Outlasting excitability shifts induced by direct currentstimulation of the human brain. Suppl. Clin. Neurophysiol. 57, 708–714.
Priori, A., 2003. Brain polarization in humans: a reappraisal of an old toolfor prolonged non-invasive modulation of brain excitability. Clin.Neurophysiol. 114 (4), 589–595.
Purpura, D.P., McMurtry, J.G., 1965. Intracellular activities and evokedpotential changes during polarization of motor cortex. J. Neurophysiol.28, 166–185.
Radvan-Ziemnowicz, J.C., McWilliams, J.C., Kucharski, W.E., 1964. In:Werner, Ma. (Ed.), Conductivity Versus Frequency in Human and FelineCerebrospinal Fluid. Washington 12, DC.
Ranck, J.B., 1963. Specific impedance of rabbit cerebral cortex. Exp.Neurol. 7, 144–152.
Saypol, J.M., Roth, B.J., Cohen, L.G., Hallett, M., 1991. A theoreticalcomparison of electric and magnetic stimulation of the brain. Ann.Biomed. Eng. 19 (3), 317–328.
Sheffield, L.J., Mowbray, R.M., 1968. The effect of polarization on normalsubjects. Br. J. Psychiatry 114, 225–232.
Soltanian-Zadeh, H., Pasnoor, M., Hammoud, R., Jacobs, M.A., Patel, S.C.,Mitsias, P.D., Knight, R.A., Zheng, Z.G., Lu, M., Chopp, M., 2003. MRItissue characterization of experimental cerebral ischemia in rat. J. Magn.Reson. Imaging 17 (4), 398–409.
Tehovnik, E.J., 1996. Electrical stimulation of neural tissue to evokebehavioral responses. J. Neurosci. Methods 65 (1), 1–17.
Terzuolo, C.A., Bullock, T.H., 1956. Measurement of imposed voltagegradient adequate to modulate neuronal firing. Proc. Natl. Acad. Sci.U. S. A. 42 (9), 687–694.
Wagner, T.A., Zahn, M., Grodzinsky, A.J., Pascual-Leone, A., 2004. Three-dimensional head model simulation of transcranial magnetic stimulation.IEEE Trans. Biomed. Eng. 51 (9), 1586–1598.
Wagner, T., Fregni, F., Eden, U., Ramos-Estebanez, C., Grodzinsky, A.J.,Zahn, M., Pascual-Leone, A., 2006. Transcranial magnetic stimulationand stroke: a computer based human model study. NeuroImage 30 (3),857–870.
Ward, N.S., Cohen, L.G., 2004. Mechanisms underlying recovery of motorfunction after stroke. Arch. Neurol. 61 (12), 1844–1848.