Computer simulation of waste combustion in a moving grate ... · Computer simulation of waste...
12
Computer simulation of waste combustion in a moving grate furnace as a tool for process optimization and operator training «STRACT G. Brem and L.B.M. van Kessel TNO-MEP P.O.Box 342 7300 Apeldoom The Netherlds A computer model has been developed to simulate the waste combustion process in a moving grate ace. The computer model describes the main processes occuing both in the waste layer on the ate, d in the gas phase in the ace. The boiler section d the flue gas cleng equipment are also included in the modeL The computer simulation proam can be used for the desi of new and advced control concepts, for the evaluation or optimization of present control concepts, d for the effectiveness of new sensors of key pareters in the conol concept. For operator aining purposes, the simulation program is extended with a graphic interface. Operators c thus be ained in noal d emergency situations, start-up and shut-down, d ala diagnosis. The computer simulation program is based on first principles. The description of the underlying physics of the combustion model has been validated against experiments in a laboratory grate ace. In this ace a lot of experiments with different types of waste and various process conditions have been cried out. Furtheore the model is validated against data om ll-scale incinerators. The above described computer simulation progr is used in practice for process optimiation d the desi of a new control system. The pro is continuously modified, refined d extended. The state-of-the-art and the latest results of the computer simulation proam d also the main results of the experimental resech pro will be described in this paper. 1. INTRODUCTION Incineration of municipal solid waste (MSW) is one of the most complex unit operations presently in use. The processes occurring within the incinerator include combustion of the solid waste on a ate, d tbulent combustion in the gas phase of the ace. In light of the complexity of the process it is not surprising that the design of incinerators is more based on empiricism than on owledge. A better understanding will only be forcoming as a result of extensive ndental research and cel experimentation on ll-scale units. Since 1991, the TNO Institute of Environmental Sciences, Energy Resech d Process Iovation (TNO-MEP) is perfoing a ndental resech proam on the optimization of the MSW incineration technology (MSWI). This resech is cried out in cooperation with Twente U- versity of Technology. The main activities in this research program e: (1) the development of ma- ematical models conceng combustion of the waste layer on the ate, the gas phase combustion in the ace, the dioxin reactions in the cooling zone and e dyamic behavior of the incinerator, (2) experimentation with a pilot-plant of an MSW incinerator, d (3) experimental verification in ll-scale units. Preliminary results of activity (1) d (2) have already been presented elsewherel. In this paper infoation will be given on e main processes occuing in a ate ace, main results of the experimental research program in the TNO laboratory grate ace, the main results of the mathematical modeling work and the MSWI simulator will be presented. 293
Transcript of Computer simulation of waste combustion in a moving grate ... · Computer simulation of waste...

Computer simulation of waste combustion in a moving grate furnace as a tool for process optimization and operator training
ABSTRACT
G. Brem and L.B.M. van Kessel
TNO-MEP P.O.Box 342
7300 AH Apeldoom The Netherlands
A computer model has been developed to simulate the waste combustion process in a moving grate furnace. The computer model describes the main processes occurring both in the waste layer on the grate, and in the gas phase in the furnace. The boiler section and the flue gas cleaning equipment are also included in the modeL The computer simulation program can be used for the design of new and advanced control concepts, for the evaluation or optimization of present control concepts, and for the effectiveness of new sensors of key parameters in the control concept. For operator training purposes, the simulation program is extended with a graphic interface. Operators can thus be trained in normal and emergency situations, start-up and shut-down, and alarm diagnosis.
The computer simulation program is based on first principles. The description of the underlying physics of the combustion model has been validated against experiments in a laboratory grate furnace. In this furnace a lot of experiments with different types of waste and various process conditions have been carried out. Furthermore the model is validated against data from full-scale incinerators.
The above described computer simulation program is used in practice for process optimi]:ation and the design of a new control system. The program is continuously modified, refined and extended. The state-of-the-art and the latest results of the computer simulation program and also the main results of the experimental research program will be described in this paper.
1. INTRODUCTION
Incineration of municipal solid waste (MSW) is one of the most complex unit operations presently in use. The processes occurring within the incinerator include combustion of the solid waste on a grate, and turbulent combustion in the gas phase of the furnace. In light of the complexity of the process it is not surprising that the design of incinerators is more based on empiricism than on knowledge. A better understanding will only be forthcoming as a result of extensive fundamental research and careful experimentation on full-scale units.
Since 1991, the TNO Institute of Environmental Sciences, Energy Research and Process Innovation (TNO-MEP) is performing a fundamental research program on the optimization of the MSW incineration technology (MSWI). This research is carried out in cooperation with Twente University of Technology. The main activities in this research program are: (1) the development ofmathematical models concerning combustion of the waste layer on the grate, the gas phase combustion in the furnace, the dioxin reactions in the cooling zone and the dyriamic behavior of the incinerator, (2) experimentation with a pilot-plant of an MSW incinerator, and (3) experimental verification in full-scale units. Preliminary results of activity (1) and (2) have already been presented elsewherel-4.
In this paper information will be given on the main processes occurring in a grate furnace, main results of the experimental research program in the TNO laboratory grate furnace, the main results of the mathematical modeling work and the MSWI simulator will be presented.
293

2. EXPERIMENTAL RESEARCH
Grate-firing is the most common technique for burning MSW. The waste is fed on the grate, and the combustion air is supplied both as underfire air and secondary air. The waste bed is transported by the movement of the grate device. During this transportation several processes will take place in the waste bed such as, drying, pyrolysis, gasification and combustion. Furthermore, the waste is heated by the radiation of the hot flue gases above the waste bed. The complexity of the waste incineration process makes it difficult to understand and to optimize the process. To get a better insight in this complexity, a laboratory grate furnace has been built to be able to carry out well-defined experiments, which turns out to be very difficult in full-scale facilities.
2.1 TNO laboratory grate furnace
In this laboratory grate furnace the waste is burned batch-wise under comparable conditions as in a moving grate furnace. By imaginary taking a vertical slice of waste bed material and following this volume part as it moves through the furnace, the combustion process can be simulated by a batchtype experiment. Time in this batch-type experiment corresponds with a position on the moving grate in a full-scale incinerator. A schematic representation of the laboratory grate furnace is given in figure 1. The facility was built at TNO in Apeldoorn (see figure 2). The TNO laboratory grate furnace has an inside diameter of 0.4 m and a total height of about 9 m. The furnace has an option to mix the waste bed by a vertical moving of parts of the grate (distributor plate). The residence time of the waste in the furnace depends on the waste composition and the process conditions but is within the range of 0.5 to 1.5 hours. Primary air is fed via the distributor plate. Above the waste bed secondary air can be supplied. The flue gas residence time in the hot furnace is more than two seconds. The grate heat load is about 0.8 MW/m
2• The laboratory grate furnace is capable of burning different
. types of waste such as MSW, RDF, pelletized RDF, waste wood, waste tires, shredder waste, plastics and so on. Furthermore, the TNO facility has an option to: (1) apply oxygen enrichment of the combustion air, (2) simulate flue gas recirculation, (3) simulate thermal DeNOxistaged combustion in the furnace. The facility is well equipped with thermocouples along the height of the furnace, online gas analysis instruments for O2, CO2, CO, CxHy, NOx. S02' HCI, NH3 and HP, and a gas chromatograph.
2.2 Combustion experiments with wood blocks
To avoid unnecessary complexities associated with the inhomogenity ofMSW, initially a 'model' fuel was chosen to reveal the basic parameters that dominate the incineration process on the grate. For this purpose wood was chosen as MSW is for a large part of cellulose nature, and the moisture content and physical dimensions of the wood can easily be influenced. In this paragraph results are presented for the burning of deal cubes of approximately 10 mm dimension. Process parameters that were varied during the experimental program are the amount of the underfire combustion air and the moisture content of the fuel. After igniting the fuel at the top of the bed the fuel gradually burns down until the grate is reached. The ignition speed, which is defined here as the speed at which the layer of igniting fuel particles moves downward through the fuel bed, is rather arbitrary determined by dividing the distance between the thermocouples by the time between which the thermocouples reach a temperature of 500 cC. The ignition speed on a mass basis is given in figure 3-a for a range of primary air flows and two different moisture contents of the fuel. The associated mean maximum temperatures in the ignition layer (without considering any burn-out effects) are presented in figure 3-b. The pronounced effect of the moisture on lowering the ignition speed can be clearly seen. The higher temperatures at a higher moisture content at low air rates are caused by the higher combustion efficiency due to the higher primary air rate to ignition speed ratio, as will be explained below. The ignition speed is effected by a complex interaction of physical and chemical processes, like heat
294

generation by pyrolysis, combustion and gasification reactions, heat consumption by warming up and drying of unignited fuel, heat transport by radiation, conduction and fluid motion between and inside the fuel particles and convective cooling by the primary air flow.
A distinction has to be made between ignition and combustion speeds. The ignition speed, resulting from the processes mentioned above, is strongly determined by the primary air flow rate, but the available oxygen in the combustion air is not necessary sufficient to achieve complete combustion. In general three reaction regimes can be distinguished depending on the primary air flow rate and ignition speed. The first regime, defined here as 'incomplete gasification', is characterized by an amount of fixed material which is left behind when the ignition front has passed. In coal research this process is observed as well and sometimes called non-equilibrium burning6• This is illustrated by figure 4 which shows the progression of the ignition front together with the position of the top of the fuel bed during the experiment. Depending on the properties of the fuel, like amount of volatiles, density, porosity, internal heat conductivity, and particle size, this material can be of unburned or of char-like nature. The available oxygen is insufficient to bum all the fixed material. Reduction reactions from CO2 and H20 will proceed if the temperature is high enough and chemical equilibrium is not yet reached. A typical example of this regime, which is observed at very low air flow rates, is given in figures 5-a. The temperature profiles show a distinct maximum directly after ignition. Figure 5-b shows the gas concentrations in a fixed point in the fuel bed when the ignition front passes the sample probe. When the ignition front reaches the grate, the remaining material will burn directly at the bottom, reSUlting in very high local temperatures. The main combustion product seems to be CO while gasification reactions of CO2 towards CO might occur as well. This burn-out of char-like material can be seen in the temperature curves by the peak at the end of the experiment and by the high CO concentrations approximately 15 min. after the ignition front has passed the gas sampling probe.
The second regime can be observed at slightly higher primary air flow rates. We will define this regime as 'complete gasification'. In this regime the ratio of the air flow rate to the ignition speed is high enough to convert all the ignited fixed material, but there is not enough oxygen available for complete combustion of unburned gases. In coal literature, it is said that the combustion is limited by ignition6• Typical temperatures and gas concentration profiles are given in figures 6-a,b. The temperatures show no distinct maximum and are much higher than at lower air rates. Gas concentrations are characterized by high amounts of unburned gases, but there is no fixed material left. Noxious gases are reduced to a great extend.
Finally, at very high air rates the third regime denoted by 'complete combustion' can be achieved. After reaching some maximum, which could not be measured because of the resulting very high temperatures, the balance between convective cooling and conductive warming up of the fuel is resulting in lower ignition speeds as can be seen in figure 3-a. Typical examples of the reSUlting temperature curves and gas concentration profiles are given in figures 7-a,b. The available oxygen is enough for complete combustion of unburned gases. Noxious emissions are higher than in the other regimes. At the high gas velocities the process is strongly fluctuating.
2.3 Combustion experiments with MSW
Another series of experiments have been carried out with MSW. The aim of these experiments is to optimize the process conditions for various MSW compositions with respect to the burn-out and the noxious emissions. In this paragraph only one MSW combustion experiment can be presented: combustion of pelletized RDF with an air velocity of 0.05 mls. This experiment took place in the so called incomplete gasification regime (see the previous chapter), where the speed of the ignition front in the waste layer is faster than the speed of the downcoming surface area. I.e. above the ignition front a layer of (partly) unburned pellets remains. Figure 8-a shows the main results of the experiments. It can be calculated that the speed of the ignition front is about 0.67 cmlmin (0.067 kg/m2.s). After
295

about 90 minutes the ignition front reaches the grate, and the gasification of the remaining partly unburned pellets continues. After 100 minutes the pellets are completely gasified and the burn-out of the char continues for another 20 minutes. Figures 8-b, c and d show the gas compositions measured at a height of 300 mm above the grate. As can be seen from the figures the ignition front passes the sample point after 50 minutes. The 02-concentration decreases sharply to zero and the CO2 and COconcentrations increase to 16 and 11 vol-%, respectively. The Hp-concentration looks very much the same as the CO2-concentration except at ( 1 ) the moment when the ignition front passes where the drying starts earlier than the gasification, and at (2) the end when only the char burn-out takes place (no more moisture and hydrogen left in the fuel). As far as NO is concerned it can be seen that a sharp peak arises when the ignition front passes the sample point. At a later point of time the NO is reduced by the remaining char (in the partly unburned pellets). The fuel-N is then converted to NH3. The HCI- and S02-concentrations remains almost constant on a level of 800 and 400 mg/Nm3, respectively.
3. MATHEMATICAL MODELING
Mathematical models can be an important tool for process optimization. In this paragraph the mathematical modeling work that has been carried out by TNO in the field of waste incineration on a grate will be described. The TNO MSWI model is based on first principles. Results from the experiments in the laboratory grate furnace are used to support the mathematical modeling work
A main part of the mathematical modeling work is the development of a dynamic model to describe the dynamic behavior of the incinerator. This dynamic model is used to evaluate and optimize present control concepts, and to test the effect of the use of new (advanced) sensors such as pyrodetectors, infrared cameras, moisture measurement devices, etc. Furthermore, with the help of the model new control concepts can be designed. Besides the control concept of the incinerator, the operator still plays an important role in a modern MSW incinerator plant. Unexpected and new situations still have to be handled by well-trained operators. For this purpose, the dynamic model is used to develop a training simulator and an operator advice system for a municipal solid waste incinerator. In this paragraph, firstly, the underlying physics of the dynamic models will be discussed in detai1. Secondly, some results of the dynamic model will be discussed.
3.1 The underlying physics of the dynamic model
The most important part of a dynamic model are the underlying physics, reSUlting in a mathematical mode1. Figure 9 gives a schematic representation of an MSW incinerator. The heterogeneous waste enters from the left and is transported by the grate through the combustion chamber to the right. The primary air is distributed along the grate. Several processes take place in the waste layer such as: . evaporation of moisture, devolatilizationlpyrolysis of the dried waste, combustion of gaseous volatiles, char (solid carbon) production and combustion. The inert and unburned char leave the incinerator at the right as bottom ash. The gases that are released from the waste layer flow into the gas phase of the furnace. Here, secondary air is injected and complete combustion may take place. It is important to notice that the gas phase (furnace) is in interaction with the waste layer by radiation from the flames to the surface of the waste layer. This interaction makes the process control and thus the dynamic model rather complex. The next two paragraphs will describe the model for both the waste layer and the gas phase into more detai1.
3.2 Waste layer model
In the waste layer model, the waste is supposed to consist of moisture, inert and combustibles (cellulose). The model describes the following processes in the waste layer: evaporation, pyrolysis of the cellulose, char production, and the combustion of both char and gases. Evaporation and pyrolysis are treated paralle1. The serial treatment of the char combustion, in relation to the other processes, is
296

supported by the fact that the pyrolysis, drying and equilibrium reactions are fast compared to the char combustion. The char combustion is described by using single particle models7• From literature it is known that the gases at the top of the waste layer are more or less in chemical equilibrium6• The waste layer has been numerically described by discretizing the grate in many slices. For each slice a mass and energy balance must be solved.
From experiments (see previous chapter) carried out in the pilot plants at the laboratories of TNO it is found that the waste conversion process can be described by a downwards propagation of a hot front through the waste layer (an 'ignition front'). It also became clear that the ignition front divides the waste layer more or less into two parts: a hot reacting part at the top and cold part with fresh waste at the bottom. The transition zone is only a few centimeters (depending on e.g. the local primary air velocity). Therefore, in the model the waste layer was vertically divided into two zones whereas the upper hot zone moves downwards with an ignition speed UfO Results from the experiments were summarized into a formula for the downwards ignition front speed Uf as a function of the waste composition and the amount of air used. The experimental results also showed channeling of the primary air in the waste layer. In other words, a part of the primary air that is supplied from under the grate passes the waste layer without taking part at any chemical reaction with the waste. The fraction primary air that does take part in the reactions is characterized by X.ir of the total primary air flow.
3.3 Gas phase model
The main processes occurring in the gas phase are gas mixing, (post-)combustion, and heat exchange by convection and radiation. Depending on the geometry of the specific incinerator the furnace is divided into three parts, a co current, a countercurrent and an ideal mixer part. The cocurrent and countercurrent parts are defined as the parts where the gas and waste flow have the same and opposite direction, respectively. The counter and cocurrent part are divided into many small ideal mixed gas reactors as indicated by figure 10. In the large ideal mixture part in the middle of the furnace, a part of the secondary air is injected, while the rest of the secondary air is injected at a higher point of the furnace. In the gas phase carbon monoxide and hydrogen combustion is taken into account. It is assumed that the carbon monoxide and the hydrogen combustion rates are primarily determined by the rate of gas mixing ('mixed is bumt'). In the co current and the counter current part use has been made of a so called 'non-ideal mixing' parameter. This means that only a part of the carbon monoxide or hydrogen is available for reaction.
Radiation, including dust, soot and gas radiation, has been described by using a simplified 'flux model'. Via radiation, the gas phase has an important influence on the processes occurring in the waste layer.
3.4 The overall model
The two models for both the waste layer and the gas phase, together with a model for the boiler, form the overall model of the MSW incinerator. The model input parameters are: the amount and composition of waste, the grate velocities, temperature and distribution of primary and secondary air and the geometry of the furnace. The model output parameters are e.g.: gaseous concentrations and temperature profiles along the grate, the temperature profile in the waste layer, the gas concentrations after the boiler section, the burn-out of the bottom ash, the steam production, etc. The overall model has also the possibility to simulate oxygen enrichment or flue gas recirculation.
The above described model can be used for stationary calculations to study the effect of changes in waste composition, process parameters, and furnace geometry. The same model can also be used for dynamic simulations. For this purpose, the overall model was implemented in a dynamic simulation language called ACSL8• It should be noted that not all parts of the model have been rewritten in a dynamic way. This can be explained by the fact that the dynamic behavior in the gas
297
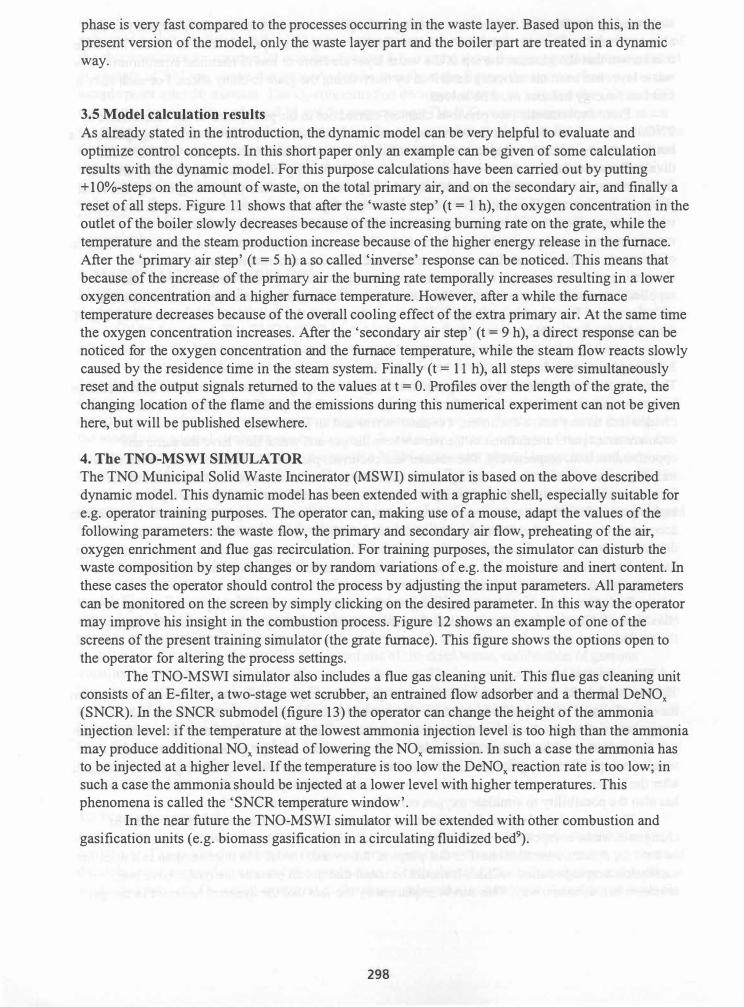
phase is very fast compared to the processes occurring in the waste layer. Based upon this, in the present version of the model, only the waste layer part and the boiler part are treated in a dynamic way.
3.5 Model calculation results
As already stated in the introduction, the dynamic model can be very helpful to evaluate and optimize control concepts. In this short paper only an example can be given of some calculation results with the dynamic model. For this purpose calculations have been carried out by putting + 1 O%-steps on the amount of waste, on the total primary air, and on the secondary air, and finally a reset of all steps. Figure 11 shows that after the 'waste step' (t = 1 h), the oxygen concentration in the outlet of the boiler slowly decreases because of the increasing burning rate on the grate, while the temperature and the steam production increase because of the higher energy release in the furnace. After the 'primary air step' (t = 5 h) a so called 'inverse' response can be noticed. This means that because of the increase of the primary air the burning rate temporally increases resulting in a lower oxygen concentration and a higher furnace temperature. However, after a while the furnace temperature decreases because of the overall cooling effect of the extra primary air. At the same time the oxygen concentration increases. After the 'secondary air step' (t = 9 h), a direct response can be noticed for the oxygen concentration and the furnace temperature, while the steam flow reacts slowly caused by the residence time in the steam system. Finally (t = 11 h), all steps were simultaneously reset and the output signals returned to the values at t = O. Profiles over the length of the grate, the changing location of the flame and the emissions during this numerical experiment can not be given here, but will be published elsewhere.
4. The TNO-MSWI SIMULATOR
The TNO Municipal Solid Waste Incinerator (MSWI) simulator is based on the above described dynamic model. This dynamic model has been extended with a graphic shell, especially suitable for e.g. operator training purposes. The operator can, making use of a mouse, adapt the values of the following parameters: the waste flow, the primary and secondary air flow, preheating of the air, oxygen enrichment and flue gas recirculation. For training purposes, the simulator can disturb the waste composition by step changes or by random variations of e.g. the moisture and inert content. In these cases the operator should control the process by adjusting the input parameters. All parameters can be monitored on the screen by simply clicking on the desired parameter. In this way the operator may improve his insight in the combustion process. Figure 12 shows an example of one of the screens of the present training simulator (the grate furnace). This figure shows the options open to the operator for altering the process settings.
The TNO-MSWI simulator also includes a flue gas cleaning unit. This flue gas cleaning unit consists of an E-filter, a two-stage wet scrubber, an entrained flow adsorber and a thermal DeNOx (SNCR). In the SNCR submodel (figure 13) the operator can change the height of the ammonia injection level: if the temperature at the lowest ammonia injection level is too high than the ammonia may produce additional NOx instead of lowering the NOx emission. In such a case the ammonia has to be injected at a higher level. If the temperature is too low the DeNOx reaction rate is too low; in such a case the ammonia should be injected at a lower level with higher temperatures. This phenomena is called the 'SNCR temperature window'.
In the near future the TNO-MSWI simulator will be extended with other combustion and gasification units (e.g. biomass gasification in a circulating fluidized bed9).
298

5. CONCLUSION
Experiments have been perfonned in a laboratory grate furnace with wood and MSW as a fuel. The experimental results have given more insight in the combustion processes occurring in a grate furnace. These insights have been used to built an overall dynamic model of a complete MSW incineration plant. This overall model can be used for ( 1 ) optimization of the process control of such a plant, and (2) for operator training.
6. REFERENCES
[1] Brem G., Gort R. and van Kessel L.B.M., Theoretical and Experimental Modeling of Municipal Solid Waste Incineration, presented at the 7th International Recycling Congress, 28-30 October 1992, Berlin, ISBN 3-924511-61-6, pp 201-213;
[2] Gort R., Wood Combustion in a Laboratory Furnace, Proc. IEA Biomass Comb. Conference, Hustad J.E., Dumbleton F., and Gmnli M., eds., Cambridge, 1994;
[3] Gort R., Valk M. and Brem G., Solid Fuel Combustion in a Laboratory Grate Furnace, Proc. 3rd Asian-Pac. Int. Symp. Comb. En. Util., Hongkong, 1995;
[4] Gort R., On the propagation of a reaction front in a packed bed (Thermal conversion of
municipal solid waste and biomass),Ph.D Thesis, Twente University of Technology, ISBN 90-9008751-6, 1 995;
[5] Rogers J.E.L., Combustion Characteristics of Simulated and Shredded Refuse, 15th Symp. Int. On Combustion, 1974, pp 1137-1148;
[6] Nichols P., Underfeed Combustion, U.S.B.M. Bulletin no.387, 1934; [7] Brem G., Mathematical Modelling of Coal Conversion Processes, ISBN 90-9003384-X, 1 990; [8] Mitchell and Gauthier. Advanced Continuous Simulation Language (ACSL), Reference Manual.
Concord USA, 1 991; [9] van Berkel A.I., A Dynamic Model of Biomass Gasification in a Circulating Fluidized Bed as a
Tool for Optimizing Design and Operation of Biomass Gasifiers, 10th European Conference and Technology Exhibition 'Biomass for Energy and Industry', 8-11 June 1 998, Wiirzburg, Gennany.
299
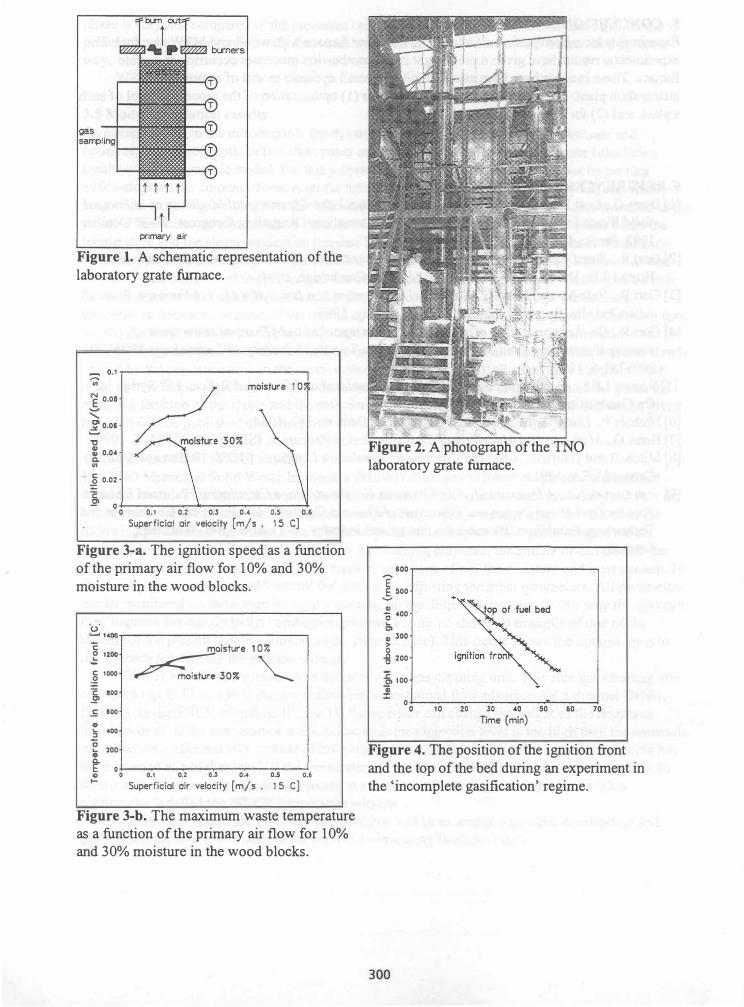
Figure 1. A schematic representation of the laboratory grate furnace.
� o.1.,...--------------, ,...
II!
E 0.08
, !. 0.06
." � 0.0' Co II!
-� 0.02
C � 0 �----�--------_4
o O. I 0.2 0.3 0.' O.S 0.6 Superficial air velocity [m/s. 15 C]
Figure 3-a. The ignition speed as a function of the primary air flow for 10% and 30% moisture in the wood blocks.
�1�r-------------. 'E o 1200 .!: t: 1000 ;g C SOO � .5 600
CD '- "o0 ::J C
I- 200 CD Co
moistur e 1 0 7-
�30% �
E O �---_-__ -__ -�-� CD 0 0.1 0.2 0.3 0.4 005 0.6
I- Superficial oir velocity [m/s. 15 C]
Figure 3-b. The maximum waste temperature as a function of the primary air flow for 10% and 30% moisture in the wood blocks.
Figure 2. A photograph of the TNO laboratory grate furnace.
600 ..---------------, E E soo ...... CD C '00 le> " 300 > o .g 200
� 100 'i :t
° 0�-�1 0�-2�0 -�3cO-�'0��S� 0��60C-�7 0· Time (min)
Figure 4. The position of the ignition front and the top of the bed during an experiment in the 'incomplete gasification' regime.
300
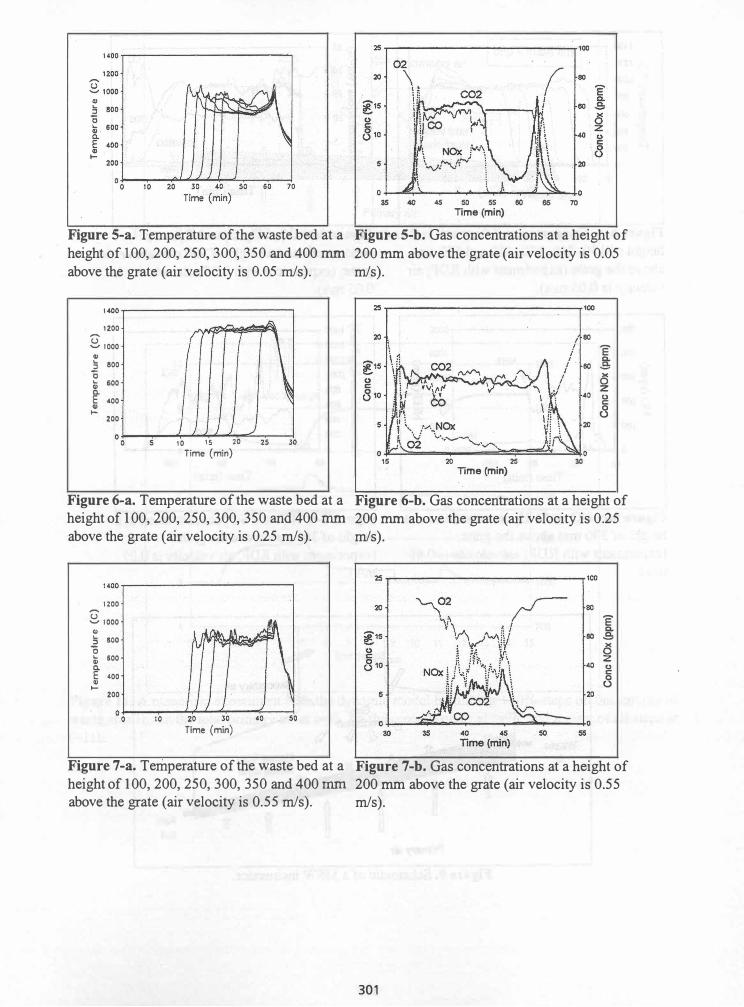
Figure 5-a. Temperature of the waste bed at a height of 100, 200, 250, 300, 350 and 400 nun above the grate (air velocity is 0.05 rnIs).
14o0 ,...------------, 1200
B 1000 Q) 5 800 o � 600 Q. E 400 Q) I- 200
10 15 20 Time (min)
Figure 6-a. Temperature of the waste bed at a height of 1 00, 200, 250, 300, 350 and 400 nun above the grate (air velocity is 0.25 rnIs).
1400 ,...-------------,
1200 B 1000
Q) 5 sao o � 600 Cl. E 400 Q)
I- 200 ° 0�----1 0--�2�0��30----4�0 -�
Time (min)
Figure 7-a. Temperature of the waste bed at a height of 100,200,250,300,350 and 400 nun above the grate (air velocity is 0.55 rnIs).
a a � � � � � � � ro Time (min)
Figure 5-b. Gas concentrations at a height of 200 mm above the grate (air velocity is 0.05 rnIs).
2S ,.--------------� 100
E a.
� oS � Z
40 0 c:
8
o ���=-�--�������o � � 2S � Time (min)
Figure 6-b. Gas concentrations at a height of 200 mm above the grate (air velocity is 0.25 rnIs).
2S ,.----------------,. 100
5
80
E a.
80 oS �
� 0 c:
8
Figure 7-b. Gas concentrations at a height of 200 mm above the grate (air velocity is 0.55 rnIs).
301

1400 .,--------------, _1200 C) -....; 1000
II)
2800 as .. 600 1 400
.. 200 O������_r-�_T __ �
o 20 40 60 80 100 120 140 Time (min)
Figure 8-a. Temperature of the waste bed at a height of 1 50, 250, 350, 450 and 550 mm above the grate (experiment with RDF; air velocity is 0.05 mls).
SOO 400
-[300 5 0200 Z 100
0
�-------------_,sooo
40 60 80 100 Time (min)
4000 3000 I -....; 2000 � 1000
Figure 8-c. NO and NH3 concentration at a height of 300 mm above the grate; (experiment with RDF; air velocity is 0.05 mls).
40 60 80 100 Timc(min)
Figure 8-b. CO, CO2, O2 and H20 concentration at a height of 300 mm above the grate; (experiment with RDF; air velocity is 0.05 mls).
40 60 80 100 Time (min)
Figure 8-d. HCl and S02 concentration at a height of 300 mm above the grate; (experiment with RDF; air velocity is 0.05 mls).
Gas-. ./.> radiation tZ {j � � Waste
in
Primary air
Figure 9. Schematic of a MSW incinerator.
302
Ash out

Waste in
...
, , , , , , , , , , , ,
_ _ --t--_
_ Seccrldmya;, I �·massflux I I I " I , . ...:j. ,::: I I I I 1'1:::
� , , , , ¢:::J : : i<:""" . I ' I I , I I I , , I I I I I I I I I I I � from' ,.!..J I I I I I '-i-I'"' "', -, -, - - - , , I I \If�\eljC!4y�r: I Ash
, Waste Jayer
Figure 10. Numerical implementation of the mass fluxes in the dynamic model.
10�--------------------------------------� 15oo
.- %02 in fue 93S 9 .:.:;;;;;1 __ --'"
_ ...... -.-._.--.... -....... -.. -.-.... -... __ ......... --................................ 1300
7 ::::::=::=�---.... -.-... :-............... : .............
1200
6 .-.--.... ---.-.---.----.-............ -.. -.... -. 1100
5 1000
4 . . . . . . . . . . . . . . . . . . . . . . . . . . . . . . . . . . . . . . . . . . . . . . . . . . . . . . . . . . . 900
o . 2 3 4 5 6 7 8 9 10 11 12 13 14 15 lime [hours]
Figure 11. A numerical experiment with the dynamic model by putting + 1 O%-steps on the amount of waste at t=lh, on the total primary air at t=5h, on the secondary air at t=9h, and a reset of all steps at t=llh.
303

furnace combustion submodel of the rno MSWI simulator. !:- �: ::
13. The thermal DeNOx submodel of the rno MSWI simulator.
Stop Quit Disturbance off
304
100 '""11"--:---:--,---:.-..., ,
$10 ' 1 I •
80 •• :.�=1��::: 10
80
NOII� 100 • , $11) -... ;;.�.��j.� .. • 20 - --·-r··-·t···1 �·�� ;-··-
. . . , ...... "'} .... _ .. : ... ...... -i ........ , ....... : : :
NOlt(m9llrl'l 150 Ir--;---:---;,--;--. 1.0 .. · .... r ...... �- ..... .. � ...... -- : ...... ..
( I • , no ........ : .. · .. ": .. "' .. -: ........ t ........ . . , 120
•••• � ••• -••• � •••• : •••• '........ r , "0 ...... .. r-.. "' .. :"' .. ... .. , ........ , .... ·· : : :