Improvement of load-following capacity of grate boilers ... · combustion power soft-sensor is...
8
This is an electronic reprint of the original article. This reprint may differ from the original in pagination and typographic detail. Powered by TCPDF (www.tcpdf.org) This material is protected by copyright and other intellectual property rights, and duplication or sale of all or part of any of the repository collections is not permitted, except that material may be duplicated by you for your research use or educational purposes in electronic or print form. You must obtain permission for any other use. Electronic or print copies may not be offered, whether for sale or otherwise to anyone who is not an authorised user. Kortela, Jukka; Jämsä-Jounela, Sirkka-Liisa Improvement of load-following capacity of grate boilers based on the combustion power soft-sensor Published in: INFUB - 11th European Conference on Industrial Furnaces and Boilers, INFUB-11 DOI: 10.1016/j.egypro.2017.07.188 Published: 01/01/2017 Document Version Publisher's PDF, also known as Version of record Please cite the original version: Kortela, J., & Jämsä-Jounela, S. L. (2017). Improvement of load-following capacity of grate boilers based on the combustion power soft-sensor. In INFUB - 11th European Conference on Industrial Furnaces and Boilers, INFUB-11 (pp. 410-416). (Energy Procedia; Vol. 120). Elsevier. https://doi.org/10.1016/j.egypro.2017.07.188
Transcript of Improvement of load-following capacity of grate boilers ... · combustion power soft-sensor is...
This is an electronic reprint of the original article.This reprint may differ from the original in pagination and typographic detail.
Powered by TCPDF (www.tcpdf.org)
This material is protected by copyright and other intellectual property rights, and duplication or sale of all or part of any of the repository collections is not permitted, except that material may be duplicated by you for your research use or educational purposes in electronic or print form. You must obtain permission for any other use. Electronic or print copies may not be offered, whether for sale or otherwise to anyone who is not an authorised user.
Kortela, Jukka; Jämsä-Jounela, Sirkka-Liisa
Improvement of load-following capacity of grate boilers based on the combustionpower soft-sensor
Published in:INFUB - 11th European Conference on Industrial Furnaces and Boilers, INFUB-11
DOI:10.1016/j.egypro.2017.07.188
Published: 01/01/2017
Document VersionPublisher's PDF, also known as Version of record
Please cite the original version:Kortela, J., & Jämsä-Jounela, S. L. (2017). Improvement of load-following capacity of grate boilers based on thecombustion power soft-sensor. In INFUB - 11th European Conference on Industrial Furnaces and Boilers,INFUB-11 (pp. 410-416). (Energy Procedia; Vol. 120). Elsevier. https://doi.org/10.1016/j.egypro.2017.07.188
ScienceDirect
Available online at www.sciencedirect.comAvailable online at www.sciencedirect.com
ScienceDirectEnergy Procedia 00 (2017) 000–000
www.elsevier.com/locate/procedia
1876-6102 © 2017 The Authors. Published by Elsevier Ltd.Peer-review under responsibility of the Scientific Committee of The 15th International Symposium on District Heating and Cooling.
The 15th International Symposium on District Heating and Cooling
Assessing the feasibility of using the heat demand-outdoor temperature function for a long-term district heat demand forecast
I. Andrića,b,c*, A. Pinaa, P. Ferrãoa, J. Fournierb., B. Lacarrièrec, O. Le Correc
aIN+ Center for Innovation, Technology and Policy Research - Instituto Superior Técnico, Av. Rovisco Pais 1, 1049-001 Lisbon, PortugalbVeolia Recherche & Innovation, 291 Avenue Dreyfous Daniel, 78520 Limay, France
cDépartement Systèmes Énergétiques et Environnement - IMT Atlantique, 4 rue Alfred Kastler, 44300 Nantes, France
Abstract
District heating networks are commonly addressed in the literature as one of the most effective solutions for decreasing the greenhouse gas emissions from the building sector. These systems require high investments which are returned through the heatsales. Due to the changed climate conditions and building renovation policies, heat demand in the future could decrease, prolonging the investment return period. The main scope of this paper is to assess the feasibility of using the heat demand – outdoor temperature function for heat demand forecast. The district of Alvalade, located in Lisbon (Portugal), was used as a case study. The district is consisted of 665 buildings that vary in both construction period and typology. Three weather scenarios (low, medium, high) and three district renovation scenarios were developed (shallow, intermediate, deep). To estimate the error, obtained heat demand values were compared with results from a dynamic heat demand model, previously developed and validated by the authors.The results showed that when only weather change is considered, the margin of error could be acceptable for some applications(the error in annual demand was lower than 20% for all weather scenarios considered). However, after introducing renovation scenarios, the error value increased up to 59.5% (depending on the weather and renovation scenarios combination considered). The value of slope coefficient increased on average within the range of 3.8% up to 8% per decade, that corresponds to the decrease in the number of heating hours of 22-139h during the heating season (depending on the combination of weather and renovation scenarios considered). On the other hand, function intercept increased for 7.8-12.7% per decade (depending on the coupled scenarios). The values suggested could be used to modify the function parameters for the scenarios considered, and improve the accuracy of heat demand estimations.
© 2017 The Authors. Published by Elsevier Ltd.Peer-review under responsibility of the Scientific Committee of The 15th International Symposium on District Heating and Cooling.
Keywords: Heat demand; Forecast; Climate change
Energy Procedia 120 (2017) 410–416
1876-6102 © 2017 The Authors. Published by Elsevier Ltd.Peer-review under responsibility of the organizing committee of INFUB-1110.1016/j.egypro.2017.07.188
10.1016/j.egypro.2017.07.188
© 2017 The Authors. Published by Elsevier Ltd.Peer-review under responsibility of the organizing committee of INFUB-11
1876-6102
Available online at www.sciencedirect.com
ScienceDirectEnergy Procedia 00 (2017) 000–000
www.elsevier.com/locate/procedia
1876-6102© 2017 The Authors. Published by Elsevier Ltd. Peer-review under responsibility ofthe organizing committee of INFUB-11.
INFUB - 11th European Conference on Industrial Furnaces and Boilers, INFUB-11
Improvement of load-following capacity of grate boilers based on the combustion power soft-sensor
Jukka Kortela*, Sirkka-Liisa Jämsä-Jounela Aalto University School of Chemical Engineering, PL 16100, FI-00076 Aalto, Finland
Abstract
For improving the load-following capacity of existing grate boiler units, a model predictive control concept based on the combustion power soft-sensor is developed. Because the combustion power estimation has a very quick response to the primary air flow input, the load-following speed of the boiler control system will be improved considerably. The proposed model predictive control strategy is tested with the BioPower 5 combined heat and power plant data and the results are presented, analyzed, and discussed. © 2017 The Authors. Published by Elsevier Ltd. Peer-review under responsibility ofthe organizing committee of INFUB-11.
Keywords:combustion; power; soft-sensor; grate; load; capacity
1. Main text
Renewable energy sources are considered on the priority level of energy policies in Europe and many other contries worldwide. The European commission has endorsed a mandatory target of a 20 % share of energy from renewable sources in overall consumption by 2020. This leads to an introduction of an increasing share of energy produced from natural resources, such as hydro power, wind, solar, wave, geothermal, waste fuels, as well as biomass and waste heat, into the existing energy networks. With more and more wind power and solar power units integration on power systems, there has been an increased demand on the load-following capabilities of the other power units.
* Corresponding author. Tel.: +358-9-4702-3846.
E-mail address:[email protected]
2 Author name / Energy Procedia00 (2017) 000–000
In [1], Wang et al. proposed an improved coordinated control strategy (CCS) combined with cold flow adjustment on account that cold source parameter has rapid and large influence on the turbine power output. The control strategy utilizes cold source flow adjustment (CSFA) to accelerate the load following capability, coal feeder rate to ensure the control accuracy of turbine load, and the turbine governor valve to avoid large fluctuation of main steam pressure. The simulation studies on the 300 MW unit showed that after 10 MW step order of turbine power is given, the turbine power with improved strategy reached its equilibrium state after about 7 seconds. However, it took over 50 seconds when using the traditional CSS. In addition, the improved strategy had a much smaller overshoot than traditional CSS.
Mortensen et al. [2] developed a control concept based on a scheduled linear-quadratic-Gaussian (LQG) controller with coordinated feedforward from the boiler load demand to fuel flow and feedwater flow for the purpose of improving the load-following capability of existing power-plant units. Field tests on the 265 MW coal-fired power plant unit revealed that the maximum allowable load gradient can be increased from 4 to 8 MW/min without further plant stress.
Wang et al. [3] developed a new method for the boiler control system based on radiation intensity for improving the load-following capacity of a coal-fired power plant. Field tests on a 300 MW coal-fired plant revealed that the improved boiler control system increased the load-following capacity. Also, indirect methods have been used to measure radiation intensity or combustion power in the furnace. According to the theoretical studies and practical tests by Kortela and Lautala [4] at the coal power plant, the fuel combustion power can be estimated on the basis of the measured oxygen consumption. The method assumed a constant fuel moisture content, although the relative ration of oxygen in flue gas is affected by the variation of the fuel moisture content, which introduces the error to the estimation.
Recently, the above mentioned combustion power method was improved by Kortela and Jämsä-Jounela [5] who estimated the fuel moisture content from the dynamic energy balance of the secondary superheater involving the combustion power estimation. Because the combustion power estimation has a very quick response of less than 1.5 minutes to the primary air flow input, the load-following speed of the boiler control system will be improved considerably.
In this paper an improvement of load-following capacity of BioPower 5 combined heat and power (CHP) plant plant is presented. The paper is organized as follows: Section 2 presents the BioPower 5 CHP process. The developed model predictive control (MPC) strategy is presented in Section 3. The test results are given in Section 4, followed by the conclusions in Section 5.
2. Description of the BioPower 5 CHP process
The BioPower 5 CHP process consists of two main parts: the furnace and the steam-water circuit. The heat used for steam generation is obtained by burning solid biomass fuel – consisting of bark, sawdust, and pellets – which is fed into the furnace together with combustion air. The heat of the flue gas is transferred by the heat exchangers to the steam-water circulation, where superheated steam is generated [6].
In the BioGrate system, the fuel is fed onto the center of a grate from below through a stoker screw, as shown in Fig. 1. The grate consists of alternate rotating and stationary concentric rings with the rotating rings alternately rotated clockwise and counter-clockwise by hydraulics. This design distributes the fuel evenly over the entire grate, with the burning fuel forming an even layer of the required thickness.

Jukka Kortela et al. / Energy Procedia 120 (2017) 410–416 411
Available online at www.sciencedirect.com
ScienceDirectEnergy Procedia 00 (2017) 000–000
www.elsevier.com/locate/procedia
1876-6102© 2017 The Authors. Published by Elsevier Ltd. Peer-review under responsibility ofthe organizing committee of INFUB-11.
INFUB - 11th European Conference on Industrial Furnaces and Boilers, INFUB-11
Improvement of load-following capacity of grate boilers based on the combustion power soft-sensor
Jukka Kortela*, Sirkka-Liisa Jämsä-Jounela Aalto University School of Chemical Engineering, PL 16100, FI-00076 Aalto, Finland
Abstract
For improving the load-following capacity of existing grate boiler units, a model predictive control concept based on the combustion power soft-sensor is developed. Because the combustion power estimation has a very quick response to the primary air flow input, the load-following speed of the boiler control system will be improved considerably. The proposed model predictive control strategy is tested with the BioPower 5 combined heat and power plant data and the results are presented, analyzed, and discussed. © 2017 The Authors. Published by Elsevier Ltd. Peer-review under responsibility ofthe organizing committee of INFUB-11.
Keywords:combustion; power; soft-sensor; grate; load; capacity
1. Main text
Renewable energy sources are considered on the priority level of energy policies in Europe and many other contries worldwide. The European commission has endorsed a mandatory target of a 20 % share of energy from renewable sources in overall consumption by 2020. This leads to an introduction of an increasing share of energy produced from natural resources, such as hydro power, wind, solar, wave, geothermal, waste fuels, as well as biomass and waste heat, into the existing energy networks. With more and more wind power and solar power units integration on power systems, there has been an increased demand on the load-following capabilities of the other power units.
* Corresponding author. Tel.: +358-9-4702-3846.
E-mail address:[email protected]
2 Author name / Energy Procedia00 (2017) 000–000
In [1], Wang et al. proposed an improved coordinated control strategy (CCS) combined with cold flow adjustment on account that cold source parameter has rapid and large influence on the turbine power output. The control strategy utilizes cold source flow adjustment (CSFA) to accelerate the load following capability, coal feeder rate to ensure the control accuracy of turbine load, and the turbine governor valve to avoid large fluctuation of main steam pressure. The simulation studies on the 300 MW unit showed that after 10 MW step order of turbine power is given, the turbine power with improved strategy reached its equilibrium state after about 7 seconds. However, it took over 50 seconds when using the traditional CSS. In addition, the improved strategy had a much smaller overshoot than traditional CSS.
Mortensen et al. [2] developed a control concept based on a scheduled linear-quadratic-Gaussian (LQG) controller with coordinated feedforward from the boiler load demand to fuel flow and feedwater flow for the purpose of improving the load-following capability of existing power-plant units. Field tests on the 265 MW coal-fired power plant unit revealed that the maximum allowable load gradient can be increased from 4 to 8 MW/min without further plant stress.
Wang et al. [3] developed a new method for the boiler control system based on radiation intensity for improving the load-following capacity of a coal-fired power plant. Field tests on a 300 MW coal-fired plant revealed that the improved boiler control system increased the load-following capacity. Also, indirect methods have been used to measure radiation intensity or combustion power in the furnace. According to the theoretical studies and practical tests by Kortela and Lautala [4] at the coal power plant, the fuel combustion power can be estimated on the basis of the measured oxygen consumption. The method assumed a constant fuel moisture content, although the relative ration of oxygen in flue gas is affected by the variation of the fuel moisture content, which introduces the error to the estimation.
Recently, the above mentioned combustion power method was improved by Kortela and Jämsä-Jounela [5] who estimated the fuel moisture content from the dynamic energy balance of the secondary superheater involving the combustion power estimation. Because the combustion power estimation has a very quick response of less than 1.5 minutes to the primary air flow input, the load-following speed of the boiler control system will be improved considerably.
In this paper an improvement of load-following capacity of BioPower 5 combined heat and power (CHP) plant plant is presented. The paper is organized as follows: Section 2 presents the BioPower 5 CHP process. The developed model predictive control (MPC) strategy is presented in Section 3. The test results are given in Section 4, followed by the conclusions in Section 5.
2. Description of the BioPower 5 CHP process
The BioPower 5 CHP process consists of two main parts: the furnace and the steam-water circuit. The heat used for steam generation is obtained by burning solid biomass fuel – consisting of bark, sawdust, and pellets – which is fed into the furnace together with combustion air. The heat of the flue gas is transferred by the heat exchangers to the steam-water circulation, where superheated steam is generated [6].
In the BioGrate system, the fuel is fed onto the center of a grate from below through a stoker screw, as shown in Fig. 1. The grate consists of alternate rotating and stationary concentric rings with the rotating rings alternately rotated clockwise and counter-clockwise by hydraulics. This design distributes the fuel evenly over the entire grate, with the burning fuel forming an even layer of the required thickness.
412 Jukka Kortela et al. / Energy Procedia 120 (2017) 410–416 Author name / Energy Procedia00 (2017) 000–000 3
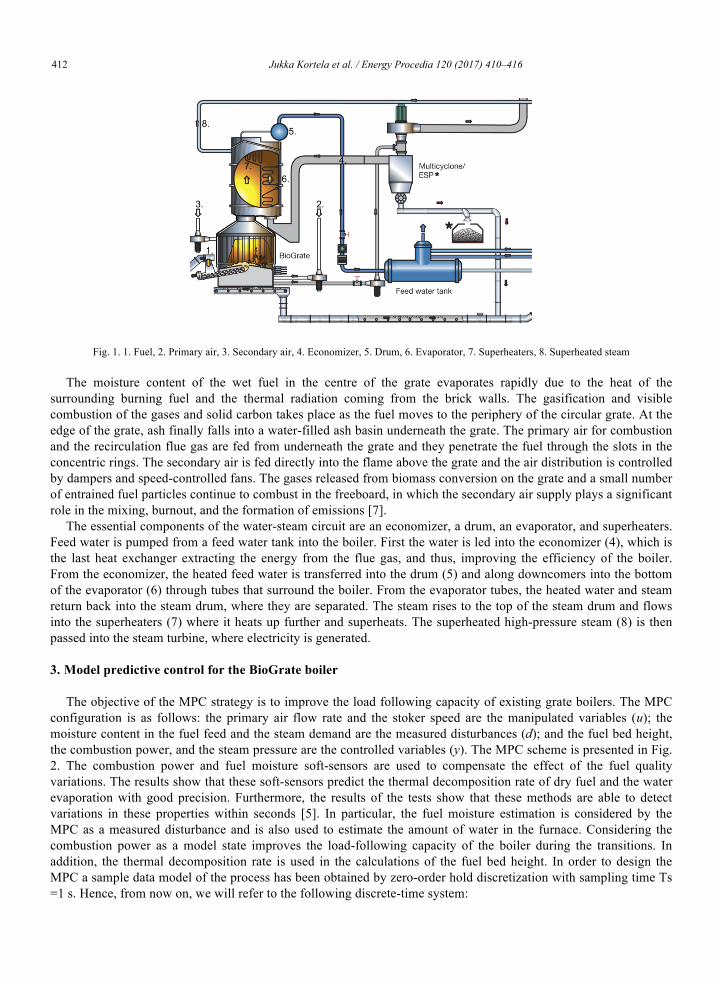
Fig. 1. 1. Fuel, 2. Primary air, 3. Secondary air, 4. Economizer, 5. Drum, 6. Evaporator, 7. Superheaters, 8. Superheated steam
The moisture content of the wet fuel in the centre of the grate evaporates rapidly due to the heat of the surrounding burning fuel and the thermal radiation coming from the brick walls. The gasification and visible combustion of the gases and solid carbon takes place as the fuel moves to the periphery of the circular grate. At the edge of the grate, ash finally falls into a water-filled ash basin underneath the grate. The primary air for combustion and the recirculation flue gas are fed from underneath the grate and they penetrate the fuel through the slots in the concentric rings. The secondary air is fed directly into the flame above the grate and the air distribution is controlled by dampers and speed-controlled fans. The gases released from biomass conversion on the grate and a small number of entrained fuel particles continue to combust in the freeboard, in which the secondary air supply plays a significant role in the mixing, burnout, and the formation of emissions [7].
The essential components of the water-steam circuit are an economizer, a drum, an evaporator, and superheaters. Feed water is pumped from a feed water tank into the boiler. First the water is led into the economizer (4), which is the last heat exchanger extracting the energy from the flue gas, and thus, improving the efficiency of the boiler. From the economizer, the heated feed water is transferred into the drum (5) and along downcomers into the bottom of the evaporator (6) through tubes that surround the boiler. From the evaporator tubes, the heated water and steam return back into the steam drum, where they are separated. The steam rises to the top of the steam drum and flows into the superheaters (7) where it heats up further and superheats. The superheated high-pressure steam (8) is then passed into the steam turbine, where electricity is generated.
3. Model predictive control for the BioGrate boiler
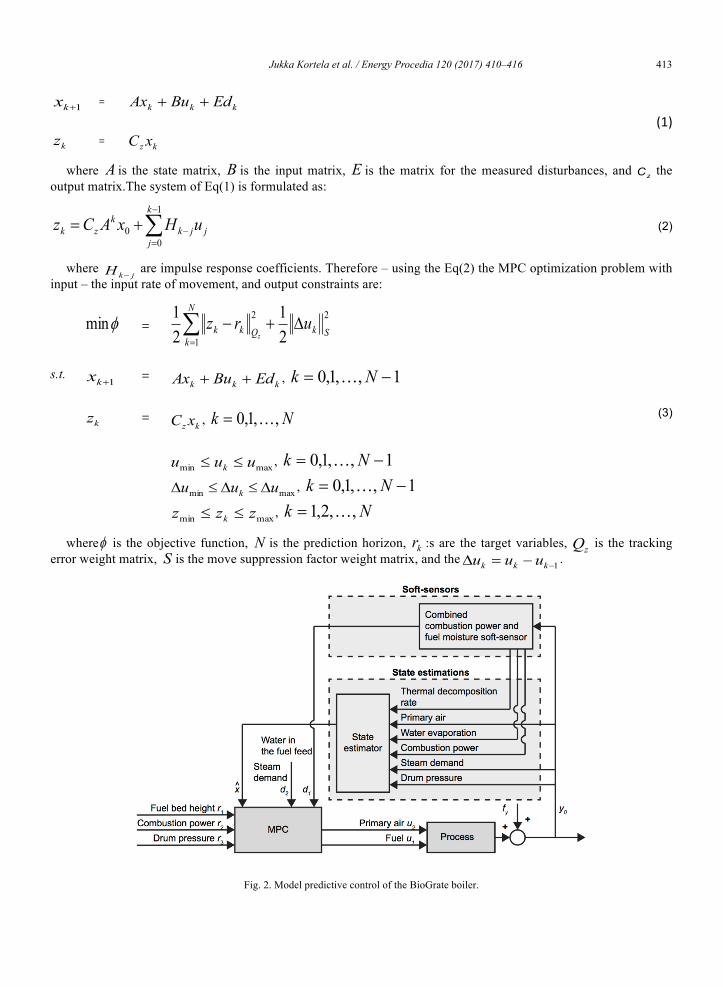
The objective of the MPC strategy is to improve the load following capacity of existing grate boilers. The MPC configuration is as follows: the primary air flow rate and the stoker speed are the manipulated variables (u); the moisture content in the fuel feed and the steam demand are the measured disturbances (d); and the fuel bed height, the combustion power, and the steam pressure are the controlled variables (y). The MPC scheme is presented in Fig. 2. The combustion power and fuel moisture soft-sensors are used to compensate the effect of the fuel quality variations. The results show that these soft-sensors predict the thermal decomposition rate of dry fuel and the water evaporation with good precision. Furthermore, the results of the tests show that these methods are able to detect variations in these properties within seconds [5]. In particular, the fuel moisture estimation is considered by the MPC as a measured disturbance and is also used to estimate the amount of water in the furnace. Considering the combustion power as a model state improves the load-following capacity of the boiler during the transitions. In addition, the thermal decomposition rate is used in the calculations of the fuel bed height. In order to design the MPC a sample data model of the process has been obtained by zero-order hold discretization with sampling time Ts =1 s. Hence, from now on, we will refer to the following discrete-time system:
4 Author name / Energy Procedia00 (2017) 000–000
1+kx = kkk EdBuAx ++ (1)
kz = kz xC
where A is the state matrix, B is the input matrix, E is the matrix for the measured disturbances, and zC the output matrix.The system of Eq(1) is formulated as:
å-
=-+=
1
00
k
jjjk
kzk uHxACz (2)
where jkH - are impulse response coefficients. Therefore – using the Eq(2) the MPC optimization problem with
input – the input rate of movement, and output constraints are:
fmin = å=
D+-N
kSkQkk urz
z1
22
21
21
(3)
s.t. 1+kx =
kkk EdBuAx ++ , 1,,1,0 -= Nk !
kz =
kz xC , Nk ,,1,0 !=
maxmin uuu k ££ , 1,,1,0 -= Nk !
maxmin uuu k D£D£D , 1,,1,0 -= Nk !
maxmin zzz k ££ , Nk ,,2,1 !=
wheref is the objective function, N is the prediction horizon, kr :s are the target variables, zQ is the tracking error weight matrix, S is the move suppression factor weight matrix, and the 1--=D kkk uuu .
Fig. 2. Model predictive control of the BioGrate boiler.
Jukka Kortela et al. / Energy Procedia 120 (2017) 410–416 413 Author name / Energy Procedia00 (2017) 000–000 3
Fig. 1. 1. Fuel, 2. Primary air, 3. Secondary air, 4. Economizer, 5. Drum, 6. Evaporator, 7. Superheaters, 8. Superheated steam
The moisture content of the wet fuel in the centre of the grate evaporates rapidly due to the heat of the surrounding burning fuel and the thermal radiation coming from the brick walls. The gasification and visible combustion of the gases and solid carbon takes place as the fuel moves to the periphery of the circular grate. At the edge of the grate, ash finally falls into a water-filled ash basin underneath the grate. The primary air for combustion and the recirculation flue gas are fed from underneath the grate and they penetrate the fuel through the slots in the concentric rings. The secondary air is fed directly into the flame above the grate and the air distribution is controlled by dampers and speed-controlled fans. The gases released from biomass conversion on the grate and a small number of entrained fuel particles continue to combust in the freeboard, in which the secondary air supply plays a significant role in the mixing, burnout, and the formation of emissions [7].
The essential components of the water-steam circuit are an economizer, a drum, an evaporator, and superheaters. Feed water is pumped from a feed water tank into the boiler. First the water is led into the economizer (4), which is the last heat exchanger extracting the energy from the flue gas, and thus, improving the efficiency of the boiler. From the economizer, the heated feed water is transferred into the drum (5) and along downcomers into the bottom of the evaporator (6) through tubes that surround the boiler. From the evaporator tubes, the heated water and steam return back into the steam drum, where they are separated. The steam rises to the top of the steam drum and flows into the superheaters (7) where it heats up further and superheats. The superheated high-pressure steam (8) is then passed into the steam turbine, where electricity is generated.
3. Model predictive control for the BioGrate boiler
The objective of the MPC strategy is to improve the load following capacity of existing grate boilers. The MPC configuration is as follows: the primary air flow rate and the stoker speed are the manipulated variables (u); the moisture content in the fuel feed and the steam demand are the measured disturbances (d); and the fuel bed height, the combustion power, and the steam pressure are the controlled variables (y). The MPC scheme is presented in Fig. 2. The combustion power and fuel moisture soft-sensors are used to compensate the effect of the fuel quality variations. The results show that these soft-sensors predict the thermal decomposition rate of dry fuel and the water evaporation with good precision. Furthermore, the results of the tests show that these methods are able to detect variations in these properties within seconds [5]. In particular, the fuel moisture estimation is considered by the MPC as a measured disturbance and is also used to estimate the amount of water in the furnace. Considering the combustion power as a model state improves the load-following capacity of the boiler during the transitions. In addition, the thermal decomposition rate is used in the calculations of the fuel bed height. In order to design the MPC a sample data model of the process has been obtained by zero-order hold discretization with sampling time Ts =1 s. Hence, from now on, we will refer to the following discrete-time system:
4 Author name / Energy Procedia00 (2017) 000–000
1+kx = kkk EdBuAx ++ (1)
kz = kz xC
where A is the state matrix, B is the input matrix, E is the matrix for the measured disturbances, and zC the output matrix.The system of Eq(1) is formulated as:
å-
=-+=
1
00
k
jjjk
kzk uHxACz (2)
where jkH - are impulse response coefficients. Therefore – using the Eq(2) the MPC optimization problem with
input – the input rate of movement, and output constraints are:
fmin = å=
D+-N
kSkQkk urz
z1
22
21
21
(3)
s.t. 1+kx =
kkk EdBuAx ++ , 1,,1,0 -= Nk !
kz =
kz xC , Nk ,,1,0 !=
maxmin uuu k ££ , 1,,1,0 -= Nk !
maxmin uuu k D£D£D , 1,,1,0 -= Nk !
maxmin zzz k ££ , Nk ,,2,1 !=
wheref is the objective function, N is the prediction horizon, kr :s are the target variables, zQ is the tracking error weight matrix, S is the move suppression factor weight matrix, and the 1--=D kkk uuu .
Fig. 2. Model predictive control of the BioGrate boiler.
414 Jukka Kortela et al. / Energy Procedia 120 (2017) 410–416 Author name / Energy Procedia00 (2017) 000–000 5
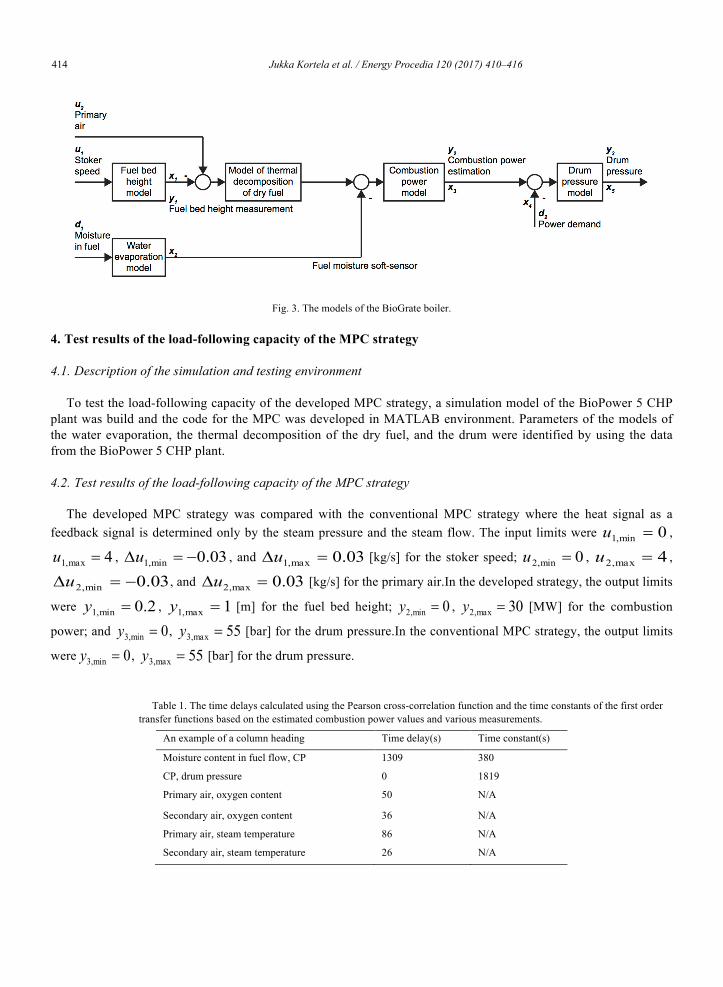
Fig. 3. The models of the BioGrate boiler.
4. Test results of the load-following capacity of the MPC strategy
4.1. Description of the simulation and testing environment
To test the load-following capacity of the developed MPC strategy, a simulation model of the BioPower 5 CHP plant was build and the code for the MPC was developed in MATLAB environment. Parameters of the models of the water evaporation, the thermal decomposition of the dry fuel, and the drum were identified by using the data from the BioPower 5 CHP plant.
4.2. Test results of the load-following capacity of the MPC strategy
The developed MPC strategy was compared with the conventional MPC strategy where the heat signal as a feedback signal is determined only by the steam pressure and the steam flow. The input limits were 0min,1 =u ,
4max,1 =u , 03.0min,1 -=Du , and 03.0max,1 =Du [kg/s] for the stoker speed; 0min,2 =u , 4max,2 =u ,
03.0min,2 -=Du , and 03.0max,2 =Du [kg/s] for the primary air.In the developed strategy, the output limits
were 2.0min,1 =y , 1max,1 =y [m] for the fuel bed height; 0min,2 =y , 30max,2 =y [MW] for the combustion
power; and 0min,3 =y , 55max,3 =y [bar] for the drum pressure.In the conventional MPC strategy, the output limits
were 0min,3 =y , 55max,3 =y [bar] for the drum pressure.
Table 1. The time delays calculated using the Pearson cross-correlation function and the time constants of the first order transfer functions based on the estimated combustion power values and various measurements.
An example of a column heading Time delay(s) Time constant(s)
Moisture content in fuel flow, CP 1309 380
CP, drum pressure 0 1819
Primary air, oxygen content 50 N/A
Secondary air, oxygen content 36 N/A
Primary air, steam temperature 86 N/A
Secondary air, steam temperature 26 N/A
6 Author name / Energy Procedia00 (2017) 000–000
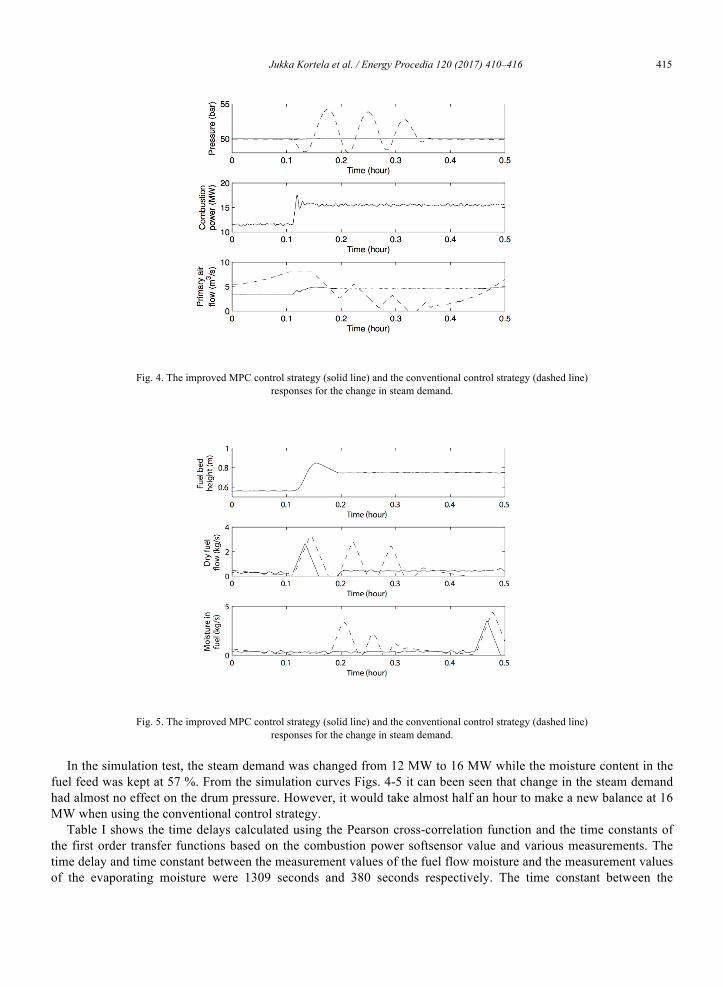
Fig. 4. The improved MPC control strategy (solid line) and the conventional control strategy (dashed line) responses for the change in steam demand.
Fig. 5. The improved MPC control strategy (solid line) and the conventional control strategy (dashed line) responses for the change in steam demand.
In the simulation test, the steam demand was changed from 12 MW to 16 MW while the moisture content in the fuel feed was kept at 57 %. From the simulation curves Figs. 4-5 it can been seen that change in the steam demand had almost no effect on the drum pressure. However, it would take almost half an hour to make a new balance at 16 MW when using the conventional control strategy.
Table I shows the time delays calculated using the Pearson cross-correlation function and the time constants of the first order transfer functions based on the combustion power softsensor value and various measurements. The time delay and time constant between the measurement values of the fuel flow moisture and the measurement values of the evaporating moisture were 1309 seconds and 380 seconds respectively. The time constant between the
Jukka Kortela et al. / Energy Procedia 120 (2017) 410–416 415 Author name / Energy Procedia00 (2017) 000–000 5
Fig. 3. The models of the BioGrate boiler.
4. Test results of the load-following capacity of the MPC strategy
4.1. Description of the simulation and testing environment
To test the load-following capacity of the developed MPC strategy, a simulation model of the BioPower 5 CHP plant was build and the code for the MPC was developed in MATLAB environment. Parameters of the models of the water evaporation, the thermal decomposition of the dry fuel, and the drum were identified by using the data from the BioPower 5 CHP plant.
4.2. Test results of the load-following capacity of the MPC strategy
The developed MPC strategy was compared with the conventional MPC strategy where the heat signal as a feedback signal is determined only by the steam pressure and the steam flow. The input limits were 0min,1 =u ,
4max,1 =u , 03.0min,1 -=Du , and 03.0max,1 =Du [kg/s] for the stoker speed; 0min,2 =u , 4max,2 =u ,
03.0min,2 -=Du , and 03.0max,2 =Du [kg/s] for the primary air.In the developed strategy, the output limits
were 2.0min,1 =y , 1max,1 =y [m] for the fuel bed height; 0min,2 =y , 30max,2 =y [MW] for the combustion
power; and 0min,3 =y , 55max,3 =y [bar] for the drum pressure.In the conventional MPC strategy, the output limits
were 0min,3 =y , 55max,3 =y [bar] for the drum pressure.
Table 1. The time delays calculated using the Pearson cross-correlation function and the time constants of the first order transfer functions based on the estimated combustion power values and various measurements.
An example of a column heading Time delay(s) Time constant(s)
Moisture content in fuel flow, CP 1309 380
CP, drum pressure 0 1819
Primary air, oxygen content 50 N/A
Secondary air, oxygen content 36 N/A
Primary air, steam temperature 86 N/A
Secondary air, steam temperature 26 N/A
6 Author name / Energy Procedia00 (2017) 000–000
Fig. 4. The improved MPC control strategy (solid line) and the conventional control strategy (dashed line) responses for the change in steam demand.
Fig. 5. The improved MPC control strategy (solid line) and the conventional control strategy (dashed line) responses for the change in steam demand.
In the simulation test, the steam demand was changed from 12 MW to 16 MW while the moisture content in the fuel feed was kept at 57 %. From the simulation curves Figs. 4-5 it can been seen that change in the steam demand had almost no effect on the drum pressure. However, it would take almost half an hour to make a new balance at 16 MW when using the conventional control strategy.
Table I shows the time delays calculated using the Pearson cross-correlation function and the time constants of the first order transfer functions based on the combustion power softsensor value and various measurements. The time delay and time constant between the measurement values of the fuel flow moisture and the measurement values of the evaporating moisture were 1309 seconds and 380 seconds respectively. The time constant between the
416 Jukka Kortela et al. / Energy Procedia 120 (2017) 410–416 Author name / Energy Procedia00 (2017) 000–000 7
estimated combustion power values and the drum pressure measurements was 1819 seconds due to the large volume of the drum. On the other hand, the time delays between the measurements that are utilized to estimate the combustion power values are less than 90 seconds. Therefore, the utilization of the combustion power soft-sensor improves the load-following capacity of the grate boiler.
5. Conclusions
For improving the load-following capacity of existing grate boiler units, an MPC control concept based on the combustion power soft-sensor was developed. Based on the simulation results, significant improvements in the control of critical process variables were obtained during load changes Because the combustion power estimation had a very quick response to the primary air flow input, the load-following speed of the boiler control system would be improved considerably. Due to the general applicability of the method, it could be used for similar processes and thus the same advantages could be achieved in other plants regardless of the fuels and burning methods used.
References
[1] Wang W, Liu J, Zeng D, Niu Y, Cui C. An improved coordinated control strategy for boiler-turbine units supplemented by cold source flow adjustment. Energy 2015;88:927-34.
[2] Mortensen JH, Moelbak T, Andersen P, Pedersen TS. Optimization of boiler control to improve the load-following capability of power-plant units. Control Engineering Practice 1998;6:1531-39.
[3] Wang F, Huang Q, Liu D, Yan J, Cen K. Improvement of Load-Following Capacity Based on the Flame Radiation Intensity Signal in a Power Plant. Energy & Fuels 2008;22:1731-38.
[4] Kortela U, Lautala P. A new control concept for a coal power plant. Control Science and Technology for the Progress of Society 1982;6:3017-23.
[5] Kortela J, Jämsä-Jounela S-L. Fuel moisture soft-sensor and its validation for the industrial BioPower 5 CHP plant. Applied Energy 2013;105:66-74.
[6] Boriouchkine A, Zakharov A, Jämsä-Jounela S-L. Dynamic modeling of combustion in a BioGrate furnace: The effect of operation parameters on biomass firing. Chemical Engineering Science 2012;69(1):669-78.
[7] Yin C, Rosendahl LA, Kær SK. Grate-firing of biomass for heat and power production. Progress in Energy and Combustion Science 2008;34(6):725-54.
[8] Kortela J, Jämsä-Jounela S-L. Modeling and model predictive control of the BioPower combined heat and power (CHP) plant. International Journal of Electrical Power & Energy Systems 2015;65:453-62.
[9] Pannocchia G, Rawlings JB. Disturbance Models for Offset-Free Model-Predictive Control AIchE Journal 2003;49 (2):426-37.


![Combustion Theory and Modelling Volume 16 Issue 2 2012 [Doi 10.1080_13647830.2011.610903] Kurz, D._ Schnell, U._ Scheffknecht, G. -- CFD Simulation of Wood Chip Combustion on a Grate](https://static.fdocuments.us/doc/165x107/5695d5551a28ab9b02a4f51f/combustion-theory-and-modelling-volume-16-issue-2-2012-doi-101080136478302011610903.jpg)