Advances in Grate Combustion Technology fouling mitigation ... ACC loss ca. 50 ......
16
Advances in Grate Combustion Technology WTERT 2012 Conference, Columbia University, October 18
Transcript of Advances in Grate Combustion Technology fouling mitigation ... ACC loss ca. 50 ......
Advances in Grate Combustion Technology
WTERT 2012 Conference, Columbia University, October 18
2 WTERT 2012, Columbia University New York, October 18th
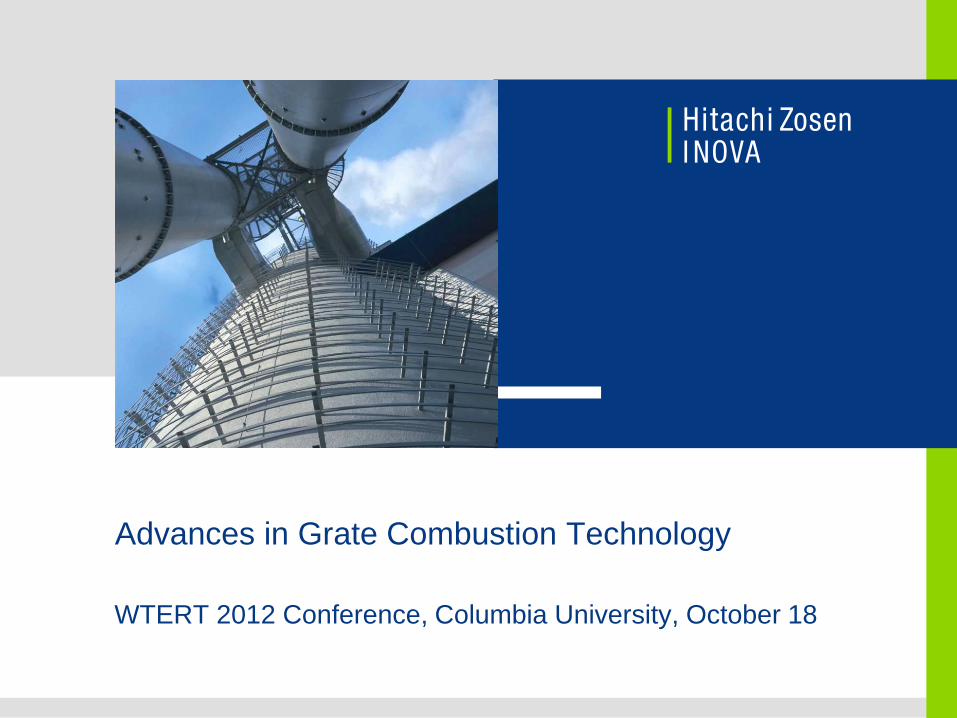
R&D Director’s Dream
New CCS • Upgrade of basic control module
• Add-on control features: Burn-out and fire end control (Riverside)
• Maximized throughput
Low Excess Air • Combustion with less combustion air
• Lower investment costs of new plants
• Improved energy efficiency
• Reduced emissions
Emissions ....
Boiler fouling mitigation • Longer campaign times for boilers
• Improved margins on new projects
• Improved guarantees; reduced guarantee costs
Inova Grate • Optimized grate construction, lower cost
• Lower maintenance costs
• Reduced building height
Additives ......
Bottom Ash Residue ....
Filter Residues ....
Dream: Show Case Project
Show the results of all ideas, development, modelling, trials and testing in a real plant
Fabric Filter ....
DyNOR®
• SNCR for low NOx emissions without catalyst
• <100 mg/m3 NOx with < 10 mg/m3 NH3 slip
3
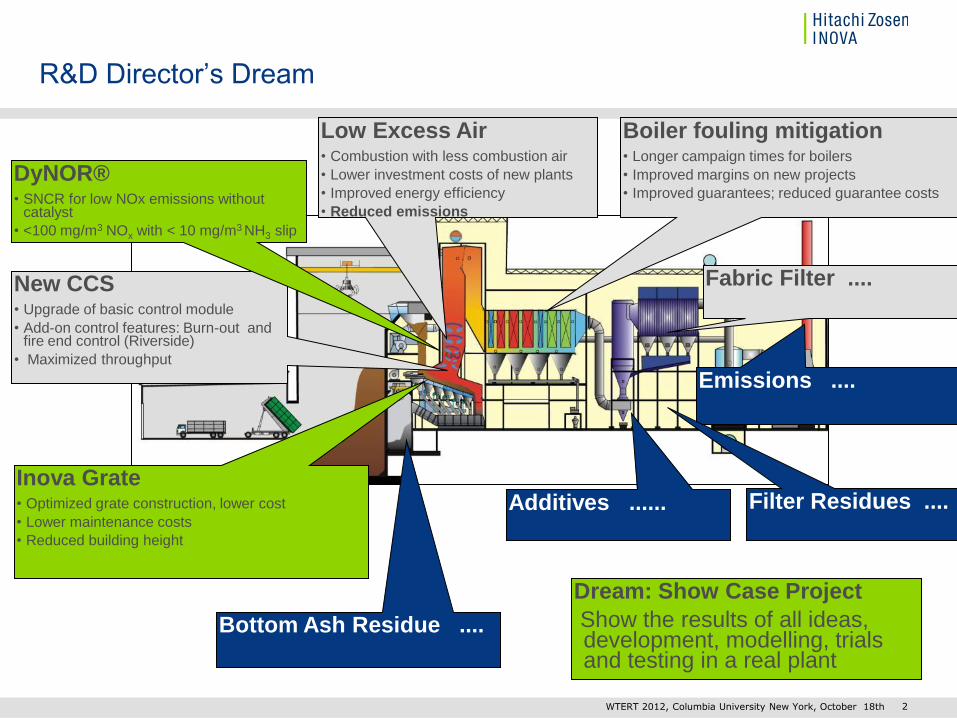
1) Inova Grate
Features of the Inova Grate
Combines all positive aspects from cumulated years of experience
In particular the Inova Grate is built to:
Accommodate a wide range of fuels various configurations air and water cooled more grate movement controls
Further reduce burnout
Reduce plant building height (compared to Von Roll grate) less inclination
Minimize investment costs lower weight, fewer parts
Reduce maintenance costs easy access
Improve plant availability less and shorter outages
WTERT 2012, Columbia University New York, October 18th
4
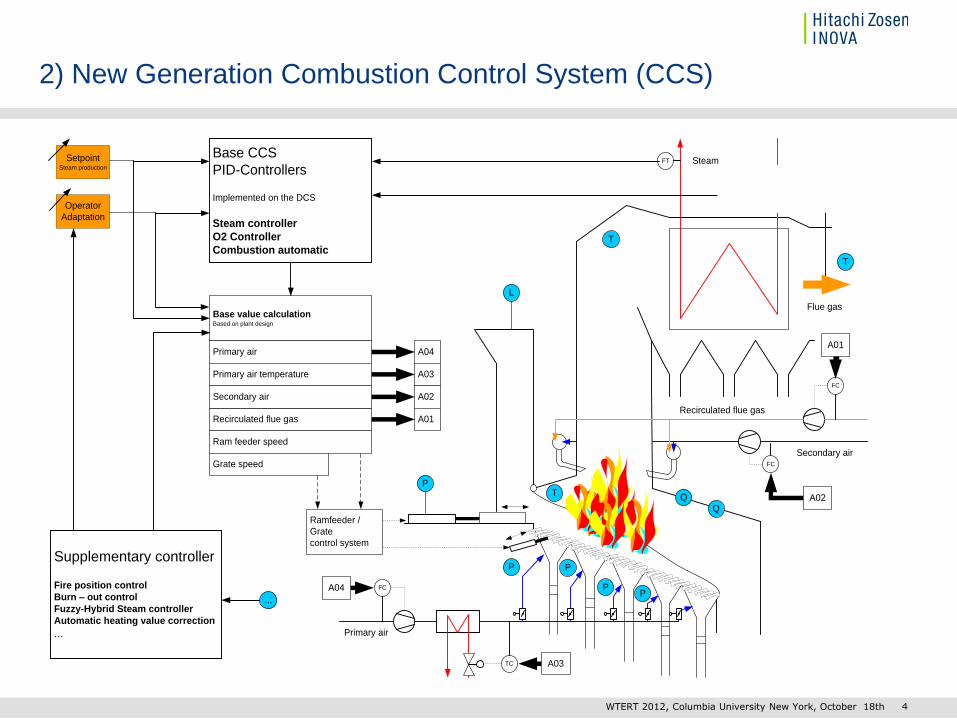
2) New Generation Combustion Control System (CCS)
FT
QT O2
Steam
FC
FC
Recirculated flue gas
Secondary air
Flue gas
Primary air
FC
Ramfeeder /
Grate
control system
A04
Base value calculationBased on plant design
Primary air
Primary air temperature
Recirculated flue gas
Secondary air
Ram feeder speed
Grate speed
A03
A02
A01
TC
Operator
Adaptation
SetpointSteam production
A04
A03
A02
A01
Base CCS
PID-Controllers
Implemented on the DCS
Steam controller
O2 Controller
Combustion automatic
P
L
PT
Q
Q
T
T
P
PP
Supplementary controller
Fire position control
Burn – out control
Fuzzy-Hybrid Steam controller
Automatic heating value correction
...
...
WTERT 2012, Columbia University New York, October 18th
5
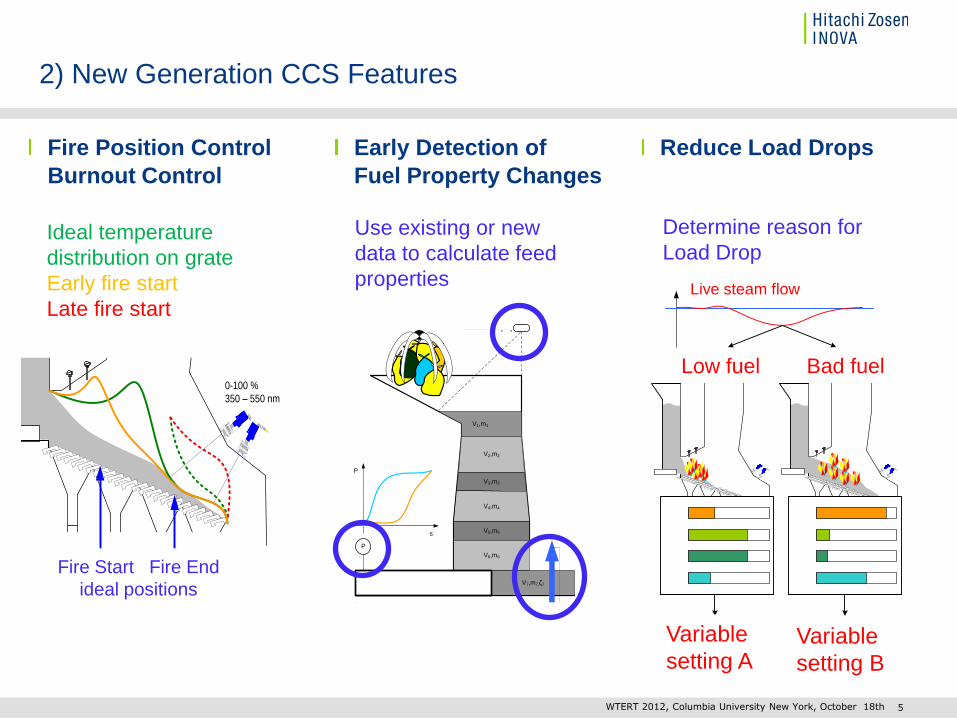
2) New Generation CCS Features
Early Detection of
Fuel Property Changes
P
V1,m1
V2,m2
V3,m3
V4,m4
V5,m5
V6,m6
V7,m7,ζ7
P
s
Müllmasse [kg]
Müllvolumen [m3]
Stösseldruck [bar]
Stösselweg [mm]
∆P
F
Druckdifferenz [mbar]
Primärluftvolumenstrom [m3/h i.N.]
Kompakte Müllfraktion
Lockere Müllfraktion
ζ =
2 ∆P A2
ρ V2
.
Use existing or new
data to calculate feed
properties
0-1400 °C
0-100 %
350 – 550 nm
Feuerstart Feuerende
Temperaturverlauf Feuerstart zu früh
Temperaturverlauf ideal
UV Strahlungsintensität zu langes Feuer
UV Strahlungsintensität ideal
Fire Start Fire End
ideal positions
Ideal temperature
distribution on grate
Early fire start
Late fire start
Fire Position Control
Burnout Control
Reduce Load Drops
Determine reason for
Load Drop
Komp.
Dichte
Temp.
Zeta
Komp.
Dichte
Temp.
Zeta
Frischdampfleistung [t/h]
A) Zu wenig Brennstoff B) Schlechter Brennstoff
Richtige Massnahme A Richtige Massnahme B
Live steam flow
Low fuel Bad fuel
Variable
setting A Variable
setting B
WTERT 2012, Columbia University New York, October 18th

6
2) New Generation CCS Benefits
Sample calculation 2 x 500 tpd - 19 days:
Steam production: 55‘842 tons
Lost steam production: 2526 tons
Extrapolated to whole year (330 days):
Lost steam production: 43‘873 tons
Lost electric production: 7239 MWh/y
Lost $ ($80/MWh): 579‘119 $/y
Typical Steam Production Trend
with conventional/basic CCS
Typical Steam Production Trend with New Generation CCS
WTERT 2012, Columbia University New York, October 18th
7
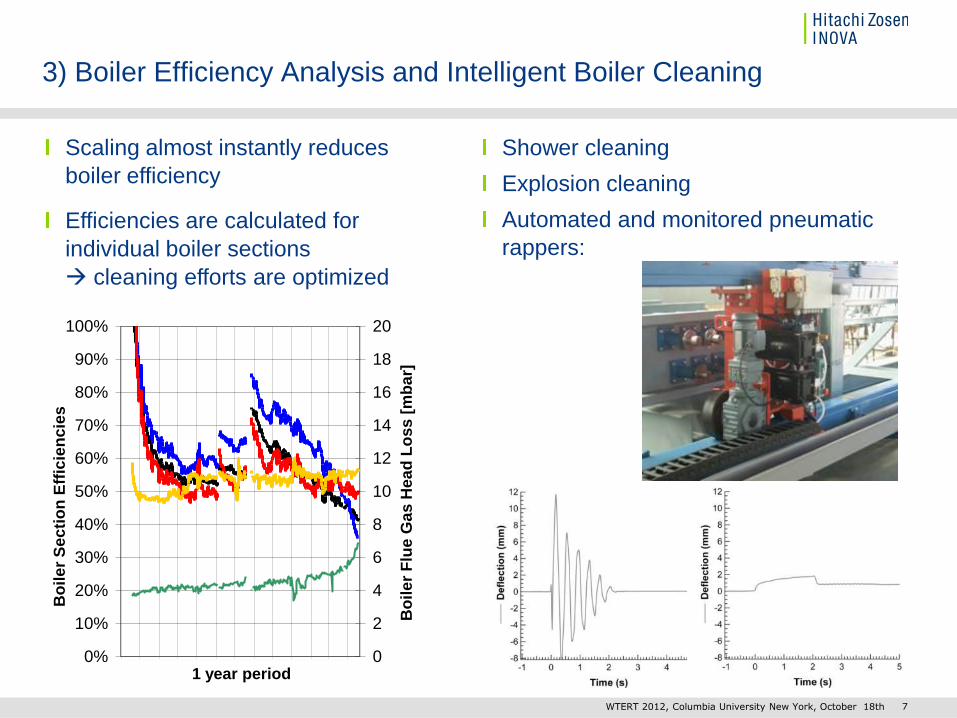
3) Boiler Efficiency Analysis and Intelligent Boiler Cleaning
Shower cleaning
Explosion cleaning
Automated and monitored pneumatic
rappers:
0%
10%
20%
30%
40%
50%
60%
70%
80%
90%
100%
1.4
.08
1.5
.08
1.6
.08
1.7
.08
1.8
.08
1.9
.08
1.1
0.0
81
.11
.08
1.1
2.0
81
.1.0
91
.2.0
91
.3.0
91
.4.0
9
Eff
izie
nz (
%)
0
2
4
6
8
10
12
14
16
18
20
Dru
ckab
fall
Rau
chg
as K
esse
l (m
bar
)
ÜH3 ÜH2 ÜH1 ECO dP RG
Bo
ile
r S
ec
tio
n E
ffic
ien
cie
s
Bo
ile
r F
lue
Ga
s H
ea
d L
oss
[m
ba
r]
Scaling almost instantly reduces
boiler efficiency
Efficiencies are calculated for
individual boiler sections
cleaning efforts are optimized
1 year period
WTERT 2012, Columbia University New York, October 18th

8
4) DyNOR® - Dynamic NOx Reduction
DyNOR®
Flow
Distributors
Injection Level
IR Pyrometers
Virtual segmentation of the boiler
Quick temperature measurement
Dynamic, precise and quick
responding reagent injection
WTERT 2012, Columbia University New York, October 18th
9
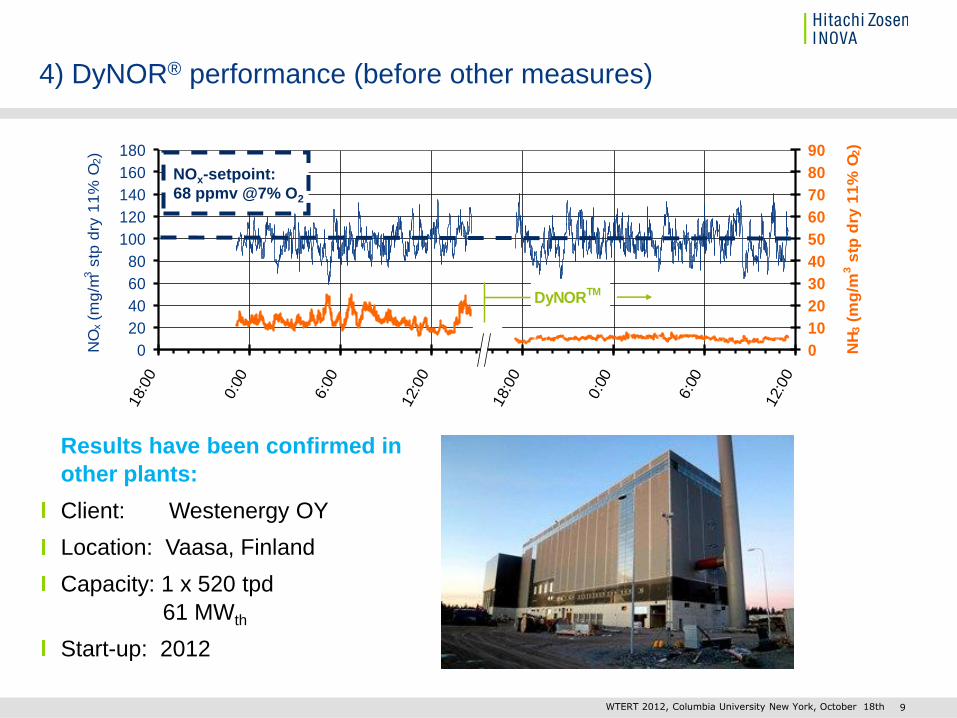
4) DyNOR® performance (before other measures)
0
20
40
60
80
100
120
140
160
180
18:
00
0:0
0
6:0
0
12:
00
18:
00
0:0
0
6:0
0
12:
00
NO
x (m
g/m
3 s
tp d
ry 1
1%
O2)
0
10
20
30
40
50
60
70
80
90
NH
3 (
mg
/m3 s
tp d
ry 1
1%
O2)
NOx-setpoint:
100mg/m3
DyNORTM
NOx-setpoint:
68 ppmv @7% O2
Results have been confirmed in
other plants:
Client: Westenergy OY
Location: Vaasa, Finland
Capacity: 1 x 520 tpd
61 MWth
Start-up: 2012
WTERT 2012, Columbia University New York, October 18th

London, UK
Thermal Input Waste
(100 %)
ACC loss
ca. 50 – 55 %
Stack loss
ca. 10 – 15 %
Slag loss
ca. 2 %Various
ca. 2 – 4 %
Net Electricity
ca. 25 %ca. 25 – 30%
10
5) Energy Efficiency Improvement: minimize losses
Sta
ck
AC
C
Slag
Stack losses are significant
Roughly 10 – 15% of energy (LHV basis)
Efficiency improvement by …
…lowering exhaust gas temperature
…lowering exhaust gas flow rate
Electricity
WTERT 2012, Columbia University New York, October 18th

11
5) Energy Efficiency: after lot of modelling
DEM Model (Discrete Elements Method)
(in cooperation with LEAT / U of Bochum)
Objective:
Numerical model of movement on grate
and thermochemical processes within
particles and gas phase
Method:
coupling of various modelling modules to
account for:
solid mechanics/ particle movement
drying/gasification/pyrolysis of
particles
heat transfer to/within particles
gas flow pattern and burn-out of gases
radiant heat transfer
Schnittstelle für
den Austausch
Interface surface for
data exchange to
the CFD model
Example:
content of volatiles
in solid particles
WTERT 2012, Columbia University New York, October 18th
12
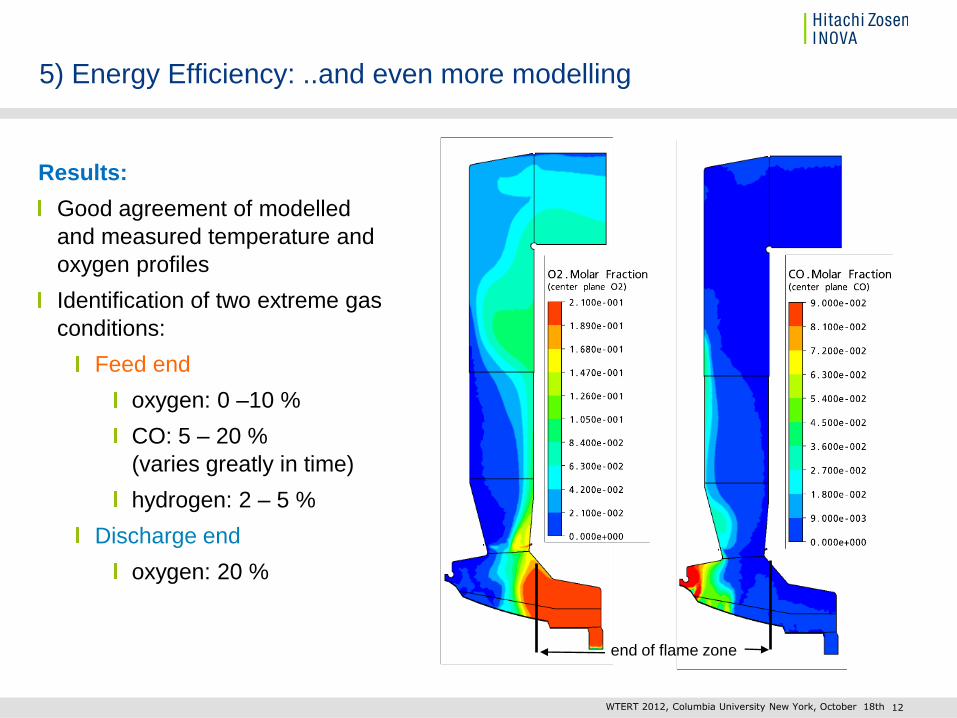
5) Energy Efficiency: ..and even more modelling
end of flame zone
Results:
Good agreement of modelled
and measured temperature and
oxygen profiles
Identification of two extreme gas
conditions:
Feed end
oxygen: 0 –10 %
CO: 5 – 20 %
(varies greatly in time)
hydrogen: 2 – 5 %
Discharge end
oxygen: 20 %
WTERT 2012, Columbia University New York, October 18th
13
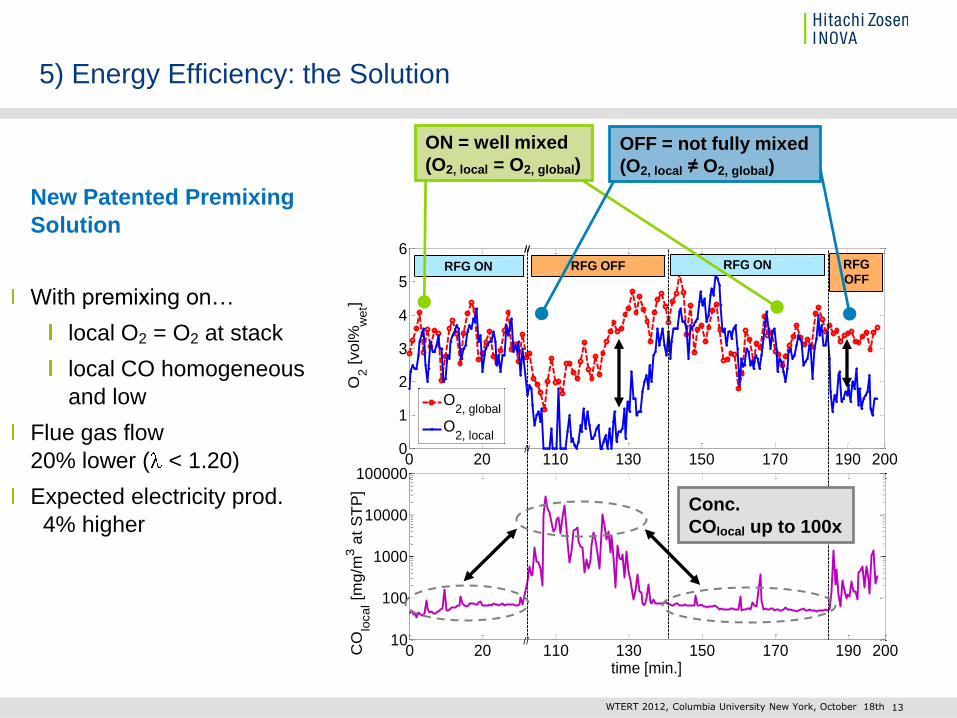
5) Energy Efficiency: the Solution
0 20 110 130 150 170 190 2000
1
2
3
4
5
6 //
//
//
O2 [
vo
l%w
et]
0 20 110 130 150 170 190 200
100
10000
100000
1000
10
//
//
time [min.]
CO
loca
l [m
g/m
3 a
t S
TP
]
O2, global
O2, local
RFG ON RFG OFF RFG ON RFGOFF
New Patented Premixing
Solution
With premixing on…
local O2 = O2 at stack
local CO homogeneous
and low
Flue gas flow
20% lower ( < 1.20)
Expected electricity prod.
4% higher
ON = well mixed
(O2, local = O2, global) OFF = not fully mixed
(O2, local ≠ O2, global)
Conc.
COlocal up to 100x
WTERT 2012, Columbia University New York, October 18th
14
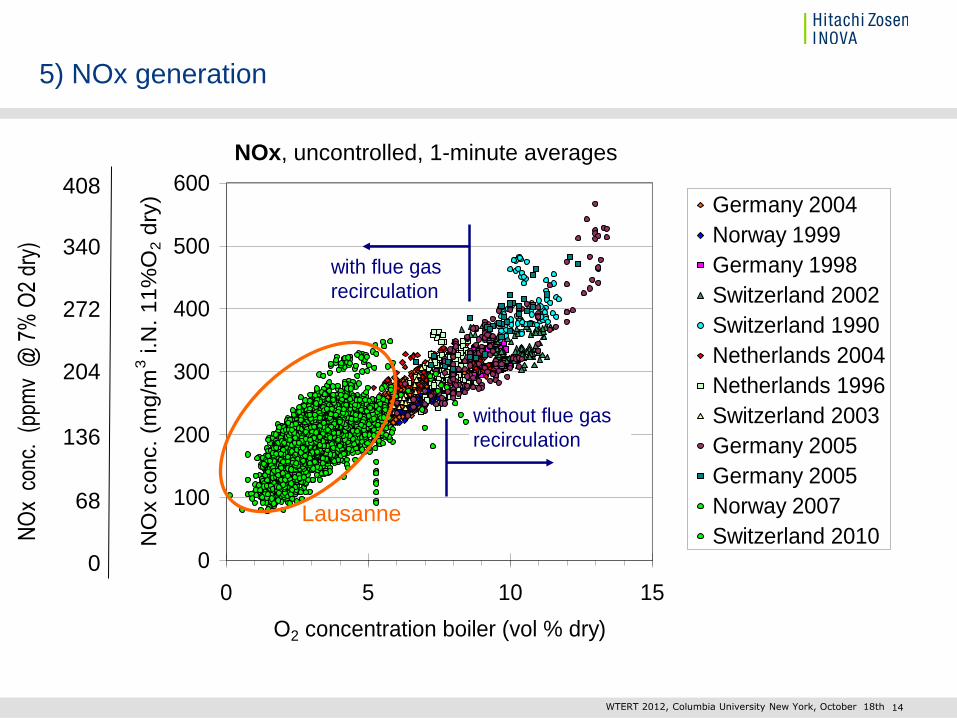
5) NOx generation
0
100
200
300
400
500
600
0 5 10 15
O2 concentration boiler (vol % dry)
NO
x c
onc. (m
g/m
3 i.N
. 11%
O2 d
ry) Germany 2004
Norway 1999
Germany 1998
Switzerland 2002
Switzerland 1990
Netherlands 2004
Netherlands 1996
Switzerland 2003
Germany 2005
Germany 2005
Norway 2007
Switzerland 2010
without flue gas
recirculation
with flue gas
recirculation
Lausanne
NOx, uncontrolled, 1-minute averages
0
68
136
204
272
340
408
NO
x c
onc.
(pp
mv
@ 7
% O
2 dr
y)
WTERT 2012, Columbia University New York, October 18th
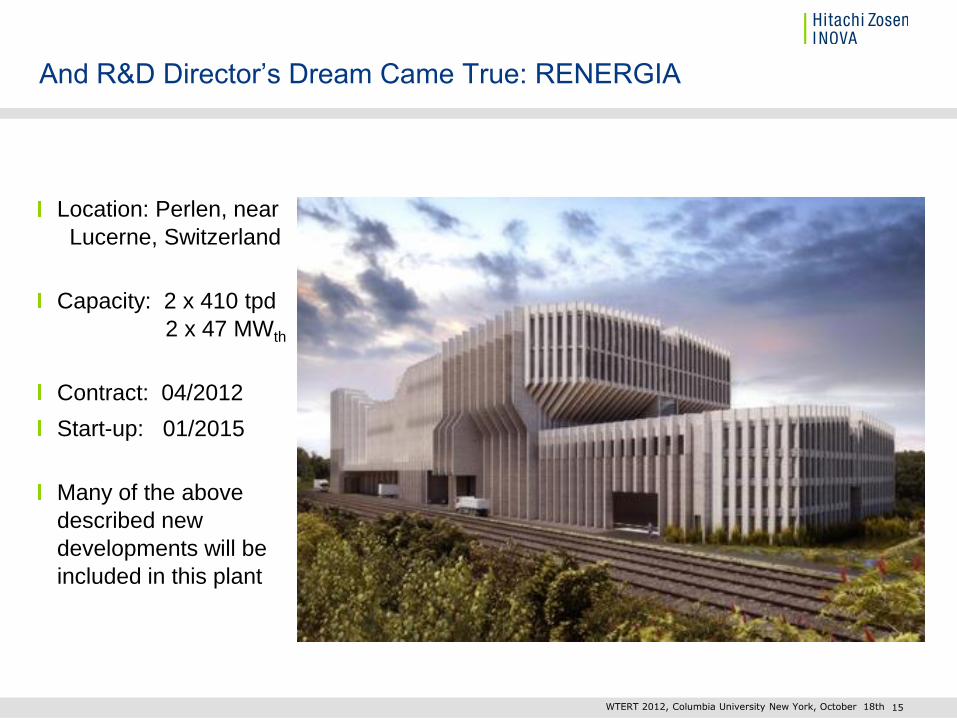
And R&D Director’s Dream Came True: RENERGIA
Location: Perlen, near
Lucerne, Switzerland
Capacity: 2 x 410 tpd
2 x 47 MWth
Contract: 04/2012
Start-up: 01/2015
Many of the above
described new
developments will be
included in this plant
15 WTERT 2012, Columbia University New York, October 18th
16
Thank you for your attention
Peter Chromec
Hitachi Zosen Inova U.S.A. LLC
3740 Davinci Court, Suite 250
Norcross, GA 30092
T: +1 678 987 2501
WTERT 2012, Columbia University New York, October 18th