![Q2 Result Presentation [Company Update]](https://static.fdocuments.us/doc/165x107/577ca7871a28abea748c70f6/q2-result-presentation-company-update.jpg)
Company Presentation Q2 – FY2017 1
13
Company Presentation Q2 – FY2017 1
Transcript of Company Presentation Q2 – FY2017 1

Company PresentationQ2 – FY2017 1

This presentation and the discussion that follows may contain certain words or phrases that are forward - looking statements,
based on current expectations of the management of Transformers and Rectifiers India Ltd or any of its subsidiaries and
associate companies (“TRIL”). Actual results may vary significantly from the forward-looking statements contained in this
presentations due to various risks and uncertainties. These risks and uncertainties include the effect of economic and political
conditions in and outside India, volatility in interest rates and the securities market, new regulations and Government policies
that may impact the businesses of TRIL as well as its ability to implement the strategy.
The information contained herein is as of the date referenced and TRIL does not undertake any obligation to update these
statements. TRIL has obtained all market data and other information from sources believed to be reliable or its internal
estimates, although its accuracy or completeness can not be guaranteed. This presentation is for information purposes only and
does not constitute an offer or recommendation to buy or sell any securities of TRIL. This presentation also does not constitute
an offer or recommendation to buy or sell any financial products offered by TRIL. Any action taken by you on the basis of the
information contained herein is your responsibility alone and TRIL or its directors or employees will not be liable in any manner
for the consequences of such action taken by you. TRIL and/or its directors and/or its employees may have interests or
positions, financial or otherwise, in the securities mentioned in this presentation.
DISCLAIMER
BS OHSAS 18001 : 20072
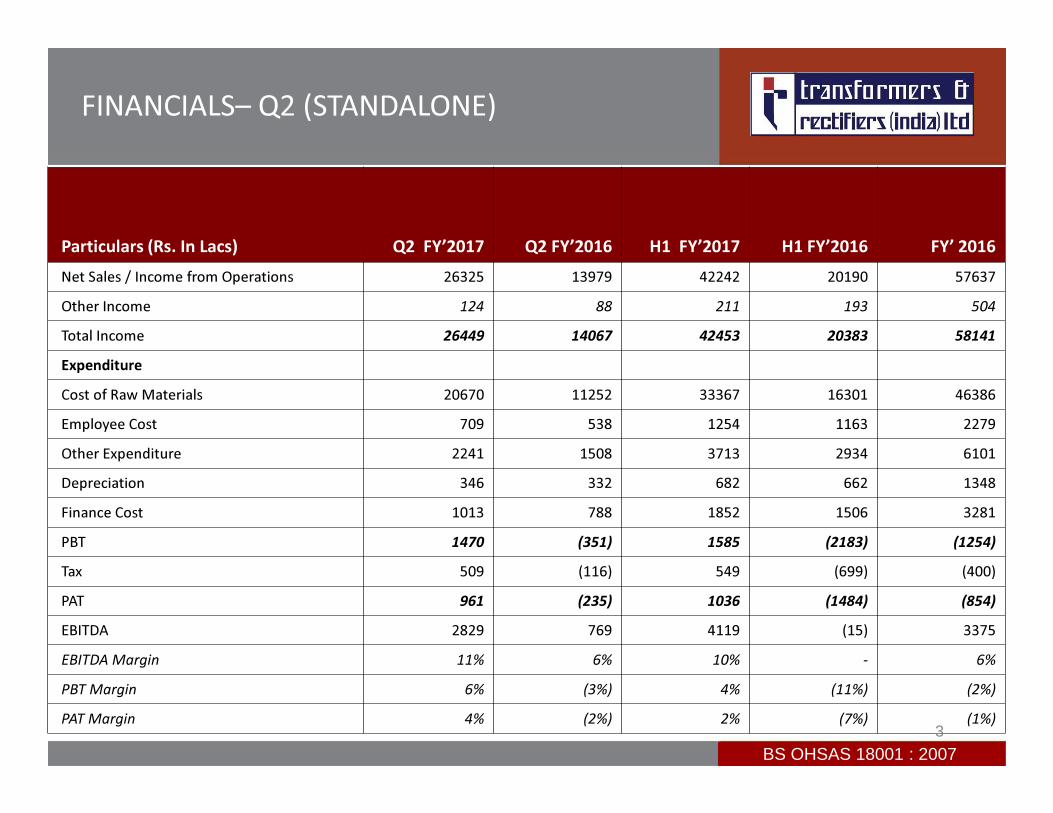
FINANCIALS– Q2 (STANDALONE)
Particulars (Rs. In Lacs) Q2 FY’2017 Q2 FY’2016 H1 FY’2017 H1 FY’2016 FY’ 2016
Net Sales / Income from Operations 26325 13979 42242 20190 57637
Other Income 124 88 211 193 504
Total Income 26449 14067 42453 20383 58141
Expenditure
Cost of Raw Materials 20670 11252 33367 16301 46386
Employee Cost 709 538 1254 1163 2279
Other Expenditure 2241 1508 3713 2934 6101
Depreciation 346 332 682 662 1348
Finance Cost 1013 788 1852 1506 3281
PBT 1470 (351) 1585 (2183) (1254)
Tax 509 (116) 549 (699) (400)
PAT 961 (235) 1036 (1484) (854)
EBITDA 2829 769 4119 (15) 3375
EBITDA Margin 11% 6% 10% - 6%
PBT Margin 6% (3%) 4% (11%) (2%)
PAT Margin 4% (2%) 2% (7%) (1%)
BS OHSAS 18001 : 20073

BALANCE SHEET (STANDALONE)
BS OHSAS 18001 : 20074
Particulars(Rs. In Lacs)
As at 30th Sept
2016
As at 30th Sept
2015
As at 31st March
2016
Share Holders Fund 32995 31330 31960
Long Term Borrowing 3776 5622 4485
Differed Tax Liabilities 563 46 343
Other Non Current Liabilities 251 416 367
Short Term Borrowing 13958 13492 9649
Current Liabilities 32088 15337 29256
Total Equity and Liabilities 83631 66243 76060
Net Fixed Assets 17571 18332 17884
Other Non Current Assets 2008 2207 2245
Cash and Bank Balances 2130 1879 3429
Other Current Assets 61922 43825 52502
Total Assets 83631 66243 76060

� During the Q2FY2017, Company reported growth of 88 % in Total revenue as
compared to corresponding Q2FY2016
� During the Q2FY2017, Company reported EBIDTA of Rs. 28 Cr i.e. 11% of
Revenue as compared to EBIDTA of Rs. 8 Cr i.e. 6% of Revenue during
Q2FY2016
� During the H1FY2017, Company reported growth of 109 % in Total revenue
as compared to corresponding H1FY2016
� During the H1FY2017, Company reported EBIDTA of Rs. 41 Cr i.e. 4% of
Revenue as compared to negative EBIDTA of Rs. 0.15 Cr i.e. -0.01 % of
Revenue during H1FY2016
MAJOR HIGHLIGHTS
5

BS OHSAS 18001 : 2007
� INR 263 Cr Turnover is the highest during Second Quarter of any year.
� Received breakthrough order for 13 Nos 765kV class Reactors from PGCIL,
with this our range of Transformers and Rectifiers is complete upto and
including 765kV class.
� Received Order for 29 Nos of Power Transformers upto 220 kV class from one
of the Utility.
� Received order for 3 Nos 500 MVA 400kV class from one of the Utility.
� The Company has order book of 29622 MVA valuing Rs. 948 Cr as on 1st
November, 2016.
6
MAJOR HIGHLIGHTS

7
JOINT VENTURE WITH JINKE
� Company entered into a Joint venture agreement with Chinese company Jiangsu
Jingke Smart Electric Company Limited (Jingke), for purpose of starting the business of
manufacturing and marketing of GIS/HGIS/TGIS systems and products for 220kV and
below, and distribution products of 40.5 kV and below in India.
� TRIL will hold majority 60% of Share of Joint venture and 40% share with Jingke.
� TRIL will provide the infrastructure within the existing plant for manufacturing gas-
insulated substation, SF6, switchgear and hybrid switchgear gas-insulated substations
with initially doing assembly and then gradually start manufacturing in India. The
critical components required would come from China till its manufacturing starts in
India.
� These JV is meant to tap the gas insulator substations market, which only a few
companies in India manufacture, it would likely bring in around Rs 200 crore revenues
in FY2018.
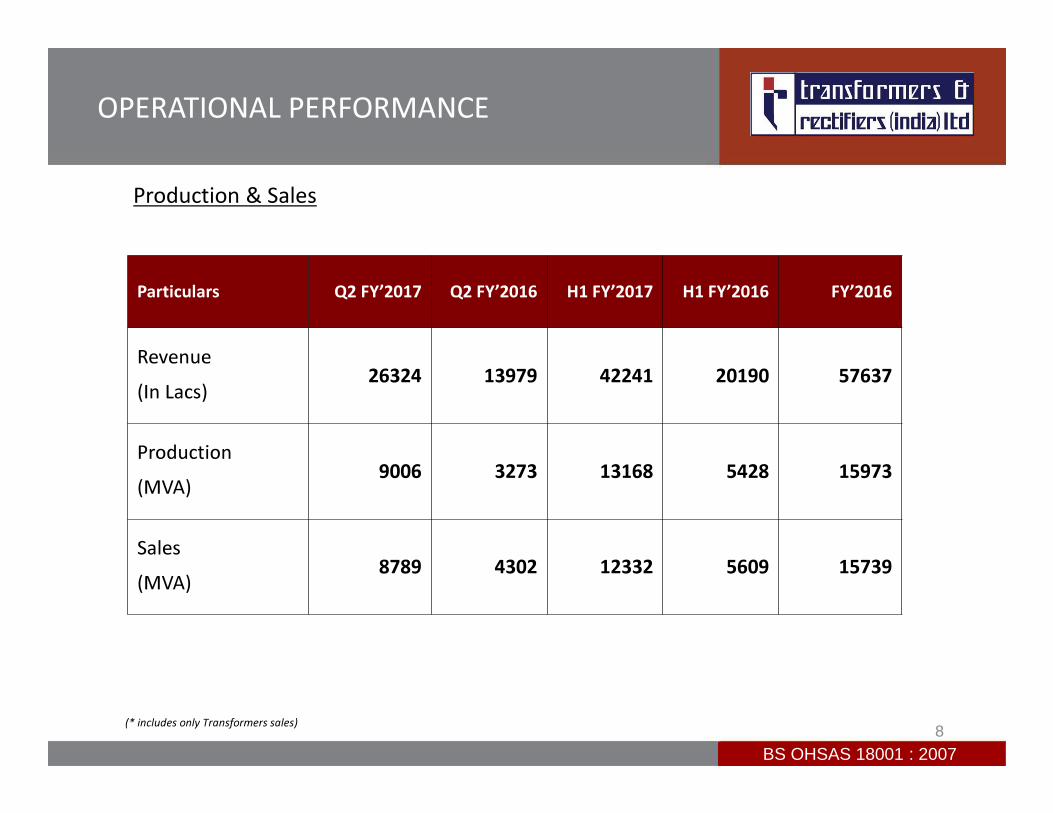
OPERATIONAL PERFORMANCE
Production & Sales
Particulars Q2 FY’2017 Q2 FY’2016 H1 FY’2017 H1 FY’2016 FY’2016
Revenue
(In Lacs) 26324 13979 42241 20190 57637
Production
(MVA) 9006 3273 13168 5428 15973
Sales
(MVA)8789 4302 12332 5609 15739
(* includes only Transformers sales)
BS OHSAS 18001 : 20078

OPERATIONAL PERFORMANCE
• Sales Breakup – Customer segment
The break-up of the sales achieved by the company between industrial
segment (including furnace, rectifier, power and distribution transformers)
and utility segment (SEBs, PGCIL and NTPC) is as under:
.
Q2 FY’2017 Q2 FY’2016 H1 FY’2017 H1 FY’2016 FY’2016
Rs.
(In Lacs)%
Rs.
(In Lacs)%
Rs.
(In Lacs)%
Rs.
(In Lacs)%
Rs.
(In Lacs)%
Utilities
(SEBs, PGCIL
and NTPC)
6440 24% 4433 32% 12155 29% 8580 42% 20863 36%
Industrial 19884 76% 9546 68% 30086 71% 11610 58% 36774 64%
Total 26324 100% 13979 100% 42241 100% 20190 100% 57637 100%
BS OHSAS 18001 : 20079

INFRASTRUCTURE
1000Sq meter, 25 meter high test bay with
shielding suitable for partial discharge
measurements
Test Sources
• 3000 kW 50/60 Hz Generator
• 250kV Transformer for High Voltage test
• 0-170kV Source Transformer for losses
measurement
• 1500 kW 200Hz Generator
• 50 MVAr Capacitor Bank
• 800kV Source Transformer
(provision to increase upto 100MVAr)
TESTING LAB FACILITY
BS OHSAS 18001 : 200710
BS OHSAS 18001 : 2007
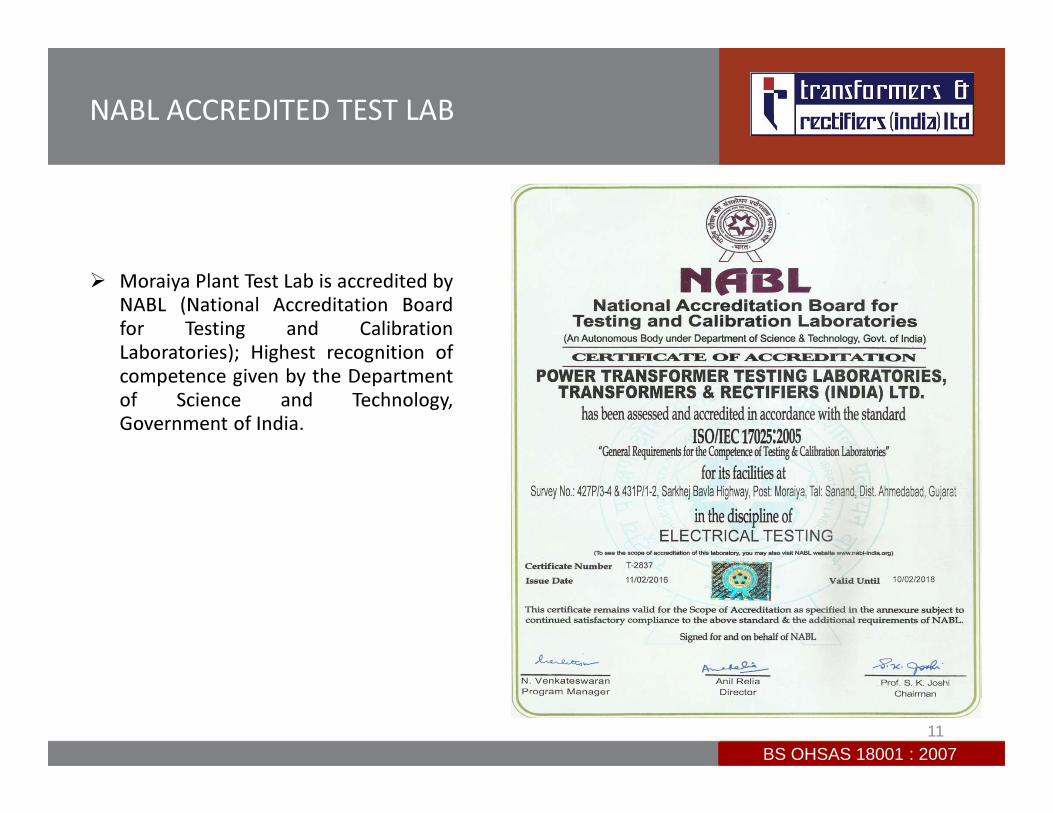
NABL ACCREDITED TEST LAB
� Moraiya Plant Test Lab is accredited by
NABL (National Accreditation Board
for Testing and Calibration
Laboratories); Highest recognition of
competence given by the Department
of Science and Technology,
Government of India.
11

QUALITY ASSURANCE
We believe quality endorses the operational integrity of our brand
12

THANK YOU
www.transformerindia.com
BS OHSAS 18001 : 2007
13