COMMERCE BANCSHARES, INC. · COMMERCE BANCSHARES, INC. ... 176 branches and 376 ATMs in our...
22
COMMERCE BANCSHARES, INC. David Kemper Chairman and Chief Executive Officer ANNUAL SHAREHOLDERS MEETING April 18, 2018
Transcript of COMMERCE BANCSHARES, INC. · COMMERCE BANCSHARES, INC. ... 176 branches and 376 ATMs in our...

COMMERCE BANCSHARES, INC.
David KemperChairman and Chief Executive Officer
ANNUAL SHAREHOLDERS MEETINGApril 18, 2018

2
CAUTIONARY STATEMENT
2
A number of statements we will be making in our presentation and in theaccompanying slides are “forward-looking statements” within themeaning of the Private Securities Litigation Reform Act of 1995, such asstatements of the Corporation’s plans, goals, objectives, expectations,projections, estimates and intentions. These forward-looking statementsinvolve significant risks and uncertainties and are subject to changebased on various factors (some of which are beyond the Corporation’scontrol). Factors that could cause the Corporation’s actual results todiffer materially from such forward-looking statements made herein orby management of the Corporation are set forth in the Corporation’s 2017Report on Form 10-K and the Corporation’s Current Reports on Form 8-K.
3
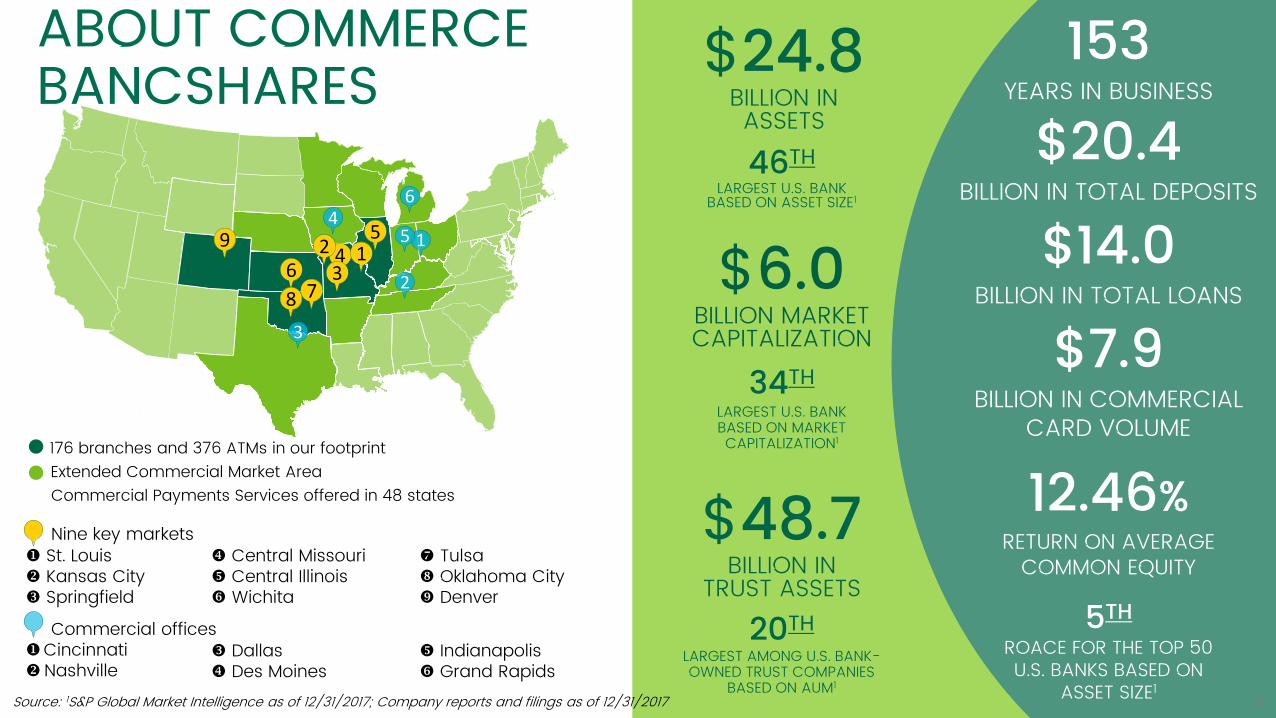
Nine key markets St. Louis Central Missouri Tulsa❖ Kansas City Central Illinois Oklahoma City Springfield Wichita Denver
Commercial officesCincinnati Dallas Indianapolis❖Nashville Des Moines Grand Rapids
ABOUT COMMERCE BANCSHARES
9
76
543
2 1
3
1
28
45
6
Source: 1S&P Global Market Intelligence as of 12/31/2017; Company reports and filings as of 12/31/2017
176 branches and 376 ATMs in our footprintExtended Commercial Market AreaCommercial Payments Services offered in 48 states
$24.8BILLION IN ASSETS46TH
LARGEST U.S. BANK BASED ON ASSET SIZE1
$6.0BILLION MARKET CAPITALIZATION
$48.7BILLION IN
TRUST ASSETS
34THLARGEST U.S. BANK BASED ON MARKET CAPITALIZATION1
20THLARGEST AMONG U.S. BANK-OWNED TRUST COMPANIES
BASED ON AUM1
153YEARS IN BUSINESS
$20.4BILLION IN TOTAL DEPOSITS
$14.0BILLION IN TOTAL LOANS
3
$7.9BILLION IN COMMERCIAL
CARD VOLUME
12.46%RETURN ON AVERAGE
COMMON EQUITY
5THROACE FOR THE TOP 50 U.S. BANKS BASED ON
ASSET SIZE1

4
• Sophisticated payment system capabilities
• Broad consumer product offerings
• Private Banking; Trust; Capital Markets
• Shareholder driven and strong financial performance
• Competitive on unit costs
• Quickly adapt to customer needs and changing preferences
• Core values embraced by employees
• Award winning customer service
• Focus on the full client relationship
Customer relationship-basedCHALLENGE ACCEPTED
High performing teams and engaged workforce
Investment in distinctive, high-return businesses
Long history of top quartile credit quality metrics
Disciplined approach to acquisitionsFocus on operational efficiencies
Community Bank Super-Regional Bank
SUPER-COMMUNITY BANK PLATFORMA consistent strategy with a long term view
4

Giving to our VALUES
• Engaged, long-term leadership team
• Focus on people and talent development
• Knowledge of customers and markets
• Collaboration drives sales across business lines
• Focus on EPS growth• Investing in the
communities in which we operate
A STRONG EMPHASIS ON CULTURE
ENABLES EXECUTION OF CORPORATE STRATEGIES
We have a long term
iew
• Contributed $32 million to Commerce Bancshares Foundation to enable expanded community support
• Rated “outstanding” from the Federal Reserve for community reinvestment
• Employees heavily engaged in the communities we serve
75%
Commerce
78%
U.S. Financial Services Norm
74%
U.S. High Performance Norm
1The Korn Ferry Hay Group – 2017 survey results
2017 Employee Engagement1
We collaborate
as ne teamWe act with
ntegrity
5
We are ustomer
focusedWe strive for
xcellence
6
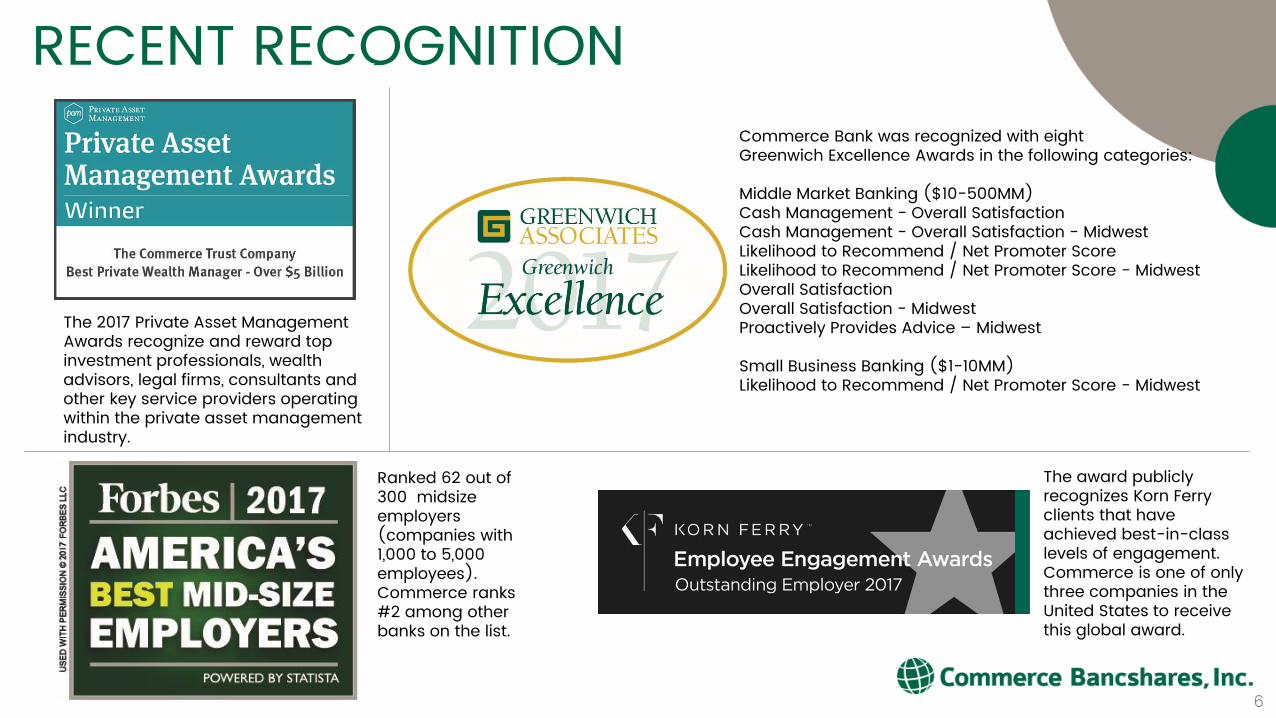
RECENT RECOGNITION
Ranked 62 out of 300 midsize employers (companies with 1,000 to 5,000 employees). Commerce ranks #2 among other banks on the list.
The award publicly recognizes Korn Ferry clients that have achieved best-in-class levels of engagement. Commerce is one of only three companies in the United States to receive this global award.
The 2017 Private Asset Management Awards recognize and reward top investment professionals, wealth advisors, legal firms, consultants and other key service providers operating within the private asset management industry.
6
Commerce Bank was recognized with eight Greenwich Excellence Awards in the following categories:
Middle Market Banking ($10-500MM)Cash Management - Overall SatisfactionCash Management - Overall Satisfaction - MidwestLikelihood to Recommend / Net Promoter ScoreLikelihood to Recommend / Net Promoter Score - MidwestOverall SatisfactionOverall Satisfaction - MidwestProactively Provides Advice – Midwest
Small Business Banking ($1-10MM)Likelihood to Recommend / Net Promoter Score - Midwest

Source: Commerce Trust Company, U.S. Bureau of Economic Analysis, Bloomberg
U.S. Real GDP Employment
-1,000
-800
-600
-400
-200
0
200
400
600
-7%-6%
-5%-4%
-3%-2%
-1%0%
1%2%
3%
201620142012201020082006200420022000
Monthly Increase (left axis)3 Month Change (right axis)
-5.0%-4.0%-3.0%-2.0%-1.0%0.0%1.0%2.0%3.0%4.0%5.0%6.0%7.0%8.0%9.0%
20011977 200519931981 1985 2009 2013 20171973 1989 1997
"Sustainable" Trend GrowthY-O-Y (left axis)
10-year Average
ECONOMIC THEMESWe expect growth to accelerate even further in 2018. It would not surprise us if growth approaches or even surpasses 3% this year. The key drivers to this growth are:• Increasing levels of employment• Growth in business and consumer confidence that is translating to increasing retail sales and a
deepening of the capital stock with investment in infrastructure and capital equipment• A continued recovery in the housing market• A positive tailwind from the global economy• Record stock prices• A boost from the Trump tax plan
7

THEMES IN THE BANKING INDUSTRY
8
• The traditional brick and mortar retail branch network remains relevant but with evolution of format and emphasis on strategic location
• Tech enhancements to the digital experience will continue to meet the customers changing needs; organic growth as a result
• Maintaining a balance between deposit retention and rate adjustments• Fraud and cyber crimes continue to be a big threat driving big
investments to improve security • Fintechs are no longer viewed strictly as a competitive threat but also
as potential partnership opportunities• Increased investments in innovation and an ongoing emphasis on
reducing operating costs• Introduction of new technologies, automated processes and the need
to replace aging core systems• Regulation is still a strong influence in the industry but pace of new
regulation is slowing; leadership changes at government agencies will continue to play a role

STRONG PERFORMANCE with ongoing refinement of the “Core Bank”• Super-Community Bank platform• Relationship-based banking• High-touch customer service• Full suite of product and service
offerings• Disciplined attention to risk return• Divest in businesses & activities
that no longer provide acceptable returns
• A highly engaged workforce• Focus on profitability and
shareholder return
MAINTAINING THE BALANCEDisciplined focus on PRIORITY BLUE CHIP investments
• Funding Future Growth• Expansion Market Growth• Transform the Retail Model• Enhance Private Client Model• Health Services Financing• Claims Payments• Commerce Bank Mortgage• Enterprise CRM• Succession Planning
9…emphasis on culture, collaboration & core values

10
CONSUMER BANKING
01,0002,0003,0004,0005,0006,0007,000
201720162015
Banking Channel PreferencesMonthly Banking Sessions (in thousands) Online BranchMobile
10
2016: 2017:
App Store Rating
2016:$19,157
2017:$25,500
Digital Loan Sales(000s)
Continue Expanding Digital CapabilitiesMobile Penetration
2016:49.4%
2017:54.7%
Mobile Deposit Use
2016:3.3%
2017:7.6%
as of 1/17/18
Period end balances, Information as of December 31, 2017
BILL ION$2.5Consumer
Loans
BILL ION$10.3
Consumer Deposits
Consumer Auto Loans
BILL ION$1.0
2016$10.2BILLION
2016$2.5BILLION 750
AverageFICO
2009$113.5 MILLION
$15MILLION
BranchExpense
Reductionsince 2009
11
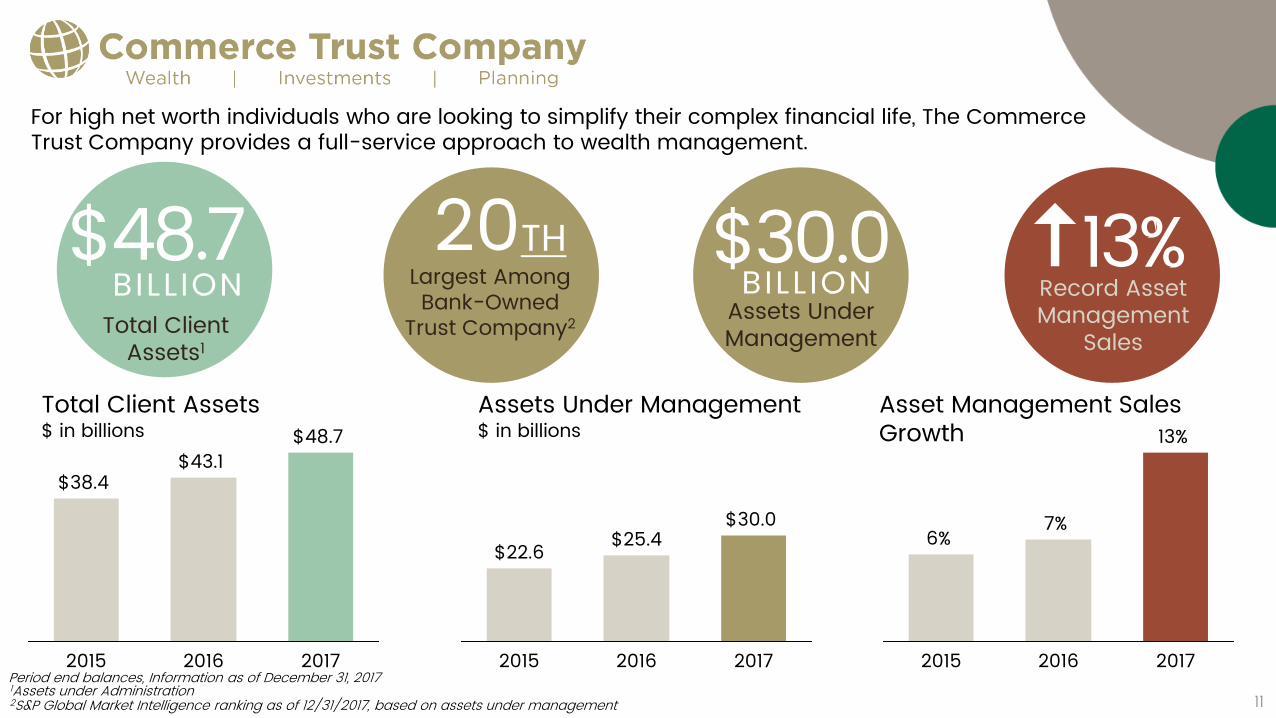
For high net worth individuals who are looking to simplify their complex financial life, The Commerce Trust Company provides a full-service approach to wealth management.
1Assets under Administration2S&P Global Market Intelligence ranking as of 12/31/2017, based on assets under management
Largest Among Bank-Owned
Trust Company2
20THBILL ION
$48.7Total Client
Assets1
BILL ION$30.0
Assets Under Management
13%Record Asset Management
Sales
2017
$48.7
2016
$43.1
2015
$38.4
Total Client Assets$ in billions
$22.6$30.0
2016
$25.4
2015 2017
Assets Under Management$ in billions
2017
13%
2016
7%
2015
6%
Asset Management Sales Growth
11Period end balances, Information as of December 31, 2017
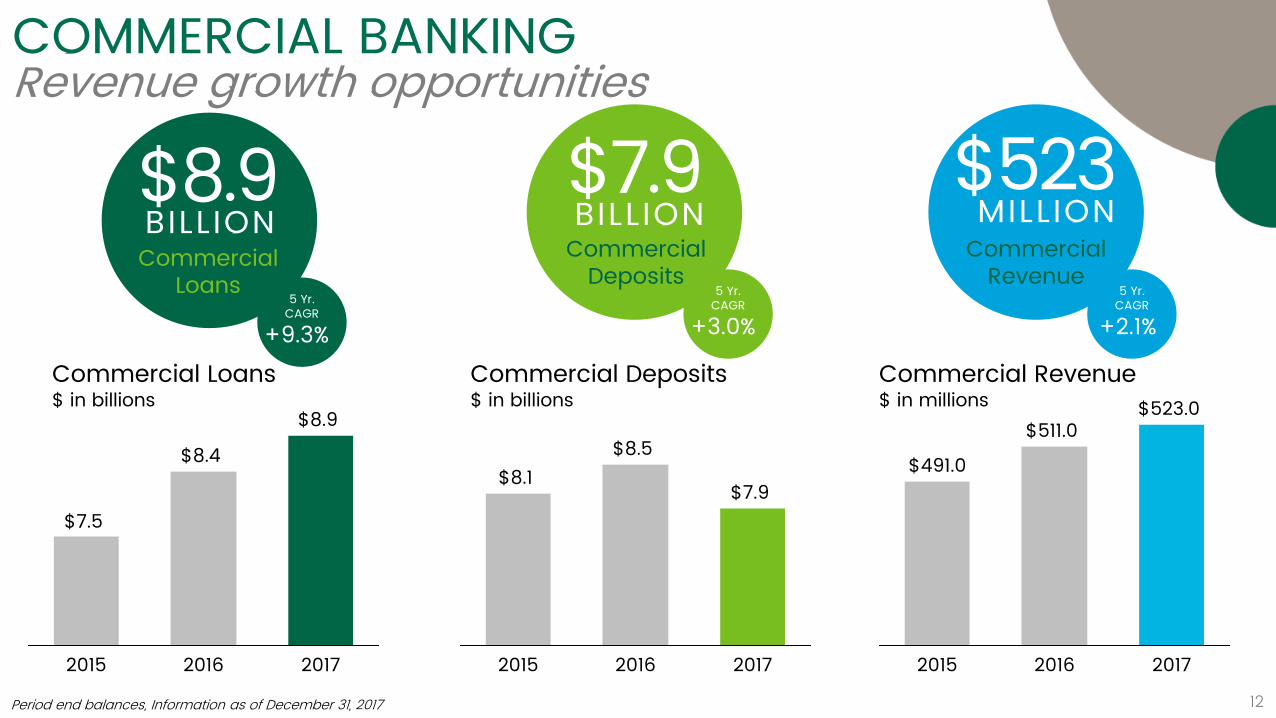
COMMERCIAL BANKINGRevenue growth opportunities
BILL ION$8.9Commercial
Loans
BILL ION$7.9Commercial
DepositsCommercial
Revenue
MILLION$523
5 Yr. CAGR
+9.3%
5 Yr. CAGR
+3.0%5 Yr.
CAGR
+2.1%
2017
$8.9
2016
$8.4
2015
$7.5
Commercial Loans$ in billions
$8.1
2017
$7.9
2016
$8.5
2015
Commercial Deposits$ in billions
2017
$523.0
2016
$511.0
2015
$491.0
Commercial Revenue$ in millions
12Period end balances, Information as of December 31, 2017

13
COMMERCIAL BANKING – EXPANSION MARKETS OFFERING GROWTH OPPORTUNITIES
$500$0
$2,000$1,500$1,000
2012
$608
2016
$1,542
2015
$1,338
2014
$1,091
2013
$962
2017
$1,793
DallasDenverOklahomaCincinnatiNashvilleExpansion Market Loan Growth$s in millions
16.2%
Total Company
4.3%
Expansion Markets
Loan Growth 2017 vs 2016
814
8 8814
2115
OklahomaDenver DallasNashville33
Cincinnati
Personnel Overview for Expansion Markets#of commercial bankers per market* (includes open positions)
2012 2017
Expansion Market Loan
Growth
since 2012195%
13* As of August 2017Period end balances, Information as of December 31, 2017

1414
MILLION$42
TreasuryServicesRevenue
Invoice Capture and Workflow Approval
Payments Hub
Remit Connect Health Services Financing Claims Payments
Supply Chain Finance
$
COMMERCIAL PAYMENTS
MILLION$145
Health Services Financing
Loans
MILLION$194
Payments Revenue
BILL ION$7.9Commercial Card Volume
EMBRACING INNOVATION IN THE PAYMENTS SYSTEMSOur full suite of products and services brings real value to client relationships
14Period end balances, Information as of December 31, 2017

60%
11%
7%
1%
13%
8%
Commerce Bank*
Net Interest Income
Wealth Management
Deposit Service Charges
Fees And Commissions
Card Income
Other
FEE INCOME AT 40% OF TOTAL REVENUE
$437 $448
2014 2017
$487
2016
$474
20152013
$419
2012
$400
Balanced mix of interest and non-interest income
Continued focus on growing fee income through new and existing product and services offeringsExamples:• Toggle™• Remitconnect™• Supply chain finance• Insurance claims payment processing• Accounts Payable automation• Swaps
73%
5%
6%
3% 3%
10%
Peer Banks*
*Source: S&P Global Market Intelligence & FIS as of 12/31/2017Peer Banks include: ASB, BKU, BOKF, CFR, FHN, FNB, FULT, HBHC, IBKC, ISBC, MBFI, PB, SNV, TCF, UMBF, UMPQ, VLY, WBS, WTFC
15
Non-Interest Income$ millions
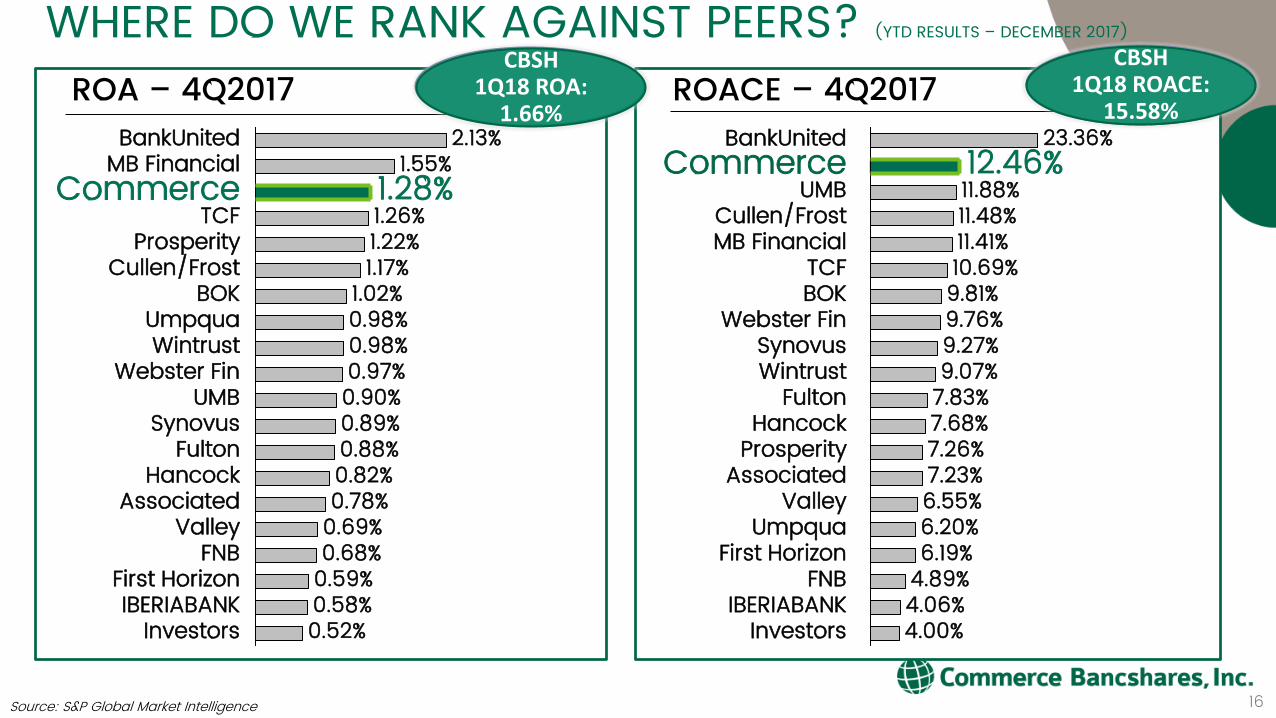
ROACE – 4Q2017ROA – 4Q2017WHERE DO WE RANK AGAINST PEERS? (YTD RESULTS – DECEMBER 2017)
MB Financial 11.41%Cullen/Frost 11.48%
UMB 11.88%Commerce 12.46%
BankUnited 23.36%
Investors 4.00%IBERIABANK 4.06%
FNB 4.89%First Horizon 6.19%
Umpqua 6.20%Valley
10.69%
6.55%Associated 7.23%
Prosperity 7.26%Hancock 7.68%
Fulton 7.83%Wintrust 9.07%Synovus 9.27%
Webster Fin 9.76%BOK 9.81%TCF
0.88%0.89%
UMB 0.90%Webster Fin 0.97%
Wintrust 0.98%Umpqua 0.98%
BOK 1.02%Cullen/Frost 1.17%
Prosperity 1.22%TCF 1.26%
Commerce
Synovus
0.52%InvestorsIBERIABANK 0.58%
First Horizon 0.59%FNB 0.68%
Valley 0.69%Associated 0.78%
Hancock 0.82%Fulton
1.28%MB Financial 1.55%BankUnited 2.13%
16Source: S&P Global Market Intelligence
CBSH 1Q18 ROA:
1.66%
CBSH 1Q18 ROACE:
15.58%

2017 YEAR END EARNINGS$ in millions 2016A 2017A Actual
% Incr.Net interest income $ 680 $ 734 8%Non-interest income 446 461 3%
Total revenue 1,127 1,195 6%Securities gains/(losses) (0) 25 NMNon-interest expense (689) (744) 8%Provision for loan losses (36) (45) 25%
Pretax income 401 431 7%Income taxes (124) (111) -11%Net income 277 320 16%
Non-controlling int. exp. (1) (1) NMNet inc attrib. to Commerce 275 319 16%
Less preferred stock div. (9) (9) 0%Net inc avail. to common
stock 266 310 17%
Diluted EPS $ 2.49 $ 2.89 16%17
ROA2016: 1.12%2017: 1.28%
ROACE2016: 11.33%2017: 12.46%
Efficiency Ratio2016: 61.04%2017: 62.18%
Cash Dividends2016: $0.8162017: $0.857
Ending Stock Price2016: $55.062017: $55.84

FINANCIAL HIGHLIGHTS QTDMARCH 31, 2018
$ millions (except EPS) 1Q2017 1Q2018 % changeNet Income attrib to Commerce $72 $101 40.3%
Return on Average Assets 1.15% 1.66% 44.3%
Return on Average Common Equity 11.74% 15.58% 32.7%
Efficiency Ratio 62.19% 58.21% -6.4%
Average Loans $13,537 $13,929 2.9%
Average Deposits $21,023 $20,161 -4.1%
Diluted EPS* $0.65 $0.92 41.5%
*Per shares figures have been restated for 5% stock dividend distributed in December 2017 18

COMMERCE BANK MAINTAINS SOLID PERFORMANCE OVER TIME
-0.5%
0.0%
0.5%
1.0%
1.5%
201620152014201320122011 2017201020092008
Return on Assets
Return on Average Common Equity
-5.0%
0.0%
5.0%
10.0%
15.0%
2017201620152014201320122011201020092008
Commerce Bank Large BanksPeer Banks
Source: S&P Global Market Intelligence; data as of 12/31/2017; CBI numbers via internal reporting
Peer Banks include: ASB, BKU, BOKF, CFR, FHN, FNB, FULT, HBHC, IBKC, ISBC, MBFI, PB, SNV, TCF, UMBF, UMPQ, VLY, WBS, WTFC; Large Banks include: JPM, BAC, C, WFC USB, PNC, FITH, RF
ROA 10-yr averageCBSH: 1.18% Peers: 0.63%
ROACE 10-yr average CBSH: 11.57% Peers: 5.53%
19

Dividends per share
*Including 2012 special dividend = $1.806All data has been restated for 5% stock dividend distributed in December 2017Net Income in the chart represents Net Income Available to Common ShareholdersSource: Corporate Finance
LONG TERM VIEW: NET INCOME AND EARNINGS PER SHARENe
t Inc
ome
$ 00
0s
$1.00
$350
300250
200150
10050
$1.50
$3.00
$2.00
$2.50
2017201620152014201320122011201020092008
Net IncomeEarnings Per Share
49TH CONSECUTIVE YEAR OF DIVIDEND GROWTHEPS REMAINS STRONG
Earn
ings
per
Sha
re
$0.86$0.61 $0.62 $0.64 $0.65 $0.69* $0.71 $0.74 $0.78 $0.82
20

STEADY SHAREHOLDER RETURNS as of December 31, 2017
Source: Corporate Finance, Bloomberg; data as of 12/31/2017
Total Shareholder ReturnsIndexed, 12/31/2007 = $100
Consistent, positive returns to shareholders Significant outperformance relative to banks over long period
0%
5%
10%
15%
20%
25%
10 Year5 Year3 Year1 Year
KBW Bank IndexNASDAQ Banks
S&P 500CBSH
Annualized ComparisonTotal Shareholder ReturnsPercent
3.03% 16.19% 17.43% 10.06%21.82% 11.39% 15.77% 8.49%5.46% 16.53% 18.66% 6.48%
18.59% 15.24% 18.18% 4.13%
$300
$250
$200
$150
$100
$50
$0201720152013201120092007
KBW BANK INDEXS&PNASDAQ
BANK INDEX
COMMERCE BANK
21

NOTICE: Due to technical difficulties, the recorded audio file for the Annual Shareholder meeting is of low quality. However, if you are interested in listening to the recorded message, you can access the recording by clicking on the link provided below.
2018 Shareholder Meeting Webcast Audio