First Bancshares Inc.
12
Christopher Marinac 404-601-7210 [email protected] August 23, 2013 First Bancshares Inc. Please see important disclosures regarding FIG Partners’ equity rating system, distribution of ratings, and other report disclosures on the last page of this report. Initiation of Coverage FBMS is a $965 Million commercial bank based in Hattiesburg, MS with a footprint along the Mississippi Gulf Coast including eastern Louisiana and Southwestern Alabama. It holds $843 Million in Deposits via 25 branches. The company has strategically expanded from $540 Million in June 2011 via a $179 Mil. Deposit acquisition from HBHC-Hancock Holding in Fall 2011, $188.5 Mil. purchase from a bankrupt holding company in Alabama, and $56 Mil. of organic asset expansion. While common equity is levered in a similar fashion today as in Mid-2011 (pre-acquisitions), FBMS has a lower Loans-to-Deposits ratio of 65.5% vs. 79% 2 years ago. Thus, dry powder exists to fund new loans in the future. Our profit expectation is 65 to 75 basis points in ROA-Return on Assets and 10% to 11% ROTCE-Return on Tangible Common Equity during the next 10 quarters through year-end 2015. This leads to tangible book value expansion from $10.20 per share at 6-30-13 to $12.80 in late 2015. TARP funds ($5 Mil.) received in 2009 were converted to the US Treasury’s “CDCI” Community Development Capital Initiative in 2010 plus another $12.1 Mil. in additional preferred which carry a 2% annual rate until 2018 (and then pay 9% thereafter). It possible that the company retains this capital well beyond the 2% rate period. Regulators judge capital to be 8.3% risk- weighted assets and we forecast slight increase to 8.5% in 2015. We forecast 20% balance sheet growth over the next 10 quarters funded by internal earnings and capital retention as well as better Deposit utilization. EPS of $1.11 in 2014 and $1.35 in 2015 are worth a 14x to 15x P/E and just under 150% of tangible book value. This equates to our $17 Price Target or 25% upside for new investors. Hence, we recommend FBMS shares at an “Outperform” rating. [see further analysis on Pages 2 to 10 of this re- port.] Introducing A Proactive Community Bank On The Gulf Coast Of Miss., AL, & Beyond. Even A Modest Valuation Offers 25% Upside. FBMS: $13.60 “Outperform” Price Target: $17.00
Transcript of First Bancshares Inc.

Christopher Marinac 404-601-7210
[email protected] August 23, 2013
First Bancshares Inc.
Please see important disclosures regarding FIG Partners’ equity rating system, distribution of ratings, and other report disclosures on the last page of this report.
Initiation of Coverage
FBMS is a $965 Million commercial bank based in Hattiesburg, MS with a footprint along the Mississippi Gulf Coast including eastern Louisiana and Southwestern Alabama. It holds $843 Million in Deposits via 25 branches.
The company has strategically expanded from $540 Million in June 2011 via a $179 Mil. Deposit acquisition from HBHC-Hancock Holding in Fall 2011, $188.5 Mil. purchase from a bankrupt holding company in Alabama, and $56 Mil. of organic asset expansion.
While common equity is levered in a similar fashion today as in Mid-2011 (pre-acquisitions), FBMS has a lower Loans-to-Deposits ratio of 65.5% vs. 79% 2 years ago. Thus, dry powder exists to fund new loans in the future.
Our profit expectation is 65 to 75 basis points in ROA-Return on Assets and 10% to 11% ROTCE-Return on Tangible Common Equity during the next 10 quarters through year-end 2015. This leads to tangible book value expansion from $10.20 per share at 6-30-13 to $12.80 in late 2015.
TARP funds ($5 Mil.) received in 2009 were converted to the US Treasury’s “CDCI” Community Development Capital Initiative in 2010 plus another $12.1 Mil. in additional preferred which carry a 2% annual rate until 2018 (and then pay 9% thereafter). It possible that the company retains this capital well beyond the 2% rate period. Regulators judge capital to be 8.3% risk-weighted assets and we forecast slight increase to 8.5% in 2015.
We forecast 20% balance sheet growth over the next 10 quarters funded by internal earnings and capital retention as well as better Deposit utilization. EPS of $1.11 in 2014 and $1.35 in 2015 are worth a 14x to 15x P/E and just under 150% of tangible book value. This equates to our $17 Price Target or 25% upside for new investors. Hence, we recommend FBMS shares at an “Outperform” rating. [see fur ther analysis on Pages 2 to 10 of this re-port.]
Introducing A Proactive Community Bank On The Gulf Coast Of
Miss., AL, & Beyond. Even A Modest Valuation Offers 25% Upside.
FBMS: $13.60 “Outperform” Price Target: $17.00
Initiation of Coverage | First Bancshares Inc. (FBMS)
FIG Partners LLC 2
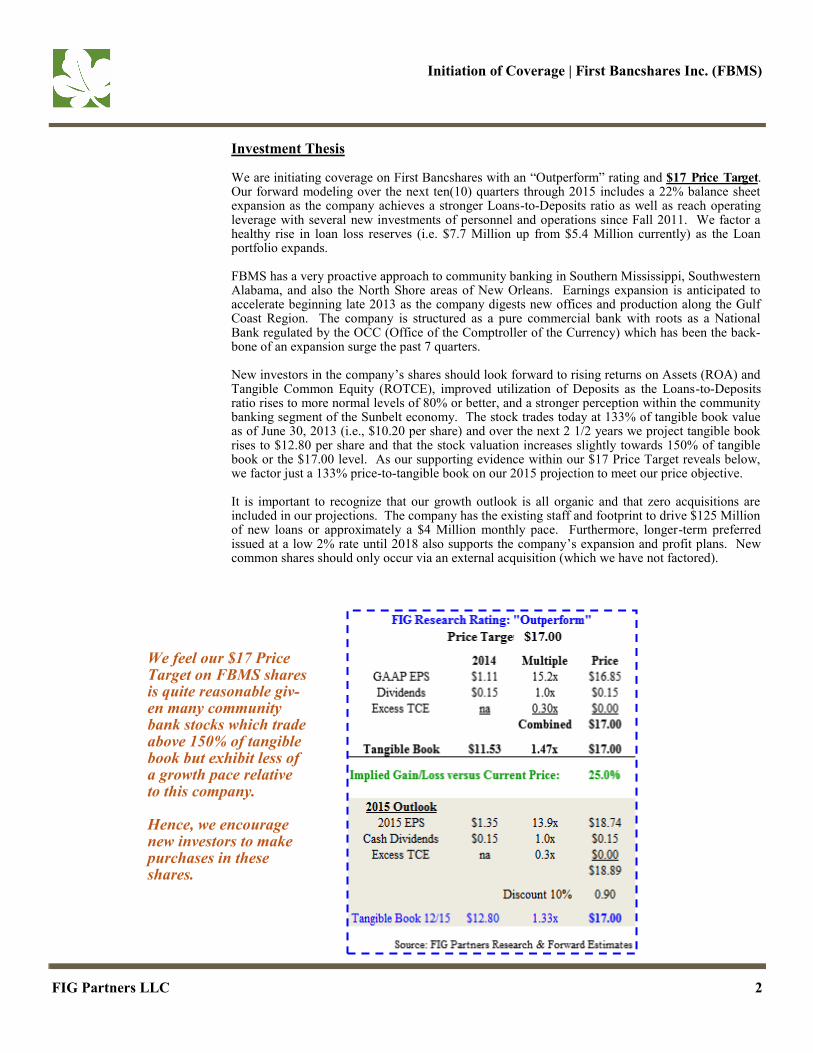
Investment Thesis We are initiating coverage on First Bancshares with an “Outperform” rating and $17 Price Target. Our forward modeling over the next ten(10) quarters through 2015 includes a 22% balance sheet expansion as the company achieves a stronger Loans-to-Deposits ratio as well as reach operating leverage with several new investments of personnel and operations since Fall 2011. We factor a healthy rise in loan loss reserves (i.e. $7.7 Million up from $5.4 Million currently) as the Loan portfolio expands. FBMS has a very proactive approach to community banking in Southern Mississippi, Southwestern Alabama, and also the North Shore areas of New Orleans. Earnings expansion is anticipated to accelerate beginning late 2013 as the company digests new offices and production along the Gulf Coast Region. The company is structured as a pure commercial bank with roots as a National Bank regulated by the OCC (Office of the Comptroller of the Currency) which has been the back-bone of an expansion surge the past 7 quarters. New investors in the company’s shares should look forward to rising returns on Assets (ROA) and Tangible Common Equity (ROTCE), improved utilization of Deposits as the Loans-to-Deposits ratio rises to more normal levels of 80% or better, and a stronger perception within the community banking segment of the Sunbelt economy. The stock trades today at 133% of tangible book value as of June 30, 2013 (i.e., $10.20 per share) and over the next 2 1/2 years we project tangible book rises to $12.80 per share and that the stock valuation increases slightly towards 150% of tangible book or the $17.00 level. As our supporting evidence within our $17 Price Target reveals below, we factor just a 133% price-to-tangible book on our 2015 projection to meet our price objective. It is important to recognize that our growth outlook is all organic and that zero acquisitions are included in our projections. The company has the existing staff and footprint to drive $125 Million of new loans or approximately a $4 Million monthly pace. Furthermore, longer-term preferred issued at a low 2% rate until 2018 also supports the company’s expansion and profit plans. New common shares should only occur via an external acquisition (which we have not factored).
We feel our $17 Price Target on FBMS shares is quite reasonable giv-en many community bank stocks which trade above 150% of tangible book but exhibit less of a growth pace relative to this company. Hence, we encourage new investors to make purchases in these shares.

Initiation of Coverage | First Bancshares Inc. (FBMS)
FIG Partners LLC 3
Company Background
First Bancshares was conceived as a bank holding company (BHC) in June 1995 and its lead bank subsidiary “The First, A National Banking Company” began operations in August 1996 in a suburb of Hattiesburg, MS. The company organically expanded for just over a decade before completing a small acquisition in 2006 that added $49 Million in new Assets. After further balance sheet growth, despite a national recession but also a economic boom from post-Hurricane Katrina re-building, the company added $179 Million in Deposits and nearly $50 Million in Loans from a 7-
FBMS’s Footprint — Southern Mississippi & The Gulf Coast Region
branch transaction with Hancock Holding Co. (HBHC-NASDAQ) in September 2011 (i.e., after Hancock’s June 2011 acquisition of Whitney National Corp. based in New Orleans. The sale of Whitney as well as turnover among producing officers at other large regional and Mississippi-based financial institutions has proved quite beneficial for FBMS as it has sought growth beyond a typical community bank and established a goal of exceeding $1 Billion in Total Assets. These pos-itives still exist today.
A separate chapter of expansion has just begun with the April 2013 acquisition of First National Bank of Baldwin County which brought $188.5 Million in Assets (i.e., $124 Mil. in Loans and $186 Mil. in Deposits) in Fairhope, Foley, and Gulf Shores, AL. This was a unique transaction that required the purchase of bank assets from a bankrupt holding company under Section 363 of the U.S. Bankruptcy Code. FBMS successfully won these assets from another public bank which had considerably more M&A experience but was unable to win favor from a U.S. District Judge. The final price tag on FNB Baldwin was $3.3 Million which should be highly accretive to earnings in 2014 and beyond. The company sold new convertible preferred equity with a $10.25 strike price in March 2013 to close this transaction. New loan growth from this new area of the operating foot-print should be meaningful.
Source: FIG Partners Research, SNL Financial’s Interactive website
Initiation of Coverage | First Bancshares Inc. (FBMS)
FIG Partners LLC 4
Management is lead by Ray “Hoppy” Cole who was the Chief Financial Officer of a private com-mercial sign manufacturer after beginning his career as a lender for the former First National Bank of Commerce in New Orleans (i.e., predecessor to JPM-JP Morgan Chase in the South Central U.S.). He also was a lender for Sunburst Bank in Laurel, MS, joined the FBMS Board in 1999 and then formally joined the company in 2002.
The Chief Financial Officer is Donna “Dee Dee” Lowery who is a former Trust Officer at HBHC-Hancock Bank, in addition to service in public accounting as well as at a private finance company.
The remainder of this report contains our analysis of the company’s Balance Sheet, Loans, Securi-ties, Deposits, and other pertinent fundamentals. Our EPS Model is on Page 10 with the Risks to our Investment Thesis outlined on Page 8.
Balance Sheet Composition:
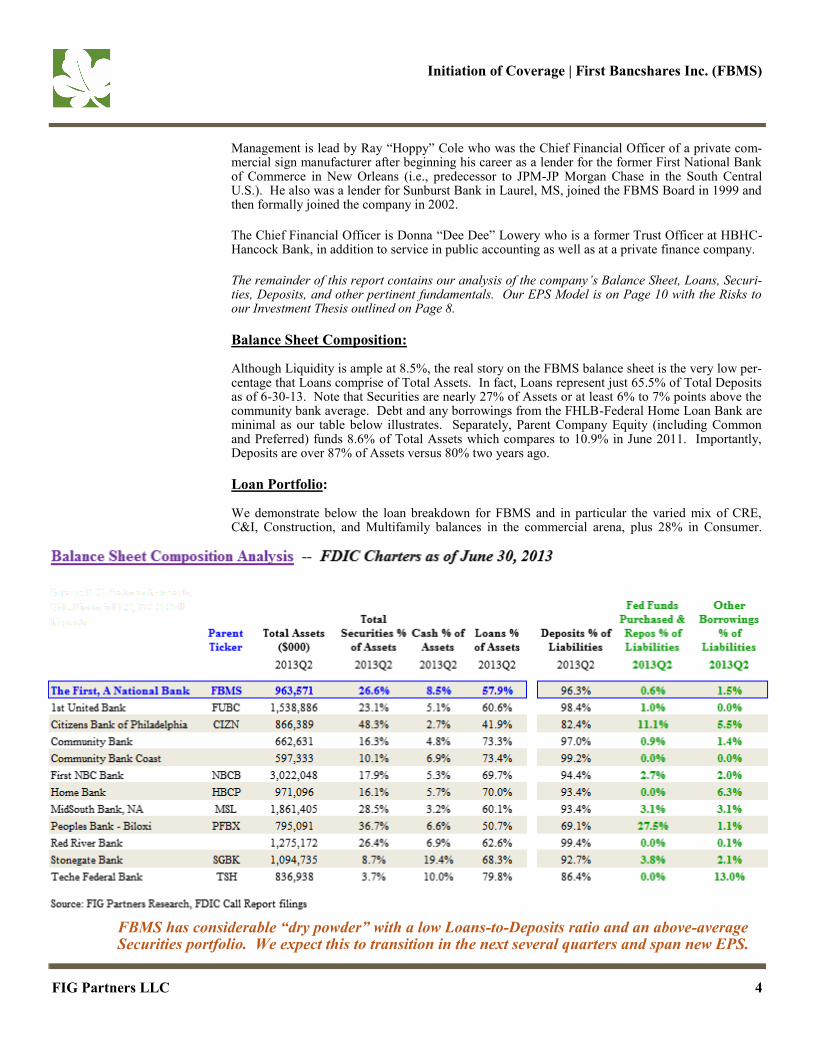
Although Liquidity is ample at 8.5%, the real story on the FBMS balance sheet is the very low per-centage that Loans comprise of Total Assets. In fact, Loans represent just 65.5% of Total Deposits as of 6-30-13. Note that Securities are nearly 27% of Assets or at least 6% to 7% points above the community bank average. Debt and any borrowings from the FHLB-Federal Home Loan Bank are minimal as our table below illustrates. Separately, Parent Company Equity (including Common and Preferred) funds 8.6% of Total Assets which compares to 10.9% in June 2011. Importantly, Deposits are over 87% of Assets versus 80% two years ago.
Loan Portfolio:
We demonstrate below the loan breakdown for FBMS and in particular the varied mix of CRE, C&I, Construction, and Multifamily balances in the commercial arena, plus 28% in Consumer.
FBMS has considerable “dry powder” with a low Loans-to-Deposits ratio and an above-average Securities portfolio. We expect this to transition in the next several quarters and span new EPS.

Initiation of Coverage | First Bancshares Inc. (FBMS)
FIG Partners LLC 5
Incremental growth in the future is likely to be CRE-based with some C&I wins. Relative to Tier 1
capital, Construction is at 90% of current capital while C&I is very similar at 88%. Also, in 2Q13 we noted an increase in the percentage of Unused Commitments for C&I Loans which signals an expansion in new relationships (not a decline in borrower demand). Actual unused balances have increased to $28 Million from $12 Mil. at year-end of 2012. Separately, Mortgage activity for home purchases is robust and is anticipated to contribute to new fee income in the future.
Deposit & Funding Base:
Our table at the bottom of Page 5 highlights the strong Core Funding at FMBS with 73% of all Deposits being “Non-CD” related. At June 30, 2013, the cost of funds (including the modest bor-rowings) was 40 basis points or #3 out of 12 peers that we selected as a comparables to the compa-ny. We also monitor how these Deposits turnover in the next12 months to gauge the sensitivity to
FBMS Enjoys A Healthy Mix Of C&I, CRE, Construction, & 1-4 Mortgages Too
Source: FIG Partners Research, SNL Financial LC, FDIC Call Report data for June 30, 2013
Source: FIG Partners Research, SNL Financial LC, FDIC Call Report data for June 30, 2013

Initiation of Coverage | First Bancshares Inc. (FBMS)
FIG Partners LLC 6
higher interest rates. Contractual re-pricing of all Time Deposits (aka, CDs) occurs for just 17% of these funds from June 2013 thru June 2014, and 24% of all Borrowings are due in the next year.
If we examine all Liabilities at FBMS and set the standard that 50% of total money market (MMDA) accounts and 15% of NOW & Other Saving deposits should lag any short-term interest rate increases, then we calculate about 33% of all Liabilities re-price in the next year. Then, we compare this to 30% of Total Assets (i.e., Loans + Securities) which are contractually scheduled to re-price. We conclude the company is relatively well-balanced on interest rate risk.
Securities Holdings:
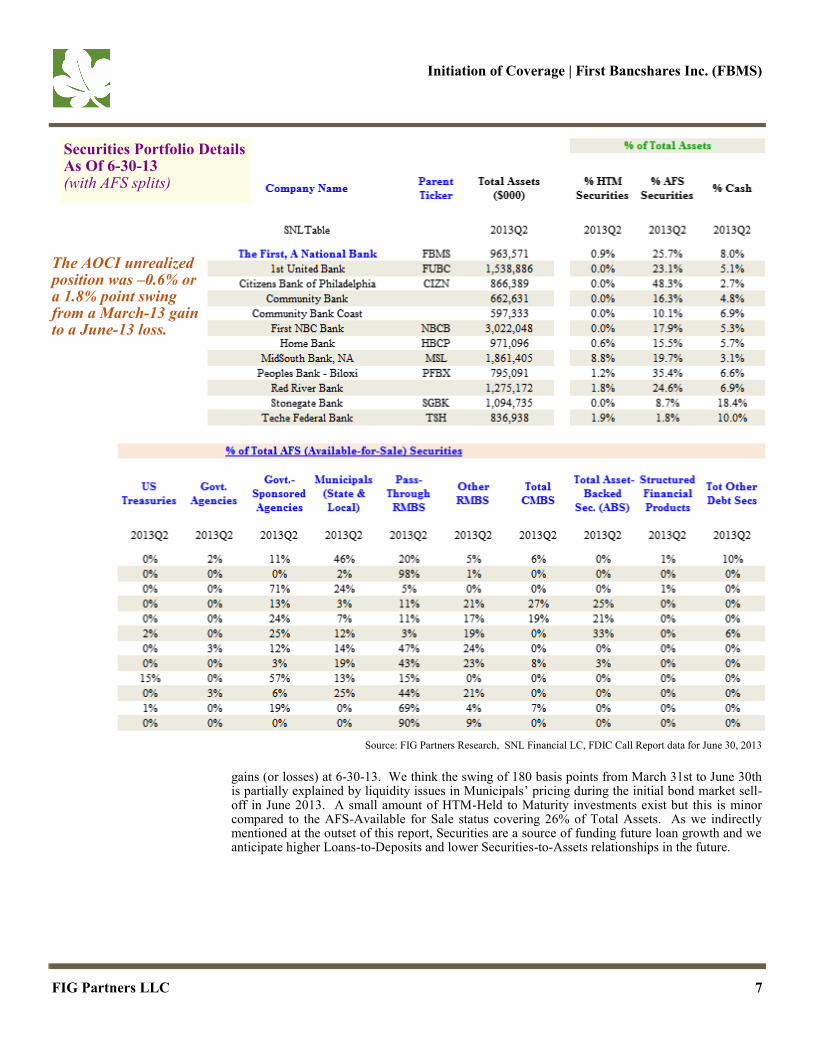
We think it is important to work backwards when assessing the Securities at FMBS. First, the 2.03% yield signals a relatively short duration portfolio (particularly when confirming that the quarterly yield was the same today as it was five quarters ago). Next, as we cite above, 46% of the portfolio is in Municipals. This is key to understanding the change in valuation from unrealized
1-Year Re-Pricing Analysis On Assets & Liabilities Shows An Even Position
Some investors desire Banks with heavy interest rate sensitivity such that higher rates cause a spike in NII-Net Interest Income. This is not a concern given our work above. We prefer a balanced rate risk position that limits volatility and uncertainty. This supports our valuation outlook that FBMS can attract a larger premium on future tangible book value.
Initiation of Coverage | First Bancshares Inc. (FBMS)
FIG Partners LLC 7
gains (or losses) at 6-30-13. We think the swing of 180 basis points from March 31st to June 30th is partially explained by liquidity issues in Municipals’ pricing during the initial bond market sell-off in June 2013. A small amount of HTM-Held to Maturity investments exist but this is minor compared to the AFS-Available for Sale status covering 26% of Total Assets. As we indirectly mentioned at the outset of this report, Securities are a source of funding future loan growth and we anticipate higher Loans-to-Deposits and lower Securities-to-Assets relationships in the future.
Securities Portfolio Details As Of 6-30-13 (with AFS splits)
Source: FIG Partners Research, SNL Financial LC, FDIC Call Report data for June 30, 2013
The AOCI unrealized position was –0.6% or a 1.8% point swing from a March-13 gain to a June-13 loss.

Initiation of Coverage | First Bancshares Inc. (FBMS)
FIG Partners LLC 8
Risks: Our EPS Model is displayed on Page 10 with our forward estimates the next seven(7) quarters. There is uncertainty with these projections as well as other general risks that must be considered by investors including these highlighted below:
1. Our EPS estimates for FBMS depend upon significant new loan growth to expand earnings and leverage its cost structure. To the extent that loan growth slows significantly, earnings could be negatively affected.
2. Community bank stocks can temporarily be correlated with broader financial markets such that external weakness may hinder the stock’s valuation.
3. Changes in management, which are unforeseen, could place pressure on the stock’s valuation
due to uncertainty.
4. Weakening of local fundamentals in Southern Mississippi, as well as the Gulf Coast regions in Mississippi, Alabama, and Louisiana could reduce revenues and earnings. Banks tend to be a mirror of the communities they serve. Thus, FBMS is subject to cyclical economic changes within its income statement and balance sheet.
5. FBMS shares currently trade with just under a $70 Million market capitalization. As the share price rises with earnings, we think liquidity should grow as well. However, there are no assur-ances that temporary liquidity restraints impact the short-term price behavior of this stock. This may create a challenge for investors to accumulate or liquidate their positions if necessary in a very short period of time.
6. The company has historically completed external acquisitions. These transactions inherently have integration risk as new personnel and systems are merged into the FBMS platform. While we factor zero additional purchases into our forward forecast through 2015, it is possi-ble that one or more of these transactions occur and that the integration issue exists.
Loan Maturity Analysis (Percent of Loans Longer Than 5 Years?)
FBMS has a very small percentage of its Commercial (aka, Non-Residential) loans which mature beyond 5-Years. This is a critical factor to limiting risk, in our view.
Initiation of Coverage | First Bancshares Inc. (FBMS)
FIG Partners LLC 9
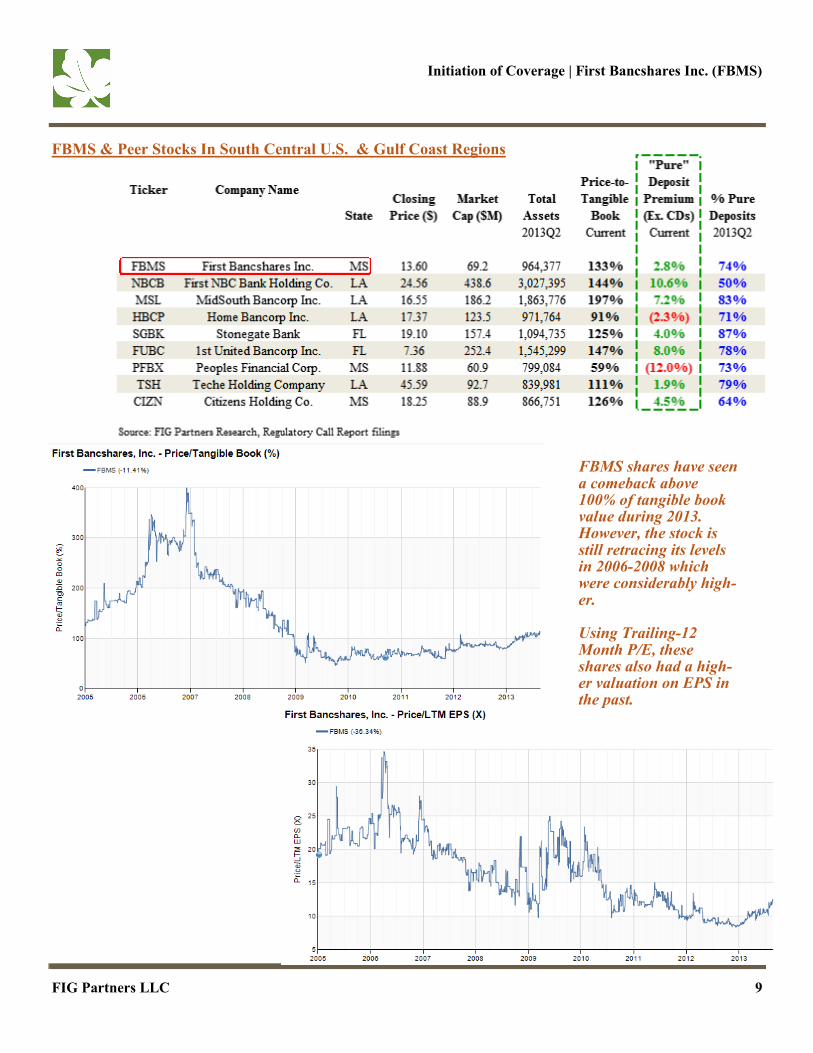
FBMS & Peer Stocks In South Central U.S. & Gulf Coast Regions
FBMS shares have seen a comeback above 100% of tangible book value during 2013. However, the stock is still retracing its levels in 2006-2008 which were considerably high-er. Using Trailing-12 Month P/E, these shares also had a high-er valuation on EPS in the past.

Initiation of Coverage | First Bancshares Inc. (FBMS)
FIG Partners LLC 11
FIG Partners LLC Distribution of Ratings
Equity Rating System as of July 1, 2003
Buy/Outperform “O” FIG expects that total return of the subject stock will outperform the industry benchmark (BIX) over the next 12 months
Hold/Market-Perform “M-P” FIG expects that total return of the subject stock will perform inline with the industry
benchmark (BIX) over the next 12 months Sell/Underperform “U” FIG expects that total return of the subject stock will under perform the industry bench-
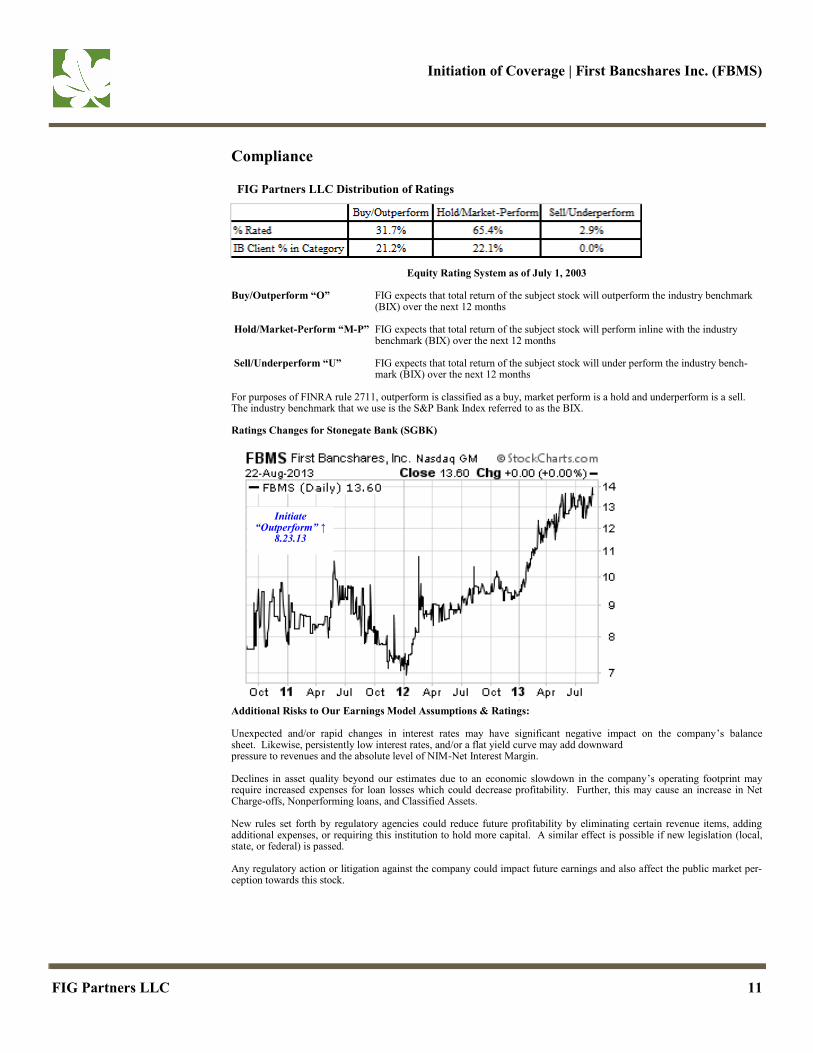
mark (BIX) over the next 12 months For purposes of FINRA rule 2711, outperform is classified as a buy, market perform is a hold and underperform is a sell. The industry benchmark that we use is the S&P Bank Index referred to as the BIX. Ratings Changes for Stonegate Bank (SGBK)
Compliance
Additional Risks to Our Earnings Model Assumptions & Ratings: Unexpected and/or rapid changes in interest rates may have significant negative impact on the company’s balance sheet. Likewise, persistently low interest rates, and/or a flat yield curve may add downward pressure to revenues and the absolute level of NIM-Net Interest Margin. Declines in asset quality beyond our estimates due to an economic slowdown in the company’s operating footprint may require increased expenses for loan losses which could decrease profitability. Further, this may cause an increase in Net Charge-offs, Nonperforming loans, and Classified Assets. New rules set forth by regulatory agencies could reduce future profitability by eliminating certain revenue items, adding additional expenses, or requiring this institution to hold more capital. A similar effect is possible if new legislation (local, state, or federal) is passed. Any regulatory action or litigation against the company could impact future earnings and also affect the public market per-ception towards this stock.
Initiate “Outperform” ↑
8.23.13

Initiation of Coverage | First Bancshares Inc. (FBMS)
FIG Partners LLC 12
Neither the research analyst nor any member of the analyst’s household has any financial interest in the subject company
At the prior month end, neither FIG Partners LLC nor any of its partners or officers owned more than 1% of the outstanding equity securities of the subject company
There are no material conflicts of interest of the analyst or FIG Partners LLC at the time of this report
FIG has not been a manager or co-manager of a public offering of any securities of the recommended issuer within the last three years
FIG has not received investment banking compensation from the subject company in the last three years
FIG intends to seek investment banking compensation from the subject in the next three months
The subject company is not a client of FIG
Neither the analyst nor anyone at FIG serves as an officer, director, or advisory board member of the subject company
FIG may make a market in the subject security, and was making a market in this security at the time of this report’s publication
All analysts are compensated based on a number of factors including the overall profits of FIG Partners LLC which includes investment banking revenues, but no analyst receives any compensation which is based on a specific investment banking service or transaction
To determine price target, our analysts utilize a variety of valuation techniques including but not limited to: peer analysis, absolute P/E, relative P/E, projected P/E, absolute P/B, relative P/B, projected P/B, deposit premium, and a discounted cash flow model
This research report reflects the analyst’s actual opinion
No research analyst is subject to the supervision or control of any employee of the member’s investment banking department
No employee of the investment banking department has reviewed or approved this report prior to publication
The report has not been approved by the subject company, but may have been reviewed for factual accuracy except for the research summary, research rating and price target
The subject company has not promised directly or indirectly favorable research, a specific rating or a specific price target nor has the subject company been threatened with a change in research as an inducement for business or compensation
Additional information is available by request
The information contained herein has been prepared from sources and data we believe to be reliable but we make no representation as to its accuracy or completeness. The opinions expressed herein are our own unless otherwise noted and are subject to change without notice. The price and value of the securities mentioned herein will fluctuate; past performance is no guarantee of future results.
This report is published solely for informational purposes and should not be construed as an offer to buy or sell, or a solicitation of an offer to buy or sell, any security. The securities discussed herein are not suitable for everyone; each investor should assess his or her own particular financial condition and investment objectives before making any investment decisions.
FIG Partners LLC may act as principal for its own account or as agent for both buyer and seller in connection with the purchase or sale of any security discussed herein.
Reproduction or redistribution of this report in any form is prohibited except with the written permission of FIG Partners LLC.
The author is employed by FIG Partners LLC, a broker-dealer
Data sources for the report are Bloomberg Financial L.P., SNL Financial LC, Stockcharts.com, Thompson Financial and regulatory filings.
Compliance