Chapter One - Wiley · 2 CHAPTER ONE Hughes Hallett et al c 2005, John Wiley & Sons ConcepTests and...
319
Chapter One Chapter One
-
Upload
doankhuong -
Category
Documents
-
view
223 -
download
0
Transcript of Chapter One - Wiley · 2 CHAPTER ONE Hughes Hallett et al c 2005, John Wiley & Sons ConcepTests and...

Chapter One
Chapter One

2 CHAPTER ONE Hughes Hallett et al c©2005, John Wiley & Sons
ConcepTests and Answers and Comments for Section 1.1
1. Which of the following functions has its domain identicalwith its range?
(a) f(x) = x2
(b) g(x) =√
x(c) h(x) = x3
(d) i(x) = |x|ANSWER:(b) and (c). Forg(x) =
√x, the domain and range are all nonnegative numbers, and forh(x) = x3, the domain and
range are all real numbers.COMMENT:It is worth considering the domain and range for all choices.
2. Which of the following functions have identical domains?
(a) f(x) = x2
(b) g(x) = 1/√
x(c) h(x) = x3
(d) i(x) = |x|(e) j(x) = ln x
ANSWER:(a), (c), and (d) give functions which have the domain of all real numbers, while (b) and (e) give functions whose
domain consists of all positive numbers.COMMENT:For alternate choices, replace (a) with1/x2 and (e) withln |x|.
3. Which of the following functions have identical ranges?
(a) f(x) = x2
(b) g(x) = 1/√
x(c) h(x) = x3
(d) i(x) = |x|(e) j(x) = ln x
ANSWER:(a) and (d) give functions which have the identical range of nonnegative numbers. (c) and (e) also give functions
which have the same range—all real numbers.COMMENT:You could have students find a function with the same range as (b) : x3/x for example.

CHAPTER ONE Hughes Hallett et al c©2009, John Wiley & Sons 3
4. Which of the graphs is that ofy = x2/x?
−4 −3 −2 −1 1 2 3 4
−4
−3
−2
−1
1
2
3
4
x
y
−4 −3 −2 −1 1 2 3 4
−4
−3
−2
−1
1
2
3
4
x
y(b)
−4 −3 −2 −1 1 2 3 4
−4
−3
−2
−1
1
2
3
4
x
y(c)
−4 −3 −2 −1 1 2 3 4
−4
−3
−2
−1
1
2
3
4
x
y(d)
ANSWER:(d). x2/x is not defined atx = 0.COMMENT:This is where you could emphasize that the domain is a crucialpart of the definition of a function.Follow-up Question. Give another formula for the functiony = x2/x.
Answer. y =
{
x, x 6= 0
undefined, x = 0.
5. The slope of the line connecting the points(1, 4) and(3, 8) is
(a) −1
2(b) −2
(c)1
2(d) 2
ANSWER:
(d).riserun
=8− 4
3− 1=
4
2= 2.
COMMENT:You might point out in finding slopes, the order of the points in the ratio(y2 − y1)/(x2 − x1) is immaterial.
4 CHAPTER ONE Hughes Hallett et al c©2005, John Wiley & Sons
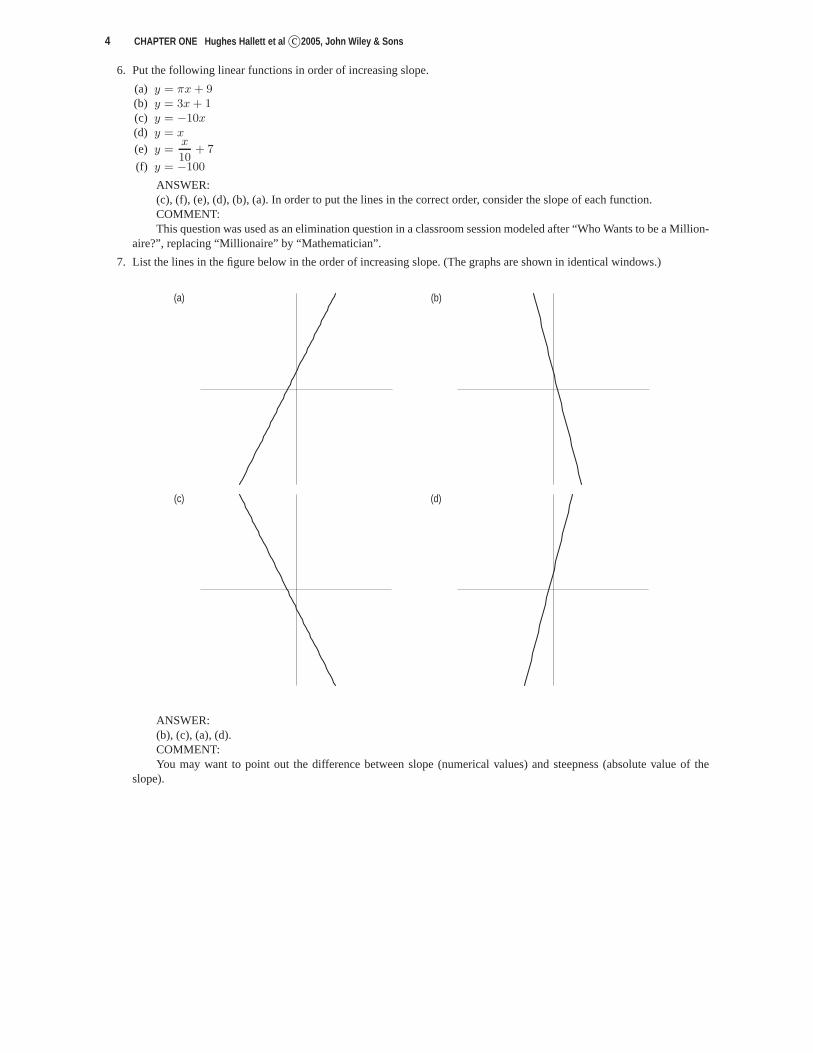
6. Put the following linear functions in order of increasingslope.
(a) y = πx + 9(b) y = 3x + 1(c) y = −10x(d) y = x
(e) y =x
10+ 7
(f) y = −100
ANSWER:(c), (f), (e), (d), (b), (a). In order to put the lines in the correct order, consider the slope of each function.COMMENT:This question was used as an elimination question in a classroom session modeled after “Who Wants to be a Million-
aire?”, replacing “Millionaire” by “Mathematician”.
7. List the lines in the figure below in the order of increasingslope. (The graphs are shown in identical windows.)
(a) (b)
(c) (d)
ANSWER:(b), (c), (a), (d).COMMENT:You may want to point out the difference between slope (numerical values) and steepness (absolute value of the
slope).

CHAPTER ONE Hughes Hallett et al c©2009, John Wiley & Sons 5
8. Which of the following lines have the same slope?
(a) y = 3x + 2(b) 3y = 9x + 4(c) 3y = 2x + 6(d) 2y = 6x + 4
ANSWER:
(a), (b), and (d). Solving fory in the last three choices givesy = 3x +4
3, y =
2
3x + 2, andy = 3x + 2. Thus (a),
(b), and (d) have the same slope, 3.COMMENT:You could point out that (a) and (d) are the same line.
9. Which of the following tables could represent linear functions?
(a) x f(x)
1 1
2 2
3 4
4 8
(b) x g(x)
1 −12
2 −9
3 −6
4 −3
(c) x h(x)
1 10
2 9
4 6
8 3
(d) x j(x)
1 12
2 14
4 16
8 18ANSWER:(b). This is the only table with a constant difference,−3, for the same increase inx. Therefore, (b) is the only one
representing a linear function.COMMENT:You could point out that (d) fails to be a linear function because the slope between consecutive points is not constant.
This happens even though the function values increase by constant amounts because thex values do not increase byconstant amounts.
10. Which of the following lines have the same vertical intercept?
(a) y = 3x + 2(b) 3y = 9x + 4(c) 3y = 2x + 6(d) 2y = 6x + 4
ANSWER:
(a), (c), and (d). Solving fory in the last three choices givesy = 3x +4
3, y =
2
3x + 2, andy = 3x + 2. Thus (a),
(c), and (d) have the same vertical intercept, 2.COMMENT:You could graph these four equations and then ask about the intercept.
11. Every line has a vertical intercept.
(a) True(b) False
ANSWER:(b). The linex = a, wherea 6= 0, does not have a vertical intercept.COMMENT:Note that every non-vertical line has a vertical intercept.
12. Every line has a horizontal intercept.
(a) True(b) False
ANSWER:(b). The liney = a wherea 6= 0, does not have a horizontal intercept.COMMENT:Note that all lines with a nonzero slope have a horizontal intercept.

6 CHAPTER ONE Hughes Hallett et al c©2005, John Wiley & Sons
13. Every line has both a horizontal intercept and a verticalintercept.
(a) True(b) False
ANSWER:(b). Either a horizontal line or a vertical line, excluding the horizontal and vertical axes, provides a counterexample.COMMENT:Note that all lines of the formy = mx + b, wherem 6= 0, have both types of intercepts.
14. Every non-horizontal line must have at most one horizontal intercept.
(a) True(b) False
ANSWER:
(a). Lines of the formy = mx + b, wherem 6= 0, have− b
mas the horizontal intercept, while vertical lines have the
form x = a, wherea is the horizontal intercept.COMMENT:Ask the students what this means geometrically.
15. The graph in Figure 1.1 is a representation of which of thefollowing functions?
(a) y = 6x + 6(b) y = −3x + 6(c) y = −3x + 2(d) y = 6x− 2
−2 −1 1 2 3−2
2
4
6
8
10
12
x
y
Figure 1.1
ANSWER:(b). The line has slope−3 andy-intercept 6.COMMENT:Other methods of reasoning could be used. For example, the line shown has a negative slope, which eliminates
choices (a) and (d). They-intercepts for choices (b) and (c) are 6 and 2, respectively. From the graph they-intercept is 6.

CHAPTER ONE Hughes Hallett et al c©2009, John Wiley & Sons 7
16. The graph in Figure 1.2 is a representation of which of thefollowing functions?
(a) y = 3x− 2(b) y = 2x + 1.5(c) y = 2x + 3(d) 2y = 6x− 3
−2 −1 1 2 3
−2
2
4
6
8
x
y
Figure 1.2
ANSWER:(c). The line has slope 2 andy-intercept 3.COMMENT:Note that they-intercept on the graph is positive, which eliminates choices (a) and (d). The lines given in choices (b)
and (c) have the same slope, so the choice will depend on they-intercept, which appears to be 3, not 1.5.
17. Consider the functionf(x) = x2 + 2x. Give an equation of a line that intersects the graph of this function
(a) Twice(b) Once(c) Never
ANSWER:
(a) There are many answers here. Any horizontal line of the form y = a, wherea > −1.(b) There are many answers here. One example isy = −1.(c) There are many answers here. Any horizontal line of the form y = a, wherea < −1.
COMMENT:If you consider this question graphically, then have your students draw non-horizontal lines that meet the require-
ments for (a) and (b). This could be a way to introduce the ideaof tangent lines.
18. Consider the functionf(x) = 2 sin x. Give an equation of a line that intersects the graph of this function
(a) Once (b) Never (c) An infinite number of times
ANSWER:
(a) There are many answers here. For example any vertical line will do.(b) Any horizontal line of the formy = n where|n| > 2.(c) Any horizontal line of the formy = n where−2 ≤ n ≤ 2.
COMMENT:Follow-up Question. Draw a line that intersects the graph of this function
(a) Twice(b) Three times(c) Four times
You can also ask if it is possible for a line which intersects the curve at an intercept to intersect the curve an even numberof times.

8 CHAPTER ONE Hughes Hallett et al c©2005, John Wiley & Sons
19. Which of the following functions isnot increasing?
(a) The elevation of a river as a function of distance from itsmouth(b) The length of a single strand of hair as a function of time(c) The height of a person from age 0 to age 80(d) The height of a redwood tree
ANSWER:(c). In general, people stop growing when they are young adults and, before they are 80, they begin to lose height.COMMENT:This question expands a student’s idea of a function. You could ask students to supply some more functions that are
increasing.
20. Consideringy as a function ofx, which of the following lines represent decreasing functions?
(a) x + y = 2 (b) x− y = −2 (c) 2x− 3y = 6 (d) 2x + 3y = −6
ANSWER:
(a) and (d). Lines with negative slopes are decreasing functions. (a) has a slope of−1 and (d) has a slope of−2
3, and
thus are decreasing functions.COMMENT:These equations could also be graphed to show the slopes geometrically.
21. Which of the graphs does not representy as a function ofx?
x
y(a)
x
y
a
(b)
x
y(c)
x
y(d)
ANSWER:(b). Forx > a there are two function values corresponding to the same value ofx.COMMENT:It may be worth noting that we are assuming that the entire graph is shown—that the function does not behave
differently outside the given window.

CHAPTER ONE Hughes Hallett et al c©2009, John Wiley & Sons 9
22. All linear functions are examples of direct proportionality.
(a) True(b) False
ANSWER:(b). Any linear function whose graph does not pass through the origin is not an example of direct proportionality.COMMENT:Students should try to find examples as well as counterexamples anytime a definition is introduced.
23. Which of the following graphs representy as directly proportional tox?
−2 −1 1 2
−2
−1
1
2
x
(a)
Figure 1.3
−2 −1 1 2
−2
−1
1
2
x
(b)
Figure 1.4
−2 −1 1 2
−2
−1
1
2
x
(c)
Figure 1.5
−2 −1 1 2
−2
−1
1
2
x
(d)
Figure 1.6
ANSWER:(a) and (c). Ify is directly proportional tox, theny = kx, wherek is a constant. (a) and (c) are graphs of such
equations.COMMENT:Note that graphs representingy as directly proportional tox are lines through the origin. Students should recognize
the graphical properties ofy being directly proportional tox. Notice that (d) could be a representation ofy being directlyproportional to someeven power of x.

10 CHAPTER ONE Hughes Hallett et al c©2005, John Wiley & Sons
24. Which of the graphs represents the position of an object that is slowing down?
t
distance(a)
t
distance(b)
t
distance(c)
t
distance(d)
ANSWER:(b). If the object is slowing down, then the changes in distance over various time intervals of the same length will
decrease as time increases.COMMENT:You could have your students describe how the object is traveling in the other choices.

CHAPTER ONE Hughes Hallett et al c©2009, John Wiley & Sons 11
25. Which of the graphs represents the position of an object that is speeding up and then slowing down?
t
distance(a)
t
distance(b)
t
distance(c)
t
distance(d)
ANSWER:(b). The graph has a positive slope everywhere, which is increasing fort near zero and decreasing for larger times.COMMENT:You could have students describe how the object is travelingin the other choices.
12 CHAPTER ONE Hughes Hallett et al c©2005, John Wiley & Sons
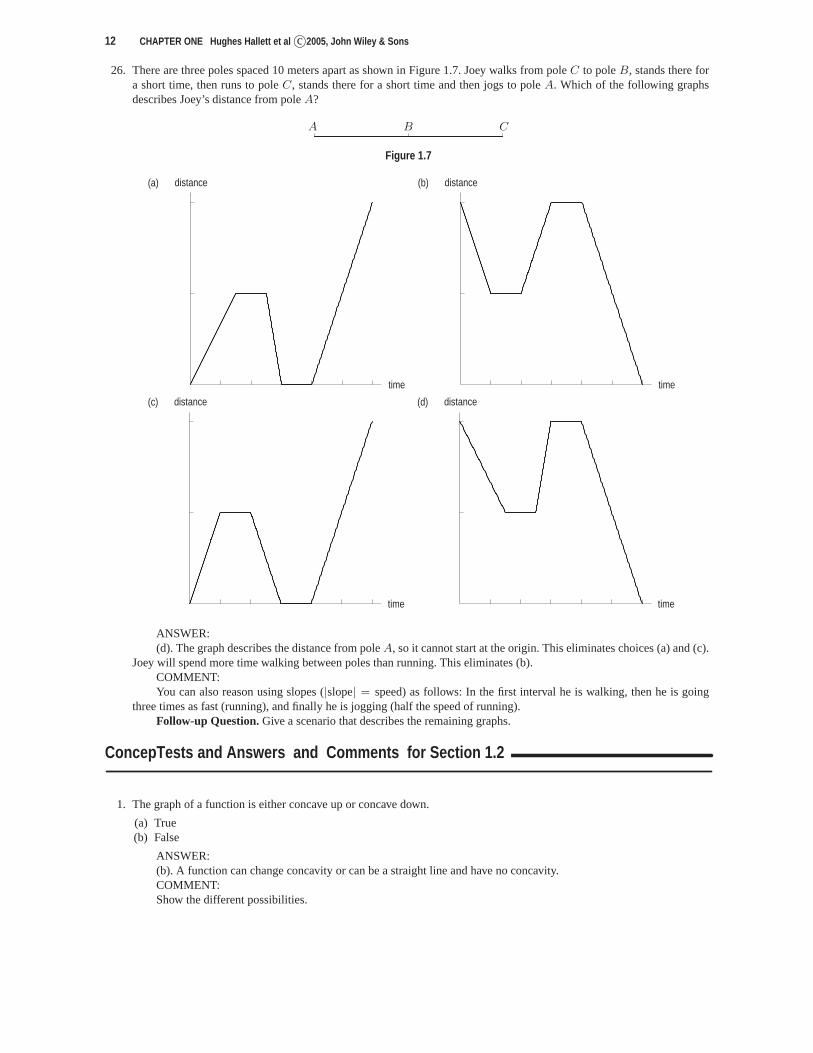
26. There are three poles spaced 10 meters apart as shown in Figure 1.7. Joey walks from poleC to poleB, stands there fora short time, then runs to poleC, stands there for a short time and then jogs to poleA. Which of the following graphsdescribes Joey’s distance from poleA?
A B C
Figure 1.7
time
distance(a)
time
distance(b)
time
distance(c)
time
distance(d)
ANSWER:(d). The graph describes the distance from poleA, so it cannot start at the origin. This eliminates choices (a) and (c).
Joey will spend more time walking between poles than running. This eliminates (b).COMMENT:You can also reason using slopes (|slope| = speed) as follows: In the first interval he is walking, then heis going
three times as fast (running), and finally he is jogging (halfthe speed of running).Follow-up Question. Give a scenario that describes the remaining graphs.
ConcepTests and Answers and Comments for Section 1.2
1. The graph of a function is either concave up or concave down.
(a) True(b) False
ANSWER:(b). A function can change concavity or can be a straight lineand have no concavity.COMMENT:Show the different possibilities.

CHAPTER ONE Hughes Hallett et al c©2009, John Wiley & Sons 13
For Problems 2–5, use the graphs (I)–(IV).
1
1
2
x
(I)
1 2
1
2
x
(II)
1 2 3
1
2
x
(III)
1 2
1
2
3
4
x
(IV)
2. Which graph shows a function that is increasing and concave down?ANSWER:(III)COMMENT:Follow-up Question. Is this still true if the graph is shifted up one unit?
3. Which graph shows a function that is increasing and concave up?ANSWER:(I)COMMENT:Follow-up Question. Is this still true if the graph is reflected across they-axis?
4. Which graph shows a function that is decreasing and concave down?ANSWER:(IV)COMMENT:Follow-up Question. Is this still true if the graph is reflected across thex-axis?
5. Which graph shows a function that is decreasing and concave up?ANSWER:(II)COMMENT:Follow-up Question. Is this still true if the vertical distance from the origin isdoubled at every point on the graph?
14 CHAPTER ONE Hughes Hallett et al c©2005, John Wiley & Sons
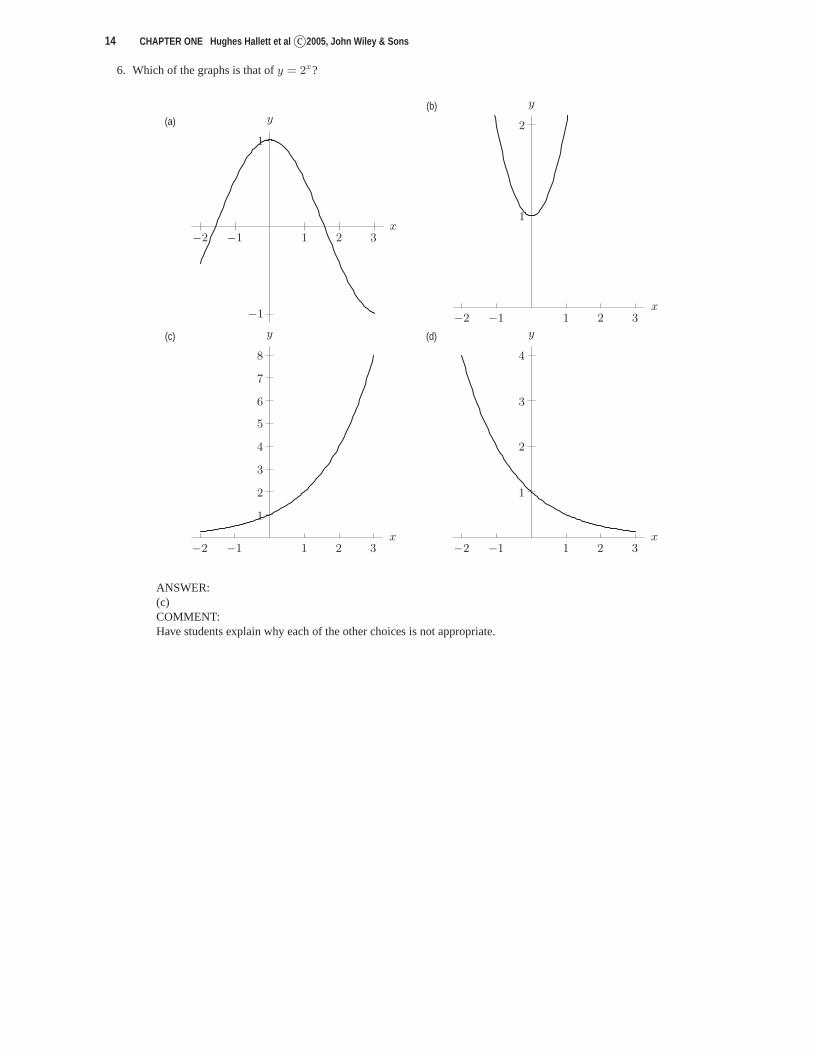
6. Which of the graphs is that ofy = 2x?
−2 −1 1 2 3
−1
1
x
y(a)
−2 −1 1 2 3
1
2
x
y(b)
−2 −1 1 2 3
1
2
3
4
5
6
7
8
x
y(c)
−2 −1 1 2 3
1
2
3
4
x
y(d)
ANSWER:(c)COMMENT:Have students explain why each of the other choices is not appropriate.

CHAPTER ONE Hughes Hallett et al c©2009, John Wiley & Sons 15
7. Which of the graphs is that ofy = 2−x?
−5 −4 −3 −2 −1 1 2
1
2
3
4
5
6
7
x
y(a)
−4 −3 −2 −1 1 2 3 4
1
x
y(b)
−2 −1 1 2 3
1
2
3
4
x
y(c)
−2 −1 1 2 3
1
2
3
4
5
6
7
x
y(d)
ANSWER:(c)COMMENT:Have students explain why each of the other choices is not appropriate.
8. Every exponential function has a vertical intercept.
(a) True(b) False
ANSWER:(a). Exponential functions have the formP0a
t, wherea > 0, buta 6= 1. The vertical intercept isP0.COMMENT:Show this graphically—include positive and negative values ofP0 and values ofa which are between 0 and 1 as well
as values ofa which are greater than 1.
9. Every exponential function has a horizontal intercept.
(a) True(b) False
ANSWER:(b). For example,y = 2x has no horizontal intercept.COMMENT:Exponential functions are of the formy = P0a
t with 0 < a < 1 or a > 1. Point out that an exponential functiondoes not have a horizontal intercept unlessP0 = 0.

16 CHAPTER ONE Hughes Hallett et al c©2005, John Wiley & Sons
10. Which of the following tables could represent an exponential function?
(a) x f(x) (b) x g(x) (c) x h(x) (d) x k(x)
1 1/16 1 9 1 1 1 10
2 1/8 2 −3 2 4 2 5
3 1/4 3 1 4 16 3 2
4 1/2 4 −1/3 8 64 4 1ANSWER:(a). In (a) each term in this table is found by multiplying theprevious term by 2. In fact the entries in this table have
the form(1/16)2x−1. Answer (b) is incorrect since each term in this table is found by multiplying the previous term by−1/3, but exponential functions needabx, whereb > 0. Although in (c) the ratio of adjacent terms is constant, thexvalues do not change by a constant amount. Answer (d) is incorrect since the ratio between adjacent terms is not constant.
COMMENT:Have your students solve fora andb in h(x) = abx in choice (c) using the first two values and then check what
happens to the last two values.
11. Letf(x) = abx, b > 0. Thenf(x + h)
f(x)=
(a) bh
(b) h(c) bx+h − bx
(d) a
ANSWER:(a), sincef(x + h) = abx+h = abxbh = f(x)bh.COMMENT:This fact, in a different format, is used to find the derivative of bx. This introduces the algebraic manipulations
required for the definition of the derivative later in the text.
12. How many asymptotes does the functionf(x) = 1− 10−x have?
(a) Zero(b) One(c) Two(d) Three
ANSWER:(b). The only asymptote is a horizontal one, namelyy = 1.COMMENT:Show thatf(x) may be thought of as10−x reflected across thex-axis and then shifted up 1 unit.
13. Estimate the half-life for the exponential decay shown in Figure 1.8.
2 4 6 8 10
2
4
6
8
10
t
Figure 1.8
ANSWER:3COMMENT:Depending on how much you enlarge the graph, some variation in answers should be allowed here.

CHAPTER ONE Hughes Hallett et al c©2009, John Wiley & Sons 17
14. Estimate the doubling time for the exponential growth shown in Figure 1.9.
2 4 6 8 10
2
4
6
t
Figure 1.9
ANSWER:7COMMENT:Depending on how much you enlarge the graph, some variation in answers should be allowed here.
15. List at least five properties of exponential functions ofthe formy(x) = abx for a > 0 and either0 < b < 1 or b > 1.ANSWER:
(a) Domain: all real numbers(b) Range:y > 0(c) Horizontal asymptote:y = 0(d) y(0) = a(e) Always concave up(f) Always increasing forb > 1, and always decreasing for0 < b < 1(g) No vertical asymptote
COMMENT:You can have your students list more properties. Discuss what happens ifa < 0.

18 CHAPTER ONE Hughes Hallett et al c©2005, John Wiley & Sons
16. Which of the following graphs is that ofy = abx if b > 1?
1 2
1
2
3
4
5
x
(a)
1 2
1
2
3
4
5
x
(b)
1 2
1
2
3
4
x
(c)
1 2
1
2
3
4
x
(d)
ANSWER:(b). If b > 1, we need a graph that is increasing, concave up, and does not go through the origin.COMMENT:Here it is worth having the students point out specifically why the other choices do not work.Follow-up Questions. What is the value ofa? How does the graph change ifa < 0?
17. “During 1988, Nicaragua’s inflation rate averaged 1.3% a day.” Which formula represents the preceding statement?Assumet is measured in days.
(a) I = I0e0.013t
(b) I = I0(1.013)t
(c) I = I0(1.013)t(d) I = I0(1.3)t
ANSWER:(b)COMMENT:Follow-up Question. What happens if the statement is changed to“During 1988, Nicaragua’s inflation rate grew
continuously at a rate of1.3% each day.”?

CHAPTER ONE Hughes Hallett et al c©2009, John Wiley & Sons 19
ConcepTests and Answers and Comments for Section 1.3
For Problems 1–3, the graph in Figure 1.10 is that ofy = f(x). Use the graphs (I)–(IV) for the answers.
−2 −1 1 2
−2
−1
1
2
3
x
Figure 1.10
−2 −1 1 2
−2
−1
1
2
3
x
(I)
−2 −1 1 2
−2
−1
1
2
3
x
(II)
−2 −1 1 2
−2
−1
1
2
3
x
(III)
−2 −1 1 2
−2
−1
1
2
3
x
(IV)
1. Which could be a graph ofcf(x)?ANSWER:(III) and (IV). In (III) the graph could be−1/2f(x) and in (IV) the graph could be2f(x).COMMENT:You could ask students to verbalize the relationship between f(x) andcf(x) for c > 1, 0 < c < 1, andc < −1.
2. Which could be a graph off(x)− k?ANSWER:(I) could bef(x)− 1.COMMENT:You could ask students to verbalize the relationship between f(x) andf(x)− k for k > 0 andk < 0.
3. Which could be a graph off(x− h)?ANSWER:(II) could be a graph off(x + 1).COMMENT:You could ask students to verbalize the relationship between f(x) andf(x− h) for h > 0 andh < 0.

20 CHAPTER ONE Hughes Hallett et al c©2005, John Wiley & Sons
4. Which of the following functions is the sum of the functions in Figures 1.11 and 1.12?
−2 −1 1 2
1
2
x
Figure 1.11
−2 −1 1 2
−2
−1
1
2
x
Figure 1.12
−2 −1 1 2
−2
−1
1
2
x
(a)
−2 −1 1 2
−2
−1
1
2
x
(b)
−2 −1 1 2
−2
−1
1
2
x
(c)
−2 −1 1 2
−2
−1
1
2
x
(d)
ANSWER:(a). On the interval−1 < x < 0, the sum should be negative and concave up.COMMENT:You could follow up by asking for the graph of the difference of the functions in Figures 1.11 and 1.12 (both
differences).

CHAPTER ONE Hughes Hallett et al c©2009, John Wiley & Sons 21
5. Given the graph ofy = sin x in Figure 1.13, determine which of the graphs are those ofsin(2x) andsin(3x)?
−6 −4 −2 2 4 6
−1
1
y = sin x
x
y
Figure 1.13
−6 −4 −2 2 4 6
−1
1
x
y(I)
−6 −4 −2 2 4 6
−1
1
x
y(II)
−6 −4 −2 2 4 6
−1
1
x
y(III)
−6 −4 −2 2 4 6
−1
1
x
y(IV)
(a) (I) = sin(2x) and (II)= sin(3x)(b) (I) = sin(2x) and (III) = sin(3x)(c) (II) = sin(2x) and (III) = sin(3x)(d) (II) = sin(2x) and (IV)= sin(3x)(e) (III) = sin(2x) and (IV)= sin(3x)

22 CHAPTER ONE Hughes Hallett et al c©2005, John Wiley & Sons
ANSWER:(b). Replacingx by 2x means the first positivex-intercept will be atx = π/2, so (I) is that ofy = sin(2x). Similarly
the first positive zero ofy = sin(3x) is atx = π/3, so (III) is that ofy = sin(3x).COMMENT:Have students also determine the equation for the graphs labeled (II) and (IV).
6. Which of the graphs is that ofy =3
2 + 4e−x?
−4 −3 −2 −1 1 2 3 4
−1
x
y(a)
−4 −3 −2 −1 1 2 3 4
1
x
y(b)
−4 −3 −2 −1 1 2 3 4
1
x
y(c)
−4 −3 −2 −1 1 2 3 4
1
x
y(d)
ANSWER:(b) The graph has ay-intercept of1/2.COMMENT:You could have students tell of properties evident in the graphs of the other choices that conflict with those of
y = 3/(2 + 4e−x).

CHAPTER ONE Hughes Hallett et al c©2009, John Wiley & Sons 23
For Problems 7–13, letf andg have values given in the table.
x f(x) g(x)
−2 1 −1
−1 0 1
0 −2 2
1 2 0
2 −1 −2
7. f(g(1)) =ANSWER:g(1) = 0, sof(g(1)) = f(0) = −2.COMMENT:You can also considerf(g(x)) for x = −2 andx = 2.
8. f(g(0)) =ANSWER:g(0) = 2, sof(g(0)) = f(2) = −1.COMMENT:You can also considerf(g(x)) for x = −2 andx = 2.
9. f(g(−1)) =ANSWER:g(−1) = 1, sof(g(−1)) = f(1) = 2.COMMENT:You can also considerf(g(x)) for x = −2 andx = 2.
10. If f(g(x)) = 1, thenx =ANSWER:f(−2) = 1, andg(2) = −2, sox = 2.COMMENT:You can also considerf(g(x)) = a for a = −2,−1, 2.
11. If f(g(x)) = 0, thenx =ANSWER:f(−1) = 0, andg(−2) = −1, sox = −2.COMMENT:You can also considerf(g(x)) = a for a = −2,−1, 2.
12. If g(f(x)) = 2, thenx =ANSWER:g(0) = 2, andf(−1) = 0, sox = −1.COMMENT:You can also considerg(f(x)) = a for a = −1, 0, 1.
13. If g(f(x)) = −2, thenx =ANSWER:g(2) = −2, andf(1) = 2, sox = 1.COMMENT:You can also considerg(f(x)) = a for a = −1, 0, 1.

24 CHAPTER ONE Hughes Hallett et al c©2005, John Wiley & Sons
For Problems 14–18, let the graphs off andg be as shown in Figure 1.14. Estimate the values of the following compositefunctions to the nearest integer.
−8 −6 −4 −2 2 4 6 8
−8
−6
−4
−2
2
4
6
8
g(x)
f(x)
x
y
Figure 1.14
14. g(f(0)) ≈ANSWER:f(0) ≈ 0, sog(f(0)) ≈ g(0) ≈ 1.COMMENT:You may want to point out that sincef(0) = 0, this composition is similar to composing a function with the identity
function.
15. g(f(8)) ≈ANSWER:f(8) ≈ 8, sog(f(8)) ≈ g(8) ≈ 5.COMMENT:You may want to point out that sincef(8) = 8, this composition is similar to composing a function with the identity
function.
16. g(f(3)) ≈ANSWER:f(3) ≈ 1, sog(f(3)) ≈ g(1) ≈ 2.COMMENT:When you are computingg(f(a)) from the graphs ofg andf , it is not always necessary to computef(a). For
example, when the horizontal and vertical scales are the same, you can measure the height off(a) with a straightedge.This distance placed on thex-axis is the new value from which to measure the height ofg. The result will beg(f(a)).
17. f(g(2)) ≈ANSWER:g(2) ≈ 3, sof(g(2)) ≈ f(3) ≈ 1.COMMENT:See the Comment for Problem 16.
18. f(g(−1)) ≈ANSWER:g(−1) ≈ 0, sof(g(−1)) ≈ f(0) ≈ 0.COMMENT:See the Comment for Problem 16.

CHAPTER ONE Hughes Hallett et al c©2009, John Wiley & Sons 25
19. If f(x) =√
x2 + 1 andg(x) = ex2
thenf(g(x)) =
(a) e(x2+1)
(b)√
e2x2 + 1
(c) e√
x2+1
(d)√
ex4 + 1
ANSWER:(b) Substitutingg(x) into f(x) gives
f(g(x)) =
√
(
ex2)2
+ 1 =√
e2x2 + 1.
COMMENT:
Students have trouble simplifying(
ex2)2
. Next you could have them computeg(f(x)).
20. For which values ofm, n, andb is f(g(x)) = g(f(x)) if f(x) = x + n andg(x) = mx + b?
(a) m = 1, n andb could be any number(b) n = 1, m andb could be any number(c) n = 0, m andb could be any number(d) m = 1, n andb could be any number, orn = 0, m andb could be any number.
ANSWER:(d). After the composition we have:mx + b + n = mx + mn + b. Thusmn = n which impliesm = 1 or n = 0.COMMENT:This provides an opportunity to point out the difference between subtracting the same quantity from both sides
(always allowable) and canceling the same term from both sides (sometimes letting you lose information liken = 0).

26 CHAPTER ONE Hughes Hallett et al c©2005, John Wiley & Sons
21. Given the graphs of the functionsg andf in Figures 1.15 and 1.16, which of the following is a graph off(g(x))?
1 2 3
1
2
3
4
g(x)
x
y
Figure 1.15
1 2 3
1
2
3
4
f(x)
x
y
Figure 1.16
1 2 3
1
2
3
4
x
y(a)
1 2 3
1
2
3
4
x
y(b)
1 2 3
1
2
3
4
x
y(c)
1 2 3
1
2
3
4
x
y(d)
ANSWER:(a). Becausef(x) = x, we havef(g(x)) = g(x).COMMENT:Follow-up Question. Which graph representsg(f(x))?

CHAPTER ONE Hughes Hallett et al c©2009, John Wiley & Sons 27
For Problems 22–23, consider the four graphs.
−1 1
−2
−1
1
2
x
(I)
−1 1
−2
−1
1
2
x
(II)
−1 1
−2
−1
1
2
x
(III)
−1 1
−2
−1
1
2
x
(IV)
22. Which of these graphs could represent even functions?ANSWER:(III) could be the graph of an even function.COMMENT:You could ask students to give geometric and analytic definitions here.
23. Which of these graphs could represent odd functions?ANSWER:(II) and (IV) could be graphs of odd functions.COMMENT:You could ask students to give geometric and analytic definitions here.

28 CHAPTER ONE Hughes Hallett et al c©2005, John Wiley & Sons
24. Which of the following could be graphs of functions that have inverses?
1 2
−1
1
2
3
x
(a)
−0.5 1
−2
−1
1
2
x
(b)
−2 −1 1 2
−3
−2
−1
1
2
3
x
(c)
−2 −1 1 2
−1
1
2
x
(d)
ANSWER:(b) and (c). Because these graphs pass the horizontal line test, they could have inverses.COMMENT:You might redefine the other two functions by limiting their domains so they will have inverses.
25. If P = f(t) = 3 + 4t, find f−1(P )ANSWER:
If P = 3 + 4t, thenP − 3 = 4t andt =P − 3
4. Thusf−1(P ) =
P − 3
4.
COMMENT:You could also usef(t) = 3 + 8t3, which uses a bit more algebra.

CHAPTER ONE Hughes Hallett et al c©2009, John Wiley & Sons 29
26. Which of the following graphs represents the inverse of the function graphed in Figure 1.17?
1 2 3 4
1
2
3
4
x
y
Figure 1.17
1 2
1
2
3
4
x
y(a)
1 2 3 4
1
2
3
4
x
y(b)
1 2 3 4
1
2
3
4
x
y(c)
1 2 3 4
1
2
3
4
x
y(d)
ANSWER:(d). The graph of the inverse is a reflection of the function across the liney = x.COMMENT:You could ask the students why each of the other choices failsto be the inverse.

30 CHAPTER ONE Hughes Hallett et al c©2005, John Wiley & Sons
ConcepTests and Answers and Comments for Section 1.4
1. Which is a graph ofy = ln x?
1 2 3 4 5 6 7 8 9
10
20
30
40
50
60
70
80
90
100
x
y(a)
−3 −2 −1 1 2 3
1
2
3
4
5
6
7
8
9
10
x
y(b)
1 2 3 4 5 6 7 8 9
−3
−2
−1
1
2
3
x
y(c)
1 2 3 4 5 6 7 8 9
−3
−2
−1
1
2
3
x
y(d)
ANSWER:(c). y = ln x is an increasing function passing through the point(1, 0).COMMENT:You could discuss which properties each of the remaining graphs possess that made the student conclude that it was
not an appropriate choice.Follow-up Question. Find possible formulas for the remaining graphs.Answer. (a)y = x2, (b) y = ex, and (d)y = − ln x.

CHAPTER ONE Hughes Hallett et al c©2009, John Wiley & Sons 31
2. The graph in Figure 1.18 could be that of
(a) y = ln x +1
2
(b) y = ln x− 1
2
(c) y = ln(
x +1
2
)
(d) y = ln(
x− 1
2
)
−1 1 2
−2
−1
1
x
Figure 1.18
ANSWER:(c). Note that (a) is the graph ofln x shifted up1
2, (b) is shifted down1
2, (d) is shifted to the right1
2.
COMMENT:You could also distinguish the four graphs by their horizontal intercepts.
3. Which of the following functions have vertical asymptotes ofx = 3?
(a) y = ln(
x
3
)
(b) y = ln(x− 3)(c) y = ln(x + 3)(d) y = 3 ln x
ANSWER:(b). Note that (a) and (d) have vertical asymptotes atx = 0, while (c) has one atx = −3, and (b) has one atx = 3,
as desired.COMMENT:Follow-up Question. Do any of these functions have horizontal asymptotes? If so,what are they?Answer. No, the range of these functions is all real numbers.
4. Without caculating the following quantities, use the properties of logarithms to decide which of them is largest.
(a) ln(30)− ln(2)(b) 2 ln 4(c) ln 3 + ln 4
(d)ln 4
ln 2ANSWER:
(b). ln(30) − ln(2) = ln(15), 2 ln(4) = ln(16), ln(3) + ln(4) = ln(12), andln(4)
ln(2)=
ln(22)
ln 2=
2 ln 2
ln 2= 2 =
ln(e2). Sincee2 < 9 andln x is an increasing function,ln(16) is the largest number.COMMENT:Point out that using the rules of logarithms enables us to compare exact values. If the comparison were made using
a computer or calculator, we would likely be comparing approximate values.

32 CHAPTER ONE Hughes Hallett et al c©2005, John Wiley & Sons
5. The graph of a logarithmic function has a horizontal asymptote.
(a) True(b) False
ANSWER:(b). The range of logarithmic functions consists of all realnumbers.COMMENT:You could also ask about vertical asymptotes.
6. ln(
M −N
M + N
)
=
(a) 2 ln M(b) 2 ln N(c) −2 ln N(d) ln(M −N)− ln(M + N)
ANSWER:(d)COMMENT:
Follow-up Question. What is the value ofln
(
M2 −N2
M −N
)
?
Answer. ln(M + N).
7. If log10(x− a) = n, thenx =
(a) 10a+n
(b) a + 10n
(c) n + 10a
(d) n + a10
ANSWER:(b). Compose each side with the exponential function10x since it is the inverse function oflog10 x.COMMENT:You could ask the same question with the natural logarithm rather than the logarithm base 10.
8. Which of the following functions are increasing and concave up?
(a) 3−x
(b) 3x
(c) ln x(d) − ln x
ANSWER:(b). Note that (a) and (d) are decreasing, and (c) is concave down.COMMENT:You could also ask about asymptotes (horizontal and vertical) and intercepts for all four functions.
9. Which of the following functions are decreasing and concave up?
(a) − ln(4 + x)(b) 3x−4
(c) 34−x
(d) ln(4− x)
ANSWER:(a) and (c). Note that (b) is increasing and (d) is concave down.COMMENT:You could also ask about asymptotes (horizontal and vertical) and intercepts for all four functions.

CHAPTER ONE Hughes Hallett et al c©2009, John Wiley & Sons 33
10. Which of the following donot have a horizontal asymptote?
(a) y = ln x
(b) y =1
x(c) y = 5x
(d) y = x1/3
ANSWER:(a) and (d). The range ofln x andx1/3 is all real numbers.COMMENT:Follow-up Question. Which of the above functions doesnot have any asymptotes?Answer. (d). The domain and range ofy = x1/3 is all real numbers.
11. Give a formula for the inverse of the following function:
P = f(t) = 16e14t
(a) f−1(P ) =1
16e−14P
(b) f−1(P ) =(
ln 16
14
)
P
(c) f−1(P ) =114
ln P
ln 16
(d) f−1(P ) =1
14ln
(
P
16
)
ANSWER:(d). If P = 16e14t, then P
16= e14t andln
(
P16
)
= 14t. This givest = 114
ln(
P16
)
.COMMENT:
Students may find thatf−1(P ) =1
14(ln P − ln 16). This would be an excellent time to review the properties of
logarithms. For an alternate question, you could also usef(t) = 2− e−3t.
12. Give a formula for the inverse of the following function:
P = f(t) = 16 ln(14t)
(a) f−1(P ) =1
14e16P
(b) f−1(P ) =1
14eP/16
(c) f−1(P ) =1
14ln
(
P
16
)
(d) f−1(P ) =(
ln 16
14
)
P
ANSWER:
(b). If P = 16 ln(14t), then P16
= ln(14t) andeP/16 = 14t. This givest =eP/16
14.
COMMENT:You could also usef(t) = 6 + 2 ln(3t− 1).
13. Solve forx if 8y = 3ex.
(a) x = ln 8 + ln 3 + ln y(b) x = ln 3− ln 8 + ln y(c) x = ln 8 + ln y − ln 3(d) x = ln 3− ln 8− ln y
ANSWER:
(c). If 8y = 3ex, then8y
3= ex andln
(
8y
3
)
= x, sox = ln 8 + ln y − ln 3.
COMMENT:This is a good place to point out the many ways answers can be expressed using logarithms.

34 CHAPTER ONE Hughes Hallett et al c©2005, John Wiley & Sons
14. Solve forx if y = e + 2x.
(a) x =ln y − 1
ln 2
(b) x =ln(y − 1)
ln 2
(c) x =ln y
ln 2− 1
(d) x =ln(y − e)
ln 2
ANSWER:
(d). If y = e + 2x, y − e = 2x andln(y − e) = x ln 2. This givesx =ln(y − e)
ln 2.
COMMENT:You could ask what errors could have been made in obtaining the other choices.
15. For what value ofx is 3 · 3−x + 4 = 16− 3−x?ANSWER:If 3 · 3−x + 4 = 16− 3−x, then(3 + 1)3−x = 16− 4 = 12. Division gives3−x = 3, so−x = 1 andx = −1.COMMENT:Students may try to take logarithms of both sides of the original equation.
ConcepTests and Answers and Comments for Section 1.5
1. The amplitude and period of the graph of the periodic function in Figure 1.19 are
(a) Amplitude: 2. Period: 2.(b) Amplitude: 2. Period: 3.(c) Amplitude: 2. Period:1/2.(d) Amplitude: 3. Period: 2.(e) Amplitude: 3. Period:1/2.
−3 −2 −1 1 2 3
−2
−1
1
2
3
4
5
6
x
Figure 1.19
ANSWER:
(d). The maximum value of the function is 5, and the minimum value is−1, so the amplitude is5− (−1)
2= 3. The
function repeats itself after 2 units, so the period is 2.COMMENT:Point out that the function is oscillating about the liney = 2. Have the students find a formula for the function shown
in Figure 1.19.

CHAPTER ONE Hughes Hallett et al c©2009, John Wiley & Sons 35
2. The amplitude and period of the graph of the periodic function in Figure 1.20 are
(a) Amplitude: 2. Period: 2.(b) Amplitude: 2. Period: 3.(c) Amplitude: 2. Period:1/2.(d) Amplitude: 3. Period: 2.(e) Amplitude: 3. Period:1/2.
−1 1
−2
−1
1
2
3
4
5
6
x
Figure 1.20
ANSWER:
(c). The maximum value of the function is 5 and the minimum is 1, so the amplitude is5− 1
2= 2. The function
repeats itself after1/2 unit, so the period is1/2.COMMENT:It is easiest to find the period using the extreme values of thefunction.
3. Which of the following could describe the graph in Figure 1.21.
(a) y = 3 sin(
x
2+
π
2
)
(b) y = 3 sin(
2x +π
2
)
(c) y = 3 cos(2x)
(d) y = 3 cos(
x
2
)
(e) y = 3 sin(2x) (f) y = 3 sin(
x
2
)
−6 −4 −2 2 4 6
−4
−3
−2
−1
1
2
3
4
x
y
Figure 1.21
ANSWER:(a) and (d). Note that (b), (c), and (e) have periodπ, with the rest having period4π. Answer (f) hasy(0) = 0. (a) and (d)could describe the graph.
COMMENT:The fact that the same graph may have more than one analytic representation could be emphasized here.

36 CHAPTER ONE Hughes Hallett et al c©2005, John Wiley & Sons
4. Figure 1.22 shows the graph of which of the following functions?
(a) y = cos(x + π/6)(b) y = cos(x− π/6)(c) y = sin(x− π/6)(d) y = sin(x + π/6)(e) None of these
π/2 π 3π/2 2π
−1
1
x
y
Figure 1.22
ANSWER:(b)COMMENT:You could ask what the graphs of the other choices look like.

CHAPTER ONE Hughes Hallett et al c©2009, John Wiley & Sons 37
5. Which of the graphs are those ofsin(2t) andsin(3t)?
(a) (I) = sin(2t) and (II)= sin(3t)(b) (I) = sin(2t) and (III) = sin(3t)(c) (II) = sin(2t) and (III) = sin(3t)(d) (III) = sin(2t) and (IV)= sin(3t)
−3π/2 −π/2 π/2 3π/2
−1
1
t
y(I)
−3π/2 −π/2 π/2 3π/2
−1
1
t
y(II)
−3π/2 −π/2 π/2 3π/2
−1
1
t
y(III)
−3π/2 −π/2 π/2 3π/2
−1
1
t
y(IV)
ANSWER:(b). The period is the time needed for the function to executeone complete cycle. Forsin(2t), this will beπ and for
sin(3t), this will be2π/3.COMMENT:You could ask what equations describe the graphs of (II) and (IV). This question is the same as Question 5 in Section
1.3.
38 CHAPTER ONE Hughes Hallett et al c©2005, John Wiley & Sons
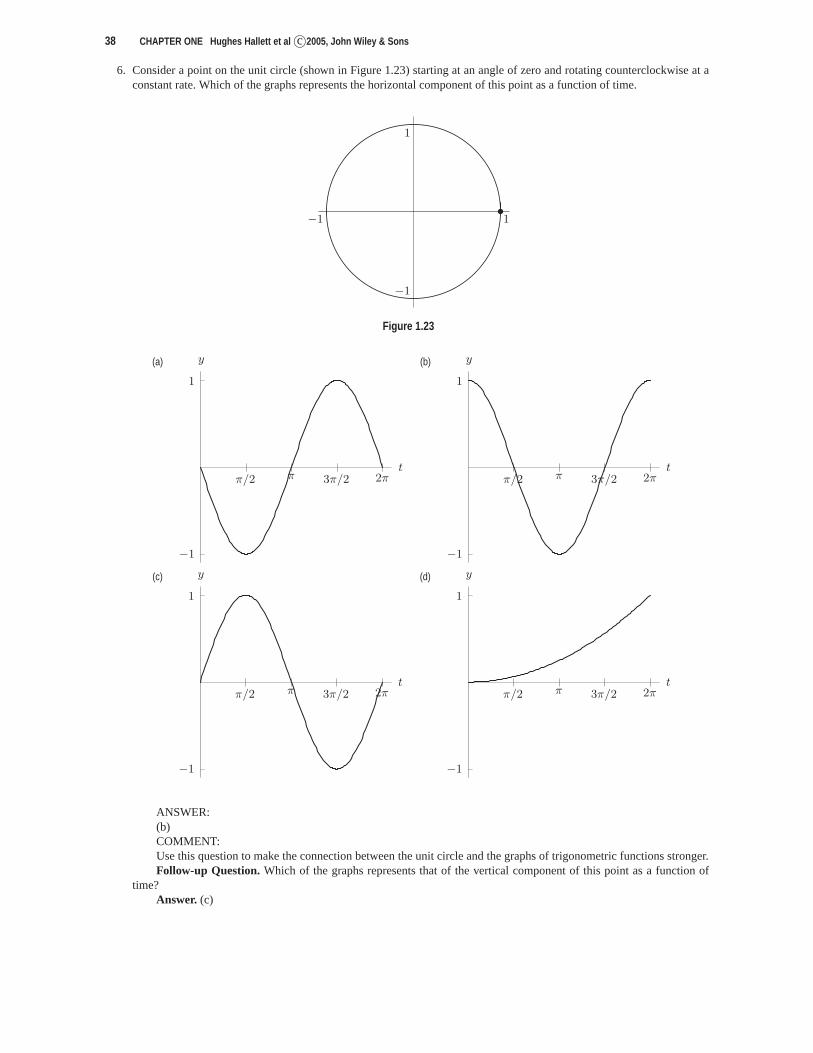
6. Consider a point on the unit circle (shown in Figure 1.23) starting at an angle of zero and rotating counterclockwise ataconstant rate. Which of the graphs represents the horizontal component of this point as a function of time.
−1 1
−1
1
Figure 1.23
π/2 π 3π/2 2π
−1
1
t
y(a)
π/2 π 3π/2 2π
−1
1
t
y(b)
π/2 π 3π/2 2π
−1
1
t
y(c)
π/2 π 3π/2 2π
−1
1
t
y(d)
ANSWER:(b)COMMENT:Use this question to make the connection between the unit circle and the graphs of trigonometric functions stronger.Follow-up Question. Which of the graphs represents that of the vertical component of this point as a function of
time?Answer. (c)

CHAPTER ONE Hughes Hallett et al c©2009, John Wiley & Sons 39
7. Which of the following is the approximate value for the sine and cosine of anglesA andB in Figure 1.24?
−1 1
−1
1
A
B
Figure 1.24
(a) sin A ≈ 0.5, cos A ≈ 0.85, sin B ≈ −0.7, cos B ≈ 0.7(b) sin A ≈ 0.85, cos A ≈ 0.5, sin B ≈ −0.7, cos B ≈ 0.7(c) sin A ≈ 0.5, cos A ≈ 0.85, sin B ≈ 0.7, cos B ≈ 0.7(d) sin A ≈ 0.85, cos A ≈ 0.5, sin B ≈ 0.7, cos B ≈ 0.7
ANSWER:(b)COMMENT:You could use this question to make the connection between the unit circle and the trigonometric functions stronger.
You could also identify other points on the circle and ask forvalues of sine or cosine.
8. Figure 1.25 shows the graph of which of the following functions?
π/2 π 3π/2 2π
−1
1
x
y
Figure 1.25
(a) y = sin(x− π/3)(b) y = cos(x− π/3)(c) y = sin(x + π/3)(d) y = cos(x + π/3)(e) None of these
ANSWER:(c)COMMENT:You could ask what the graphs of the other choices look like.

40 CHAPTER ONE Hughes Hallett et al c©2005, John Wiley & Sons
9. Which of the following are properties of bothy = arcsin x andy =x√
1− x2?
(a) y(0) = 0(b) Increasing everywhere(c) Concave down forx < 0(d) Domain:[−1, 1](e) Range:(−∞,∞)
ANSWER:(a), (b), and (c). The domain ofy =
x√1− x2
is (−1, 1) and the range ofarcsin x is [−π/2, π/2].
COMMENT:You may want to have the students sketch graphs of both functions.Follow-up Question. What is the concavity for each function whenx > 0?Answer. Both functions are concave up whenx > 0.
10. Which of the following have the same domain?
(a) arcsin x(b) arctan x(c) ln x(d) ex
(e)√
1− x2
ANSWER:(a) and (e), also (b) and (d). Note that the domain ofarcsin x and
√1− x2 is [−1, 1], the domain ofarctan x and
ex is (−∞,∞).COMMENT:Students could be thinking of the range ofsin x for (a) and the range oftan x for (b).Follow-up Question. Does changing (c) toln |x| affect the answer?Answer. No, because the domain ofln |x| is all real numbers exceptx = 0.
11. Which of the following have the same range?
(a) arcsin x(b) arctan x(c) ln x(d) ex
(e)√
1− x2
ANSWER:(a) and (b). The range of (a) and (b) is
[
−π
2,π
2
]
.
COMMENT:Follow-up Question. Does changing (c) to| ln x| affect the answer?Answer. No, the range of| ln x| is [0,∞) while the range ofex is (0,∞).
12. If y = arcsin x, thencos y =
(a)√
1− x2
(b)√
x2 − 1
(c)1√
x2 − 1
(d)1√
1− x2
(e)1
x
ANSWER:(a). If y = arcsin x, then−π
2< y < π
2giving cos y =
√
1− sin2 y =√
1− x2.COMMENT:You could also solve this problem by drawing a right trianglewith hypotenuse of 1 and labeling the side opposite
angley asx.

CHAPTER ONE Hughes Hallett et al c©2009, John Wiley & Sons 41
13. If y = arcsin x, thentan y =
(a)
√1− x2
x(b)
√x2 − 1
x(c)
x√x2 − 1
(d)x√
1− x2(e)
1
x
ANSWER:
(d). If y = arcsin x, then−π2
< y < π2
giving tan y =sin y
cos y=
sin y√
1− sin2 y=
x√1− x2
.
COMMENT:You could also solve this problem by drawing a right trianglewith hypotenuse of 1 and labeling the side opposite
angley asx.
14. If y = arctan x, thencos y =
(a)
√1 + x2
x(b)
x√x2 + 1
(c)1√
x2 + 1
(d)√
1 + x2 (e)1
xANSWER:
(c). If y = arctan x, then−π2
< y < π2
. Becausetan2 y + 1 =1
cos2 y,
cos y =
√
1
tan2 y + 1=
√
1
x2 + 1.
COMMENT:You could also solve this problem by drawing a right trianglewith the side opposite angley labeled asx and the side
adjacent to angley labeled as 1.
15. If y = arctan x, thensin y =
(a)
√1 + x2
x(b)
x√x2 + 1
(c)1√
x2 + 1
(d)√
1 + x2 (e)1
xANSWER:
(b). If y = arctan x, then−π2
< y < π2
andsin y = tan y cos y. Becausetan2 y + 1 =1
cos2 y, cos y =
√
1
tan2 y + 1
andsin y =x√
x2 + 1.
COMMENT:You could also solve this problem by drawing a right trianglewith the side opposite angley labeled asx and the side
adjacent to angley labeled as 1.
ConcepTests and Answers and Comments for Section 1.6
1. Graphy = x2, y = x3, y = x4, y = x5. Make at least three observations about the graphs.ANSWER:
(a) y = x2 andy = x4 have the same general shape—that of a “U”.(b) y = x3 andy = x5 have the same general shape—that of a “seat”.(c) Forx > 1, as the power increases, the function grows faster.(d) When0 < x < 1, we havex2 > x3 > x4 > x5.(e) Forx > 0, all functions are increasing and concave up.(f) All functions intersect at(1, 1) and(0, 0).(g) Forx < 0, the functionsy = x2 andy = x4 are decreasing and concave up.(h) Forx < 0, the functionsy = x3 andy = x5 are increasing and concave down.
COMMENT:This question could also be used as an exploratory activity.

42 CHAPTER ONE Hughes Hallett et al c©2005, John Wiley & Sons
2. Graphy = x−1, y = x−2, y = x−3, y = x−4. Make at least three observations about the graphs.ANSWER:
(a) y = x−2 andy = x−4 have the same general shape and they are always positive.(b) y = x−1 andy = x−3 have the same general shape.(c) As the power decreases, the function approaches 0 fasterasx increases.(d) Forx > 0, they are all concave up.(e) They intersect at(1, 1).(f) Each has a vertical asymptote atx = 0 and a horizontal asymptote aty = 0.(g) Forx < 0, the functionsy = x−2 andy = x−4 are increasing and concave up.(h) Forx < 0, the functionsy = x−3 andy = x−5 are decreasing and concave down.
COMMENT:This question could also be used as an exploratory activity.
3. Graphy = x1/2, y = x1/3, y = x1/4, y = x1/5. What do you observe about the growth of these functions?ANSWER:The smaller the power of the exponent, the slower the function grows forx > 1.COMMENT:Your students may observe other properties.
For Problems 4–8, asx→∞ which function dominates, (a) or (b)? (That is, which function is larger in the long run?)
4. (a) 0.1x2
(b) 1010xANSWER:(a). Power functions with the power greater than one and witha positive coefficient grow faster than linear functions.COMMENT:You could ask about the behavior asx→ −∞ as well.
5. (a) 0.25√
x(b) 25,000x−3
ANSWER:(a). Note that0.25
√x is an increasing function whereas25,000x−3 is a decreasing function.
COMMENT:One reason for such a question is to note that global behaviormay not be determined by local behavior.
6. (a) 3− 0.9x
(b) ln xANSWER:(b). Note that3− 0.9x has a horizontal asymptote whereas the range ofln x is all real numbers.COMMENT:Students should realize that the graph the calculator displays can be misleading.
7. (a) x3
(b) 2x
ANSWER:(b). Exponential growth functions grow faster than power functions.COMMENT:You could ask about the behavior asx→ −∞ as well.
8. (a) 10(2x)(b) 72,000x12
ANSWER:(a). Exponential growth functions grow faster than power functions, no matter how large the coefficient.COMMENT:One reason for such a question is to note that global behaviormay not be determined by local behavior.

CHAPTER ONE Hughes Hallett et al c©2009, John Wiley & Sons 43
9. List the following functions in order from smallest to largest asx→∞ (that is, asx increases without bound).
(a) f(x) = −5x(b) g(x) = 10x
(c) h(x) = 0.9x
(d) k(x) = x5
(e) l(x) = πx
ANSWER:(a), (c), (d), (e), (b). Notice thatf(x) andh(x) are decreasing functions, withf(x) being negative. Power functions
grow slower than exponential growth functions, sok(x) is next. Now order the remaining exponential functions, wherefunctions with larger bases grow faster.
COMMENT:This question was used as an elimination question in a classroom session modeled after “Who Wants to be a Million-
aire?”, replacing “Millionaire” by “Mathematician”.
10. The equationy = x3 + 2x2 − 5x− 6 is represented by which graph?
−3 −2 −1 1 2 3
−10
−8
−6
−4
−2
2
4
6
8
10
x
y(a)
−4 −3 −2 −1 1 2 3 4
−20
−15
−10
−5
5
10
15
20
x
y(b)
−4 −3 −2 −1 1 2 3 4
−10
−5
5
10
15
20
25
x
y(c)
−5 −4 −3 −2 −1 1 2 3
−100
−75
−50
−25
25
50
75
x
y(d)
ANSWER:(b). The graph will have ay-intercept of−6 and not be that of an even function.COMMENT:You may want to point out the various tools students can use tosolve this problem, i.e. intercepts, even/odd, identi-
fying the zeros, etc. You could also have students identify aproperty in each of the other choices that is inconsistent withthe graph ofy = x3 + 2x2 − 5x− 6.

44 CHAPTER ONE Hughes Hallett et al c©2005, John Wiley & Sons
11. The graph in Figure 1.26 is a representation of which function?
(a) y = 3x + 2 (b) y = (x− 2)(x + 3) (c) y = (x− 6)(x− 2)(d) y = (x− 3)(x + 2)
−5−4−3−2−1 1 2 3 4 5
−7
−3
3
7
11
15
x
y
Figure 1.26
ANSWER:(b). The graph is a parabola withx-intercepts of 2 and−3.COMMENT:You could ask students to describe the graphs of the other equations.

CHAPTER ONE Hughes Hallett et al c©2009, John Wiley & Sons 45
12. The equationy = x2 + 5x + 6 is represented by which graph?
−3 −2 −1 1 2 3
−10
−8
−6
−4
−2
2
4
6
8
10
x
y(a)
−3 −2 −1 1 2 3
−20
−15
−10
−5
5
x
y(b)
−4 −3 −2 −1 1 2 3 4
−6
−4
−2
2
4
x
y(c)
−4 −3 −2 −1 1 2 3 4
−1
1
2
3
4
x
y(d)
ANSWER:(d). The graph will be a parabola withx-intercepts of−2 and−3.COMMENT:Have students identify a property in each of the other choices that is inconsistent with the graph ofy = x2 +5x+6.

46 CHAPTER ONE Hughes Hallett et al c©2005, John Wiley & Sons
13. Which of the graphs could represent a graph ofy = ax4 + bx3 + cx2 + dx + e? Herea, b, c, d ande are real numbers,anda 6= 0.
−3 −2 −1 1 2 3
−5
5
10
15
x
y(a)
−4 −3 −2 −1 1 2 3 4
−12
−6
6
12
18
24
30
x
y(b)
−4 −3 −2 −1 1 2 3 4
−20
−15
−10
−5
5
10
15
20
x
y(c)
−3 −2 −1 1 2 3
4
8
12
16
20
x
y(d)
ANSWER:(a), (b), (c), and (d)COMMENT:Follow-up Question. What property could you observe in a graph to know it could notbe that of a fourth degree
polynomial?Answer. The graph of the function has opposite end behavior (y → ∞ asx → ∞), or the graph turns more than
three times, are a few properties students might observe.

CHAPTER ONE Hughes Hallett et al c©2009, John Wiley & Sons 47
14. Which of the graphs (a)–(d) could be that of a function with a double zero?
−3 −2 −1 1 2 3
−1
1
2
3
4
5
x
(a)
−3 −2 −1 1 2 3
−1
1
2
3
4
5
x
(b)
−3 −2 −1 1 2 3
−1
1
2
3
4
5
x
(c)
−3 −2 −1 1 2 3
−1
1
2
3
4
5
x
(d)
ANSWER:The graphs in (b) and (c) touch thex-axis, but do not cross there. So, they have double zeros.COMMENT:Students should remember that a double zero means the function will “bounce” off thex-axis.
15. Letf(x) =x2 − 1
x + 1andg(x) = x− 1, thenf(x) = g(x).
(a) True(b) False
ANSWER:(b). The domain off(x) is not equal to the domain ofg(x).COMMENT:Students should realize that some algebraic manipulationscan only be applied to functions if the domain is stated.Follow-up Question. How can you change the statement to make it true?Answer. Keepf(x) defined as in the problem, and removex = −1 from the domain ofg(x). Alternatively, replace
“f(x) = g(x)” with “ f(x) = g(x) if x 6= −1”.

48 CHAPTER ONE Hughes Hallett et al c©2005, John Wiley & Sons
16. Without using your calculator, which of the following isa graph fory =1− x2
x− 2?
−3 −2 −1 1 2 3
−20
−15
−10
−5
5
10
15
20
x
(a)
−10−8−6−4−2 2 4 6 8 10
−10
−5
5
10
15
x
(b)
−10−8−6−4−2 2 4 6 8 10
−15
−10
−5
5
10
x
(c)
−10−8−6−4−2 2 4 6 8 10
−10
−5
5
10
x
(d)
ANSWER:(c). The equation indicatesx-intercepts at±1 and a vertical asymptote atx = 2. (c) is the only graph where this
happens.COMMENT:Students should analyze the long-term behavior of the function as well as the short-term behavior (i.e. asymptotes).
You could also ask the students to analyze the similarities and differences of the functions (i.e. zeros, intercepts, etc.).

CHAPTER ONE Hughes Hallett et al c©2009, John Wiley & Sons 49
17. Which of the graphs representsy =2x
x− 2?
−4 −3 −2 −1 1 2 3 4
−8
−6
−4
−2
2
4
6
8
x
y(a)
−4 −3 −2 −1 1 2 3 4
−8
−6
−4
−2
2
4
6
8
x
y(b)
−4 −3 −2 −1 1 2 3 4
−8
−6
−4
−2
2
4
6
8
x
y(c)
−4 −3 −2 −1 1 2 3 4
−8
−6
−4
−2
2
4
6
8
x
y(d)
ANSWER:(b). The graph goes through the origin and is positive forx > 2.COMMENT:
Have students identify a property in each of the other choices that is inconsistent with the graph ofy =2x
x− 2.

50 CHAPTER ONE Hughes Hallett et al c©2005, John Wiley & Sons
18. Which of the graphs representsy =−x
x2 + x− 2?
−4 −3 −2 −1 1 2 3 4
−6
−4
−2
2
4
6
x
y(a)
−4 −3 −2 −1 1 2 3 4
−6
−4
−2
2
4
6
x
y(b)
−4 −3 −2 −1 1 2 3 4
−6
−4
−2
2
4
6
x
y(c)
−4 −3 −2 −1 1 2 3 4
−6
−4
−2
2
4
6
x
y(d)
ANSWER:(d). The graph goes through the origin and has vertical asymptotes atx = 1 and−2. It is also positive for0 < x < 1,
and for largex, the function is negative.COMMENT:You could have the students verbalize why they excluded choices (a), (b), and (c).

CHAPTER ONE Hughes Hallett et al c©2009, John Wiley & Sons 51
19. Which of the graphs representsy =2x2
x2 + x− 2?
−4 −3 −2 −1 1 2 3 4
−6
−4
−2
2
4
6
x
y(a)
−4 −3 −2 −1 1 2 3 4
−6
−4
−2
2
4
6
x
y(b)
−4 −3 −2 −1 1 2 3 4
−6
−4
−2
2
4
6
x
y(c)
−4 −3 −2 −1 1 2 3 4
−6
−4
−2
2
4
6
x
y(d)
ANSWER:(c). The graph goes through the origin and has vertical asymptotes atx = 1 and−2. It is negative for0 < x < 1,
and the function is positive for largex. Alternatively, the function has a horizontal asymptotey = 2.COMMENT:You could have the students verbalize why they excluded choices (a), (b), and (d).

52 CHAPTER ONE Hughes Hallett et al c©2005, John Wiley & Sons
20. Which of the following functions represents the higher of the two functions in Figure 1.27 divided by the lower of the twofunctions?
1 2 3
1
2
3
4
5
6
x
y
Figure 1.27
1 2 3
2
4
6
8
10
12
x
y(a)
1 2 3
1
2
x
y(b)
1 2 3
1
2
x
y(c)
1 2 3
1
2
x
y(d)
ANSWER:(d). The ratio of the higher of the two functions to the lower equals 2 atx = 0, x = 1, andx = 2.COMMENT:You might want to point out that the division is undefined whenx = 3.Follow-up Question. What does the graph of the reciprocal of this ratio look like?
Answer. y =
{
12
if x 6= 3
undefined if x = 3.

CHAPTER ONE Hughes Hallett et al c©2009, John Wiley & Sons 53
21. Which of the following functions represents the higher of the two functions in Figure 1.28 divided by the lower of the twofunctions?
1 2 3 4
1
2
3
4
5
6
7
8
x
y
Figure 1.28
1 2 3 4
1
2
x
y(a)
1 2 3 4
1
2
x
y(b)
1 2 3 4
1
2
x
y(c)
1 2 3 4
1
2
x
y(d)
ANSWER:(b). Notice this ratio starts at 2 and approaches 1 asx approaches 4.COMMENT:The division of the two functions is not defined whenx = 4.Follow-up Question. Could the graph of the reciprocal of this ratio be one of thesechoices?Answer. No, the graph of the reciprocal passes through the point(0, 1/2).

54 CHAPTER ONE Hughes Hallett et al c©2005, John Wiley & Sons
22. Which of the following functions represents the higher of the two functions in Figure 1.29 divided by the lower of the twofunctions?
1 2 3 4
1
2
3
4
5
6
7
8
x
y
Figure 1.29
1 2 3 4
1
2
3
4
5
6
7
8
x
y(a)
1 2 3 4
4
8
12
16
20
x
y(b)
1 2 3 4
1
x
y(c)
1 2 3 4
1
x
y(d)
ANSWER:(b). Because asx increases the lower graph is approaching zero faster than the upper graph, their ratio will be
increasing.COMMENT:The division of the two functions is not defined whenx = 4.Follow-up Question. Could the graph of the reciprocal of this ratio be one of thesechoices?Answer. Yes, (d), because the lower function could be a quadratic, and a quadratic function divided by a linear
function is linear where it is defined.

CHAPTER ONE Hughes Hallett et al c©2009, John Wiley & Sons 55
23. Which of the following functions represents the ratio ofthe function starting at the point(0, 8) to the function starting atthe point(0, 4) as shown in Figure 1.30.
1 2 3 4
1
2
3
4
5
6
7
8
9
x
y
Figure 1.30
1 2 3 4
−2
−1
1
2
x
y(a)
1 2 3 4
1
2
3
4
x
y(b)
1 2 3 4
1
2
3
x
y(c)
1 2 3 4
1
2
x
y(d)
ANSWER:(d). The ratio is always positive, decreasing, and less than1 after the curves cross. Alternatively, the ratio has the
value 1 whenx ≈ 3.COMMENT:Follow-up Question. Could the graph of the reciprocal of this ratio be one of the choices?Answer. No, none of these graphs passes through the point(0, 1/2).

56 CHAPTER ONE Hughes Hallett et al c©2005, John Wiley & Sons
24. Every exponential function has a horizontal asymptote.
(a) True(b) False
ANSWER:(a). The horizontal axis is a horizontal asymptote for all exponential functions.COMMENT:You may need to remind students that an exponential functionhas the formy = abx wherea 6= 0 andb > 0 but
b 6= 1.
25. Every exponential function has a vertical asymptote.
(a) True(b) False
ANSWER:(b). Exponential functions do not have vertical asymptotes. The domain for an exponential function is all real num-
bers.COMMENT:You may point out that analyzing the domain of a function is another way to decide if vertical asymptotes exist.
ConcepTests and Answers and Comments for Section 1.7
For Problems 1–6, decide whether the function is continuouson the given interval.
1. f(x) =1
x− 2on [0, 3]
ANSWER:f(x) is not continuous becausef(2) is not defined.COMMENT:Students should realize that changing the domain affects the answer. You may want to ask for the definition of
continuity on an interval.
2. f(x) =1
x− 2on [−1, 0]
ANSWER:f(x) is continuous.COMMENT:You may want to ask for the definition of continuity on an interval.
3. f(x) = etan θ on[
−π
2,π
2
]
ANSWER:f(x) is not continuous sincetan θ is a not defined forx = −π
2, π
2.
COMMENT:Follow-up Question. Is f(x) = etan θ continuous on(−π/2, π/2)?
4. f(x) =x2 − 1
x + 1on (−∞,∞)
ANSWER:f(x) is not continuous sincef(−1) is not defined.COMMENT:Ask the same question, but change the interval so thatx = −1 is not in the interval.
5. f(x) =
{
x2−1x+1
, x 6= −1
−2 , x = −1Answerf(x) is continuous.
COMMENT:You might spend more time discussing piecewise defined functions.
6. The cost of a first class stamp over the past 100 years.ANSWER:This function is not continuous. Stamp prices increase by a discrete amount.COMMENT:

CHAPTER ONE Hughes Hallett et al c©2009, John Wiley & Sons 57
Have your students describe other functions that are not continuous.
7. The range of which of the following functions can take on all values between−2 and2.
(a) y = arcsin(2x)(b) y = 2arctan x(c) y = 1 + cos x
(d) y =1
(1− x)2
(e) y =1
9− x2
ANSWER:(b). The range ofy = 2 arctan x is [−π, π], whereas that ofarcsin(2x) is
[
−π
2,π
2
]
, so the function in (a) cannot
have the value of 2. The functions in (c) and (d) are always positive, while (e) can never equal 0.COMMENT:Follow-up Question. Which functions have the same range?Answer. The range of (b) and (c) is all real numbers.
ConcepTests and Answers and Comments for Section 1.8
1. Possible criteria for a limit:As you get closer and closer to the limit point the function gets closer and closer to the limitvalue.Which of the following is an example that meets the criteria but does not have the stated limit?
(a) Asx increases to 2,f(x) = x2 gets closer and closer to 4, so the limit atx = 2 of f(x) is 4.(b) Asx increases to 100,f(x) = 1/x gets closer and closer to 0, so the limit asx goes to 100 off(x) is 0.(c) Asx increases to 3,f(x) = (1 + x)2 gets closer and closer to 16, so the limit asx goes to 3 off(x) is 16.(d) None of these show a problem with this criteria for a limit.
ANSWER:(b) meets this criteria, but this limit is1/100, not 0.COMMENT:If you do not want to talk about one-sided limits, then you maynot want to use this question.

58 CHAPTER ONE Hughes Hallett et al c©2005, John Wiley & Sons
2. Which of the graphs has anǫ andδ which would satisfy the definition of a limit atx = c?
-�δ
6?
ǫ
c
1
2
3
4
5
x
y(a)
-�δ
6?
ǫ
cx
y(b)
6?
ǫ
-�δ
c
1
2
3
4
x
y(c)
6?
ǫ
-�δ
c
−6
−4
−2
2
4
6
y
x
(d)
ANSWER:(d)COMMENT:You might want to make sure that students realize that theδ and ǫ shown should be placed on both sides ofc
andf(c), respectively. You can give students a specificy = f(x) to enter in their calculator, along with a range off(c) − ǫ < y < f(c) + ǫ and ask them to find thex-window so the graph off exits the side (rather than the top). Thenask them to explain how that could give them a valueδ which works in the limit definition.
3. Give an example of a function showing why each of the following could not be the only requirement in the definition of alimit.
(a) limx→a
f(x) = L if f(a) = L
(b) limx→a
f(x) = L if f(x) becomes closer toL asx becomes closer toa
ANSWER:
(a) Considerf(x) =
{
1/(x− a) , x 6= a
L , x = a
(b) Considerf(x) = (x− a)2 andL = −1
COMMENT:You could have students describe these examples graphically instead of giving equations.

CHAPTER ONE Hughes Hallett et al c©2009, John Wiley & Sons 59
4. Which of the following statements is true of the limit of the functionsin(1/x) asx goes to zero?
(a) If you give me a number,ǫ, no matter how small, I can always get close enough tox = 0 so thatsin(1/x) stayswithin that number of 0. Therefore the limit ofsin(1/x) asx goes to 0 is 0.
(b) If you give me a number,ǫ, no matter how small, I can always get close enough tox = 0 so thatsin(1/x) stayswithin that number of 1. Therefore the limit ofsin(1/x) asx goes to 0 is 1.
(c) If you give me a number,ǫ, no matter how small, there is no point on thex-axis close enough to 0 such thatsin(1/x)is confined to that number. Therefore the limit ofsin(1/x) does not exist.
ANSWER:(c). For any interval containing 0, the value ofsin(1/x) takes on the value of 0 an infinite number of times (at
x = 1/(nπ), wheren is an integer) andsin(1/x) takes the value of 1 an infinite number of times (atx = 2/(mπ) wherem is a member of the sequence1, 5, 9, 13, . . .).
COMMENT:Follow-up Question. What happens to the graph ofx sin(1/x) asx approaches 0?Answer. The graph ofx sin(1/x) approaches 0 asx approaches 0.
5. Possible criteria for continuity of a function at a point:If the limit of the function exists at a point, the function iscontinuousat that point.Which of the following examples fits the above criteria but isnot continuous atx = 0?
(a) f(x) = x. The limit of f(x), asx goes to 0, is 0 so this function is continuous atx = 0.(b) f(x) = x2/x. The limit of f(x), asx goes to 0, is 0 thereforef(x) is continuous atx = 0.(c) f(x) = |x|/x. The limit of f(x), asx goes to 0, is1 thereforef(x) is continuous atx = 0.(d) None of these show a problem with this criteria.
ANSWER:(b). f(0) is not defined, sof cannot be continuous atx = 0.COMMENT:You could ask students why the limit does not exist in choice (c).

60 CHAPTER ONE Hughes Hallett et al c©2005, John Wiley & Sons
6. Definition of continuity of a function at a point:If the limit of the function exists at a point and is equal to the functionevaluated at that point, then the function is continuous at that point.Which of the following is not continuous atx = c?
(a) (I) only(b) (II) only(c) (III) only(d) (I) and (II)(e) (I) and (III)(f) (II) and (III)
c
1
2
x
y(I)
c
−10
−8
−6
−4
−2
2
4
6
8
10
x
y(II)
c
−5
−4
−3
−2
−1
1
2
3
4
5
x
y(III)
ANSWER:(c)COMMENT:You could have students give reasons why the other choices are continuous functions.

Chapter Two
Chapter Two

62 CHAPTER TWO Hughes Hallett et al c©2005, John Wiley & Sons
ConcepTests and Answers and Comments for Section 2.1
For Problems 1–3, assume your car has a broken speedometer.
1. In order to find my average velocity of a trip from Tucson to Phoenix, I need
(a) The total distance of the trip(b) The highway mile markers(c) The time spent traveling(d) How many stops I made during the trip(e) A friend with a stop watch(f) A working odometer(g) None of the above
ANSWER:(a) and (c)COMMENT:The choices are intentionally vague. This is meant to provide discussion. Your students may select more than one
item.
2. In order to find my velocity at the instant I hit a speed trap,I need
(a) The total distance of the trip(b) The highway mile markers(c) The time spent traveling(d) How many stops I made during the trip(e) A friend with a stop watch(f) A working odometer(g) none of the above
ANSWER:(e) and (f). After I pass the speed trap I can watch my odometeras it increases by0.1 miles while my friend
(simultaneously) records the time it took to travel0.1 miles.COMMENT:Using (e) and (f) as the odometer increases by0.1 is a good estimate of the velocity at an instant. It may be beneficial
to point out that if the odometer measured in hundredths of a mile, then you could compute an even better estimate of theinstantaneous velocity.
3. Regarding the speed trap in Problem 2, when should your friend first start the stopwatch?
(a) When the driver of an oncoming vehicle warns you of the speed trap ahead by flashing his/her bright headlights(b) When you spot the cop(c) Either scenario(d) Neither scenario
ANSWER:(c). You can use an estimation of the average velocity before(or after) you hit the speed trap to estimate your actual
velocity.COMMENT:The focus of this discussion should be on howh can be either positive or negative in order to estimate the derivative.

CHAPTER TWO Hughes Hallett et al c©2009, John Wiley & Sons 63
4. Which graph represents an object that is slowing down where t is time andD is distance. Assume the units on each axisis the same for all graphs.
t
D(a)
t
D(b)
t
D(c)
t
D(d)
ANSWER:(c)COMMENT:Students have a good idea of what the words “slowing down” mean, but try to make the connection between the
words and slope of the tangent line at different points.

64 CHAPTER TWO Hughes Hallett et al c©2005, John Wiley & Sons
5. At approximately which integer value ofx does the graph in Figure 2.1 have each of the following slopes?
(a) −2(b) −1(c) 1(d) 2(e) 7
1 2 3 4
−2
−1
1
2
x
Figure 2.1
ANSWER:
(a) x = 1(b) x = 3(c) x = 2(d) x = 4(e) x = 0
COMMENT:An enlarged version of this figure will make it easier to estimate slopes.Follow-up Question. Put the slopes of the tangent lines occurring atx = 0.5, 1.5, 2.5, and3.5 in order from smallest
to largest.Answer. x = 3.5, x = 0.5, x = 1.5, x = 2.5

CHAPTER TWO Hughes Hallett et al c©2009, John Wiley & Sons 65
6. For the graph ofy = f(x) in Figure 2.2 arrange the following numbers in ascending order (i.e. smallest to largest).
(a) Slope of the graph wherex = 0.2(b) Slope of the graph wherex = 1.5(c) Slope of the graph wherex = 1.9(d) Slope of the line connecting the points on the graph wherex = 1.5 andx = 1.9(e) The number 1
1 2
1
2
x
Figure 2.2
ANSWER:(c), (d), (b), (e), (a)COMMENT:This is a good question for an elimination question in a classroom quiz session. One purpose for this question is to
note the relationships between the slopes at the pointsx = 1.5 andx = 1.9 and the slope of the corresponding secantline.

66 CHAPTER TWO Hughes Hallett et al c©2005, John Wiley & Sons
7. Which of the following graphs represents the position of an object that is speeding up and then slowing down?
t
distance(a)
t
distance(b)
t
distance(c)
t
distance(d)
ANSWER:(b). The instantaneous velocity is the slope of the curve at apoint. Speeding up and slowing down requires the slope
to increase and then decrease.COMMENT:This question is the same as Problem 25 in Section 1 of Chapter1, but now you can relate the instantaneous velocity
to the slope of the tangent line.

CHAPTER TWO Hughes Hallett et al c©2009, John Wiley & Sons 67
8. Which of the following graphs represents the position of an object that is slowing down?
t
distance(a)
t
distance(b)
t
distance(c)
t
distance(d)
ANSWER:(b). The instantaneous velocity is the slope of the curve at apoint. For an object slowing down this means that the
slope decreases and becomes closer to zero as time increases.COMMENT:You could have the students describe possible motion scenarios for the other choices. This question is the same as
Problem 25 in Section 1 of Chapter 1.
68 CHAPTER TWO Hughes Hallett et al c©2005, John Wiley & Sons
ConcepTests and Answers and Comments for Section 2.2
For Problems 1–2, we want to find how the volume,V , of a balloon changes as it is filled with air. We knowV (r) = 43πr3,
wherer is the radius in inches andV (r) is in cubic inches.
1. The expressionV (3)− V (1)
3− 1represents
(a) The average rate of change of the radius with respect to the volume when the radius changes from 1 inch to 3 inches.(b) The average rate of change of the radius with respect to the volume when the volume changes from 1 cubic inch to 3
cubic inches.(c) The average rate of change of the volume with respect to the radius when the radius changes from 1 inch to 3 inches.(d) The average rate of change of the volume with respect to the radius when the volume changes from 1 cubic inch to 3
cubic inches.
ANSWER:(c)COMMENT:This is a good way for students to see the formula and verbal description for average rate of change together.
2. Which of the following represents the rate at which the volume is changing when the radius is 1 inch?
(a)V (1.01)− V (1)
0.01= 12.69 in3
(b)V (0.99)− V (1)
−0.01= 12.44 in3
(c) limh→0
(
V (1 + h)− V (1)
h
)
in3
(d) All of the above
ANSWER:(d). Note that (c) is the exact rate of change while (a) and (b)approximate the rate of change.COMMENT:
Students should be aware that (b) is equivalent toV (1)− V (0.99)
0.01.
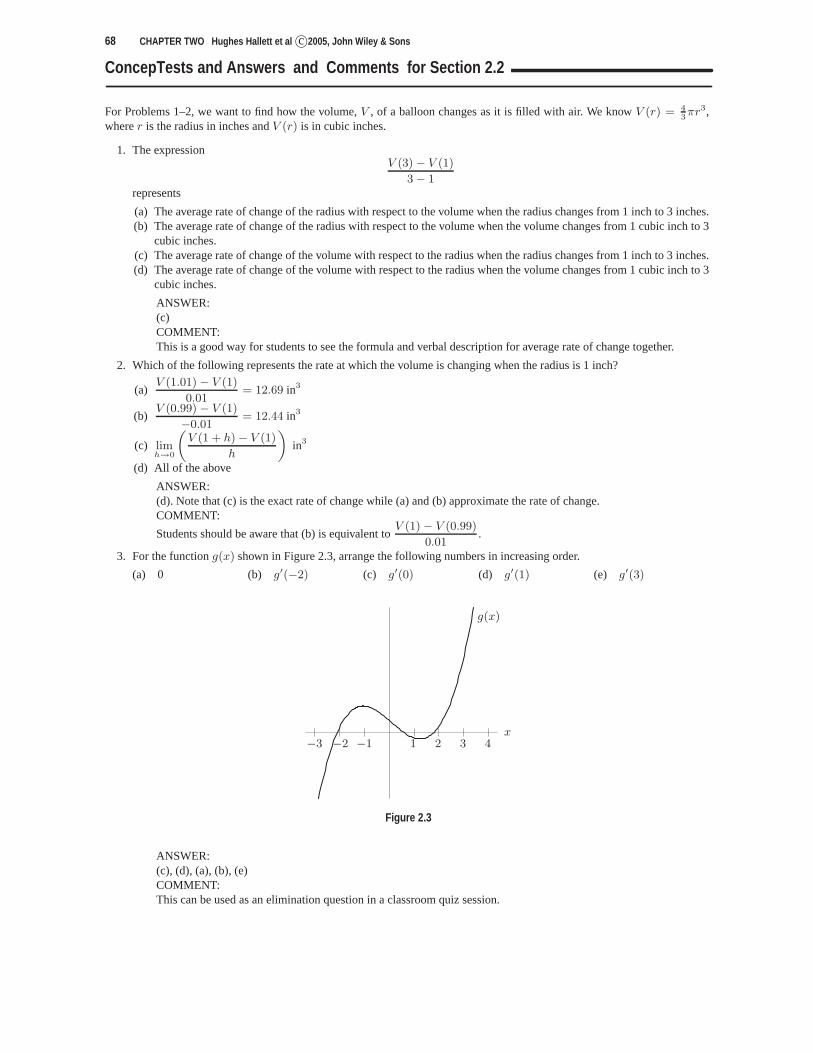
3. For the functiong(x) shown in Figure 2.3, arrange the following numbers in increasing order.
(a) 0 (b) g′(−2) (c) g′(0) (d) g′(1) (e) g′(3)
−3 −2 −1 1 2 3 4
g(x)
x
Figure 2.3
ANSWER:(c), (d), (a), (b), (e)COMMENT:This can be used as an elimination question in a classroom quiz session.

CHAPTER TWO Hughes Hallett et al c©2009, John Wiley & Sons 69
4. Which of the following expressions represents the slope of a line drawn between the two points marked in Figure 2.4 ?
(a) m =F (a) + F (b)
a + b(b) m =
F (b)− F (a)
b− a(c) m =
a
b
(d) m =F (a)− F (b)
b− a(e) m =
F (a)− F (b)
a− b
a b
F (x)
Figure 2.4
ANSWER:(b) and (e). The coordinates of the two points shown are(a, F (a)) and(b, F (b)), so the slope of the line connecting
them isF (b)− F (a)
b− a=
F (a)− F (b)
a− b.
COMMENT:You could repeat this question drawing the graph of a function that was increasing betweena andb.
5. Which of the following expressions represents the slope of a line drawn between the two points marked in Figure 2.5?
(a)F (∆x)− F (x)
∆x(b)
F (x + ∆x)− F (x)
∆x(c)
F (x + ∆x)− F (x)
x
(d)F (x + ∆x)− F (x)
x + x−∆x(e)
F (x + ∆x)− F (x)
x + ∆x
F (x)
-�∆x
x x + ∆x
Figure 2.5
ANSWER:(b). The coordinates of the two points are(x, F (x)) and(x + ∆x, F (x + ∆x)), so the slope of the line connecting
them is
m =F (x + ∆x)− F (x)
x + ∆x− x=
F (x + ∆x)− F (x)
∆x.
COMMENT:You could repeat this question drawing the graph of a function that was decreasing betweenx andx + ∆x.

70 CHAPTER TWO Hughes Hallett et al c©2005, John Wiley & Sons
6. Assume thatf is an odd function and thatf ′(2) = 3, thenf ′(−2) =
(a) 3(b) −3(c) 1/3(d) −1/3
ANSWER:(a). This is best observed graphically.COMMENT:For a strong calculus class, have the students prove the result algebraically.Follow-up Question. If f is an even function andf ′(2) = 3, then what is the value off ′(−2) =.Answer. f ′(2) = −3.
7. Letf(x) = x|x|. Thenf(x) is differentiable atx = 0.
(a) True(b) False
ANSWER:
(a).f ′(0) = limh→0
(
f(h)− f(0)
h
)
. So limh→0+
h|h|h
= limh→0+
h2
h= 0 and lim
h→0−
h|h|h
= limh→0−
−h2
h= 0. Since the
two limits exist and are equal, thenf(x) is differentiable atx = 0.COMMENT:Students often associate a minus sign with a number less than0 rather than a number multiplied by−1.

CHAPTER TWO Hughes Hallett et al c©2009, John Wiley & Sons 71
ConcepTests and Answers and Comments for Section 2.3
1. Which of the following graphs (a)–(d) could represent theslope at every point of the function graphed in Figure 2.6?
−2 −1 1 2
−2
−1
1
2
x
Figure 2.6
−2 −1 1 2
−2
−1
1
2
x
(a)
−2 −1 1 2
−2
−1
1
2
x
(b)
−2 −1 1 2
−2
−1
1
2
x
(c)
−2 −1 1 2
−2
−1
1
2
x
(d)
ANSWER:(d)COMMENT:Your students should be analyzing where the extreme values of the original function occur and then whether the
function is increasing or not. Have the students give specific reasons as to why the other three graphs could not representthe slope at every point of the function graphed in Figure 2.6.

72 CHAPTER TWO Hughes Hallett et al c©2005, John Wiley & Sons
2. Which of the following graphs (a)–(d) could represent theslope at every point of the function graphed in Figure 2.7?
−2 −1 1 2
−2
−1
1
2
x
y
Figure 2.7
−2 −1 1 2
−2
−1
1
2
x
y(a)
−2 −1 1 2
−12
−8
−4
4
8
12
x
y(b)
−2 −1 1 2
−12
−8
−4
4
8
12
x
y(c)
−2 −1 1 2
−12
−8
−4
4
8
12
x
y(d)
ANSWER:(b). The function has negative slopes forx < 0, positive slopes forx > 0, and a zero slope forx = 0.COMMENT:You could have students explain why (a), (c), and (d) fail to be the correct answer.

CHAPTER TWO Hughes Hallett et al c©2009, John Wiley & Sons 73
3. Which of the following graphs (a)–(d) could represent theslope at every point of the function graphed in Figure 2.8?
−2 −1 1 2
−2
−1
1
2
x
y
Figure 2.8
−2 −1 1 2
−2
−1
1
2
x
y(a)
−2 −1 1 2
−2
−1
1
2
x
y(b)
−2 −1 1 2
−2
−1
1
2
x
y(c)
−2 −1 1 2
−2
−1
1
2
x
y(d)
ANSWER:(c). The function in Figure 2.8 has horizontal tangents at aboutx = ±0.7, is increasing forx < −0.7 andx > 0.7.
Thus the graph of the slope of the function will be positive for |x| > 0.7, negative for|x| < 0.7, and zero forx = ±0.7.COMMENT:You could have students explain why (a), (b), and (d) fail to be the correct answer.

74 CHAPTER TWO Hughes Hallett et al c©2005, John Wiley & Sons
4. Which of the following graphs (a)–(d) could represent theslope at every point of the function graphed in Figure 2.9?
π/2 π 3π/2 2π
−2
−1
1
2
x
y
Figure 2.9
π/2 π 3π/2 2π
−2
−1
1
2
x
y(a)
π/2 π 3π/2 2π
−2
−1
1
2
x
y(b)
π/2 π 3π/2 2π
−2
−1
1
2
x
y(c)
π/2 π 3π/2 2π
−2
−1
1
2
x
y(d)
ANSWER:(d). The original function has horizontal tangents at0, π, 2π, so the derivative will be zero there. This eliminates
choices (a) and (b). The original function is also decreasing for 0 < x < π, so its derivative must be negative in thisregion.
COMMENT:You could have students explain why (a), (b), and (c) fail to be the correct answer.

CHAPTER TWO Hughes Hallett et al c©2009, John Wiley & Sons 75
5. Which of the following graphs (a)–(d) could represent theslope at every point of the function graphed in Figure 2.10?
π/2 π 3π/2 2π
−2
−1
1
2
x
y
Figure 2.10
π/2 π 3π/2 2π
−2
−1
1
2
x
y(a)
π/2 π 3π/2 2π
−2
−1
1
2
x
y(b)
π/2 π 3π/2 2π
−2
−1
1
2
x
y(c)
π/2 π 3π/2 2π
−2
−1
1
2
x
y(d)
ANSWER:(d). The original function has horizontal tangents atx = π/2 and3π/2, so the slope of the function is zero at those
points. This eliminates (a) and (c). It is also increasing for 0 < x < π/2, so its slope of the function is positive in thisregion.
COMMENT:You could have students explain why (a), (b), and (c) fail to be the correct answer.

76 CHAPTER TWO Hughes Hallett et al c©2005, John Wiley & Sons
6. Which of the following graphs (a)–(d) could represent theslope at every point of the function graphed in Figure 2.11?
−2 −1 1 2
−2
−1
1
2
x
Figure 2.11
−2 −1 1 2
−2
−1
1
2
x
(a)
−2 −1 1 2
−2
−1
1
2
x
(b)
−2 −1 1 2
−2
−1
1
2
x
(c)
−2 −1 1 2
−2
−1
1
2
x
(d)
ANSWER:(b)COMMENT:Your students should analyze where the extreme values of theoriginal function occur and where the function is
increasing. Have the students give specific reasons as to whythe other three graphs could not represent the slope at everypoint of the function graphed in Figure 2.11.
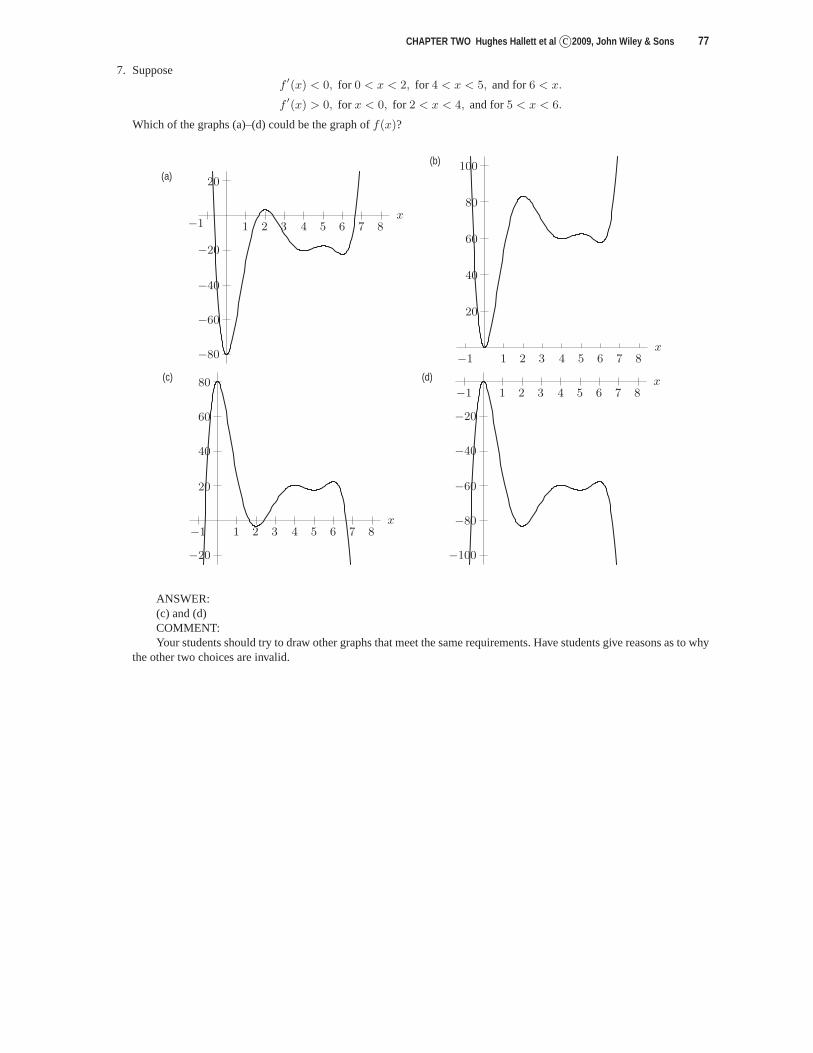
CHAPTER TWO Hughes Hallett et al c©2009, John Wiley & Sons 77
7. Supposef ′(x) < 0, for 0 < x < 2, for 4 < x < 5, and for6 < x.
f ′(x) > 0, for x < 0, for 2 < x < 4, and for5 < x < 6.
Which of the graphs (a)–(d) could be the graph off(x)?
−1 1 2 3 4 5 6 7 8
−80
−60
−40
−20
20
x
(a)
−1 1 2 3 4 5 6 7 8
20
40
60
80
100
x
(b)
−1 1 2 3 4 5 6 7 8
−20
20
40
60
80
x
(c)
−1 1 2 3 4 5 6 7 8
−100
−80
−60
−40
−20
x(d)
ANSWER:(c) and (d)COMMENT:Your students should try to draw other graphs that meet the same requirements. Have students give reasons as to why
the other two choices are invalid.

78 CHAPTER TWO Hughes Hallett et al c©2005, John Wiley & Sons
8. Which of the following graphs (a)–(d) could represent thefunction whose slope at every point is graphed in Figure 2.12?
1 2 3 4 5
1
x
y
Figure 2.12
1 2 3 4 5
1
2
3
4
5
x
y(a)
1 2 3 4 5
1
x
y(b)
1 2 3 4 5
1
2
3
x
y(c)
1 2 3 4 5
1
2
3
4
5
6
x
y(d)
ANSWER:(a). Because Figure 2.12 shows a constant value of 1, the original function will be a line with slope 1.COMMENT:This question (and the ones following) are meant to help students realize that they can think about the slope of a
function from two viewpoints, either first using the function to find the slope at each point, or being given the slope atevery point and then trying to recover the function. This should help them when they begin studying antiderivatives.

CHAPTER TWO Hughes Hallett et al c©2009, John Wiley & Sons 79
9. Which of the following graphs (a)–(d) could represent thefunction whose slope at every point is graphed in Figure 2.13?
1 2 3 4 5
1
2
3
4
5
x
y
Figure 2.13
1 2 3 4 5
1
x
y(a)
1 2 3 4 5
3
6
9
12
15
x
y(b)
1 2 3 4 5
1
2
3
x
y(c)
1 2 3 4 5
2
4
6
8
10
12
14
x
y(d)
ANSWER:(d). The graph of the slope is positive, and increasing from 0to 5 asx goes from 0 to 5, therefore the function must
be increasing and concave up.COMMENT:See Comment for Problem 8.

80 CHAPTER TWO Hughes Hallett et al c©2005, John Wiley & Sons
10. Which of the following graphs (a)–(d) could represent the function whose slope at every point is graphed in Figure 2.14?
1 2 3 4 5 6
−4
−3
−2
−1
1
2
3
4
x
y
Figure 2.14
1 2 3 4 5 6
−1
1
x
y(a)
1 2 3 4 5 6
−1
1
x
y(b)
1 2 3 4 5 6
1
2
3
x
y(c)
1 2 3 4 5 6
1
2
3
4
5
x
y(d)
ANSWER:(d). Since the graph of the slope is decreasing at every point, the function will be concave down. The graph of the
function needs an initial slope of 3 and a horizontal tangentatx = 3.COMMENT:See Comment for Problem 8.

CHAPTER TWO Hughes Hallett et al c©2009, John Wiley & Sons 81
11. Which of the following graphs (a)–(d) could represent the function whose slope at every point is graphed in Figure 2.15?
π/2 π
1
x
y
Figure 2.15
π/2 π
−1
1
x
y(a)
π/2 π
−1
1
x
y(b)
π/2 π
1
2
x
y(c)
π/2 π
1
x
y(d)
ANSWER:(c). The graph of the slope is positive at every point, so the function must be increasing.COMMENT:See Comment for Problem 8.

82 CHAPTER TWO Hughes Hallett et al c©2005, John Wiley & Sons
12. Which of the following graphs (a)–(d) could represent the function whose slope at every point is graphed in Figure 2.16?
−3 −2 −1 1 2 3
−25
−15
−5
5
15
25
x
y
Figure 2.16
−3 −2 −1 1 2 3
5
10
15
20
25
x
y(a)
−3 −2 −1 1 2 3
−1
1
x
y(b)
−3 −2 −1 1 2 3
−1
1
x
y(c)
−3 −2 −1 1 2 3
−25
−15
−5
5
x
y(d)
ANSWER:(a) and (d). The graph of the slope at every point increases from a negative value atx = −3, to a slope of zero at
x = 0, to a positive value forx > 0.COMMENT:See Comment for Problem 8.

CHAPTER TWO Hughes Hallett et al c©2009, John Wiley & Sons 83
13. Which of the following is a graph of a function that is equal to its own derivative, that is,f ′(x) = f(x).
−2 −1 1 2
−2
−1
1
2
x
y(a)
−2 −1 1 2 3 4 5
1
2
3
4
5
6
7
x
y(b)
−5 −4 −3 −2 −1 1 2
1
2
3
4
5
6
7
x
y(c)
−2 −1 1 2
1
2
3
4
x
y(d)
ANSWER:(c). The slope of the curve in (a) is always positive while thefunction has both positive and negative values, so
f ′(x) 6= f(x). The slope of the curve in (b) is always negative, while the function has only positive values, sof ′(x) 6=f(x). In (c), both the function and its slope are positive, and theslope at(0, 1) appears to be 1. The function and slopeincrease together, sof ′(x) = f(x). The graph in (d) has only positive values while its slope hasboth positive and negativevalues, sof ′(x) 6= f(x).
COMMENT:You could have students suggest formulas for the graphs in each choice.

84 CHAPTER TWO Hughes Hallett et al c©2005, John Wiley & Sons
14. Which of the following is a graph of a function that is equal to the negative of its own derivative, that is,f(x) = −f ′(x).
−2 −1 1 2
1
2
3
4
x
y(a)
−2 −1 1 2
1
2
3
4
x
y(b)
−2 −1 1 2 3 4 5
1
2
3
4
5
6
7
x
y(c)
−2 −1 1 2
−2
−1
1
2
x
y(d)
ANSWER:(c). With f(x) = −f ′(x), the function will have positive slopes where it is negativeand negative slopes where it is
positive. This rules out (b) and (d). Withf(x) = −f ′(x), as the function gets larger, the slope will be steeper. Thisrulesout (a). The slope in (c) at(0, 1) appears to be−1.
COMMENT:You could have students suggest formulas for the graphs in each choice.

CHAPTER TWO Hughes Hallett et al c©2009, John Wiley & Sons 85
15. Which of the following graphs (a)–(d) could represent the slope at every point of the function graphed in Figure 2.17?
−2 −1 1 2
−6−5−4−3−2−1
123456
x
y
Figure 2.17
−2 −1 1 2
−4
−3
−2
−1
1
2
3
4
x
y(a)
−2 −1 1 2
−35
−30
−25
−20
−15
−10
−5
5
10
x
y(b)
−2 −1 1 2
−10
−5
5
10
15
20
25
30
35
x
y(c)
−2 −1 1 2
−4
−3
−2
−1
1
2
3
4
x
y(d)
ANSWER:(c). The graph of the function in Figure 2.17 has horizontal tangents atx ≈ 0,−1.6, 1.6, is increasing forx < −1.6
andx > 1.6, and is decreasing for−1.6 < x < 1.6. Thus, the derivative will be positive forx < −1.6 andx > 1.6,negative for0 < |x| < 1.6, and zero forx ≈ 0,−1.6, 1.6.
COMMENT:You could have students explain why (a), (b), and (d) fail to be the correct answer.

86 CHAPTER TWO Hughes Hallett et al c©2005, John Wiley & Sons
16. If f ′(x) = g′(x), thenf(x) = g(x).
(a) True(b) False
ANSWER:(b). If f ′(x) = g′(x), thenf(x) = g(x) + C, whereC is some constant.COMMENT:You might point out that the graphs off andg differ by a vertical shift. A student’s instinct is to answerTrue. Have
students suggest their own counterexamples.
17. If y = π5, theny′ = 5π4.
(a) True(b) False
ANSWER:(b). Sinceπ5 is a constant, theny′ = 0.COMMENT:This question seems remarkably obvious in class. However, on an exam students tend to miss this question.
18. If y = (x + 1)(x + 2)(x + 3)(x + 4), thend5y
dx5= 0.
(a) True(b) False
ANSWER:(a).y is a polynomial of degree four.COMMENT:Make sure your students realize that they don’t need to take aderivative to answer this question.
ConcepTests and Answers and Comments for Section 2.4
For Problems 1–3, the functionC(r) is the total cost of paying off a car loan borrowed at an interest rate ofr% per year.
1. What are the units ofC′(r) =dC
dr?
(a) Year/$ (b) $/Year (c) $/(%/Year) (d) (%/Year)/$
ANSWER:(c)COMMENT:Remind students that many times looking at the units will help them solve the problem.
2. What is the practical meaning ofC′(5)?
(a) The rate of change of the total cost of the car loan isC′(5).(b) If the interest rate increases by 1%, then the total cost of the loan increases by aboutC′(5).(c) If the interest rate increases by 1%, then the total cost of the loan increases by aboutC′(5) when the interest rate is
5%.(d) If the interest rate increases by 5%, then the total cost of the loan increases by aboutC′(5).
ANSWER:(c). C′(5) requires the interest rate to be 5%.COMMENT:This problem is designed to help students make connections between real-world problems and mathematical con-
cepts.
3. What is the sign ofC′(5)?
(a) Positive(b) Negative(c) Not enough information
ANSWER:(a). If the interest rate increases, then the total car loan cost also increases, thusC′(5) is positive.COMMENT:Students don’t always realize how to make connections between real-world problems and mathematical concepts.

CHAPTER TWO Hughes Hallett et al c©2009, John Wiley & Sons 87
For Problems 4–5, you invest $1000 at an annual interest rateof r%, compounded continuously. At the end of 10 years, youhave a balance ofB dollars, whereB = g(r).
4. What is the financial interpretation ofg(5) = 1649?
(a) Whenr is 5%,B is $1649.(b) When the interest rate is 5, you have $1649.(c) When the interest rate is 5%, there is $1649.(d) When the interest rate is 5%, then in 10 years you have a balance of $1649.
ANSWER:(d) contains the most information.COMMENT:Try to get your students to see the subtle differences between the four choices.
5. What is the financial interpretation ofg′(5) = 165?
(a) The balance in your account after 5 years is $165(b) The balance grows at a rate of $165 per % whenr = 5%.(c) If the interest rate increases from 5% to 6%, you would expect about $165 more in your account.(d) If the interest rate increases from 5% to 6% you would expect about $1814 in your account.
ANSWER:(c) and (d) are equivalent. (d) uses the information from theprevious problem.COMMENT:Students should start thinking of rate as an incremental change.
For Problems 6–7, assumeg(v) is the fuel efficiency, in miles per gallon, of a car going at a speed ofv miles per hour.
6. What are the units ofg′(v) =dg
dv?
(a) (miles)2/(gal)(hour)(b) hour/gal(c) gal/hour(d) (gal)(hour)/(miles)2
(e) (miles/gallon)/(miles/hour)
ANSWER:(b) (e)COMMENT:Ask students to think about the advantages and disadvantages of the two different forms of the answer.
7. What is the practical meaning ofg′(55) = −0.54?
(a) When the car is going 55 mph, the rate of change of the fuel efficiency decreasesto approximately0.54 miles/gal.(b) When the car is going 55 mph, the rate of change of the fuel efficiency decreasesby approximately 0.54 miles/gal.(c) If the car speeds up from 55 mph to 56 mph, then the fuel efficiency is approximately−0.54 miles per gallon.(d) If the car speeds up from 55 mph to 56 mph, then the car becomes less fuel efficient by approximately 0.54 miles per
gallon.
ANSWER:(b) and (d) are equivalent, with (d) containing the most information. Notice that (a) and (c) are wrong.COMMENT:Students should strive to provide descriptions that are as complete as (d).
8. LetN = f(t) be the total number of cans of cola Sean has consumed by aget in years. Interpret the following in practicalterms, paying close attention to units.
(a) f(14) = 400 (b) f−1(50) = 6(c) f ′(12) = 50 (d) (f−1)′(450) = 1/70
ANSWER:
(a) By age 14, Sean had consumed 400 cans of cola.(b) Sean had consumed 50 cans of cola by age 6.(c) At age 12 Sean was consuming approximately 50 cans of colaper year.(d) At the time Sean had consumed 450 cans of cola, it took approximately one year to consume 70 additional cans.
COMMENT:Students have a difficult time with derivatives of inverses.

88 CHAPTER TWO Hughes Hallett et al c©2005, John Wiley & Sons
For Problems 9–11, letA = f(t) be the depth of tread, in centimeters, on a radial tire as a function of the time elapsedt, inmonths, since the purchase of the tire.
9. Interpret the following in practical terms, paying closeattention to units.
(a) f(6) = 0.5 (b) f−1(0.31) = 15(c) f ′(12) = −0.015 (d) (f−1)′(0.4) = −60
ANSWER:
(a) After 6 months, the depth of tread was 0.5 cm.(b) When the depth of tread was 0.31 cm, the tire had been used for 15 months.(c) After 12 months, the depth of tread was decreasing by 0.015 cm per month.(d) When the depth of tread was 0.4 cm, it took 60 months to reduce the tread by 1 cm (or it took one month to reduce
the depth of thread by1/60 cm).
COMMENT:For a challenge have students construct a similar word problem.
10. What is the sign off ′(t)? Explain why.ANSWER:The sign off ′(t) is negative, because tread wears with use, so its depth is always decreasing.COMMENT:Follow-up Question. What wouldf ′(t) > 0 mean?
11. What is the sign of(f−1)′(A)? Explain why.ANSWER:A = f(t) is a decreasing function, so its inverse will also be decreasing, and(f−1)′(A) will be negative.COMMENT:This reasoning might be pointed out graphically.
ConcepTests and Answers and Comments for Section 2.5
1. The graph off(x) is shown in Figure 2.18. Which of the following are true forf as shown in this window?
(a) f(x) is positive (b) f(x) is increasing (c) f ′(x) is positive(d) f ′(x) is increasing (e) f ′′(x) is non-negative
f(x)
x
Figure 2.18
ANSWER:(b), (c), (d), and (e)COMMENT:You could repeat this problem with other graphs.

CHAPTER TWO Hughes Hallett et al c©2009, John Wiley & Sons 89
2. If f ′(x) is positive, thenf ′′(x) is increasing.
(a) True(b) False
ANSWER:(b). f ′(x) positive meansf(x) is increasing.f ′(x) = x4 − 8x2 + 18 provides a counterexample.COMMENT:Have students provide their own counterexample. You might also phrase this question in terms of concavity and give
graphical counterexamples.
3. If f ′(x) is increasing, thenf(x) is increasing.
(a) True(b) False
ANSWER:(b). If f ′(x) is increasing, then the only acceptable conclusion is thatf(x) is concave up. For an example, consider
f ′(x) = 2x, then a possibility forf(x) is x2 which is not always increasing.COMMENT:Have students provide their own counterexample. You might also phrase this question in terms of concavity and give
graphical counterexamples.
4. If f ′′(x) is positive, thenf(x) is concave up.
(a) True(b) False
ANSWER:(a)COMMENT:You could ask what is true iff ′′(x) < 0.
5. If f ′′(x) is positive, thenf ′(x) is increasing.
(a) True(b) False
ANSWER:(a)COMMENT:You might note thatf ′′(x) is the rate of change off ′(x).
6. If f ′(x) is increasing, thenf(x) is concave up.
(a) True(b) False
ANSWER:(a)COMMENT:You might note thatf ′(x) increasing meansf ′′(x) is positive.
7. If the velocity of an object is constant, then its acceleration is zero.
(a) True(b) False
ANSWER:(a)COMMENT:Follow-up Question. If the velocity is zero at a specific instant in time, does the acceleration need to be zero at that
same time also?Answer. No, a grapefruit that is tossed straight up in the air has a velocity of 0 ft/sec when the grapefruit reaches the
highest point it will travel. However, at the point the acceleration of the grapefruit is that of gravity, which is not 0 ft/sec2.

90 CHAPTER TWO Hughes Hallett et al c©2005, John Wiley & Sons
8. The value of the second derivative of the function shown inFigure 2.19 at the pointx = 1 is
(a) Positive (b) Negative
1 2
1
2
3
4
f(x)
x
y
Figure 2.19
ANSWER:(b). Asx increases, the slope of the tangent line decreases. Thus thesecond derivative is not positive.COMMENT:You could ask students if the magnitude of the second derivative of a function can be determined from the graph of
the function. It cannot. For example, consider the functionf(x) = x2. It looks almost straight in places, i.e. no concavity,which would imply that the second derivative is zero. But, the value of the second derivative is always 2.
9. In Figure 2.20, the second derivative at pointsa, b, andc is (respectively),
(a) +, 0,− (b) −, 0, + (c) −, 0,−(d) +, 0, + (e) +, +,− (f) −,−, +
a b c
4
8
12
16
f(x)
x
y
Figure 2.20
ANSWER:(b). The graph is concave down ata, so f ′′(a) ≤ 0 leaving (b), (c), and (f). The graph is concave up atc, so
f ′′(c) ≥ 0 leaving (b) and (f). The graph has an inflection point atb, sof ′′(b) = 0 leaving (b).COMMENT:See Problem 8.

CHAPTER TWO Hughes Hallett et al c©2009, John Wiley & Sons 91
10. In Figure 2.21, the second derivative at pointsa, b, andc is (respectively),
(a) +, 0,− (b) −, 0, + (c) −, 0,−(d) +, 0, + (e) 0, +, 0 (f) 0,−, 0
a b c
f(x)
x
Figure 2.21
ANSWER:(b). The graph is concave down ata, sof ′′(a) ≤ 0 leaving (b), (c), (e), and (f). The graph is concave up atc, so
f ′′(c) ≥ 0 leaving (b), (e), and (f). The graph has an inflection point atb, sof ′′(b) = 0 leaving (b).COMMENT:See Problem 8.
11. In Figure 2.22, atx = 0 the signs of the function and the first and second derivatives, in order, are
(a) +, 0, + (b) +, 0,− (c) −, +,−(d) −, +, + (e) +,−, + (f) +, +, +
−2 −1 1 2
1
2
3
4
f(x)
x
y
Figure 2.22
ANSWER:(b). At x = 0 the graph is positive, has a horizontal tangent, and is concave down.COMMENT:See Problem 8.

92 CHAPTER TWO Hughes Hallett et al c©2005, John Wiley & Sons
12. In Figure 2.23, atx = 0 the signs of the function and the first and second derivatives, in order, are
(a) −, +, + (b) −,−,− (c) −, +,−(d) −, +, + (e) +,−, + (f) +, +, +
−1 1 2
−1
1
2
f(x)
x
y
Figure 2.23
ANSWER:(e). At x = 0 the graph is positive, decreasing, and concave up.COMMENT:See Problem 8.
13. In Figure 2.24, atx = 0 the signs of the function and the first and second derivatives, in order, are
(a) +, 0, + (b) −, 0,− (c) +, 0,−(d) −, +, 0 (e) +,−, 0 (f) +, +, +
−1 1
−2
−1
f(x)
x
y
Figure 2.24
ANSWER:(d). At x = 0 the graph is negative, increasing, and has an inflection point.COMMENT:See Problem 8.

CHAPTER TWO Hughes Hallett et al c©2009, John Wiley & Sons 93
14. Which of the following graphs (a)–(d) could represent the second derivative of the function in Figure 2.25 ?
−3 −2 −1 1 2
−3
−2
−1
1
2
x
y
Figure 2.25
−2 −1 1 2
−9
−8
−7
−6
−5
−4
−3
−2
−1
x
y(a)
−2 −1 1 2
−3
−2
−1
1
2
x
y(b)
−3 −2 −1 1 2
−20
−15
−10
−5
5
x
y(c)
−3 −2 −1 1 2
−5
5
10
15
20
x
y(d)
ANSWER:(d). The graph in Figure 2.25 is concave up forx < −1.2 andx > 0.5 with inflection points atx ≈ −1.2 and0.5. It
is concave down elsewhere. So the second derivative is positive for x < −1.2 andx > 0.5, negative for−1.2 < x < 0.5,and zero atx ≈ −1.2 and0.5.
COMMENT:You could have students explain why (a), (b), and (c) fail to be the correct answer.
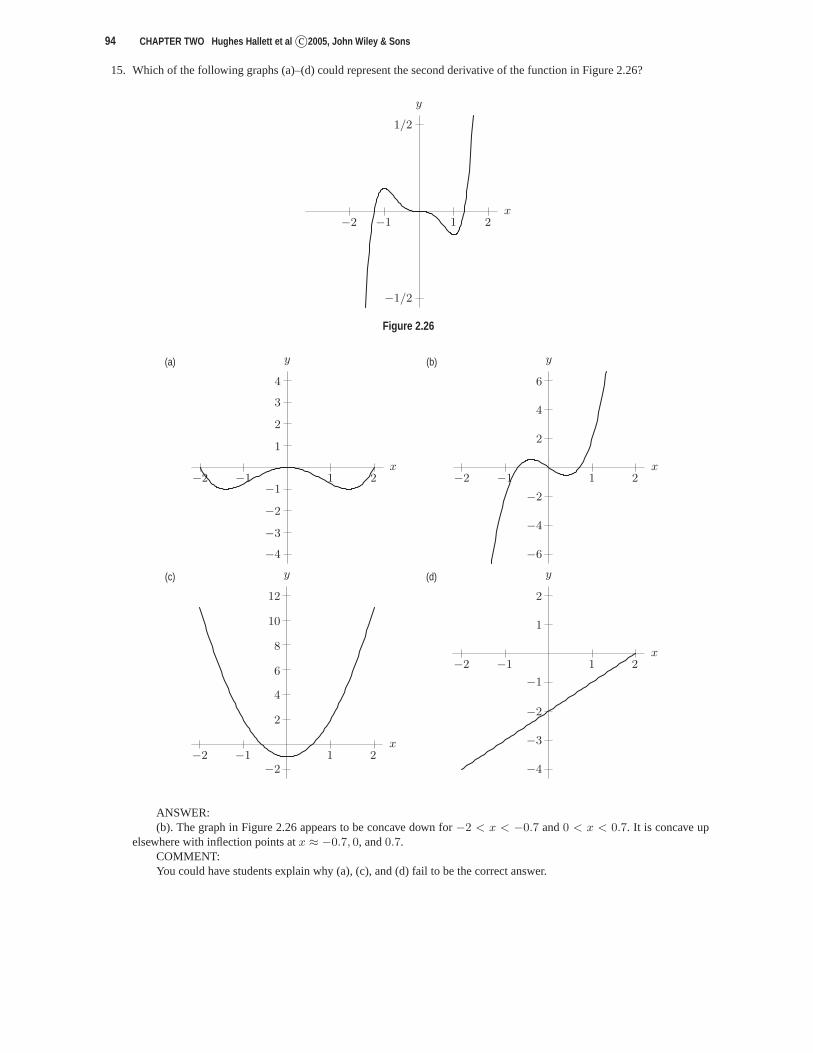
94 CHAPTER TWO Hughes Hallett et al c©2005, John Wiley & Sons
15. Which of the following graphs (a)–(d) could represent the second derivative of the function in Figure 2.26?
−2 −1 1 2
−1/2
1/2
x
y
Figure 2.26
−2 −1 1 2
−4
−3
−2
−1
1
2
3
4
x
y(a)
−2 −1 1 2
−6
−4
−2
2
4
6
x
y(b)
−2 −1 1 2−2
2
4
6
8
10
12
x
y(c)
−2 −1 1 2
−4
−3
−2
−1
1
2
x
y(d)
ANSWER:(b). The graph in Figure 2.26 appears to be concave down for−2 < x < −0.7 and0 < x < 0.7. It is concave up
elsewhere with inflection points atx ≈ −0.7, 0, and0.7.COMMENT:You could have students explain why (a), (c), and (d) fail to be the correct answer.

CHAPTER TWO Hughes Hallett et al c©2009, John Wiley & Sons 95
16. Figure 2.27 shows position as a function of time for two sprinters running in parallel lanes. Which of the following istrue?
(a) At timeA, both sprinters have the same velocity.(b) Both sprinters continually increase their velocity.(c) Both sprinters run at the same velocity at some time beforeA.(d) At some time beforeA, both sprinters have the same acceleration.
A
(I)
(II)
time
position
Figure 2.27
.ANSWER:(c). The sprinter whose position is given by (I) has a constant velocity, represented by the slope of the line. Since
the slope of the curve (II) continually decreases, the velocity of the sprinter is continually decreasing. AtA both sprintershave the same position. The acceleration for sprinter (I) iszero, so the only true statement is (c). They have the samevelocity when the slope of curve (II) is parallel with the line (I).
COMMENT:You might point out the relationship between this problem and the Mean Value Theorem.
17. If an object’s acceleration is negative, at that particular instant the object can be
(a) Slowing down only(b) Speeding up only(c) Slowing down or momentarily stopped only(d) Slowing down, momentarily stopped, or speeding up
ANSWER:(d). The acceleration of an object is the rate of change of itsvelocity with respect to time. If the acceleration is
negative, its velocity is decreasing, but this tells us nothing about the value of the velocity.COMMENT:You could have students provide position graphs of an objectwith negative acceleration which satisfies (a), (b), and
(c), respectively.

96 CHAPTER TWO Hughes Hallett et al c©2005, John Wiley & Sons
18. Figure 2.28 shows the graph of position versus time,t. Which of (a)–(d) represents a corresponding graph of accelerationas a function of time?
1 2 3 4
1
2
3
4
t
position
Figure 2.28
1 2 3 4
−2
−1
1
2
t
acceleration(a)
1 2 3 4
−2
−1
t
acceleration(b)
1 2 3 4
1
2
t
acceleration(c)
1 2 3 4
−2
−1
1
2
t
acceleration(d)
ANSWER:(b). The position graph is concave down for0 < t < 4. Thus the acceleration is not positive for0 < t < 4.COMMENT:You could have students give specific points on the graphs of the other choices which have properties that are not
consistent with Figure 2.28.

CHAPTER TWO Hughes Hallett et al c©2009, John Wiley & Sons 97
19. Figure 2.29 shows the graph of position versus time,t. Which of (a)–(d) represents a corresponding graph of accelerationas a function of time?
1 2 3 4
−6
−5
−4
−3
−2
−1
t
position
Figure 2.29
1 2 3 4
−2
−1
1
2
t
acceleration(a)
1 2 3 4
−2
−1
t
acceleration(b)
1 2 3 4
−20
−16
−12
−8
−4
t
acceleration(c)
1 2 3 4
−2
−1
1
2
t
acceleration(d)
ANSWER:(d). The graph appears to be concave down for0 < t < 2, concave up for2 < t < 4 with an inflection point at
t = 2. Thus the acceleration is not positive for0 < t < 2, is not negative for2 < t < 4, and is zero att = 2.COMMENT:You could have students give specific points on the graphs of the other choices which have properties that are not
consistent with Figure 2.29.
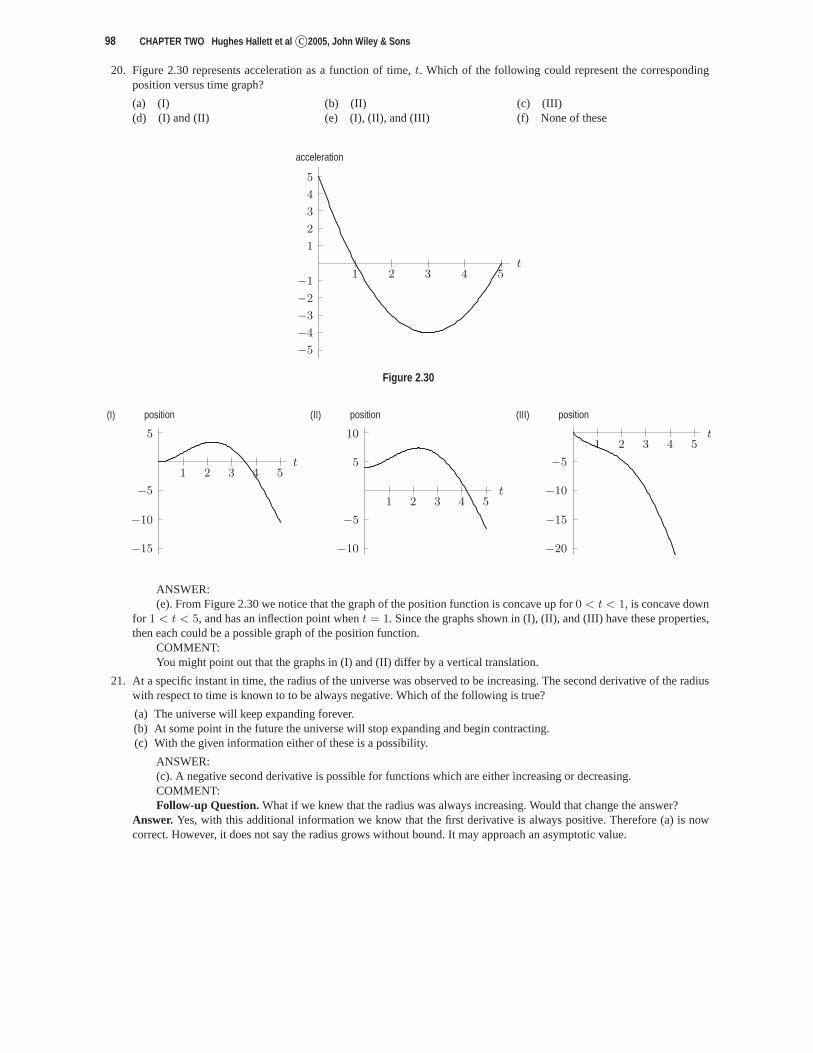
98 CHAPTER TWO Hughes Hallett et al c©2005, John Wiley & Sons
20. Figure 2.30 represents acceleration as a function of time, t. Which of the following could represent the correspondingposition versus time graph?
(a) (I) (b) (II) (c) (III)(d) (I) and (II) (e) (I), (II), and (III) (f) None of these
1 2 3 4 5
−5
−4
−3
−2
−1
1
2
3
4
5
t
acceleration
Figure 2.30
1 2 3 4 5
−15
−10
−5
5
t
position(I)
1 2 3 4 5
−10
−5
5
10
t
position(II)
1 2 3 4 5
−20
−15
−10
−5
t
position(III)
ANSWER:(e). From Figure 2.30 we notice that the graph of the positionfunction is concave up for0 < t < 1, is concave down
for 1 < t < 5, and has an inflection point whent = 1. Since the graphs shown in (I), (II), and (III) have these properties,then each could be a possible graph of the position function.
COMMENT:You might point out that the graphs in (I) and (II) differ by a vertical translation.
21. At a specific instant in time, the radius of the universe was observed to be increasing. The second derivative of the radiuswith respect to time is known to to be always negative. Which of the following is true?
(a) The universe will keep expanding forever.(b) At some point in the future the universe will stop expanding and begin contracting.(c) With the given information either of these is a possibility.
ANSWER:(c). A negative second derivative is possible for functionswhich are either increasing or decreasing.COMMENT:Follow-up Question. What if we knew that the radius was always increasing. Would that change the answer?
Answer. Yes, with this additional information we know that the first derivative is always positive. Therefore (a) is nowcorrect. However, it does not say the radius grows without bound. It may approach an asymptotic value.

CHAPTER TWO Hughes Hallett et al c©2009, John Wiley & Sons 99
22. In Star Trek: First Contact, Worf almost gets knocked into space by the Borg. Assume he was knocked into space andhis space suit was equipped with thrusters. Worf fires his thruster for 1 second which produces a constant acceleration inthe positive direction. In the next second he turns off his thrusters. In the third second he fires his thrusters producingaconstant negative acceleration. The acceleration as a function of time is given in Figure 2.31. Which of (a)–(d) representhis position versus time graph?
1 2 3
−1
1
t
Acceleration
Figure 2.31
1 2 3
1
t
position(a)
1 2 3
1
2
3
4
5
6
7
8
t
position(b)
1 2 3
1
2
t
position(c)
1 2 3
1
t
position(d)
ANSWER:(c). From the acceleration graph we see that the position graph will be concave up for0 < t < 1, concave down for
2 < t < 3 and have a constant slope for1 < t < 2.COMMENT:You could have students give specific points on the graphs in the other choices which have properties not consistent
with given acceleration graph.

100 CHAPTER TWO Hughes Hallett et al c©2005, John Wiley & Sons
23. Which of the following graphs satisfies the relationshipf ′′(x) = −f(x)?
1 2 3 4 5 6 7 8
−1
1
x
y(a)
−3 −2 −1 1 2
1
2
3
4
5
6
7
8
x
y(b)
−3 −2 −1 1 2
1
2
x
y(c)
1 2 3 4
−8
−6
−4
−2
2
4
6
8
x
y(d)
ANSWER:(a). Functions that satisfyf ′′(x) = −f(x) will be concave down where the function is positive and concave up
where it is negative. Inflection points occur where the function is zero. The answer (c) would also be correct if we couldtell that inflection points occurred atx = ±2.
COMMENT:You could have students give specific points on the graphs in the other choices which have properties not consistent
with the fact thatf ′′(x) = −f(x).
ConcepTests and Answers and Comments for Section 2.6
1. If a function is continuous at a point, then it is differentiable at that point.
(a) True(b) False
ANSWER:(b). For example, the functionf(x) = |x| is continuous atx = 0, but it is not differentiable there.COMMENT:You might have students give other examples. (f(x) = x1/3 is one.)

Chapter Three
Chapter Three

102 CHAPTER THREE Hughes Hallett et al c©2005, John Wiley & Sons
ConcepTests and Answers and Comments for Section 3.1
1. The graph of a functionf is given in Figure 3.1. Iff is a polynomial of degree 3, then the value off ′′′(0) is
(a) Positive(b) Negative(c) Zero
−1 1
−1
1
f
x
Figure 3.1
ANSWER:(b). Because the graph of this polynomial of degree 3 is negative for large values ofx, the coefficient ofx3 will be
negative. (Recall the third derivative of a polynomial of degree 3 is a constant.)COMMENT:You could ask students whyf(x) could not become positive forx > 1.
2. The graph of a functionf is given in Figure 3.2. Iff is a polynomial of degree 3, thenf ′′′(0) is
(a) Positive(b) Negative(c) Zero
−1 1
−1
1
fx
Figure 3.2
ANSWER:(a). Because the graph of this polynomial of degree 3 is positive for large values ofx, the coefficient ofx3 will be
positive. (Recall the third derivative of a polynomial of degree 3 is a constant.)COMMENT:You could ask students if there could be other inflection points forf .

CHAPTER THREE Hughes Hallett et al c©2009, John Wiley & Sons 103
3. The graph of a functionf is given in Figure 3.3. Iff is a polynomial of degree 3, then the values off ′(0), f ′′(0), andf ′′′(0) are (respectively)
(a) 0, 0, + (b) 0, 0,− (c) 0, +,−(d) 0,−,− (e) +,−, + (f) 0, +, +
−1 1
−1
1
2
fx
Figure 3.3
ANSWER:(f). There is a horizontal tangent at the origin, sof ′(0) = 0. The graph shows thatf has horizontal intercepts at−1
and 0, with a double root at 0. Thusf has the formf(x) = k(x + 1)x2. Becausef(x) > 0 for x > 0, thenk > 0. Sof ′(x) = k(3x2 + 2x), f ′′(x) = k(6x + 2), andf ′′′(x) = 6k.
COMMENT:You could ask students why a double root at zero means thatf has a factor ofx2.
4. The graph of a functionf is given in Figure 3.4. Iff is a polynomial of degree 3, then the values off ′(0), f ′′(0), andf ′′′(0) are (respectively)
(a) +, 0, + (b) −, 0,− (c) +, 0,−(d) +,−,− (e) +,−, + (f) +, +, +
−1 1
−0.5
0.5
f
x
Figure 3.4
ANSWER:(c). The graph shows thatf has horizontal intercepts atx = −1, 0, and 1. Thusf has the formf(x) = kx(x +
1)(x − 1). Becausef(x) > 0 for 0 < x < 1, we havek < 0. Thenf ′(x) = k(3x2 − 1), f ′′(x) = k(6x), andf ′′′(x) = 6k.
COMMENT:You could ask why there could not be another horizontal intercept outside this viewing window.
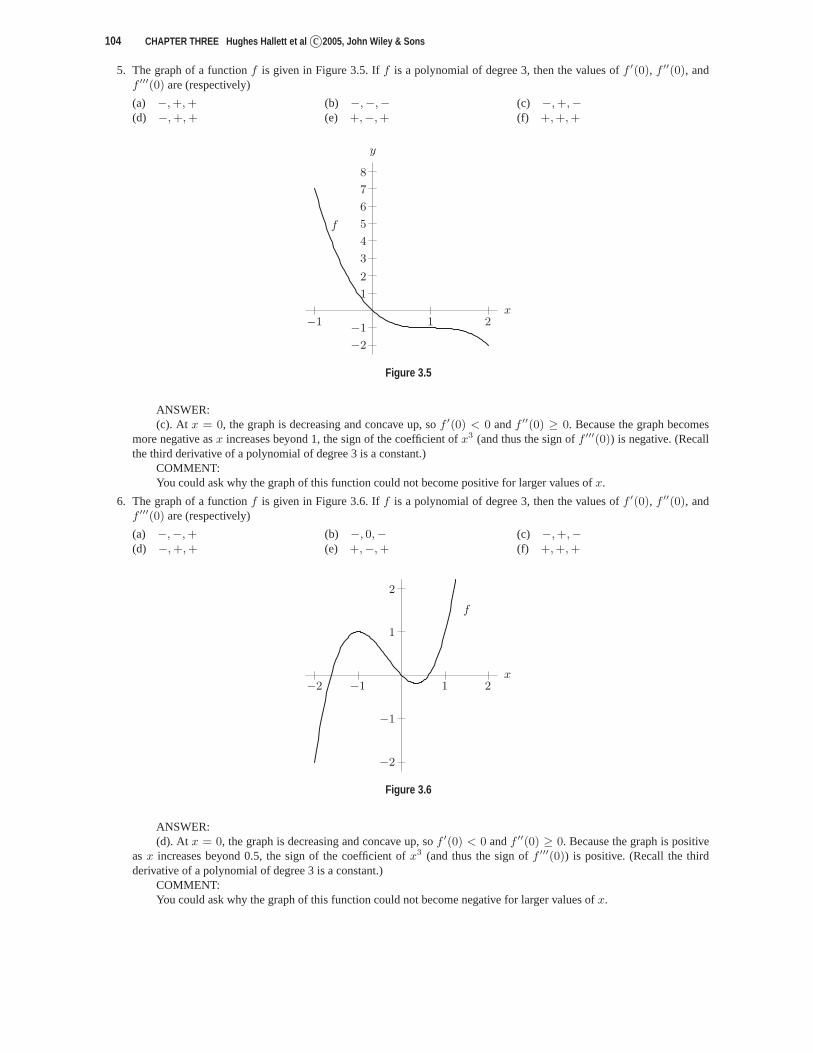
104 CHAPTER THREE Hughes Hallett et al c©2005, John Wiley & Sons
5. The graph of a functionf is given in Figure 3.5. Iff is a polynomial of degree 3, then the values off ′(0), f ′′(0), andf ′′′(0) are (respectively)
(a) −, +, + (b) −,−,− (c) −, +,−(d) −, +, + (e) +,−, + (f) +, +, +
−1 1 2
−2
−1
1
2
3
4
5
6
7
8
f
x
y
Figure 3.5
ANSWER:(c). At x = 0, the graph is decreasing and concave up, sof ′(0) < 0 andf ′′(0) ≥ 0. Because the graph becomes
more negative asx increases beyond 1, the sign of the coefficient ofx3 (and thus the sign off ′′′(0)) is negative. (Recallthe third derivative of a polynomial of degree 3 is a constant.)
COMMENT:You could ask why the graph of this function could not become positive for larger values ofx.
6. The graph of a functionf is given in Figure 3.6. Iff is a polynomial of degree 3, then the values off ′(0), f ′′(0), andf ′′′(0) are (respectively)
(a) −,−, + (b) −, 0,− (c) −, +,−(d) −, +, + (e) +,−, + (f) +, +, +
−2 −1 1 2
−2
−1
1
2
f
x
Figure 3.6
ANSWER:(d). At x = 0, the graph is decreasing and concave up, sof ′(0) < 0 andf ′′(0) ≥ 0. Because the graph is positive
asx increases beyond 0.5, the sign of the coefficient ofx3 (and thus the sign off ′′′(0)) is positive. (Recall the thirdderivative of a polynomial of degree 3 is a constant.)
COMMENT:You could ask why the graph of this function could not become negative for larger values ofx.

CHAPTER THREE Hughes Hallett et al c©2009, John Wiley & Sons 105
ConcepTests and Answers and Comments for Section 3.4
1. Given the graphs of the functionsf(x) andg(x) in Figures 3.7 and 3.8, which of (a)–(d) is a graph off(g(x))?
1 2 3
1
2
3
g(x)
x
y
Figure 3.7
1 2 3
1
2f(x)
x
y
Figure 3.8
1 2 3
1
2
x
y(a)
1 2 3
2
4
6
x
y(b)
1 2 3
1
2
3
x
y(c)
1 2 3
2
4
6
8
10
x
y(d)
ANSWER:(c). Because(f(g(x)))′ = f ′(g(x))g′(x), we seef(g(x)) has a horizontal tangent wheneverg′(x) = 0 orf ′(g(x)) =
0. Now,f ′(g(x)) = 0 for 1 < g(x) < 2 and this approximately corresponds to1.7 < x < 2.5.COMMENT:You could have students give specific places in the other choices where there was a conflict with information given
in the graphs off andg.

106 CHAPTER THREE Hughes Hallett et al c©2005, John Wiley & Sons
2. Given the graphs of the functionsf(x) andg(x) in Figures 3.9 and 3.10, which of (a)–(d) is a graph off(g(x))?
1 2 3 4
1
2
3
4
g(x)
x
y
Figure 3.9
1 2 3 4
4
8
12
16
f(x)
x
y
Figure 3.10
1 2 3 4
4
8
12
16
x
y(a)
1 2 3 4
1
2
3
4
5
6
x
y(b)
1 2 3 4
2
4
6
8
10
x
y(c)
1 2 3 4
2
4
6
8
10
x
y(d)
ANSWER:(a). Because(f(g(x)))′ = f ′(g(x))g′(x), we seef(g(x)) has a horizontal tangent wheneverg′(x) = 0 orf ′(g(x)) =
0. Now f ′(x) = 0 only whenx = 2, so the composite function only has horizontal tangents when g′(x) = 0 or wheng(x) = 2.
COMMENT:Students may want to check points, which is tedious. This is an opportunity to show the power of reasoning based
on the chain rule.

CHAPTER THREE Hughes Hallett et al c©2009, John Wiley & Sons 107
3. Given the graphs of the functiong(x) andf(x) in Figures 3.11 and 3.12 , which of (a)–(d) representsf(g(x))?
1 2 3 4 5
−3
−2
−1
1
2
3
g(x)x
y
Figure 3.11
−3 −2 −1 1 2 3
−27
−18
−9
9
18
27
f(x)
x
y
Figure 3.12
1 2 3 4 5
−9
9
18
27
x
y(a)
1 2 3
−30
−25
−20
−15
−10
−5
5
x
y(b)
1 2 3 4 5−3
3
6
9
12
15
18
21
24
27
x
y(c)
1 2 3 4 5
1
x
y(d)
ANSWER:(c). Because(f(g(x)))′ = f ′(g(x))g′(x), we seef(g(x)) has a horizontal tangent wheneverg′(x) = 0 or g(x) =
0. This happens whenx = 0, 2, and4. f(g(x)) is also negative forx > 4. Alternatively,f(g(4)) = f(0) = 0 identifiesanswer (c).
COMMENT:You could have students give specific places in the other choices where there was a conflict with information given
in the graphs off andg.

108 CHAPTER THREE Hughes Hallett et al c©2005, John Wiley & Sons
ConcepTests and Answers and Comments for Section 3.5
1. List in order (from smallest to largest) the following functions as regards to the maximum possible value of their slope.
(a) sin x (b) sin(2x) (c) sin(3x) (d) sin(x/2)
ANSWER:(d), (a), (b), (c). The derivative ofsin(αx) is α cos(αx). The largest value ofcos(αx) is 1, so the ranking is based
only on the value ofα.COMMENT:You could mimic this question replacing the sine function bycosine.
2. At which of the following values ofx doessin(4πx2) attain the largest slope?
(a) x = 0 (b) x = 1/2 (c) x = 1 (d) x = 2
ANSWER:(d). The derivative ofsin(4πx2) is 8πx cos(4πx2). At these specific values ofx, we have the values0,−4π, 8π,
and16π.COMMENT:You could mimic this question replacing the sine function bycosine.
3. Which of the graphs are those ofsin(2x) andsin(3x)?
(a) (I) = sin(2x), (II) = sin(3x) (b) (I) = sin(2x), (III) = sin(3x)(c) (II) = sin(2x), (III) = sin(3x) (d) (III) = sin(2x), (IV) = sin(3x)
−6 −4 −2 2 4 6
−1
1
x
y(I)
−6 −4 −2 2 4 6
−1
1
x
y(II)
−6 −4 −2 2 4 6
−1
1
x
y(III)
−6 −4 −2 2 4 6
−1
1
x
y(IV)
ANSWER:
(b). Becaused
dxsin(αx) = α cos(αx), the graph ofsin(3x) will have steeper slopes thansin(2x). The first positive
zeros are atx = π/2 for sin(2x) andx = π/3 for sin(3x).COMMENT:You may want to emphasize that there are many ways of solving this problem, for example, finding thex-intercepts,
remembering the properties of trigonometric functions, and using calculus to look at the slope of the function at variouspoints. You could ask for equations for the graphs in choices(II) and (IV).
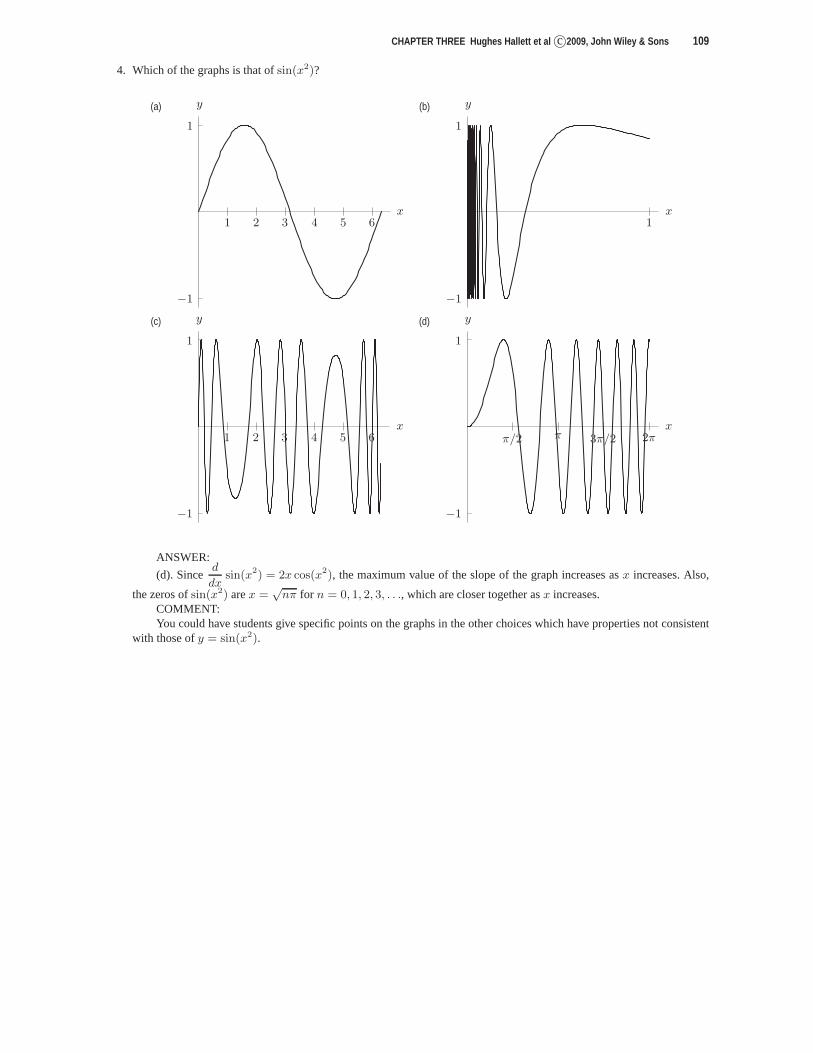
CHAPTER THREE Hughes Hallett et al c©2009, John Wiley & Sons 109
4. Which of the graphs is that ofsin(x2)?
1 2 3 4 5 6
−1
1
x
y(a)
1
−1
1
x
y(b)
1 2 3 4 5 6
−1
1
x
y(c)
π/2 π 3π/2 2π
−1
1
x
y(d)
ANSWER:
(d). Sinced
dxsin(x2) = 2x cos(x2), the maximum value of the slope of the graph increases asx increases. Also,
the zeros ofsin(x2) arex =√
nπ for n = 0, 1, 2, 3, . . ., which are closer together asx increases.COMMENT:You could have students give specific points on the graphs in the other choices which have properties not consistent
with those ofy = sin(x2).

110 CHAPTER THREE Hughes Hallett et al c©2005, John Wiley & Sons
ConcepTests and Answers and Comments for Section 3.8
For Problems 1–2, consider the graphs off(x) = (1/2)ex andg(x) = (1/2)e−x in Figure 3.13.
−2 −1 1 2
−1
1
2
3
f(x)g(x)
x
y
Figure 3.13
1. Which of the following functions representsf(x) + g(x)?
−2 −1 1 2
−1
1
2
3
4
x
y(a)
−2 −1 1 2
−1
1
2
3
4
x
y(b)
−2 −1 1 2
−1
1
2
3
4
x
y(c)
−2 −1 1 2
−1
1
2
3
4
x
y(d)
ANSWER:(b)COMMENT:This is one way to introducecosh x.

CHAPTER THREE Hughes Hallett et al c©2009, John Wiley & Sons 111
2. Which of the following functions representsf(x)− g(x)?
−2 −1 1 2
−1
1
2
3
4
x
y(a)
−2 −1 1 2
−1
1
2
3
4
x
y(b)
−2 −1 1 2
−1
1
2
3
4
x
y(c)
−2 −1 1 2
−1
1
2
3
4
x
y(d)
ANSWER:(d)COMMENT:This is one way to introducesinh x.

112 CHAPTER THREE Hughes Hallett et al c©2005, John Wiley & Sons
ConcepTests and Answers and Comments for Section 3.9
1. In which of the following graphs will using local linearity to approximate the value of the function nearx = c give theleast error as∆x becomes larger?
cx
(a)
cx
(b)
cx
(c)
cx
(d)
ANSWER:(d). Local linearity will give exact answers in graph (d) because the tangent line atx = c is identical with the graph
on the interval shown.COMMENT:You could lay a pencil on the overhead to illustrate the tangent line in each case.
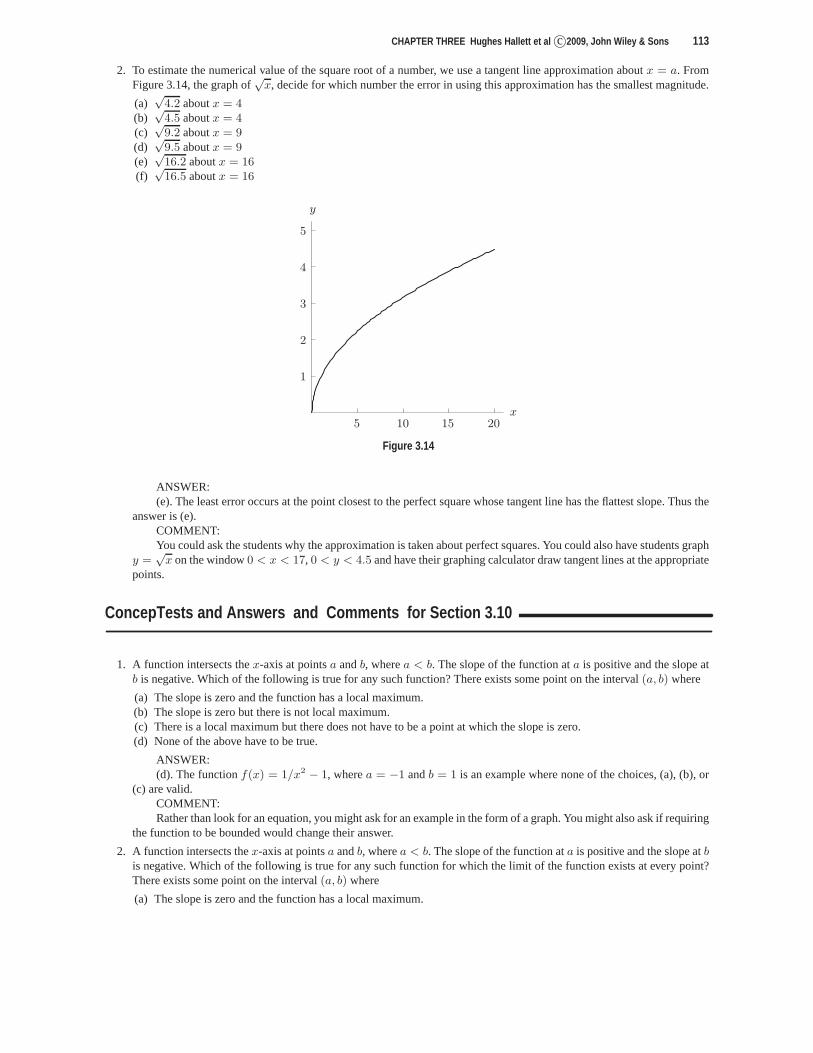
CHAPTER THREE Hughes Hallett et al c©2009, John Wiley & Sons 113
2. To estimate the numerical value of the square root of a number, we use a tangent line approximation aboutx = a. FromFigure 3.14, the graph of
√x, decide for which number the error in using this approximation has the smallest magnitude.
(a)√
4.2 aboutx = 4(b)√
4.5 aboutx = 4(c)√
9.2 aboutx = 9(d)√
9.5 aboutx = 9(e)√
16.2 aboutx = 16(f)√
16.5 aboutx = 16
5 10 15 20
1
2
3
4
5
x
y
Figure 3.14
ANSWER:(e). The least error occurs at the point closest to the perfect square whose tangent line has the flattest slope. Thus the
answer is (e).COMMENT:You could ask the students why the approximation is taken about perfect squares. You could also have students graph
y =√
x on the window0 < x < 17, 0 < y < 4.5 and have their graphing calculator draw tangent lines at theappropriatepoints.
ConcepTests and Answers and Comments for Section 3.10
1. A function intersects thex-axis at pointsa andb, wherea < b. The slope of the function ata is positive and the slope atb is negative. Which of the following is true for any such function? There exists some point on the interval(a, b) where
(a) The slope is zero and the function has a local maximum.(b) The slope is zero but there is not local maximum.(c) There is a local maximum but there does not have to be a point at which the slope is zero.(d) None of the above have to be true.
ANSWER:(d). The functionf(x) = 1/x2 − 1, wherea = −1 andb = 1 is an example where none of the choices, (a), (b), or
(c) are valid.COMMENT:Rather than look for an equation, you might ask for an examplein the form of a graph. You might also ask if requiring
the function to be bounded would change their answer.
2. A function intersects thex-axis at pointsa andb, wherea < b. The slope of the function ata is positive and the slope atbis negative. Which of the following is true for any such function for which the limit of the function exists at every point?There exists some point on the interval(a, b) where
(a) The slope is zero and the function has a local maximum.

114 CHAPTER THREE Hughes Hallett et al c©2005, John Wiley & Sons
(b) The slope is zero but there is not local maximum.(c) There is a local maximum but there does not have to be a point at which the slope is zero.(d) None of the above have to be true.
ANSWER:(d). The graph in Figure 3.15 is an example of a function for which none of the choices (a), (b), or (c) are valid.
a b
−1
1
x
Figure 3.15
COMMENT:If you graph the function given in the Answer, you might ask students for its equation.
3. A continuous function intersects thex-axis at pointsa andb, wherea < b. The slope of the function ata is positive andthe slope atb is negative. Which of the following is true for any such function? There exists some point on the interval(a, b) where
(a) The slope is zero and the function has a local maximum.(b) The slope is zero but there is not local maximum.(c) There is a local maximum but there does not have to be a point at which the slope is zero.(d) None of the above have to be true.
ANSWER:(c). The Extreme Value Theorem guarantees there will be a maximum. The function
f(x) = (b− a)/2− |x− (a + b)/2| shows that the slope of such a function need not be zero.COMMENT:This answer is more believable if the function is graphed.
4. A continuous and differentiable function intersects thex-axis at pointsa andb, (a < b). The slope of the function ata ispositive and the slope atb is negative. Which of the following is true for any such function? There exists some point onthe interval(a, b) where
(a) The slope is zero and the function has a local maximum.(b) The slope is zero but there is not local maximum.(c) There is a local maximum but there does not have to be a point at which the slope is zero.(d) None of the above have to be true.
ANSWER:(a). The Extreme Value Theorem guarantees there will be a maximum, while the Mean Value Theorem requires a
horizontal tangent on the interval.COMMENT:You might review the hypothesis of the Mean Value Theorem.

Chapter Four
Chapter Four

116 CHAPTER FOUR Hughes Hallett et al c©2005, John Wiley & Sons
ConcepTests and Answers and Comments for Section 4.1
For Problems 1–3, consider the graph off(x) in Figure 4.1.
x1 x2 x3 x4 x5 x6 x7 x8 x9 x10
f(x)
x
Figure 4.1
1. How many critical points doesf have?ANSWER:There are 6 critical points. One occurring atx2, x5, x6, x7, x8, andx9.COMMENT:You might note that endpoints are not defined to be critical points and critical points can only occur where the
function exists.
2. How many local minima doesf have?ANSWER:There are two local minima. They occur atx7 andx9.COMMENT:Follow-up Question. What happens if one of the holes atx3 is filled in? Does it matter which hole?
3. Consider the graph ofy = f(x) in Figure 4.1. How many local maxima doesf have?ANSWER:There are three local maxima. They occur atx2, x5, andx8.COMMENT:Follow-up Question. What happens if one of the holes atx3 is filled in? Does it matter which hole?

CHAPTER FOUR Hughes Hallett et al c©2009, John Wiley & Sons 117
4. Concerning the graph of the function in Figure 4.2, which of the following statements is true?
(a) The derivative is zero at two values ofx, both being local maxima.(b) The derivative is zero at two values ofx, one is a local maximum while the other is a local minimum.(c) The derivative is zero at two values ofx, one is a local maximum on the interval while the other is neither a local
maximum nor a minimum.(d) The derivative is zero at two values ofx, one is a local minimum on the interval while the other is neither a local
maximum nor a minimum.(e) The derivative is zero only at one value ofx where it is a local minimum.
1 2 3 4
1
2
3
4
f(x)
x
y
Figure 4.2
ANSWER:(b). The derivative is zero where it has a horizontal tangent, having a local maximum if it is concave down there, a
local minimum if it is concave up.COMMENT:You could sketch a different graph and ask the same question.

118 CHAPTER FOUR Hughes Hallett et al c©2005, John Wiley & Sons
5. If the graph in Figure 4.3 is that off ′(x), which of the following statements is true concerning the functionf?
(a) The derivative is zero at two values ofx, both being local maxima.(b) The derivative is zero at two values ofx, one is a local maximum while the other is a local minimum.(c) The derivative is zero at two values ofx, one is a local maximum on the interval while the other is neither a local
maximum nor a minimum.(d) The derivative is zero at two values ofx, one is a local minimum on the interval while the other is neither a local
maximum nor a minimum.(e) The derivative is zero only at one value ofx where it is a local minimum.
1 2 3 4
−2
−1
1
2
f ′(x)
x
y
Figure 4.3
ANSWER:(c). Whenx ≈ 0.6, the derivative is positive to the left and negative to the right of that point. This gives a local
maximum. Whenx ≈ 3.1, the graph of the derivative is below the axis (negative) on both sides of this point. This isneither a local minimum nor a maximum.
COMMENT:You could sketch a different graph and ask the same question.
ConcepTests and Answers and Comments for Section 4.2
For Problems 1–2, consider the graph off(x) in Figure 4.4.
x1 x2 x3 x4 x5 x6 x7 x8 x9 x10
f(x)
x
Figure 4.4

CHAPTER FOUR Hughes Hallett et al c©2009, John Wiley & Sons 119
1. Where is the global maximum off(x)?ANSWER:x5
COMMENT:Follow-up Question. What happens to the global maximum iff is defined only on the open interval fromx1 to x4?Answer. There is no global maximum.
2. Where is the global minimum off(x)?ANSWER:There is no global minimum.COMMENT:Follow-up Question. What happens to the global minimum iff is defined only on the closed interval fromx5 to
x10?Answer. x9 becomes the global minimum.
3. A global maximum is always a critical point.
(a) True(b) False
ANSWER:(b). If a global maximum occurs at an endpoint of the interval, it does not have to be a critical point. (The derivative
need not be 0 or undefined at this point.)COMMENT:This question should remind the student of the definition of acritical point.
4. A function defined on all points of a closed interval alwayshas a global maximumanda global minimum.
(a) True(b) False
ANSWER:(b). The function has to be continuous for this to always be true.COMMENT:Have students give counterexamples.

120 CHAPTER FOUR Hughes Hallett et al c©2005, John Wiley & Sons
ConcepTests and Answers and Comments for Section 4.3
1. The functions in Figure 4.5 have the formy = A sin x. Which of the functions has the largestA? Assume the scale onthe vertical axes is the same for each graph.
y
x
(a) y
x
(b) y
x
(c)
Figure 4.5
ANSWER:(c) has the largest amplitude.COMMENT:Remind students that they only need to compare the graphs. They do not need any values on the axes labeled, but
they need to know that the vertical scales are the same on all three graphs.
2. The graphs in Figure 4.6 have the formy = sin Bx. Which of the functions has the largest B? Assume the scale onthehorizontal axes is the same for each graph.
y
x
(a) y
x
(b) y
x
(c)
Figure 4.6
ANSWER:(c). Sinceperiod = 2π/|B|, then the largestB corresponds to the smallest period.COMMENT:Remind the students that the horizontal scale is the same forall three graphs.
3. Letf(x) = ax + b/x. What are the critical points off(x)?
(a) −b/a (b) 0 (c) ±√
b/a
(d) ±√
−b/a (e) No critical points
ANSWER:(c) or (e).f ′(x) = a − b/x2. Therefore the critical points, if they exist, off(x) arex = ±
√
b/a. Thus the answeris (c) whena, b are either both positive or both negative, (e) whena andb have opposite signs.
COMMENT:Students have a hard time with parameters. To get them warmedup, you may ask the same question where you have
assigned specific values toa andb.

CHAPTER FOUR Hughes Hallett et al c©2009, John Wiley & Sons 121
4. Letf(x) = ax + b/x. Supposea andb are positive. What happens tof(x) asb increases?
(a) The critical points move further apart.(b) The critical points move closer together.(c) The critical values move further apart.(d) The critical values move closer together.
ANSWER:(a) and (c). Since the critical points off(x) arex = ±
√
b/a, then asb increases∣
∣
∣±
√
b/a
∣
∣
∣increases. Therefore (a).
The critical values off(x) aref(±√
b/a) = a(±√
b/a) +b
±√
b/a= ±√
ab±√
ab = ±2√
ab. Therefore (c) is also
true.COMMENT:You may also ask what happens ifa andb are negative, or what happens ifa andb have different signs.
5. Letf(x) = ax + b/x. Supposea andb are positive. What happens tof(x) asa increases?
(a) The critical points move further apart.(b) The critical points move closer together.(c) The critical values move further apart.(d) The critical values move closer together.
ANSWER:(b) and (c). Since the critical points off(x) arex = ±
√
b/a, then asa increases∣
∣
∣±
√
b/a∣
∣
∣decreases. Therefore
(b). The critical values off(x) aref(±√
b/a) = a(±√
b/a) +b
±√
b/a= ±√
ab±√
ab = ±2√
ab. Therefore (c) is
also true.COMMENT:You might also ask what happens ifa andb are negative, or what happens ifa andb have different signs.
6. Figure 4.7 shows the graph of a member of the normal familyf(x) = e−(x−a)2/b and some data points. To make thegraph go through the data points how should the parameters bechanged?
(a) Increasea andb.(b) Increasea and decreaseb.(c) Decreasea and increaseb.(d) Decreasea andb.(e) Increasea.(f) Decreasea.(g) Increaseb.(h) Decreaseb.
x
Figure 4.7
ANSWER:(b) Increasinga moves the graph to the right. Decreasingb makes the bump in the graph more narrow.COMMENT:Much of mathematical modeling can be described as finding themember of a family of functions that matches a set
of data.

122 CHAPTER FOUR Hughes Hallett et al c©2005, John Wiley & Sons
7. Figure 4.8 shows the graph of a member of the familya(1− e−bx) and some data points. To make the graph go throughthe data points how should the parameters be changed?
(a) Increasea andb.(b) Increasea and decreaseb.(c) Decreasea and increaseb.(d) Decreasea andb.(e) Increasea.(f) Decreasea.(g) Increaseb.(h) Decreaseb.
x
Figure 4.8
ANSWER:(h) Decreaseb. The parametera gives the height of the horizontal asymptote which is the same for the curve and the
data points. Decreasingb slows the rate at which the curve approaches the asymptote.COMMENT:Much of mathematical modeling can be described as finding themember of a family of functions that matches a set
of data.
8. Figure 4.9 shows the graphs of two members of the logistic family f(t) = L/(1 + Ae−kt).Which parameters are the same for the two graphs?
(a) None.(b) L.(c) k.(d) A.(e) L andk.(f) L andA.(g) k andA.
t
Figure 4.9
ANSWER:(e) The parameterL gives the value of the upper horizontal asymptote, which is the same in the two graphs. The
parameterk controls the rate at which the graph approaches the asymptote, which is the same in the two graphs becauseone is a horizontal shift of the other.
COMMENT:You can see analytically that changingA produces a horizontal shift in the graph of a logistic function with the
identityAe−kt = e−k(t−(ln A)/k).

CHAPTER FOUR Hughes Hallett et al c©2009, John Wiley & Sons 123
ConcepTests and Answers and Comments for Section 4.4
1. Given thatf ′(x) is continuous everywhere and changes from negative to positive at x = a, which of the followingstatements must be true?
(a) a is a critical point off(x)(b) f(a) is a local maximum(c) f(a) is a local minimum(d) f ′(a) is a local maximum(e) f ′(a) is a local minimum
ANSWER:(a) and (c).a is a critical point andf(a) is a local minimum.COMMENT:Follow-up Question. What additional information would you need to determine whetherf(a) is also a global mini-
mum?Answer. You need to know the values of the function at all local minima. In addition, you need to know the values
at the endpoints (if any), or what happens tof(x) asx→ ±∞.
2. On the same side of a straight river are two towns, and the townspeople want to build a pumping station,S. See Figure 4.10.The pumping station is to be at the river’s edge with pipes extending straight to the two towns. Which function must youminimize over the interval0 ≤ x ≤ 4 to find the location for the pumping station that minimizes the total length of thepipe?
(a) 1 + |x|+ |4− x|+ 4
(b)√
x2 + 1 +√
(4− x)2 + 16(c) (1/2) · x · 1 + (1/2) · (4− x) · 4(d) x(4− x)
Town 1
Town 2
1 mile
4 miles
S
-� 4 miles-�x
Figure 4.10
ANSWER:(b). By the Pythagorean Theorem,
Distance from Town 1 toS =√
x2 + 12
Distance from Town 2 toS =√
(4− x)2 + 42,
so the sum of these distances is given by (b).COMMENT:Follow-up Question. What function must be minimized if construction of the pipeline from Town 1 to the river is
twice as expensive per foot as construction of the pipeline from Town 2 to the river and the goal is to minimize totalconstruction cost?
Answer. 2√
x2 + 1 +√
(4− x)2 + 16.

124 CHAPTER FOUR Hughes Hallett et al c©2005, John Wiley & Sons
3. Figure 4.11 shows the curvesy =√
x, x = 9, y = 0, and a rectangle with its sides parallel to the axes and its left end atx = a. What is the maximum perimeter of such a rectangle?
a 9x
y =√
x
y
Figure 4.11
(a) 9.25(b) 14(c) 18(d) 18.5(e) 20
ANSWER:(d) We wish to choosea to maximize the perimeter of the rectangle with corners at(a,
√a) and (9,
√a). The
perimeter of this rectangle is given by the formula
P = 2h + 2l = 2√
a + 2(9− a) = 2√
a + 18− 2a.
We are restricted to0 ≤ a ≤ 9. To maximize this perimeter, we setdP/da = 0, and then check that the resultingperimeter is greater than the perimeter ifa = 0 or a = 9.
We haveP = 18 if a = 0 andP = 6 if a = 9. All that remains is to find wheredP/da = 0:
dP
da= a−1/2 − 2 = 0
1√a
= 2
a =1
4.
We haveP = 18.5 whena = 1/4. The maximum perimeter is18.5 when the dimensions of the rectangle are0.5 by8.75.
COMMENT:This question can be an interesting follow-up to Example 3 inSection 4.4 which asks for the maximum area of the
rectangle.
4. You wish to maximize the volume of an open-topped rectangular box with a square basex cm byx cm and surface area900 cm2. Over what domain can the variablex vary?
(a) 0 < x < 900(b) 0 < x < 30(c) 0 < x <
√450
(d) 0 < x <∞ANSWER:(b) We havex > 0 becausex is a length. The square base has areax2 which must be less than900, the surface area
of the entire box. Hence0 < x <√
900 = 30.COMMENT:When working an optimization word problem, students are sometimes so focussed on finding a formula for the
function to be optimized that they can forget to identify thedomain over which the optimization takes place.
CHAPTER FOUR Hughes Hallett et al c©2009, John Wiley & Sons 125
ConcepTests and Answers and Comments for Section 4.5
1. Which is correct? A company generally wants to
(a) Maximize revenue(b) Maximize marginal revenue(c) Minimize cost(d) Minimize marginal cost(e) None of the above
ANSWER:(e). A company should maximize profit, that is, it should maximize revenue minus cost.COMMENT:Follow-up Question. Why are (a) and (c) incorrect?Answer. Both (a) and (c) are incorrect because the profit is generallynot maximized at these points. Answer (a)
generally does not give the maximum profit because a large revenue may be associated with a large cost and thereforegive a small profit. Answer (c) is incorrect because the minimum cost may be associated with a low revenue and thereforegive a small profit .
2. Which is correct? A company can increase its profit by increasing production if, at its current level of production,
(a) Marginal revenue− Marginal cost> 0(b) Marginal revenue− Marginal cost= 0(c) Marginal revenue− Marginal cost< 0(d) Marginal revenue− Marginal cost is increasing
ANSWER:(a) If MR − MC > 0, so MR > MC, then revenue is increasing faster than cost with production, so profit
increases.COMMENT:Have the students discuss each of the scenarios (b)–(d) if the company increases production.

126 CHAPTER FOUR Hughes Hallett et al c©2005, John Wiley & Sons
ConcepTests and Answers and Comments for Section 4.6
1. A spherical snowball of radiusr cm has surface areaS cm2. As the snowball gathers snow, its radius increases as inFigure 4.12. Approximately how fast, in cm2/min, isS increasing when the radius is 20 cm?
3 10 20
20
46
t (min)
r (cm)
Figure 4.12
(a) 4π · 32 (b) 4π · 202 (c) 4π · 462
(d) 8π · 3 · 2.5 (e) 8π · 20 · 2.5 (f) 8π · 46 · 1ANSWER:(e). We wantdS/dt whenr = 20, that is, att = 3. The surface area is given by
S = 4πr2,
so differentiating givesdS
dt= 8πr
dr
dt.
To finddr/dt, we draw a tangent line to the curve att = 3 and estimate its slope to be 2.5 cm/min. Thus
dS
dt= 8π · 20 · 2.5 cm2/min.
COMMENT:Have students check the units of their answer.
2. A car is driving along a straight flat road when a plane flies overhead. Letx miles be the distance traveled by the car andy miles be the distance traveled by the plane at timet in hours since the plane was directly over the car. At timet, thedistanceD miles between the car and the plane is given by
D2 = x2 + y2 + 22.
At one moment, the car has gone 3 miles and is moving at 60 mph, and the plane has gone 30 miles and is moving at 500mph. To find the rate at whichD is increasing at that time, you should:
(a) Substitutex = 3, y = 30 into D2 = x2 + y2 + 22.(b) DifferentiateD2 = x2 + y2 + 22 after substitutingx = 3, y = 30. Then substitutedx/dt = 60, dy/dt = 500.(c) DifferentiateD2 = x2 + y2 + 22. Then substitutex = 3, y = 30, dx/dt = 60, dy/dt = 500.(d) None of the above.
ANSWER:(c). Note that substitutingx = 3, y = 30 before differentiating, as in (b), gives zero instead of thecorrect answer.COMMENT:Have the students calculate the answer, which is15,180/
√913 = 502.385 mph.

CHAPTER FOUR Hughes Hallett et al c©2009, John Wiley & Sons 127
3. LetP (t) be the population of California in yeart. ThenP ′(2005) represents:
(a) The growth rate (in people per year) of the population.(b) The growth rate (in percent per year) of the population.(c) The approximate number of people by which the populationincreased in 2005.(d) The approximate percent increase in the population in 2005.(e) The average yearly rate of change in the population sincet = 0.(f) The average yearly percent rate of change in the population sincet = 0.
ANSWER:(a). The derivative represents the rate of change ofP (t) in people per year. Answer (c) is approximately correct.COMMENT:UsingP , have students write expressions for each of the other rates.
4. Letg(t) be the average number of email messages, in millions per day,sent in a particular region in yeart. What are theunits and interpretations of the following quantities?
(a) g(2005)(b) g′(2005)(c) g−1(20)(d) (g−1)′(20)
ANSWER:
(a) The average number of email messages sent per day in 2005;the units are millions of messages per day.(b) The rate of change in the number of messages per day; the units are millions of messages per day per year.(c) The year in which 20 million messages are sent per day; theunits are years.(d) The derivative is the rate of change of the year with respect to the number of messages per day. To interpret this
derivative, think of it as the approximate time in years it takes for the email traffic to increase by 1 million per daywhen it is already 20 million per day. The units are years per million messages per day.
COMMENT:Additional practice can be provided by asking students to convert verbal descriptions of similar quantities to symbols.
5. The light in the lighthouse in Figure 4.13 rotates at 2 revolutions per minute. To calculate the speed at which the spot oflight moves along the shore, it is best to differentiate:
x miles
r miles θ
R
Beam oflight
Lighthouse
5 miles
Shore
Figure 4.13
(a) r2 = 52 + x2
(b) x = r sin θ(c) x = 5 tan θ(d) r2 = 22 + x2
ANSWER:(c). Differentiatingx = 5 tan θ gives
dx
dt=
5
cos2 θ
dθ
dt.
Since the light rotates at 2 revolutions per minute= 4π radians per minute, we knowdθ/dt = 4π. Thus we can calculatedx/dt, the speed at which the spot is moving, for any angleθ.
Differentiating any of the other relationships introducesdr/dt, whose values we cannot find as easily as we can finddθ/dt.

128 CHAPTER FOUR Hughes Hallett et al c©2005, John Wiley & Sons
6. The foot of the ladder in Figure 4.14 moves away from the wall at a speed of 2 ft/min, causing the top of the ladder toslide down the wall without leaving it. Label each of the following statements as True or False and give a reason.
x (feet)
y (feet)Ladder
Ground
Wall
Figure 4.14
(a) dx/dt anddy/dt have the same sign.(b) The top of the ladder is moving faster and faster.(c) Keepingdx/dt constant, doublingx, y, and the length of the ladder, doublesdy/dt.
ANSWER:We knowdx/dt = 2 ft/min. Let k be the (constant) length of the ladder in feet, so
x2 + y2 = k2.
Differentiating with respect tot gives
2xdx
dt+ 2y
dy
dt= 0
dy
dt= −x
y
dx
dt= −2
x
y.
(a) False, sincedx/dt > 0 anddy/dt < 0. Alternatively, this could be done without computation. Because the top ofthe ladder moves down,y decreases, sody/dt is negative. We are givendx/dt = 2, which is positive, sodx/dt anddy/dt have different signs.
(b) True, since asx increases,y decreases, sox/y increases. Thus, the magnitude ofdy/dt increases, which means thatthe top of the ladder is moving faster and faster.
(c) False, since doublingx andy leaves the ratiox/y unchanged. Thus,dy/dt is unchanged.
COMMENT:Have students carry out some of the calculation with specificvalues ofx andy to confirm their answers.

CHAPTER FOUR Hughes Hallett et al c©2009, John Wiley & Sons 129
ConcepTests and Answers and Comments for Section 4.7
1. True or false?
(a) Supposef(a) = g(a) = 0. According to l’Hopital’s rule,f(a)
g(a)=
f ′(a)
g′(a).
(b) Supposef(a) = g(a) = 0. Let Q(x) = f(x)/g(x). Then limx→a
Q(x) = limx→a
Q′(x).
(c) Supposef(a) = 0 and limx→a
g(x) =∞. Thenlimx→a f(x)g(x) = limx→a f ′(x)g′(x).
ANSWER:
(a) False. l’Hopital’s rule concerns the equality of limits, not the equality of functions.(b) False. In applying l’Hopital’s rule, the numerator and the denominator are differentiated separately.(c) False. To apply l’Hopital’s rule to a product, the expression must first be rewritten as a ratio.
COMMENT:Follow-up Question. What does l’Hopital’s rule say?Answer. If f andg are differentiable,f(a) = g(a) = 0, andg′(a) 6= 0, then
limx→a
f(x)
g(x)=
f ′(a)
g′(a).
2. Which of the limits cannot be computed with L’Hospital’s rule?
(a) limx→0
sin x
x
(b) limx→0
cos x
x
(c) limx→0
x
sin x
(d) limx→∞
x
ex
ANSWER:(b)COMMENT:What is the limit in each case? (The limit in (b) does not exist.)

130 CHAPTER FOUR Hughes Hallett et al c©2005, John Wiley & Sons
3. Consider three limits:
p = limx→1
x3 + 2x2 − 2x− 1
x3 + 4x2 − x− 4q = lim
x→1
x3 + x + 7
x3 + 6x + 2r = lim
x→1
sin πx
x2 − 5x + 4.
Which is the correct ranking?
(a) p < q < r(b) p < r < q(c) q < p < r(d) q < r < p(e) r < p < q(f) r < q < p
ANSWER:(a) Sincep is a limit of the form0/0 it can be evaluated by l’Hopital’s rule.
p = limx→1
x3 + 2x2 − 2x− 1
x3 + 4x2 − x− 4= lim
x→1
3x2 + 4x− 2
3x2 + 8x− 1=
5
10=
1
2.
The limit for q is the limit of a function that is continuous atx = 1, so l’Hopital’s rule does not apply. To computethe limit, evaluate the function.
q = limx→1
x3 + x + 7
x3 + 6x + 2=
9
9= 1.
Sincer is a limit of the form0/0 it can be evaluated by l’Hopital’s rule.
r = limx→1
sin πx
x2 − 5x + 4= lim
x→1
π cos πx
2x− 5=−π
−3=
π
3.
We have
p =1
2< q = 1 < r =
π
3.
COMMENT:Students may attempt to evaluateq with l’Hopital’s rule. Remind them that l’Hopital’s rule usually gives the wrong
answer when it does not apply.
4. For which of the following can you use l’Hopital’s rule to evaluate the limit?
(a) limx→0
cos x
x
(b) limx→0
sin x
x(c) lim
x→∞e−xx2
(d) limx→0
e−xx2
ANSWER:
(b), (c) after rewriting it aslimx→∞
x2
ex.
COMMENT:Follow-up Question. Compute the limits.Answer. For (a) the limit does not exist; for (b) the limit is 1; for (c)and (d) the limit is zero.

CHAPTER FOUR Hughes Hallett et al c©2009, John Wiley & Sons 131
5. Consider three limits:
p = limx→0
1− cos x
x2q = lim
x→∞
ln x√x
r = limx→∞
(x + e2x)e−2x.
Which is the correct ranking?
(a) p < q < r(b) p < r < q(c) q < p < r(d) q < r < p(e) r < p < q(f) r < q < p
ANSWER:(c) Sincep is a limit of the form0/0 it can be evaluated by l’Hopital’s rule. The first application of the rule leads to
another limit of the form0/0, so l’Hopital’s rule must be applied a second time.
p = limx→0
1− cos x
x2= lim
x→0
sin x
2x= lim
x→0
cos x
2=
1
2.
Sinceq is a limit of the form∞/∞ it can be evaluated by l’Hopital’s rule.
q = limx→∞
ln x√x
= limx→∞
1/x
(1/2)x−1/2= lim
x→∞
2√x
= 0.
Sincer is a limit of the form∞ · 0 it can be rewritten in the form∞/∞, and then l’Hopital’s rule can be applied.
r = limx→∞
(x + e2x)e−2x = limx→∞
x + e2x
e2x= lim
x→∞
1 + 2e2x
2e2x= lim
x→∞
1
2e2x+ 1 = 0 + 1 = 1.
We have
q = 0 < p =1
2< r = 1.
COMMENT:The limits forq andr could be the starting point for a discussion of dominance relations among logarithmic, power,
and exponential functions.
6. Arrange in order by dominance asx→∞, from least to most dominant.
(a) x100
(b) x(ln x)2
(c)e2x
x(d) x2
(e) ex ln x
ANSWER:(b), (d), (a), (e), (c). Asx → ∞, in increasing order of of dominance, we havex(ln x)2 < x2 < x100 < ex ln x <
e2x/x.COMMENT:Do the students know the answer without using l’Hopital’s Rule?

132 CHAPTER FOUR Hughes Hallett et al c©2005, John Wiley & Sons
ConcepTests and Answers and Comments for Section 4.8
1. Match the parameterizations (a)–(e) and curves I–V.
(a) x = sin t y = −t(b) x = |3t| y = t(c) x = sin t y = cos t(d) x = 3t3 y = t3
(e) x = |3t| y = 3t
I. LineII. CircleIII. Right angleIV. Acute angleV. Wave
ANSWER:(a)—V, (b)—IV, (c)—II, (d)—I, (e)—IIICOMMENT:If your students are using graphing calculators to answer this question, then they will need to make sure that the
range oft is both positive and negative.
2. The equation of the line tangent to the curvex = sin 3t, y = sin t + 1 at the point wheret = 0 is
(a) y = 3x(b) y = 3x + 1(c) y = (1/3)x(d) y = (1/3)x + 1(e) none of the above
ANSWER:
(d). Sincedy
dx=
dy/dt
dx/dt, the slope of the tangent line att = 0 is
dy
dx
∣
∣
∣
x=0=
cos t
3 cos 3t
∣
∣
∣
t=0=
1
3.
The line goes through the point(0, 1), so the equation isy − 1 = (1/3)x.COMMENT:You could have students graph the curve and find the equation of the tangent line at other points, for example where
t = π/2.

Chapter Five
Chapter Five

134 CHAPTER FIVE Hughes Hallett et al c©2005, John Wiley & Sons
ConcepTests and Answers and Comments for Section 5.1
1. Consider the graph in Figure 5.1.
(a) Give an interval on which the left-hand sum approximation of the area under the curve on that interval is an underes-timate.
(b) Give an interval on which the left-hand sum approximation of the area under the curve on that interval is an overesti-mate.
−4 −3 −2 −1 0 1 2 3 4
1
2
4
x
Figure 5.1
ANSWER:
(a) A possible answer is[−3,−1] because the function is increasing there.(b) A possible answer is[0, 3] because the function is decreasing there.
COMMENT:Follow-up Question. What about right-hand sum?Answer. On the interval[0, 3] the right-hand sum is an underestimate because the functionis decreasing there. On
the interval[−3,−1] the right-hand sum is an overestimate because the function is increasing there.
2. Figure 5.2 shows the velocities of two cyclists travelingin the same direction. If initially the two cyclists are alongsideeach other, when does Cyclist 2 overtake Cyclist 1?
(a) Between 0.75 and 1.25 minutes(b) Between 1.25 and 1.75 minutes(c) Between 1.75 and 2.25 minutes
1 2
1500
t (min)
v (ft/min)
Cyclist 1
Cyclist 2
Figure 5.2
ANSWER:(b). Between 1.25 and 1.75 minutes, because the area under the two curves is about equal at some time during this
interval.COMMENT:You could ask the students to answer the question if either, or both, of the statements “traveling in the same direction”
or “If initially the two cyclists were alongside each other”are removed. You could also use this question to review theconcepts of derivative.
Follow-up Question. When the cyclists pass each other, which one is acceleratingmore?Answer. Cyclist 2 is accelerating more because between 1.25 and 1.75minutes the slope of the velocity graph at
every point in that interval is steeper than the slope corresponding to Cyclist 1.

CHAPTER FIVE Hughes Hallett et al c©2009, John Wiley & Sons 135
3. The table gives a car’s velocity at timet. In each of the four fifteen-minute intervals, the car is either always speedingup or always slowing down. The car’s route is a straight line with four towns on it. TownA is 60 miles from the startingpoint, townB is 70 miles from the starting point, townC is 73 miles from the starting point, and townD is 80 miles fromthe starting point. For each town, decide if the car has passed it, has not yet passed it, or may have passed it.
t (minutes) 0 15 30 45 60
v (miles per hour) 60 75 72 78 65
ANSWER:Calculating an upper and a lower estimate for the distance traveled, we discover that the car traveled at least 67.25
miles and at most 76.5 miles:
Lower estimate= (60 + 72 + 72 + 65)0.25 = 67.25
Upper estimate= (75 + 75 + 78 + 78)0.25 = 76.50.
Thus, the car definitely passed town A, may have passed towns Band C, and definitely did not pass town D.COMMENT:Note that the velocity of the car is not monotone. Therefore the upper and lower estimates for the distance traveled
are not equal to the right and left sum estimates.
ConcepTests and Answers and Comments for Section 5.2
1. Figure 5.3 shows the graph ofy = x2. The right-hand sum for eight equal divisions is given by
(a) 0.52 + 12 + 1.52 + 22 + 2.52 + 32 + 3.52 + 42
(b) 0.5(0.5) + 1(0.5) + 1.5(0.5) + 2(0.5) + 2.5(0.5) + 3(0.5) + 3.5(0.5) + 4(0.5)(c) 0.52(0.5) + 12(0.5) + 1.52(0.5) + 22(0.5) + 2.52(0.5) + 32(0.5) + 3.52(0.5) + 42(0.5)(d) 02(0.5) + 0.52(0.5) + 12(0.5) + 1.52(0.5) + 22(0.5) + 2.52(0.5) + 32(0.5) + 3.52(0.5)
1 2 3 4
4
8
12
16
x
y
Figure 5.3
ANSWER:(c). The width of each rectangle is 0.5, and thex values are squared.COMMENT:You could ask the students to give the left-hand sum also. Youcould also comment on how the right-hand sum gives
an overestimate because the function is increasing.

136 CHAPTER FIVE Hughes Hallett et al c©2005, John Wiley & Sons
2. For the following question consider continuous curves that are increasing and concave up. As the number of rectangles(of equal width) triples in Figures 5.4 and 5.5, the areas represented byA1 andA2 decrease.
(a) True(b) False(c) It depends on the graph
1 2 3 4
2
4
6
8
x
y
Figure 5.4: A1 = Shaded Region
1 2 3 4
2
4
6
8
x
y
Figure 5.5: A2 = Shaded Region
ANSWER:(a). In both graphs, taking more rectangles of equal width will decrease the values ofA1 andA2, with the area of the
rectangles in both figures becoming closer to the area under the curve.COMMENT:You could hand out the graphs to your students and have them subdivide and conjecture. You could ask the students
the same question, but without the constraint that the function be increasing and concave up.
3. As the number of rectangles (of equal width) in Figures 5.4and 5.5 goes to infinity, which of the following statements istrue? Consider only continuous curves.
(a) A1 goes to zero butA2 does not. The limit of the lower rectangular area does not equal the limit of the upperrectangular area.
(b) A2 goes to zero butA1 does not. The limit of lower rectangular area does not equal the limit of upper rectangulararea.
(c) A2 andA1 don’t go to zero. The limits of upper and lower rectangular areas are equal.(d) A1 andA2 both go to zero. The limits of the upper and lower rectangularareas are equal.(e) A1 andA2 both go to zero. The limits of the upper and lower rectangularareas are not equal.
ANSWER:(d)COMMENT:Students should realize that all continuous curves have this property. Have them explore this idea by drawing arbitrary
continuous curves.

CHAPTER FIVE Hughes Hallett et al c©2009, John Wiley & Sons 137
ConcepTests and Answers and Comments for Section 5.3
1. A bicyclist starts from home and rides back and forth alonga straight east/west highway. Her velocity is given in Figure 5.6(positive velocities indicate travel toward the east, negative toward the west).
(a) On what time intervals is she stopped?(b) How far from home is she the first time she stops, and in whatdirection?(c) At what time does she bike past her house?(d) If she maintains her velocity att = 11, how long will it take her to get back home?
2 4 6 8 10 12 14
−30
30
t (minutes)
v (ft/sec)
Figure 5.6
ANSWER:
(a) On[3, 5] and on[9, 10], sincev = 0 there.(b) 3600 feet to the east, since this is the area under the velocity curve betweent = 0 andt = 3.(c) At t = 8 minutes, since the areas above and below the curve betweent = 0 andt = 8 are equal.(d) It will take her30 seconds longer. By calculating areas, we see that att = 11,
Distance from home= 2 · 30 · 60− 3 · 30 · 60 + 0.5 · 30 · 60 = −900 feet.
Thus, att = 11, she is 900 feet west of home. At a velocity of 30 ft/sec eastward, it takes900/30 = 30 seconds toget home.
COMMENT:To get the correct distance we have to convert minutes to seconds.
2. Arrange the intervals in the order for which the average value of sin x over the interval increases from smallest to largest.
(a) 0 ≤ x ≤ π(b) π/2 ≤ x ≤ 3π/2(c) π ≤ x ≤ 2π(d) 3.14 ≤ x ≤ 3.15
ANSWER:(c), (d), (b), (a). On0 ≤ x ≤ π, the average value ofsin x is positive; onπ/2 ≤ x ≤ 3π/2, the average value is
0; onπ ≤ x ≤ 2π, the average value is negative. Sincesin π = 0 andπ = 3.14159 . . ., the sine function changes signin the interval3.14 ≤ x ≤ 3.15. Sinceπ is closer to the left-end of3.14 ≤ x ≤ 3.15, and becausesin x changes frompositive to negative and the graph ofsin x is symmetric aboutx = π, the average value ofsin x on this interval is smalland negative.
COMMENT:Follow-up Question. What is the average value ofsin x over each interval?
Answer. (a) The average value is1
π
∫ π
0
sin x dx = 0.6366. (b) The average value is 0. (c) The average value is
1
π
∫ 2π
π
sin x dx = −0.6366. (d) The average value is1
0.01
∫ 3.15
3.14
sin x dx = −3.407× 10⁻³.

138 CHAPTER FIVE Hughes Hallett et al c©2005, John Wiley & Sons
3. Arrange the intervals in the order for which the average value ofcos x over the interval increases from smallest to largest.
(a) 0 ≤ x ≤ π(b) π/2 ≤ x ≤ 3π/2(c) 4.71 ≤ x ≤ 4.72(d) 3.14 ≤ x ≤ 3.15
ANSWER:(d), (b), (a), (c). On0 ≤ x ≤ π, the average value ofcos x is 0; onπ/2 ≤ x ≤ 3π/2, the average value is negative.
Since3π/2 is closer to the left-end of4.71 ≤ x ≤ 4.72, and becausecos x changes from negative to positive, andthe graph ofcos x is symmetric aboutx = 3π/2, the average value ofcos x on this interval is small and positive. On3.14 ≤ x ≤ 3.15, the average value is almost−1.
COMMENT:This is an excellent question to explore graphically.
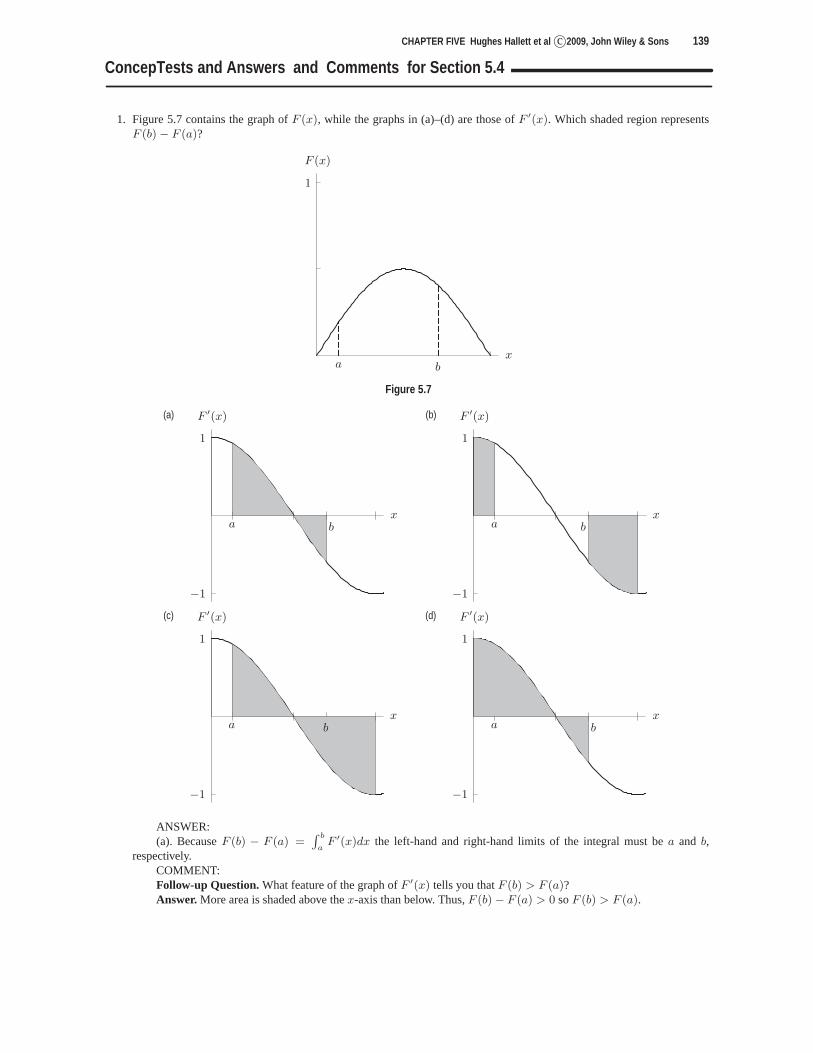
CHAPTER FIVE Hughes Hallett et al c©2009, John Wiley & Sons 139
ConcepTests and Answers and Comments for Section 5.4
1. Figure 5.7 contains the graph ofF (x), while the graphs in (a)–(d) are those ofF ′(x). Which shaded region representsF (b)− F (a)?
a b
1
x
F (x)
Figure 5.7
a b
−1
1
x
F ′(x)(a)
a b
−1
1
x
F ′(x)(b)
a b
−1
1
x
F ′(x)(c)
a b
−1
1
x
F ′(x)(d)
ANSWER:(a). BecauseF (b) − F (a) =
∫ b
aF ′(x)dx the left-hand and right-hand limits of the integral must bea and b,
respectively.COMMENT:Follow-up Question. What feature of the graph ofF ′(x) tells you thatF (b) > F (a)?Answer. More area is shaded above thex-axis than below. Thus,F (b)− F (a) > 0 soF (b) > F (a).

140 CHAPTER FIVE Hughes Hallett et al c©2005, John Wiley & Sons

Chapter Six
Chapter Six

142 CHAPTER SIX Hughes Hallett et al c©2005, John Wiley & Sons
ConcepTests and Answers and Comments for Section 6.1
1. Which of the following graphs (a)–(d) could represent an antiderivative of the function shown in Figure 6.1?
1 2 3 4 5 6
−3
−2
−1
1
2
3
x
y
Figure 6.1
1 2 3 4 5 6
−1
1
x
y(a)
1 2 3 4 5 6
−1
1
x
y(b)
1 2 3 4 5 6
1
2
3
4
5
x
y(c)
1 2 3 4 5 6
1
2
3
4
5
x
y(d)
ANSWER:(d). Because the graph in Figure 6.1 is decreasing, the graphof the antiderivative must be concave down. Because
the graph in Figure 6.1 is positive forx < 3, zero forx = 3, and negative forx > 3, thenx = 3 is a local maximum.COMMENT:You can mimic this problem withy = x− 3.

CHAPTER SIX Hughes Hallett et al c©2009, John Wiley & Sons 143
2. Which of the following graphs (a)–(d) could represent an antiderivative of the function shown in Figure 6.2?
π/2 π
1
x
y
Figure 6.2
π/2 π
−1
1
x
y(a)
π/2 π
−1
1
x
y(b)
π/2 π
1
2
x
y(c)
π/2 π
1
2
x
y(d)
ANSWER:(c). Because the graph in Figure 6.2 is always positive on this interval, the antiderivative must be increasing for this
interval.COMMENT:You can mimic this problem withy = − sin x. You could also ask your students to draw other possible antiderivatives
of the function shown in Figure 6.2.

144 CHAPTER SIX Hughes Hallett et al c©2005, John Wiley & Sons
3. Which of the following graphs (a)–(d) could represent an antiderivative of the function shown in Figure 6.3?
−3 −2 −1 1 2 3
−27
−18
−9
9
18
27
x
y
Figure 6.3
−3 −2 −1 1 2 3
−5
5
10
15
20
25
x
y(a)
−3 −2 −1 1 2 3
−10
−5
5
10
x
y(b)
−3 −2 −1 1 2 3
−10
−5
5
10
x
y(c)
−3 −2 −1 1 2 3
−25
−20
−15
−10
−5
5
x
y(d)
ANSWER:(a) and (d). Because the graph in Figure 6.3 is continually increasing, the graph of its antiderivative is concave up.
Notice that the graphs in (a) and (d) differ only by a verticalshift.COMMENT:You could also point out that since the graph in Figure 6.3 is negative from−3 < x < 0, then the graph of an
antiderivative must be decreasing on this interval. Also, since the graph in Figure 6.3 is positive for0 < x < 3, then thegraph of an antiderivative must be increasing on this interval.

CHAPTER SIX Hughes Hallett et al c©2009, John Wiley & Sons 145
4. Consider the graph off ′(x) in Figure 6.4. Which of the functions with values from the Table 6.1 could representf(x)?
Table 6.1
x 0 2 4 6
(a) g(x) 1 3 4 3
(b) h(x) 5 7 8 7
(c) j(x) 32 34 35 34
(d) k(x) −9 −7 −6 −71 2 3 4 5 6
−1
1
x
yf ′(x)
Figure 6.4
ANSWER:(a), (b), (c), (d)COMMENT:You might point out only relative values of functions are important for this problem, not the actual values.

146 CHAPTER SIX Hughes Hallett et al c©2005, John Wiley & Sons
5. Graphs of thederivativesof four functions are shown in (I)–(IV). For thefunctions(not the derivative) list in increasingorder which has the greatest change in value on the interval shown.
(a) (I), (IV), (III), (II)(b) (I), (IV), (II), (III)(c) (I) = (II), (IV), (III)(d) (I) = (II), (III) = (IV)(e) (I) = (II) = (III) = (IV)
1 2 3 4
1
2
3
4
5
x
y(I)
1 2 3 4
1
2
3
4
5
x
y(II)
1 2 3 4
1
2
3
4
5
x
y(III)
1 2 3 4
1
2
3
4
5
x
y(IV)
ANSWER:(e). The ordering will be given by the values of the area underthe derivative curves. These areas are (I)(1/2)(4)(4) =
8, (II) (1/2)(2)(4 + 2) + (1/2)(2)(2) = 8, (III) 2(3) + 2(1) = 8, and (IV)4(2) = 8.COMMENT:You can draw some other graphs of derivatives and ask which function has the greatest change over a specified
interval.

CHAPTER SIX Hughes Hallett et al c©2009, John Wiley & Sons 147
6. Graphs of thederivativesof four functions are shown in (I) - (IV). For thefunctions(not the derivative) list in increasingorder which has the greatest change in value on the interval shown.
(a) (I), (III), (IV), (II)(b) (I) = (III), (IV), (II)(c) (IV), (I) = (III), (II)(d) (I) = (III) = (IV), (II)(e) (I) = (II) = (III) = (IV)
1 2 3 4
1
2
3
4
x
y(I)
1 2 3 4
1
2
3
4
x
y(II)
1 2 3 4
1
2
3
4
x
y(III)
1 2 3 4
1
2
3
4
x
y(IV)
ANSWER:(d). The ordering will be given by the values of the area underthese curves. These areas are (I)4(2)+(1/2)(2)(2) =
10, (II) 4(2) + 2(1/2)(2)(2) = 12, (III) same as (I), 10, and (IV)(1/2)(2)(2 + 4) + 2(2) = 10.COMMENT:You could ask students how to change graph (II) to have area equal to 10 and not be identical to any of the other
graphs.

148 CHAPTER SIX Hughes Hallett et al c©2005, John Wiley & Sons
ConcepTests and Answers and Comments for Section 6.3
1. Graphs (I)–(III) show velocity versus time for three different objects. Order graphs (I)–(III) in terms of the distancetraveled in four seconds. (Greatest to least)
(a) (I), (II), (III)(b) (III), (II), (I)(c) (II), (III), (I)(d) (II) = (III), (I)(e) (I) = (II) = (III)
1 2 3 4
1
2
3
4
t (sec)
velocity(I)
1 2 3 4
1
2
3
4
t (sec)
velocity(II)
1 2 3 4
1
2
3
4
t (sec)
velocity(III)
ANSWER:(d). The distance traveled in this situation is the area under the graph. These areas are (I)(1/2)(4)(4) = 8, (II)
(1/2)(4)(4 + 2) = 12, (III) (1/2)(4)(4 + 2) = 12.COMMENT:You could mimic this problem usingy = 4− x, y = 4− x/2, andy = 1 + 3x.

CHAPTER SIX Hughes Hallett et al c©2009, John Wiley & Sons 149
2. Figure 6.5 contains a graph of velocity versus time. Whichof the following could be an associated graph of positionversus time?
(a) (I) (b) (II) (c) (III)(d) (IV) (e) (I), (IV) (f) (II), (III)
1 2 3
2
4
6
8
t
velocity
Figure 6.5
1 2 3
4
8
12
t
position(I)
1 2 3
−2
−4
−6
−8
t
position(II)
1 2 3
2
4
6
8
t
position(III)
1 2 3
4
8
12
t
position(IV)
ANSWER:(e). Because the velocity is positive for the interval shown, the position versus time graph must be increasing for the
interval. Notice graphs (I) and (IV) differ by a vertical shift and both are possible.COMMENT:You could start with simpler problems usingy = 1, theny = x, and finallyy = x2.

150 CHAPTER SIX Hughes Hallett et al c©2005, John Wiley & Sons
3. Figure 6.6 contains a graph of velocity versus time. Whichof (a)–(d) could be an associated graph of position versustime?
1 2 3
−1
1
t
velocity
Figure 6.6
1 2 3
1
t
position(a)
1 2 3
−1
1
t
position(b)
1 2 3
−1
t
position(c)
1 2 3
1
2
t
position(d)
ANSWER:(a). Because the velocity goes from a positive value to a negative value atx ≈ 1.6, the position will be a maximum
there.COMMENT:You could elaborate why each of the other choices has properties which exclude it.

CHAPTER SIX Hughes Hallett et al c©2009, John Wiley & Sons 151
ConcepTests and Answers and Comments for Section 6.4
1. If the graph off is given in Figure 6.7, then which of (a)–(d) is the graph of
∫ x
−3
f(t) dt for −3 < x < 2?
−3 −2 −1 1 2
2
4
6
8
x
y
Figure 6.7
−3 −2 −1 1 2
1
2
3
4
x
y(a)
−3 −2 −1 1 2
2
4
6
8
x
y(b)
−3 −2 −1 1 2
2
4
6
8
x
y(c)
−3 −2 −1 1 2
1
2
3
4
x
y(d)
ANSWER:
(c). Because
∫ −3
−3
f(t) dt = 0, the point(−3, 0) is on the graph of
∫ x
−3
f(t) dt. Because the graph off is positive
and increasing,
∫ x
−3
f(t) dt will be increasing and concave up.
COMMENT:Each choice could be examined in detail to show why it is not appropriate.

152 CHAPTER SIX Hughes Hallett et al c©2005, John Wiley & Sons
2. If the graph off is given in Figure 6.8, then which of (a)–(d) is the graph of
∫ x
2
f(t) dt for 0 ≤ x ≤ 4?
1 2 3 4
1
2
3
4
x
y
Figure 6.8
1 2 3 4
−2
2
4
6
8
10
x
y(a)
1 2 3 4
−2
2
4
6
8
10
x
y(b)
1 2 3 4
−2
2
4
6
8
10
x
y(c)
1 2 3 4
−2
2
4
6
8
10
x
y(d)
ANSWER:
(d). Because
∫ 2
2
f(t) dt = 0, the point(2, 0) is on the graph of
∫ x
2
f(t) dt. Because
∫ 0
2
f(t) dt = −∫ 2
0
f(t) dt
and
∫ 2
0
f(t) dt is positive, then
∫ 0
2
f(t) dt is negative.
COMMENT:This example is useful showing the value of interchanging limits.

CHAPTER SIX Hughes Hallett et al c©2009, John Wiley & Sons 153
3. If the graph off is given in Figure 6.9, then which of (a)–(d) is the graph of
∫ x
1
f(t) dt for 0 ≤ x ≤ 3?
1 2 3
1
2
3
4
5
6
7
8
x
y
Figure 6.9
1 2 3
1
2
3
x
y(a)
1 2 3
−3
−2
−1
1
2
3
x
y(b)
1 2 3−1
1
2
3
4
5
6
x
y(c)
1 2 3
1
2
3
x
y(d)
ANSWER:
(b). Because
∫ 1
1
f(t) dt = 0, the graph of
∫ x
1
f(t) dt will contain the point(1, 0). Becausef(x) is positive and∫ 0
1
f(t) dt = −∫ 1
0
f(t) dt, then
∫ 0
1
f(t) dt < 0. f is a decreasing function, so
∫ x
1
f(t) dt will be concave down.
COMMENT:Have students justify the last statement in the answer.
154 CHAPTER SIX Hughes Hallett et al c©2005, John Wiley & Sons

Chapter Seven
Chapter Seven

156 CHAPTER SEVEN Hughes Hallett et al c©2005, John Wiley & Sons
ConcepTests and Answers and Comments for Section 7.1
For Problems 1–3, can the integral can be converted to the form∫
wn dw by a substitution, wheren is a constant?
1. (a)∫
x sin(x2) dx
(b)
∫
1
x ln xdx
(c)
∫
1
tan xdx
(d)∫
x2(x3 + 3)6 dxANSWER:(b), (c), and (d). In (b)w = ln x yields
∫
w−1 dw, in (c) w = sin x yields∫
w−1 dw, and in (d)w = x3 + 3 yields13
∫
w6 dw.COMMENT:While w = x2 is a useful substitution for (a), the result is not of the form
∫
wn dw.
2. (a)
∫
4x3 + 3√x4 + 3x
dx
(b)
∫
ex − e−x
(ex + e−x)3dx
(c)
∫
2x
x2 + 1dx
(d)
∫
sin x
xdx
ANSWER:(a), (b), and (c). In (a)w = x4 + 3x yields
∫
w−1/2 dw, in (b) w = ex + e−x yields∫
w−3 dw, in (c) w = x2 + 1
yields∫
w−1 dw.COMMENT:There is no substitution that converts (d) into a function which has an elementary antiderivative.
3. (a)
∫
x16(x17 + 16)16 dx
(b)
∫
x16(x17 + 16x)16 dx
(c)
∫
18x
1 + 6x3dx
(d)
∫
ex
ex + 6dx
ANSWER:(a) and (d). In (a)w = x17 + 16 yields 1
17
∫
w16 dw, in (d) w = ex + 6 yields∫
w−1 dw.COMMENT:You might note whyw = x17 + 16x does not work for choice (b).
4. Which of the following integrals yields an arcsine or arctangent function upon integration after an appropriate substitution?
(a)
∫
x
4− x2dx
(b)
∫
4
4 + x2dx
(c)
∫
x√4− x2
dx
(d)
∫
x√4− x4
dx
ANSWER:(b) and (d). In (b)w = x/2 yields an arctangent function while in (d)w = x2/2 yields an arcsine function.COMMENT:You might note which substitution works in (a) and (c).

CHAPTER SEVEN Hughes Hallett et al c©2009, John Wiley & Sons 157
ConcepTests and Answers and Comments for Section 7.2
1. For which of the following integrals is integration by parts with u = x andv′ = (the rest of the integrand) a reasonablechoice?
(a)
∫
x(ln x)2 dx
(b)
∫
xex3
dx
(c)
∫
x sin x dx
(d)
∫
x
ln xdx
ANSWER:(c). Calculating this integral using integration by parts requires knowing
∫
cos x dx. In contrast, using parts with
u = x on (a) requires the knowledge of∫
(ln x)2 dx; (b) requires the knowledge of∫
ex3
dx; (d) requires the knowledge
of
∫
1
ln xdx.
COMMENT:Compute (c); the value is−x cos x + sin x.
ConcepTests and Answers and Comments for Section 7.3
1. Which of the following integrals equals∫
x5 cos(x3) dx with the given substitution?
(a)∫
w5 cos w dw, w = x3
(b)∫
w5/3 cos w dw, w = x3
(c) 13
∫
w cos w dw, w = x3
(d)∫
w cos(w3/5) dw, w = x5
ANSWER:(c). Only the third substitution gives the original integral.COMMENT:Follow-up Question. In the other three cases, what is wrong?
2. True or false? Using the given substitution,
∫
ex + 1
exdx equals
(a)
∫
w
w − 1dw, w = ex + 1
(b)
∫
−(1 + ew) dw, w = −x
(c)
∫
w + 1
wdw, w = ex
(d)
∫
w dw, w =ex + 1
ex
ANSWER:(b). Only the second integral is equal to the original integral.COMMENT:Follow-up Question. In the other three cases, what is wrong?

158 CHAPTER SEVEN Hughes Hallett et al c©2005, John Wiley & Sons
ConcepTests and Answers and Comments for Section 7.4
1. Which of the following integrals can be integrated using partial fractions?
(a)
∫
1
x4 − 3x2 + 2dx (b)
∫
1
x4 + 1dx
(c)
∫
1
x3 − 4xdx (d)
∫
1
x4 + 2x2 + 2dx
ANSWER:(a) and (c). In (a) the denominator factors as(x2 − 2)(x2 − 1) = (x −
√2)(x +
√2)(x − 1)(x + 1), so partial
fractions will work. In (c) the denominator factors asx(x− 2)(x + 2), so partial fractions will work.COMMENT:You might note that in (b) the denominator does not factor into real factors and in (d) the denominator equals
(x2 + 1)2 + 1, which has no real factors.
For Problems 2–9, which of the following techniques is useful in evaluating the integral?
(a) Integration by parts (b) Partial fractions (c) Long division(d) Completing the square (e) A trig substitution (f) Other substitutions
2.
∫
x2
√1− x2
dx
ANSWER:(e).x = sin θ is appropriate.COMMENT:It is interesting to note that students may initially make the substitutionw2 = 1 − x2 so the integral becomes
−∫ √
1− w2 dw. However, this integral still requires a trigonometric substitution.
3.
∫
1√6x− x2 − 8
dx
ANSWER:(d) and (e).6x− x2 − 8 = 1− (3− x)2, sox− 3 = sin θ is appropriate.COMMENT:You could point out that completing the square is often useful when using tables of integrals.
4.
∫
x sin x dx
ANSWER:(a).u = x, v′ = sin x works with integration by parts.COMMENT:Follow-up Question. Which technique would be useful if the integrand werex2 sin x?Answer. (a). You will need to use integration by parts twice. Initially u = x2, v′ = sin x, and the second timeu = x,
v′ = cos x.
5.
∫
x√1− x2
dx
ANSWER:(e) and (f).w = sin x andw = 1− x2 work.COMMENT:Follow-up Question. Which technique would be useful if thex in the numerator was replaced byx2?Answer. (a) and either (e) or (f). This integral can be evaluated in two steps. Initially, using integration by parts, let
u = x, v′ = x/√
1− x2. In order to finish finding the antiderivative, you will have the integral that is in the Problem 2.
6.
∫
x2
1− x2dx
ANSWER:
(c) and (b).x2
1− x2= −1 +
1
1− x2= 1 +
1
(1− x)(1 + x).
COMMENT:Follow-up Question. Which technique would be useful if thex2 in the numerator was replaced byx?Answer. (f). The substitutionw = 1− x2 would be appropriate.

CHAPTER SEVEN Hughes Hallett et al c©2009, John Wiley & Sons 159
7.
∫
(1 + x2)−3/2 dx
ANSWER:(e).x = tan θ works.COMMENT:Follow-up Question. Which technique would be useful if there was a multiplicative factor ofx in the integrand?Answer. (f). The substitutionw = 1 + x2 would be appropriate.
8.
∫
x√1− x4
dx
ANSWER:(e) and (f).x2 = sin θ andw = x2 both work.COMMENT:Follow-up Question. Which technique would be useful if the 1 under the square rootsign was replaced by 16?Answer. (f). Rewrite the integrand asx/(4
√
1− x4/16), and letw = x2/4.
9.
∫
1
1− x2dx
ANSWER:(b). Since the denominator factors as(1− x)(1 + x) then partial fractions is appropriate.COMMENT:Follow-up Question. Which technique would be useful if the denominator was16− x2?Answer. (b). Since the denominator factors as(4− x)(4 + x) then partial fractions is an appropriate method.
ConcepTests and Answers and Comments for Section 7.5
1. The graph in Figure 7.1 is that ofy = f(x) for 0 < x < 2.
1 2
−1
0
1
x
Figure 7.1
For each of the following find the largest intervala < x < b so that
∫ b
a
f(x) dx has the given property.
(a) Both right and trapezoid approximations give overestimates.(b) Both left and midpoint approximations give overestimates.(c) Both right and midpoint approximations give underestimates.(d) Both left and trapezoid approximations give underestimates.
ANSWER:
(a) This occurs where the function is increasing and concaveupa ≈ 1.6, b = 2.(b) This occurs where the function is decreasing and concavedowna ≈ 0.4, b = 1.(c) This occurs where the function is decreasing and concaveupa = 1, b ≈ 1.5.(d) This occurs where the function is increasing and concavedowna = 0, b ≈ 0.4
COMMENT:You may want to sketch other graphs and ask the same question.

160 CHAPTER SEVEN Hughes Hallett et al c©2005, John Wiley & Sons
ConcepTests and Answers and Comments for Section 7.6
1. (a) For what type of integrand do the Left Sum and Right Sum approximations give the exact value for the integral onany interval?
(b) For what type of integrand do the Trapezoid and Midpoint rules give the exact value for the integral on any interval?ANSWER:
(a) For any constant function.(b) For any linear function.
COMMENT:Follow-up Question. What about Simpson’s rule?
2. True or false? If the Trapezoid rule overestimates the value of an integral, then the Midpoint rule underestimates thevalueof that same integral.
ANSWER:False. Considerf(x) = | sin x| on0 ≤ x ≤ 2π. Then
∫ 2π
0f(x) dx is positive, but both the trapezoid and midpoint
rule give 0.COMMENT:Follow-up Question. Under what condition is this statement true?
3. Is it possible to find a function such that all four methods (Left Sum, Right Sum, Midpoint, Trapezoid) overestimate thevalue of an integral using one subinterval?
ANSWER:Yes. Letf(x) be equal to−| sin x| on [0, 2π]. On this interval, using one subinterval, all four methods give a value
of 0. The value of the integral is negative, so all four are overestimates.COMMENT:All four methods also give the same estimate for this example.
ConcepTests and Answers and Comments for Section 7.7
1. The graph in Figure 7.2 is that ofy = 2−x. Which of the following represents the areas of the rectangles consideredsequentially?
(a) 1/2, 3/4, 7/8, 15/16, . . . (b) 1/2, 1/4, 1/8, 1/16, . . .(c) 1/2, 1/3, 1/4, 1/5, . . . (d) 1, 2, 3, 4, 5, . . .
1 2 3 4 5
0.1
0.2
0.3
0.4
0.5
0.6
x
y
Figure 7.2
ANSWER:(b). Because the top of all the rectangles lie ony = 2−x, their heights will be1/2, 1/4, 1/8, 1/16, . . .. Since the
width of each rectangle is 1, this is also the sequence of areas.COMMENT:You could point out that this is a left-hand sum for a decreasing function, therefore this sum is greater than the area
under the curve.

CHAPTER SEVEN Hughes Hallett et al c©2009, John Wiley & Sons 161
2. The graph in Figure 7.3 is that ofy = 2−x and the area of sequential rectangles is1/2, 1/4, 1/8, 1/16, . . .. What can youconclude?
(a) The area under the graph of this function from 1 tox asx approaches infinity is finite.(b) The area under the graph of this function from 1 tox asx approaches infinity is infinite.(c) There is no way to determine whether the area considered is finite or infinite.
1 2 3 4 5
0.1
0.2
0.3
0.4
0.5
0.6
x
y
Figure 7.3
ANSWER:(a). The area of sequential rectangles forms a geometric sequence with a common ratio of1/2. Thus the sequence
converges. Since the sum of the sequence is an overestimate of the area under the curve, then the area under the curvemust also be finite.
COMMENT:You could also uses = a0/(1− r) as the sum to obtain an upper bound.
3. The curve in Figure 7.4 is that ofy = 1/x and the widths of the rectangles are1/32, 1/16, 1/8, 1/4, . . .. Which of thefollowing sequences of numbers represents the area of the rectangles in sequential order from left to right?
(a) 1, 1, 1, 1, . . . (b) 1/2, 1/4, 1/8, 1/16, . . .(c) 1/2, 1/2, 1/2, 1/2, . . . (d) 1/2, 1/3, 1/4, 1/5, . . .
0.1 0.2 0.3 0.4 0.5 0.6
2
4
6
8
10
12
14
16
x
y
Figure 7.4
ANSWER:(c). The areas are16(1/32), 8(1/16), 4(1/8), 2(1/4), . . ..COMMENT:
This process can be continued to obtain the infinite sequence1/2, 1/2, 1/2, 1/2, . . . for these areas. Because
∫ ∞
1/32
1/x dx
is larger than the sum of the infinite sequence1/2, 1/2, 1/2, 1/2, . . ., this integral will not be bounded.

162 CHAPTER SEVEN Hughes Hallett et al c©2005, John Wiley & Sons
4. Which of the following are improper integrals? Explain why.
(a)
∫ ∞
1
sin x
xdx
(b)
∫ 5
4
1
xdx
(c)
∫ 4
3
1
sin xdx
(d)
∫ 3
−3
x−1/3 dx
(e)
∫ 10
−10
f(x) dx, wheref(x) =
{
1x
+ 2 , −10 ≤ x < −11
x+2, −1 ≤ x ≤ 10
ANSWER:(a), (c), and (d). For (a) any integral with infinity as a limitis improper, in (c)sin π = 0, so the function is not
bounded on this interval, and for (d)x−1/3 causes the integrand to be unbounded atx = 0.
COMMENT:Some students may profit by seeing another example to point out the difference between having a discontinuity with
a finite jump and one with a one-sided limit that grows withoutbound.
5. Give an example of a function such thatlimt→∞
f(t) = 0 but
∫ ∞
1
f(t) dt diverges.
ANSWER:f(t) = 1/tb where0 < b ≤ 1.COMMENT:Have students give several examples here.
6. Give an example of a function such thatlimt→0+
f(t) =∞ but
∫ 1
0
f(t) dt is finite.
ANSWER:f(t) = 1/tb, 0 < b < 1.COMMENT:Have students give several examples here.
7. Which of the following techniques is useful in evaluating
∫
1√
x√
1 +√
xdx?
(a) Integration by parts (b) Partial fractions (c) Long division(d) Completing the square (e) A trig substitution (f) Other substitutions
ANSWER:(f). w = 1 +
√x works, sincex = (w − 1)2, dx = 2(w − 1)dw
and∫
1√
x√
1 +√
xdx =
∫
2(w − 1)
(w − 1)√
wdw = 2
∫
dw√w
.
COMMENT:Follow-up Question. If this were a definite integral froma to b, what are the limitations ona andb?Answer. 0 ≤ a, b, <∞.
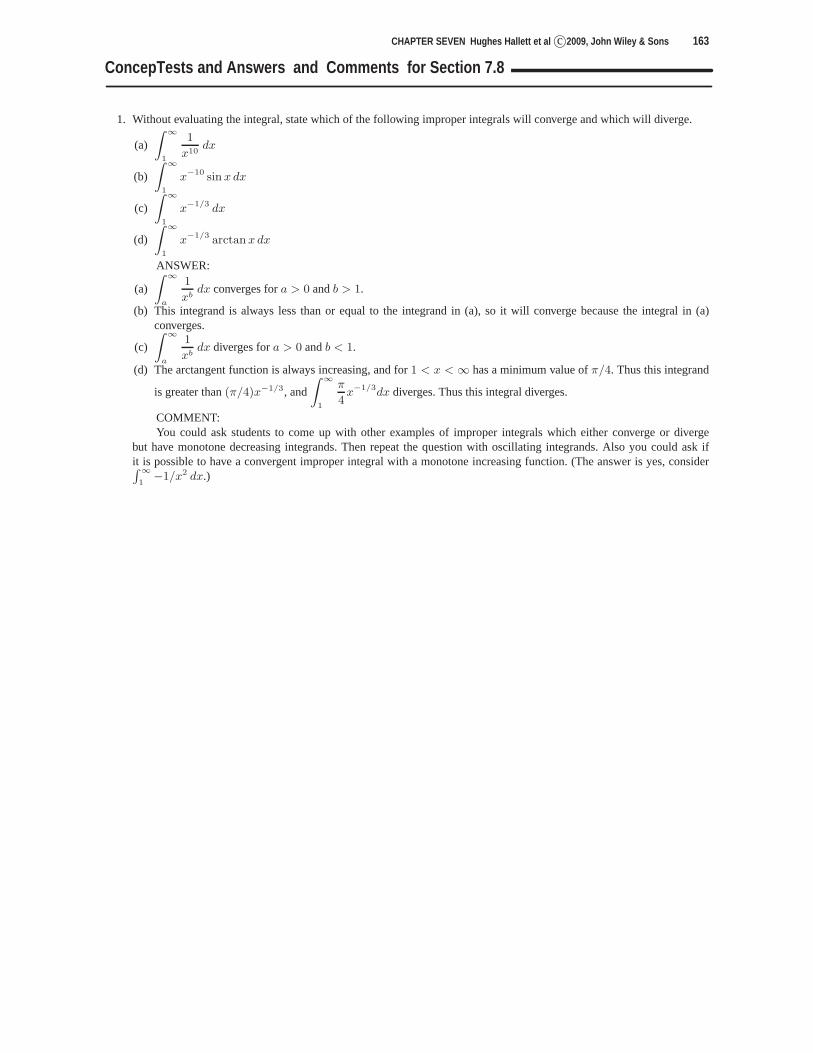
CHAPTER SEVEN Hughes Hallett et al c©2009, John Wiley & Sons 163
ConcepTests and Answers and Comments for Section 7.8
1. Without evaluating the integral, state which of the following improper integrals will converge and which will diverge.
(a)
∫ ∞
1
1
x10dx
(b)
∫ ∞
1
x−10 sin x dx
(c)
∫ ∞
1
x−1/3 dx
(d)
∫ ∞
1
x−1/3 arctan x dx
ANSWER:
(a)
∫ ∞
a
1
xbdx converges fora > 0 andb > 1.
(b) This integrand is always less than or equal to the integrand in (a), so it will converge because the integral in (a)converges.
(c)
∫ ∞
a
1
xbdx diverges fora > 0 andb < 1.
(d) The arctangent function is always increasing, and for1 < x <∞ has a minimum value ofπ/4. Thus this integrand
is greater than(π/4)x−1/3, and
∫ ∞
1
π
4x−1/3dx diverges. Thus this integral diverges.
COMMENT:You could ask students to come up with other examples of improper integrals which either converge or diverge
but have monotone decreasing integrands. Then repeat the question with oscillating integrands. Also you could ask ifit is possible to have a convergent improper integral with a monotone increasing function. (The answer is yes, consider∫ ∞1−1/x2 dx.)

164 CHAPTER SEVEN Hughes Hallett et al c©2005, John Wiley & Sons

Chapter Eight
Chapter Eight

166 CHAPTER EIGHT Hughes Hallett et al c©2005, John Wiley & Sons
ConcepTests and Answers and Comments for Section 8.1
1. Which of the following graphs (a)–(d) represents the areaunder the line shown in Figure 8.1 as a function ofx?
1 2 3 4 5
1
x
y
Figure 8.1
1 2 3 4 5
1
2
3
4
5
x
y(a)
1 2 3 4 5
1
2
3
4
5
x
y(b)
1 2 3 4 5
1
2
3
4
5
x
y(c)
1 2 3 4 5
1
2
3
4
5
x
y(d)
ANSWER:(a). Because the graph shown is that of a positive constant, the area will be directly proportional to the length of the
interval.COMMENT:You could have your students explain why choice (d) is not thearea under any given function from 0 tox.

CHAPTER EIGHT Hughes Hallett et al c©2009, John Wiley & Sons 167
2. Which of the following graphs (a)–(d) represents the areaunder the line shown in Figure 8.2 as a function ofx?
1 2 3 4 5
1
2
3
4
5
x
y
Figure 8.2
1 2 3 4 5
1
x
y(a)
1 2 3 4 5
3
6
9
12
15
x
y(b)
1 2 3 4 5
3
6
9
12
15
x
y(c)
1 2 3 4 5
3
6
9
12
15
x
y(d)
ANSWER:(d). Because the graph in Figure 8.2 is positive and increasing, its antiderivative is increasing and concave up.COMMENT:You could ask your students which properties a function musthave so that the graph of its area from 0 tox is concave
down.

168 CHAPTER EIGHT Hughes Hallett et al c©2005, John Wiley & Sons
3. Consider the area between the two functions shown in Figure 8.3. Which of the following graphs (a)–(d) represents thisarea as a function ofx?
1 2
1
2
3
4
x
y
Figure 8.3
1 2
1
2
3
4
x
y(a)
1 2
1
2
3
4
x
y(b)
1 2
1
2
3
4
x
y(c)
1 2
1
2
3
4
x
y(d)
ANSWER:(d) Because the vertical distance between the two curves continually decreases, the graph of the area between these
curves will be increasing and concave down.COMMENT:Follow-up Question. How can you change the curves in Figure 8.3 so that the graph representing the area between
the curves is horizontal for some interval?Answer. In order for the graph representing the area between the curves to be horizontal on an interval, the area
between the graphs is unchanging. Therefore, on that interval the two curves should be equal.

CHAPTER EIGHT Hughes Hallett et al c©2009, John Wiley & Sons 169
4. Consider the area between the two functions shown in Figure 8.4. Which of the following graphs (a)–(d) represents thisarea as a function ofx?
π/6 π/3 π/2 2π/3 5π/6
1
2
3
x
y
Figure 8.4
π/6 π/3 π/2 2π/3 5π/6
1
2
3
x
y(a)
π/6 π/3 π/2 2π/3 5π/6
1
2
3
x
y(b)
π/6 π/3 π/2 2π/3 5π/6
1
2
3
x
y(c)
π/6 π/3 π/2 2π/3 5π/6
1
2
3
x
y(d)
ANSWER:(b). Because the vertical distance between the two curves increases, and then decreases, the graph of the area between
them will first be concave up and then concave down.COMMENT:Follow-up Question. What situation would cause the area between the two curves tochange from concave down to
concave up as in choice (c)?Answer. Whenx = 0 the curves are far apart and move closer to each other untilx ≈ π/3. At this point the curves
move farther apart.

170 CHAPTER EIGHT Hughes Hallett et al c©2005, John Wiley & Sons
5. Consider the area between the two functions shown in Figure 8.5. Which of the following graphs (a)–(d) represents thisarea as a function ofx?
π/2 π 3π/2 2π
1
2
3
4
5
6
7
x
y
Figure 8.5
π/2 π 3π/2 2π
1
2
x
y(a)
π/2 π 3π/2 2π
5
10
15
20
x
y(b)
π/2 π 3π/2 2π
1
2
3
4
x
y(c)
π/2 π 3π/2 2π
2
4
6
8
10
x
y(d)
ANSWER:(c). Because the vertical distance between the two curves increases for0 < x < π/2 andπ < x < 3π/2, the graph
of the area will be concave up in these intervals. It will be concave down in the other intervals because there the verticaldistance between the given curves decreases.
COMMENT:Follow-up Question. How is the graph of the integral from 0 tox of the difference between these two functions
related to the graph in (c)?Answer. After x = π, the graph in (c) needs to be reflected across the liney = 2 in order to represent the integral of
the difference between the curves from 0 tox.

CHAPTER EIGHT Hughes Hallett et al c©2009, John Wiley & Sons 171
6. A concrete slab in the form of an isosceles right triangle (the two legs are 5 meters in length) is the base for a tent (seeFigure 8.6). The ribs and ceiling of the tent are made of polessuch that a cross-section of the tent forms a square. (Thiscross-section is parallel to one leg as it connects the hypotenuse to the other leg.) There are only two tents that have thisconfiguration, one with the ribs attached to thex-axis, and the other with ribs attached to the linex = 5. Which of thefollowing statements is true?
(a) The tent with ribs fastened to thex-axis and hypotenuse will contain the larger volume.(b) The tent with ribs fastened to the linex = 5 and hypotenuse will contain the larger volume.(c) The tents in choices (a) and (b) will contain the same volume.(d) We need more information to determine which will containthe larger volume.
1 2 3 4 5
1
2
3
4
5
x
Figure 8.6
ANSWER:(c) This can be seen using symmetry considerations.COMMENT:You may have students who need to actually set up the two integrals before believing the answer.
7. Which of the following gives the volume of the tent in Question 6?
(a)
∫ 5
0
x2 dx
(b)
∫ 5
0
(5− y)2 dy
(c) Either answer in (a) or (b)(d) None of the above
ANSWER:(c). Choice (a) is obtained by slicing along thex-axis, choice (b) by slicing along the linex = 5. (Recall that the
hypotenuse is given byy = x.)COMMENT:You can mimic this question and Question 6 by having the cross-section of the tent be an isosceles right triangle or a
trapezoid (with two sides perpendicular to the base and the other sides unequal).
8. Now consider a tent over the same slab from Questions 6 and 7where the ribs are placed parallel to one leg and attachedto the hypotenuse so the cross-section forms a semi-circle,with the diameter along the slab. The ratio of the resultingvolume to the volume having square cross-sections as in Question 7 is
(a) π/16(b) π/8(c) π/4(d) π/2
ANSWER:(b). This can be seen by noting that the volume of a cross-section of width∆x is (1/2)π(radius)2∆x = (1/2)π(x/2)2∆x
and the area of the square cross-section (as in Question 7) ofwidth ∆x is x2∆x.COMMENT:Have the students draw cross-sections to compare the area ofa square with a semi-circle with one of the sides as a
base to estimate the answer before doing any calculations.
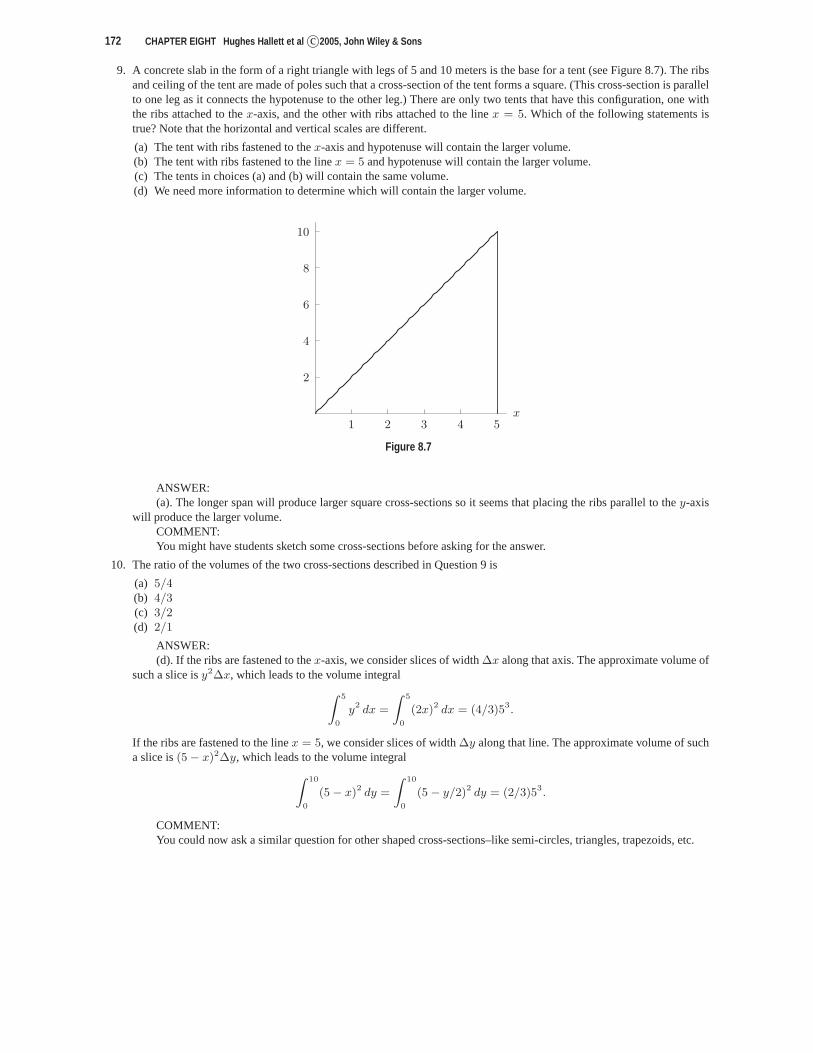
172 CHAPTER EIGHT Hughes Hallett et al c©2005, John Wiley & Sons
9. A concrete slab in the form of a right triangle with legs of 5and 10 meters is the base for a tent (see Figure 8.7). The ribsand ceiling of the tent are made of poles such that a cross-section of the tent forms a square. (This cross-section is parallelto one leg as it connects the hypotenuse to the other leg.) There are only two tents that have this configuration, one withthe ribs attached to thex-axis, and the other with ribs attached to the linex = 5. Which of the following statements istrue? Note that the horizontal and vertical scales are different.
(a) The tent with ribs fastened to thex-axis and hypotenuse will contain the larger volume.(b) The tent with ribs fastened to the linex = 5 and hypotenuse will contain the larger volume.(c) The tents in choices (a) and (b) will contain the same volume.(d) We need more information to determine which will containthe larger volume.
1 2 3 4 5
2
4
6
8
10
x
Figure 8.7
ANSWER:(a). The longer span will produce larger square cross-sections so it seems that placing the ribs parallel to they-axis
will produce the larger volume.COMMENT:You might have students sketch some cross-sections before asking for the answer.
10. The ratio of the volumes of the two cross-sections described in Question 9 is
(a) 5/4(b) 4/3(c) 3/2(d) 2/1
ANSWER:(d). If the ribs are fastened to thex-axis, we consider slices of width∆x along that axis. The approximate volume of
such a slice isy2∆x, which leads to the volume integral
∫ 5
0
y2 dx =
∫ 5
0
(2x)2 dx = (4/3)53.
If the ribs are fastened to the linex = 5, we consider slices of width∆y along that line. The approximate volume of sucha slice is(5− x)2∆y, which leads to the volume integral
∫ 10
0
(5− x)2 dy =
∫ 10
0
(5− y/2)2 dy = (2/3)53.
COMMENT:You could now ask a similar question for other shaped cross-sections–like semi-circles, triangles, trapezoids, etc.

CHAPTER EIGHT Hughes Hallett et al c©2009, John Wiley & Sons 173
ConcepTests and Answers and Comments for Section 8.2
1. Imagine taking the enclosed region in Figure 8.8 and rotating it about thex-axis. Which of the following graphs (a)–(d)represents the resulting volume as a functionx?
1 2 3 4 5
1
x
y
Figure 8.8
1 2 3 4 5
1
x
y(a)
1 2 3 4 5
4
8
12
16
x
y(b)
1 2 3 4 5
4
8
12
16
x
y(c)
1 2 3 4 5
4
8
12
16
x
y(d)
ANSWER:(b). The volume of a small disc of width∆x is π(1)2∆x, so the volume integral giving the total volume is
∫ x
0
π dx = πx where0 < x < 5.
COMMENT:Notice that the volume has the shape of a cylinder, so the volume will be directly proportional to its height.

174 CHAPTER EIGHT Hughes Hallett et al c©2005, John Wiley & Sons
2. Imagine taking the enclosed region in Figure 8.9 and rotating it about they-axis. Which of the following graphs (a)–(d)represent the resulting volume as a function ofx?
x
1
t
y
Figure 8.9
1 2 3 4 5
1
2
3
4
x
y(a)
1 2 3 4 5
20
40
60
80
x
y(b)
1 2 3 4 5
1
2
x
y(c)
1 2 3 4 5
20
40
60
80
x
y(d)
ANSWER:(d). This gives a cylinder of radiusx and height 1, volume equalsπx2.COMMENT:You could also point out that slicing along the vertical axisgives a trivial integration.

CHAPTER EIGHT Hughes Hallett et al c©2009, John Wiley & Sons 175
3. Imagine that the region between the graphs off andg in Figure 8.11 is rotated about they-axis to form a solid. Which ofthe following represents the volume of this solid?
(a)
∫ q
0
2πx(f(x)− g(x)) dx
(b)
∫ q
0
(f(x)− g(x)) dx
(c)
∫ q
0
π(f(x)− g(x))2 dx
(d)
∫ q
0
(πf2(x)− πg2(x)) dx
(e)
∫ q
0
πx(f(x)− g(x)) dx
0 q
g(x)
f(x)
x
y
Figure 8.10
ANSWER:(a). The volume resulting from rotating the area between thetwo curves bounded byx andx + ∆x is the difference
between the two right cylinders with these two radii. The height of the larger cylinder isf(x + ∆x) − g(x + ∆x) andits radius isx + ∆x, while the height of the smaller cylinder isf(x) − g(x), with a radius ofx. Thus the differencebetween these two volumes isπ(f(x + ∆x) − g(x + ∆x))(x + ∆x)2 − π(f(x) − g(x))x2. If ∆x is small, it makeslittle difference if the functions are evaluated atx or x +∆x, and if we ignore terms involving(∆x)2 in comparison withthose involving∆x we obtain2π(f(x)− g(x))x∆x.
0 x x + ∆x q
g(x)
f(x)
x
y
Figure 8.11
COMMENT:You could also have the students set up the integral giving this volume by slicing along they-axis. This will involve
the use of inverse functions.

176 CHAPTER EIGHT Hughes Hallett et al c©2005, John Wiley & Sons
4. Imagine rotating the enclosed region in Figure 8.12 aboutthree lines separately: thex-axis, they-axis, and the verticalline atx = 6. This produces three different volumes. Which of the following lists those volumes in order of largest tosmallest?
(a) x-axis;x = 6; y-axis(b) y-axis;x = 6; x-axis(c) x = 6; y-axis;x-axis(d) x = 6; x-axis;y-axis(e) x-axis;y-axis;x = 6(f) y-axis;x-axis;x = 6
1 2 3 4 5 6
1
2
3
4
5
6
x
y
Figure 8.12
ANSWER:(c). The center of gravity of the enclosed region is at about(2.5, 1.5) and the greater the distance of the line of
rotation from the center of gravity, the greater the volume.COMMENT:If you want students to calculate three volumes, change the curve in Figure 8.12 to a line giving an isosceles right
triangle where2 < x < 4. Here the answers are40π/3, 32π/3, and20π/3.

CHAPTER EIGHT Hughes Hallett et al c©2009, John Wiley & Sons 177
5. Which of the following graphs (a)–(d) represents the arc length (from the origin) of the curve in Figure 8.13 as a functionof x?
π/4 π/2 3π/4 π
1
2
3
4
x
y
Figure 8.13
π/4 π/2 3π/4 π
2
4
6
8
10
x
y(a)
π/4 π/2 3π/4 π
3
6
9
12
x
y(b)
π/4 π/2 3π/4 π
1
2
3
4
x
y(c)
π/4 π/2 3π/4 π
2
4
6
8
x
y(d)
ANSWER:(a). Arc length is always increasing, which eliminates (c) and (b). The rate of change of arc length is never zero, so
there will be no horizontal tangents, this eliminates (d).COMMENT:For an easier first problem, consider what happens ify = 1
2x.

178 CHAPTER EIGHT Hughes Hallett et al c©2005, John Wiley & Sons
6. Which of the graphs (a)–(d) represents the arc length (from the origin) of the curve in Figure 8.14 as a function ofx?
1 2 3 4 5
2
4
6
8
10
12
x
y
Figure 8.14
1 2 3 4 5
4
8
12
16
x
y(a)
1 2 3 4 5
4
8
12
16
x
y(b)
1 2 3 4 5
4
8
12
16
x
y(c)
1 2 3 4 5
4
8
12
16
x
y(d)
ANSWER:(c). The arc length curve will start at the origin with non-zero slope. Arc length for an increasing function will have
the same concavity as that of the function. This eliminates (b) and (d).COMMENT:
Have students decide how to prove this. (They should differentiate
∫ x
a
√
1 + (f ′(t))2 dt twice.)

CHAPTER EIGHT Hughes Hallett et al c©2009, John Wiley & Sons 179
ConcepTests and Answers and Comments for Section 8.3
1. Which describes the graph of the equationr = θ?
(a) Line(b) Circle(c) Spiral(d) Rose
ANSWER:(c). As a point moves along the graph with increasing angleθ, circling the origin counterclockwise, it simultaneously
moves away from the origin, creating a spiral. This happens becauser increases along withθ.
2. Which describes the graph of the equationr sin θ = 10?
(a) Line(b) Circle(c) Spiral(d) Rose
ANSWER:(a). Sincer sin θ = y, the curve is given in Cartesian coordinates by the equationy = 10, which is a horizontal line.
3. Which describes the graph of the equationr = cos θ?
(a) Line(b) Circle(c) Spiral(d) Rose
ANSWER:(b) and (d).Multiplying the equation byr we haver2 = r cos θ. Sincer2 = x2 + y2 andr cos θ = x, the curve is given in
Cartesian coordinates by the equationx2 + y2 = x. Completing of the square gives(x − 1/2)2 + y2 = (1/2)2, theequation of a circle of radius1/2 centered at the point(1/2, 0). This is answer (b).
A rose has equationr = a cos nθ, which isr = cos θ with a = 1 andn = 1. This is answer (d).
4. Which of the following equations would produce the graph shown in Figure 8.15?
(a) r = 8θ (b) r = 8 cos θ (c) r = 8/ cos θ (d) r = 8 sin θ
−10 10
−10
10
x
y
Figure 8.15
ANSWER:(c). This is the graph ofx = 8. Sincex = r cos θ, we havex = r cos θ = 8. Thus,r = 8/ cos θ.

180 CHAPTER EIGHT Hughes Hallett et al c©2005, John Wiley & Sons
5. Which of the following equations would produce the graph shown in Figure 8.16?
(a) r = 2 cos θ (b) r = 4 cos θ (c) r = 2 sin θ (d) r = 4 sin θ (e) r = 2
−5 5
−5
5
x
y
Figure 8.16
ANSWER:(b). This is circle with a radius of 2 whose center is at the point (2, 0). In Cartesian coordinates the equation of the
circle is(x − 2)2 + y2 = 4. By expanding the left side of the equation we getx2 − 4x + 4 + y2 = 4. Simplifying theequation, we getx2 + y2 = 4x.
Sincex2 + y2 = r2, andx = r cos θ, we haver2 = 4r cos θ. Sincer 6= 0, we can divide both sides of the equationby r, giving r = 4 cos θ.
6. Which of the following equations would produce a rose with8 petals and length 4?
(a) r = 4 cos(4θ) (b) r = 4 cos(8θ) (c) r = 8 cos(4θ) (d) r = 8 cos(8θ)
ANSWER:(a). The equationr = a cos(nθ) produces a rose with lengtha andn petals ifn is odd and2n petals ifn is even. To
produce a rose with 8 petals and length 4, we leta = 4 andn = 4.
7. Which of the following represents the area inside the roser = 5 sin 2θ?
(a) A =1
2
∫ 2π
0
5 sin2 2θ dθ (b) A = 2
∫ π/2
0
5 sin2 2θ dθ (c) A =1
2
∫ π
0
(5 sin 2θ)2 dθ
(d) A = 2
∫ π/2
0
(5 sin 2θ)2 dθ (e) A = 4
∫ π/2
0
(5 sin 2θ)2 dθ
ANSWER:(d). The equationr = 5 sin 2θ produces a rose with length5 and4 petals.
The formula for the area inside this curve is:A =1
2
∫ 2π
0
(5 sin 2θ)2 dθ.
Since this is not one of the choices, we note that in the interval 0 ≤ θ ≤ π/2, one petal is completed. Using thisinterval, we can find the area of one petal and multiply by4 to find the area inside the entire curve.
A = 4 · 12
∫ π/2
0
(5 sin 2θ)2 dθ = 2
∫ π/2
0
(5 sin 2θ)2 dθ.
8. Which of the following represents the area inside the roser = 5 cos 2θ?
(a) A =1
2
∫ 2π
0
5 cos2 2θ dθ (b) A = 2
∫ π/2
0
5 cos2 2θ dθ (c) A =1
2
∫ π
0
(5 cos 2θ)2 dθ
(d) A = 2
∫ π/4
0
(5 cos 2θ)2 dθ (e) A = 4
∫ π/4
0
(5 cos 2θ)2 dθ
ANSWER:(e). The equationr = 5 cos 2θ produces a rose with length5 and4 petals.
The formula for the area inside this curve is:A =1
2
∫ 2π
0
(5 cos 2θ)2 dθ.
Since this is not one of the choices, we note that in the interval 0 ≤ θ ≤ π/4, half of a petal is completed. Using thisinterval, we can find the area of half a petal and multiply by8 to find the area inside the entire curve.
A = 8 · 12
∫ π/4
0
(5 cos 2θ)2 dθ = 4
∫ π/4
0
(5 cos 2θ)2 dθ.

CHAPTER EIGHT Hughes Hallett et al c©2009, John Wiley & Sons 181
9. Which of the following represents the area inside the limaconr = 2 + 2 cos θ?
(a) A =1
2
∫ 2π
0
2 + 2 cos2 θ dθ (b) A =
∫ π
0
2 + 2 cos2 θ dθ (c) A =1
2
∫ π
0
(2 + 2 cos θ)2 dθ
(d) A =
∫ π
0
(2 + 2 cos θ)2 dθ (e) None of the above
ANSWER:(d). The equationr = 2+2 cos θ produces a limacon with no inner loop. The limacon is symmetric about thex-axis.
The formula for the area inside this curve is:A =1
2
∫ 2π
0
(2 + 2 cos θ)2 dθ.
Since this is not one of the choices, we note that in the interval 0 ≤ θ ≤ π, half of the limacon is completed. Usingthis interval, we can find the area of half the limacon and multiply by 2 to find the area inside the entire curve.
A = 2 · 12
∫ π
0
(2 + 2 cos θ)2 dθ =
∫ π
0
(2 + 2 cos θ)2 dθ.
COMMENT:This limacon is an example of a cardioid. Have the students explain why this name is appropriate, and then ask under
what conditions a limacon, (r = a + b sin θ, r = a + b cos θ) is a cardioid. (Answer:|a| = |b|.)10. Which of the following expressions represents the arc length of the curver = 4 cos θ?
(a)
∫ π/2
0
√
(−4 sin θ)2 + (4 cos θ)2 dθ (b) 2
∫ π/2
0
√
(−4 sin θ)2 + (4 cos θ)2 dθ
(c) 2
∫ π
0
√
(−4 sin θ)2 + (4 cos θ)2 dθ (d)
∫ 2π
0
√
(−4 sin θ)2 + (4 cos θ)2 dθ
(e) 2
∫ 2π
0
√
(−4 sin θ)2 + (4 cos θ)2 dθ
ANSWER:(b). For a curve of the formr = f(θ)
Arc length =
∫ β
α
√
(f ′(θ))2 + (f(θ))2 dθ.
Since this curve, which is a circle, is completed in the interval 0 ≤ θ ≤ π, the limits of integration are0 andπ.We can find the length of the arc by using the formula
Arc length =
∫ π
0
√
(−4 sin θ)2 + (4 cos θ)2 dθ.
Alternatively, we can find the arc length using the limits0 andπ/2, and double this answer.
Arc length = 2
∫ π/2
0
√
(−4 sin θ)2 + (4 cos θ)2 dθ.
Note that the arc length we are seeking is the arc length of a circle whose radius is2. Thus, we know the answer must be4π.
182 CHAPTER EIGHT Hughes Hallett et al c©2005, John Wiley & Sons
11. Which of the following equations represents the area inside the graph ofr = 4 and outside the graph ofr = 4− 4 sin θ?
(a) A = 16π − 1
2
∫ 2π
0
(4− 4 sin θ)2 dθ (b) A = 8π −∫ 2π
0
(4− 4 sin θ)2 dθ
(c) A = 16π − 1
2
∫ π
0
(4− 4 sin θ)2 dθ (d) A = 8π −∫ π
0
(4− 4 sin θ)2 dθ
(e) A = 8π −∫ π/2
0
(4− 4 sin θ)2 dθ
ANSWER:(e). The equationr = 4 produces a circle with a center at the origin and radius of 4. The equationr = 4 − 4 sin θ
produces a limacon that is symmetric about they-axis. See Figure 8.17.
−6 −4 −2 2 4 6
−8
−6
−4
−2
2
4r = 4
r = 4− 4 sin θ
x
y
Figure 8.17
We need to find the area of the portion of the circle that is not contained in the graph of the limacon. Thus, we wantto take the area of half the circle and subtract the area enclosed by the top part of the limacon. (Note that the other half ofthe circle lies entirely inside the limacon.)
The area of the circle is16π. Thus, the area of the semicircle is8π.As the limacon is traced out in the first and second quadrants, the area formed can be determined by the formula:
A =1
2
∫ π
0
(4− 4 sin θ)2 dθ.
The area that we need can be determined from the formula:
A = 8π − 1
2
∫ π
0
(4− 4 sin θ)2 dθ.
This is not an answer choice.We notice that half of the area that we need is formed in the first quadrant. Thus, if we double this area, we will
obtain our answer.
A = 2 ·(
4π − 1
2
∫ π/2
0
(4− 4 sin θ)2 dθ
)
.
We can simplify this and obtain:
A = 8π −∫ π/2
0
(4− 4 sin θ)2 dθ.
COMMENT:This limacon is an example of a cardioid, a limacon (r = a + b sin θ, r = a + b cos θ) for which |a| = |b|.

CHAPTER EIGHT Hughes Hallett et al c©2009, John Wiley & Sons 183
12. Which of the following equations represents the area inside the graph ofr = 3 sin θ and outside the graph ofr = 1+sin θ?
(a) A =1
2
∫ π/2
π/6
(3 sin θ)2 − (1 + sin θ)2 dθ (b) A =
∫ π/2
π/6
(3 sin θ)2 − (1 + sin θ)2 dθ
(c) A =1
2
∫ π
0
(3 sin θ)2 − (1 + sin θ)2 dθ (d) A =
∫ π
0
(3 sin θ)2 − (1 + sin θ)2 dθ
(e) A =1
2
∫ 2π
0
(3 sin θ)2 − (1 + sin θ)2 dθ
ANSWER:(b). The circler = 3 sin θ is completed in the interval0 ≤ θ ≤ π. Since both graphs are symmetric about they-axis,
the region between the graphs is also symmetric about they-axis. See Figure 8.18.
−2 −1 1 2
1
2
3r = 3 sin θ
r = 1 + sin θx
y
Figure 8.18
Thus we can find the area in the first quadrant and double it. We have to find the point where the two curves intersectin the first quadrant.
By solving the equation3 sin θ = 1 + sin θ, we obtainθ = π/6. Thus, the limits of integration areπ/6 andπ/2.The area can be obtained by using the formula:
A = 2 · 12
∫ π/2
π/6
(3 sin θ)2 − (1 + sin θ)2 dθ.
By simplifying, we obtain:
A =
∫ π/2
π/6
(3 sin θ)2 − (1 + sin θ)2 dθ.

184 CHAPTER EIGHT Hughes Hallett et al c©2005, John Wiley & Sons
ConcepTests and Answers and Comments for Section 8.4
1. A rod of length 3 meters and densityδ(x) = 2 + cos x grams/meter is positioned along thex-axis with its left end at theorigin.
(a) Where is the rod most dense?(b) Where is the rod least dense?(c) Is the center of mass of this rod closer to the origin, or closer tox = 3?(d) What is the total mass of the rod?(e) Where is the center of mass of the rod?
ANSWER:
(a) The function describing the density is decreasing for0 ≤ x ≤ 3. (Note its derivative,− sin x is negative for thisinterval.) So it is most dense atx = 0.
(b) It is least dense atx = 3.(c) The center of mass is closer to the origin.(d) The total mass of the rod is given by
∫ 3
0
(2 + cos x) dx = (2x + sin x)|30 = 6 + sin 3 ≈ 6.14 gm.
(e) The center of mass is given by
1
mass
∫ 3
0
x(2 + cos x) dx =1
6.14(x2 + x sin x + cos x)|30 =
1
6.14(9 + 3 sin 3 + cos 3− 1) ≈ 1.21 m.
COMMENT:You could give a different density function and ask the same set of questions, or simply increase the length of the rod
to 6 meters (then you could use symmetry arguments as well).
ConcepTests and Answers and Comments for Section 8.5
1. A fuel tank 10 ft tall has a horizontal trapezoidal cross-section with 5 ft sides at two opposite ends and 6 ft and 12 ft at theother ends. Calculate the work done in pumping out the fuel (of densityρ lb/ft3) if the tank is half full.
ANSWER:Consider a cross-sectional slice of thickness∆h of the tank,h feet from the bottom. The area of this cross-section
is (4)(6 + 12)/2 = 36 ft2, with a corresponding volume of the slice of36∆h ft3. This volume must be lifted a total of10 − h feet, and the corresponding work done on this slice is36ρ(10 − h)∆h. Adding up all the similar cross-sectionsfrom h = 0 to h = 5 gives
Work done=
∫ 5
0
36ρ(10− h) dh = 36ρ (10h− h2/2)∣
∣
5
0= 1350ρ foot-pounds.
COMMENT:You could point out that for any cross-section with area,∆A, the work done for such a problem is(ρ)(∆A)(10−h).

CHAPTER EIGHT Hughes Hallett et al c©2009, John Wiley & Sons 185
ConcepTests and Answers and Comments for Section 8.7
1. A population density function is given byp(x) =
{
aex , −∞ < x ≤ 1
0 , x > 1.
(a) Compute the value ofa.(b) Find the cumulative distribution functionP (x).(c) For what value ofx is the fraction of the population less than1
2?
ANSWER:
(a) Since
∫ ∞
−∞p(x) dx = 1, we need
∫ 1
−∞aex dx = 1. This givesaex |1−∞ = 1, soa = 1/e.
(b) P (x) =
∫ x
−∞p(x) dx =
{
ex−1 , x ≤ 1
1 , x > 1.
(c) P (x) = 1/2 will occur whenex−1 = 1/2, giving x = 1− ln 2.
COMMENT:You might want to repeat this question with a density function given byp(x) = ae−x2
, −∞ < x < 0, and0 forx ≥ 0. One purpose of this question is to have them solve part (a) and (c) by using a table or trial and error with the limitsof integration.
2. A population density function is given byp(x) =
x2/2 , −1 ≤ x < 0
a(1− e−x) , 0 ≤ x ≤ 1
0 , otherwise.
(a) Compute the value ofa.(b) Find the cumulative distribution functionP (x).(c) For what value ofx is the percentage of the population equal to1/12?
ANSWER:
(a) Since
∫ ∞
−∞p(x) dx = 1, we need
∫ ∞
−∞p(x) dx =
∫ 0
−1
x2
2dx +
∫ 1
0
a(1− e−x) dx = 1.
This gives
1
6x3
∣
∣
∣
∣
0
−1
+ a(x + e−x)
∣
∣
∣
∣
1
0
= 1,
soa = 5e/6.
(b) The cumulative distribution isP (x) =
∫ x
−∞p(x) dx =
0 , x < −116(x3 + 1) , −1 ≤ x < 0
16
+ 5e6
(x + e−x − 1) , 0 ≤ x ≤ 1
1 , x > 1.(c) Since the value ofP (x) increases from0 to 1/6 betweenx = −1 andx = 0, we see thatP (x) takes the value1/12
for x < 0. Thus we solve1
6(x3 + 1) =
1
12,
giving
x = −(
1
2
)1/3
.
COMMENT:You could repeat part (c) by asking for the fraction of the population equal to 0.95. Here the proper range of the
piecewise solution to part (b) must be determined, and then perhaps a look at the graph (using a trace function) to determinethe answer.

186 CHAPTER EIGHT Hughes Hallett et al c©2005, John Wiley & Sons
ConcepTests and Answers and Comments for Section 8.8
1. A density function is given byp(x) =
x2/2 , −1 ≤ x < 0
a(1− e−x) , 0 ≤ x ≤ 1
0 , otherwise.
(a) Compute the value ofa.(b) Find the cumulative distribution functionP (x).(c) From the graph ofp(x), do you expect the mean to be positive or negative?(d) Find the exact value of the mean.
ANSWER:
(a) Since
∫ ∞
−∞p(x) dx = 1, we need
∫ 0
−1
x2
2dx +
∫ 1
0
a(1− e−x) dx = 1. This gives
(1/6)x3∣
∣
0
−1+ a(x + e−x)
∣
∣
1
0= 1, soa = 5e/6.
(b) P (x) =
∫ x
−∞p(x) dx =
0 , x < −1
(1/6)(x3 + 1) , −1 ≤ x < 0
(1/6)x3 + (5e/6)(x + e−x − 1) , 0 ≤ x ≤ 1
1 , x > 1(c) It looks like the mean will be positive.(d)
x =
∫ ∞
−∞xp(x) dx =
∫ 0
−1
(x3/2) dx +
∫ 1
0
(5e/6)(x− xe−x) dx
= −1/8 + ((5e/6)(x2
2+ xe−x + e−x))
∣
∣
∣
∣
1
0
= 37/24− 5e/12 ≈ 0.409
COMMENT:Parts (a) and (b) are the same as Problem 2 on page 185. You could introduce this section by asking these questions
for a standard distribution–say Gaussian or normal.

Chapter Nine
Chapter Nine

188 CHAPTER NINE Hughes Hallett et al c©2005, John Wiley & Sons
ConcepTests and Answers and Comments for Section 9.1
1. Which is the value ofs6 for the recursively defined sequencesn = sn−1 + 2 + (−1)n for n > 1 ands1 = 2?
(a) 6 (b) 8 (c) 11 (d) 13
ANSWER:(d). The sequence begins2, 5, 6, 9, 10, 13, . . .. The jump fromsn−1 to sn is by 2 + (−1)n = 3 if n is even and by
2 + (−1)n = 1 if n is odd.
2. Which of the sequences I–IV is monotone and bounded forn ≥ 1?
I. sn = 10− 1
nII. sn =
10n + 1
nIII. sn = cos n IV. sn = ln n
(a) I(b) I and II(c) II and IV(d) I, II, and III
ANSWER:(b). Sequence (I) is monotone increasing, bounded between 9and 10.Sequence (II) is monotone decreasing and bounded between 10and 11.Sequence (III) is bounded between−1 and 1 but it is not monotone because it begins0.54,−0.42,−0.99,−0.65, . . .,
which contains both a jump down, from0.54 to −0.42 and a jump up, from−0.99 to −0.65. Terms in a monotonesequence always jump in the same direction.
Sequence (IV) is monotone increasing but is not bounded.
3. Which of the sequences I–IV converges?
I. sn =cos n
nII. sn = cos
(
1
n
)
III. sn = ne−n IV. sn =en
n
(a) I and III(b) I, II, and III(c) II and IV(d) All of them
ANSWER:(b). Sequence (I) converges to zero, sequence (II) converges to 1, sequence (III) converges to zero and sequence (IV)
diverges.
4. Match each of the sequences (a)–(d) with one of the statements (I)–(IV).
(a) 2n (b) 21/n (c) (1/2)n (d) (−1/2)n
I Converges but not monotonically.II Converges, monotonically increasing.
III Converges, monotonically decreasing.IV Diverges.
ANSWER:
(a) IV(b) III(c) III(d) I
COMMENT:Ask students to supply an example for the statement which is not matched.

CHAPTER NINE Hughes Hallett et al c©2009, John Wiley & Sons 189
5. In each case, insert≤ or≥ between the terms of the two sequences and use the relationship to decide the convergence ofboth sequences.
(a) 1.5n and(1 +√
n)n
(b) 0.5n and(
1
1 + n
)n
(c) 1− 1
nand1− 1
1 + nANSWER:
(a) Since1.5 < 1 +√
n for n ≥ 1, we have1.5n < (1 +
√n)n.
Since1.5n diverges, so does(1 +√
n)n.(b) Since
0.5 =1
2≥ 1
1 + n> 0,
for n ≥ 1, we have
0.5n ≥(
1
1 + n
)n
> 0.
Since0.5n converges to 0, so does(1/(1 + n))n.(c) Since1/n > 1/(n + 1), we have
1− 1
n< 1− 1
n + 1< 1.
Since1− 1/n converges to 1, so does1− 1/(n + 1).
COMMENT:Ask students to explain why it is important that the inequalities go the way they do. What conclusions could have
been drawn if the inequalities had been the other way round?
ConcepTests and Answers and Comments for Section 9.2
1. Which of the following are geometric series?
(a) 1− 1/2 + 1/4− 1/6 + · · ·(b) 2y − 6y3 + 18y5 − 54y7 + · · ·(c) 1/2 + 2/3 + 3/4 + 5/6 + · · ·(d) x + x2 + x4 + x7 + · · ·
ANSWER:(b). This has a common ratio of−3y2, the rest are not geometric series.COMMENT:Follow-up Question. For what values ofy will this series converge?Answer. The series converges fory2 < 1/3, and it converges to2y/(1 + 3y2).
2. Which of the following geometric series converge?
(I) 20− 10 + 5− 2.5 + · · ·(II) 1− 1.1 + 1.21− 1.331 + · · ·
(III) 1 + 1.1 + 1.21 + 1.331 + · · ·(IV) 1 + y2 + y4 + y6 + · · · , for− 1 < y < 1
(a) (I) only(b) (IV) only(c) (I) and (IV)(d) (II) and (IV)(e) None of the other choices is correct.
ANSWER:(c). The common ratio in series (I) and (IV) is between−1 and1. The common ratio in (II) and (III) is greater than
one.COMMENT:You might point out that the series (II) and (III) must diverge sincelimn→∞ |cn| 6= 0, where each series can be
represented as∞
∑
n=0
cn.

190 CHAPTER NINE Hughes Hallett et al c©2005, John Wiley & Sons
3. List the following infinite geometric series in order of increasing values of their sum.
(I) 5 + 5/3 + 5/9 + 5/27 + · · ·(II) 3 + 2 + 4/3 + 8/9 + · · ·
(III) 10− 5 + 5/2− 5/4 + · · ·(IV) 4 + 3 + 9/4 + 27/16 + · · ·
(a) (I) (II) (III) (IV)(b) (II) (I) (IV) (III)(c) (III) (I) (II) (IV)(d) (IV) (II) (I) (III)
ANSWER:(c). The sums of these series are (I)= 7.5, (II) = 9, (III) = 20/3 = 6.667, and (IV)= 16.COMMENT:As a warm-up question, you could ask the students to identifythe ratio for each infinite series.
4. A football team starts its offense 10 yards from the goal line. Each play they gain half of the remaining distance to thegoal. Assuming that they continue this process indefinitely, will they ever cross the goal line?
ANSWER:Technically, they will never cross the goal line. In the firstplay they gain 5 yards, in the second play they gain 2.5
yards, then 1.25 yards and so on. Each time they stop short of the goal line.COMMENT:Follow-up Question. Find a formula for the total yardage the ball has moved aftern plays.Answer. The ball has moved10(1− (1/2)n) yards aftern plays.
5. Which of the following are geometric series? For those that are geometric series, determine whether or not they converge.
(a)1
2+
1
4+
1
8+
1
16+ · · ·
(b)∞
∑
n=0
1
e2
(c) 1 +1
2+
1
3+
1
4+ · · ·
(d) 2− 2y2 + 2y4 − 2y6 + · · ·
(e)∞
∑
n=1
1
n2
ANSWER:
(a) This series is geometric and converges since the common ratio equals1/2.(b) This series is geometric but diverges since the common ratio equals 1.(c) This series is not geometric; it is the harmonic series.(d) This series is geometric with a common ratio of−y2. It therefore converges if and only if|y| < 1.(e) This series is not geometric.
COMMENT:Follow-up Question. For each geometric series that converges, find the sum.Answer. Series (a) converges to 1. Series (d) converges to2/(1 + y2).
6. True or False:∞
∑
n=1
1
n2=
1
1− (1/n2).
ANSWER:False, this is not a geometric series; therefore, we can not use the formula for an infinite geometric series to find the
sum of the series.COMMENT:You may want to point out to students that if a series inn converges, it must converge to a number independent ofn.

CHAPTER NINE Hughes Hallett et al c©2009, John Wiley & Sons 191
ConcepTests and Answers and Comments for Section 9.3
1. You stand one meter from a wall and walk toward the wall, covering one-half the remaining distance to the wall with eachstep. Which of the following sequences of numbers represents the remaining distances in meters?
(a) 1/2, 3/4, 7/8, 15/16, . . .(b) 1/2, 1/4, 1/8, 1/16, . . .(c) 1/2, 1/3, 1/4, 1/5, . . .(d) 1, 2, 3, 4, . . .
ANSWER:(b). Your first step will take you1/2 meter, leaving1/2 meter to go. Your second step will be one-half of the
remaining distance, or1/2(1/2) = 1/4 meter, leaving 1/4 meter to go. Continuing in this manner gives you sequence(b).
COMMENT:What is the sequence of remaining distances if each step takes you2/3 of the way toward the wall?You could point out that the total distance traveled cannot exceed 1, and the individual distances (per step) will
approach 0.
2. Which of the following defines a convergent sequence of partial sums?
(a) Each term in the sequence is closer to the last term than any two prior consecutive terms.(b) Assume that the sequence of partial sums converges to a number,L. Regardless of how small a number you give me,
sayǫ, I can find a value ofN such that theN th term of the sequence is withinǫ of L.(c) Assume that the sequence of partial sums converges to a number,L. I can find a value ofN such that all the terms in
the sequence, past theN th term, are less thanL.(d) Assume that the sequence of partial sums converges to a number,L. Regardless of how small a number you give me,
sayǫ, I can find a value ofN such that all the terms in the sequence, past theN th term, are withinǫ of L.
ANSWER:(d)COMMENT:You may wish to write this in terms of inequalities.
3. An incorrect definition of a convergent series is“An infinite series is convergent when the series is bounded,i.e. thesequence of partial sums never goes above or below two specified values”.Which of the following is a series that fits thisdefinition but is not convergent?
(a)∑
(
1
2
)n
(b)∑ 1
n
(c)∑
(−1)n
(d)∑
1n
ANSWER:
(c). The partial sums of∞
∑
n=1
(−1)n alternate between−1 and 0, so are bounded above and below, but∞
∑
n=1
(−1)n
does not converge.COMMENT:It may be worth commenting on the convergent properties of the other three series.
4. A sequence of partial sums that is bounded and always increasing is a convergent sequence.
(a) True(b) False
ANSWER:(a)COMMENT:Follow-up True/False Question. A sequence of partial sums that is bounded and always decreasing is a convergent
sequence.Answer. True.

192 CHAPTER NINE Hughes Hallett et al c©2005, John Wiley & Sons
5. True of False?
(a) If limn→∞
an = 0 then∞
∑
n=0
an converges.
(b) If limn→∞
an 6= 0 then∞
∑
n=0
an diverges.
(c) If∞
∑
n=0
an converges thenlimn→∞
an = 0.
(d) If the terms of a series alternate in sign, then the seriesconverges.
ANSWER:
(a) False. For example,∞
∑
n=1
1
ndiverges even thoughlim
n→∞
1
n= 0.
(b) True.(c) True. We know that if
∑
an converges, thenlimn→∞
an = 0.
(d) False. For example, the terms of the series∞
∑
n=1
(−1)nn2 alternate in sign, but the series diverges.
COMMENT:Have students find other counterexamples for the statementsthat are false.
ConcepTests and Answers and Comments for Section 9.4
1. Which test will help you determine if the series convergesor diverges?
∞∑
k=1
5 + k
k!
(a) Integral test(b) Comparison test(c) Ratio test
ANSWER:(c). The ratio test is useful if factorials are involved.COMMENT:Ask the students if the series converges or diverges.
2. Which test will help you determine if the series convergesor diverges?
∞∑
k=1
e−k
(a) Integral test(b) Comparison test(c) Ratio test
ANSWER:(a) and (c). The integral test can be used because it is not hard to find the antiderivative ofe−x; the ratio test is often
useful if exponential functions are involved.COMMENT:You might point out that this is a geometric series.

CHAPTER NINE Hughes Hallett et al c©2009, John Wiley & Sons 193
3. Which test will help you determine if the series convergesor diverges?
∞∑
k=1
1
k3 + 1
(a) Integral test(b) Comparison test(c) Ratio test
ANSWER:
(b). This series should be compared with∞
∑
k=1
1
k3.
COMMENT:Ask the students if the series converges or diverges.
4. Which test will help you determine if the series convergesor diverges?
∞∑
k=1
k
(k + 1)2
(a) Integral test(b) Comparison test(c) Ratio test
ANSWER:(a) and (b). To use the comparison test, notice thatk/(k + 1)2 > k/(k + k)2 = 1/4k.COMMENT:
You might want to point out that the substitutionw = x + 1 is used to integrate
∫ ∞
1
x
(x + 1)2dx.
5. Which test will help you determine if the series convergesor diverges?
∞∑
k=1
(−1)k−1
√3k − 1
(a) Alternating series test(b) Integral test(c) Ratio test
ANSWER:(a). The alternating series test can be used sinceak = 1/
√3k − 1 is a positive sequence which decreases monoton-
ically to 0 ask →∞.COMMENT:Follow-up Question. Does the series converge absolutely, converge, or diverge?Answer. The series converges but does not converge absolutely.
6. Which test will help you determine if the series convergesor diverges?
∞∑
k=1
(−1)k+15
k
(a) Alternating series test(b) Absolute convergence test (that is, convergence of
∑
|an| implies convergence of∑
an)(c) Ratio test
ANSWER:(a). The alternating series test can be used sinceak = 5/k is a positive sequence which decreases monotonically to
0 ask →∞.COMMENT:Follow-up Question. Does the series converge absolutely, converge, or diverge?Answer. The series converges but does not converge absolutely.

194 CHAPTER NINE Hughes Hallett et al c©2005, John Wiley & Sons
7. Which test will help you determine if the series convergesor diverges?∞
∑
k=1
(−1)k3k−1
k!
(a) Alternating series test(b) Absolute convergence test(that is, convergence of
∑
|an| implies convergence of∑
an)(c) Ratio test
ANSWER:(a) and (c). The ratio test may be easier to use, but3k−1/k! is monotone fork ≥ 4, since3/k < 1.COMMENT:Follow-up Question. Does the series converge absolutely, converge, or diverge?Answer. The series converges absolutely.
8. Which test can help you determine if the series converges or diverges?∞
∑
n=1
2000n
2n3 − 1
(a) Ratio test(b) Limit comparison test(c) Alternating series test
ANSWER:(b). A limit comparison can be made with
∑
1/n2.We are investigating the series
∑∞n=1
an wherean = 2000n/(2n3 − 1). With bn = 1/n2 we have
limn→∞
an
bn= lim
n→∞
2000n/(2n3 − 1)
1/n2= lim
n→∞
2000n3
2n3 − 1= 1000.
Since∑
1/n2 converges, so does∑
an.The ratio test does not apply becauselimn→∞ |an+1|/|an| = 1.The alternating series test does not apply to series whose terms do not alternate in sign.
9. Which test will help you determine if the series convergesor diverges?∞
∑
k=1
(−1)k3
k2
(a) Alternating series test(b) Absolute convergence test (that is, convergence of
∑
|an| implies convergence of∑
an)(c) Ratio test
ANSWER:
(a) and (b). The absolute convergence test is a good choice since
∣
∣
∣
∣
(−1)k3
k2
∣
∣
∣
∣
=3
k2and
∑ 3
k2converges.
COMMENT:Follow-up Question. Does the series converge absolutely, converge, or diverge?Answer. The series converges absolutely.
10. In order to determine if the series converges or diverges, the comparison test can be used. Decide which series providesthe best comparison.
∞∑
k=1
√k + 1
k2 + 1
(a)∞
∑
k=1
1
k(b)
∞∑
k=1
1
k3/2(c)
∞∑
k=1
√2k
k2
ANSWER:(c). The series in (a) diverges and is greater than the original series, so (a) provides no help. The series in (b)
converges, but it is smaller than the original series fork ≥ 3.COMMENT:Graphingf(x) =
√x + 1/(x2 + 1) andg(x) =
√2x/x2 on the same axes may help students compare the two
series.

CHAPTER NINE Hughes Hallett et al c©2009, John Wiley & Sons 195
11. In order to determine if the series converges or diverges, the comparison test can be used. Decide which series providesthe best comparison.
∞∑
k=2
ln k
k2
(a)∞
∑
k=2
1
k(b)
∞∑
k=2
1
k3/2(c)
∞∑
k=2
1
k2
ANSWER:(b). The series in (a) diverges and is greater than the original series, so (a) provides no help. The series in (c)
converges, but fork > 2, its terms1/k2 are smaller than the termsln k/k2 of the original series.COMMENT:Graphingf(x) = ln x/x2 andg(x) = 1/x3/2 on the same axes may help students compare the two series.
12. In order to determine if the series converges or diverges, the comparison test can be used. Decide which series providesthe best comparison.
∞∑
k=1
(
1
k− 1
k + 1
)
(a)∞
∑
k=1
1
k(b)
∞∑
k=1
(
− 1
k + 1
)
(c)∞
∑
k=1
1
k2
ANSWER:
(c). The original series can be rewritten as∞
∑
k=1
1
k(k + 1).
COMMENT:You might point out that this series is also known as a collapsing sum. By writing out the first few terms, the students
should be able to identify the sum of this series.
13. In order to determine if the series converges or diverges, the comparison test can be used. Decide which series providesthe best comparison.
∞∑
k=1
cos k
2k
(a)∞
∑
k=1
cos k (b)∞
∑
k=1
(−1)k
2k(c)
∞∑
k=1
1
2k
ANSWER:(c). Since| cos k| ≤ 1 for all k, we have| cos k/2k| ≤ 1/2k. We use the comparison test to prove absolute conver-
gence and then the absolute convergence test to prove convergence of the original series.COMMENT:This question could be repeated with any bounded functionf(k) in place ofcos k.

196 CHAPTER NINE Hughes Hallett et al c©2005, John Wiley & Sons
14. Arrange the values of these two alternating series and two numbers in order from smallest to largest.
(I) 1− 1
4+
1
9− 1
16+ · · ·+ (−1)n
(n + 1)2+ · · ·
(II) 1− 1
7+
1
49− 1
343+ · · ·+ (−1)n
7n+ · · ·
(III) 3/4(IV) 31/36
(a) (I) (II) (III) (IV)(b) (III) (I) (IV) (II)(c) (II) (III) (I) (IV)(d) (III) (I) (II) (IV)(e) None of the first four answers is correct.
ANSWER:(b). Both (I) and (II) are alternating series,
∑
(−1)n−1an, for which 0 < an+1 < an and limn→∞ an = 0, sothe sum of the series lies between successive partial sums ofthe series. Thus, taking the first two terms in series (I) gives1 − 1/4 = 3/4, so the sum of the series is greater than3/4. Taking one more term gives3/4 + 1/9 = 31/36. So, thesum of (I) is less than31/36. Series (II) is a geometric series with a sum of1/(1 + 1/7) = 7/8. Thus (III) = 3/4 < (I)< 31/36 = (IV) < 7/8 = (II). The order is (III)< (I) < (IV) < (II).
COMMENT:Follow-up Question. How many terms do you need to add together in series (I) in order to obtain an accuracy to
three decimal places?Answer. We want to findn so that the sum of the firstn terms,Sn, and the firstn+1 terms,Sn+1, differ in magnitude
by 0.0005, that is|Sn−Sn+1| < 0.0005. But |Sn−Sn+1| = 1/(n + 1)2 so we need(n + 1)2 > 1/0.0005, son needsto be at least 44.
15. For each of the following situations, decide if∞
∑
n=1
cn converges, diverges, or if one cannot tell without more information.
(a) 0 ≤ cn ≤1
nfor all n. (b)
1
n≤ cn for all n. (c) 0 ≤ cn ≤
1
n2for all n.
(d)1
n2≤ cn for all n. (e)
1
n2≤ cn ≤
1
nfor all n.
ANSWER:
(a) Cannot tell without more information.(b) Diverges.(c) Converges.(d) Cannot tell without more information.(e) Cannot tell without more information.
COMMENT:Follow-Up Question. For each case where you need more information, find an exampleof a series that converges
and an example of a series that diverges both of which satisfythe given condition.Answer. (a) 1/(n + 1) < 1/n for all n, but using the integral test, the series
∑
1/(n + 1) diverges. The series∑
1/n2 converges by the integral test. (d)1/n2 < 1/(n2 − 1/4) < 1/(n + 1) for all n. The series∑
1/(n2 − 1/4)converges by the integral test and the series
∑
1/(n + 1) diverges. (e) You can use the same examples as those given inthe answer to (d).
16. (a) A student says: “The series∞
∑
n=1
1
nconverges sincelim
n→∞1/n = 0.” What is wrong with this statement?
(b) A student says: “The series∞
∑
n=1
(−1)nn2 converges by the alternating series test.” What is wrong with this statement?
ANSWER:
(a) Knowing limn→∞
an = 0 does not tell us that∑
an converges; the theorem tells us that if∑
an converges, then
limn→∞ an = 0. In fact,∑
1/n diverges. The theorem is most often useful when we know thatlimn→∞ an 6= 0,and then we can conclude that
∑
an does not converge.(b) The alternating series test does not apply becausen2 is not a decreasing positive function ofn.
COMMENT:Follow-up Question. Explain how you know that the second series diverges.Answer. Since lim
n→∞(−1)nn2 6= 0 we know that
∑
(−1)nn2 diverges.

CHAPTER NINE Hughes Hallett et al c©2009, John Wiley & Sons 197
17. The limit comparison test can be used to determine whether the series converges. Decide which series to compare with.
∞∑
n=1
200n2 − 100n− 1
n3 + n2 + n + 1
(a)∑
1/n3 (b)∑
1/n2 (c)∑
1/n
ANSWER:(c). We have
limn→∞
(200n2 − 100n− 1)/(n3 + n2 + n + 1)
1/n= lim
n→∞
200n3 − 100n2 − n
n3 + n2 + n + 1= 200.
The limit comparison test applies. Since∑
1/n diverges, so does the series∑∞
n=1(200n2−100n−1)/(n3+n2+n+1).
18. A student says that the series∞
∑
n=1
n
1.05n= 0.95 + 1.81 + 2.59 + 3.29 + · · ·
diverges because the terms are getting larger. What is wrongwith this statement?ANSWER:Only the first twenty terms of the series are getting larger. With an = n/1.05n, we havea21 = 7.54, a22 = 7.52,
a23 = 7.49 and forn > 23 the terms continue to decrease. We can investigate convergence of this series with the ratiotest. We have
limn→∞
|an+1||an|
= limn→∞
(n + 1)/1.05n+1
n/1.05n= lim
n→∞
n + 1
n
1
1.05=
1
1.05< 1,
which shows that the series converges.Convergence of a series can never be determined by looking atonly a finite number of terms of the series.
ConcepTests and Answers and Comments for Section 9.5
1. Determine which of the following series has the smallest radius of convergence.
(a)∞
∑
n=0
(x− 10)n
6n + 1(b)
∞∑
n=0
(x− 10)n
n + 7
(c)∞
∑
n=0
2n(x− 10)n
n + 1(d)
∞∑
n=0
(x− 10)n
√n + 1
ANSWER:
(c). The ratio test giveslimn→∞
∣
∣
∣
∣
2n+1(x− 10)n+1/(n + 2)
2n(x− 10)n/(n + 1)
∣
∣
∣
∣
= limn→∞
∣
∣
∣
∣
2(x− 10)(1 + 1/n)
(1 + 2/n)
∣
∣
∣
∣
= 2|x− 10|. Thus the
radius of convergence is1/2. The ratio test gives 1 as the radius of convergence of the other three series.COMMENT:You might point out that if thecn in cn(x − a)n are rational functions ofn, the ratiocn+1/cn approaches 1 asn
approaches infinity.
2. Determine which of the following series has the smallest radius of convergence.
(a)∞
∑
n=0
(−1)n(n + 2)(x− 1)n (b)∞
∑
n=0
(x− 1)n
3n
(c)∞
∑
n=0
(x− 1)n
√
(n + 1)!(d)
∞∑
n=0
3n(x− 1)n
ANSWER:
(d). For this series the ratio test giveslimn→∞
∣
∣
∣
∣
3n+1(x− 1)n+1
3n(x− 1)n
∣
∣
∣
∣
= limn→∞
|3(x− 1)| = 3|x− 1| so R = 1/3. The
radius of convergence for the series in (a) isR = 1, for (b) R = 3, and for (c)R =∞.COMMENT:You might point out that if thecn in cn(x − a)n are rational functions ofn, the ratiocn+1/cn approaches 1 asn
approaches infinity.

198 CHAPTER NINE Hughes Hallett et al c©2005, John Wiley & Sons
3. Determine the general term for the following series if thestarting value isn = 1.
(x− 1)− (x− 1)2
2+
(x− 1)3
4− (x− 1)4
8+
(x− 1)5
16− · · · .
(a)(−1)n(x− 1)n
2n
(b)(−1)n+1(x− 1)n
2n
(c)(−1)n(x− 1)n
2n
(d)(−1)n+12(x− 1)n
2n
ANSWER:(d). Notice that the coefficient of(x − 1)n in the first term in (a) and (c) is negative, while the first termin (b) is
(x− 1)/2.COMMENT:You could ask for a free response to this question instead giving multiple choices.
4. Determine the general term for the following series if thestarting value isn = 1.
x2 +x4
2+
x6
6+
x8
24+
x10
120+ · · ·
(a)2xn
n!
(b)x2n
n!
(c)xn+2
(2n)!
(d)(x2)n
n!(e) None of the above
ANSWER:(b) and (d). The denominators, 1, 2, 6, 24, 120 follow the pattern ofn!, whereas the numerators are powers ofx2.COMMENT:You could ask for a free response to this question instead giving multiple choices.
5. Determine the general term for the following series if thestarting value isn = 1.
1
2+ x +
5x2
4+
7x3
5+
9x4
6+ · · ·
(a)(2n− 1)xn−1
n + 1
(b)(2n + 1)xn
n + 2
(c)(2n− 1)xn
n
(d)(2n + 1)xn−1
n + 1(e) None of the above
ANSWER:
(a). The pattern is more clear if the second term is written as3x
3.
COMMENT:You could ask for a free response to this question instead giving multiple choices.

CHAPTER NINE Hughes Hallett et al c©2009, John Wiley & Sons 199
6. Which of the following are power series?
(a)∞
∑
n=0
1
n + 1(x− 5)n
(b)∞
∑
n=7
1
n(x− 5)n
(c)∞
∑
n=0
1
n + 1(n− 5)n
(d) x
ANSWER:(a), (b), and (d) are power series.COMMENT:(c) is not a power series since it does not contain a variable.
7. The power series∑
Cnxn diverges atx = 7 and converges atx = −3. At x = −9, the series is
(a) Conditionally convergent(b) Absolutely convergent(c) Alternating(d) Divergent(e) Cannot be determined.
ANSWER:(d). Since the series is centered atx = 0 and diverges atx = 7, the radius of convergence isR ≤ 7. The series
converges atx = −3, soR ≥ 3. Since| − 9| = 9 > R, the series diverges atx = −9.
8. The power series∑
Cnxn diverges atx = 7 and converges atx = −3. At x = 2.5, the series is
(a) Conditionally convergent(b) Absolutely convergent(c) Alternating(d) Divergent(e) Cannot be determined.
ANSWER:(b). Since the series is centered atx = 0 and diverges atx = 7, the radius of convergence isR ≤ 7. The series
converges atx = −3, soR ≥ 3. Since|2.5| = 2.5 < R, the series is absolutely convergent atx = 2.5.
9. The power series∑
Cnxn diverges atx = 7 and converges atx = −3. At x = −4, the series is
(a) Conditionally convergent(b) Absolutely convergent(c) Alternating(d) Divergent(e) Cannot be determined.
ANSWER:(e). Since the series is centered atx = 0 and diverges atx = 7, the radius of convergence isR ≤ 7. The series
converges atx = −3, soR ≥ 3. Since| − 4| = 4, which is between 3 and 7, we cannot tell whether the series convergesatx = −4.
10. The power series∑
Cn(x− 5)n converges atx = −5 and diverges atx = −10. At x = 11, the series is
(a) Conditionally convergent(b) Absolutely convergent(c) Alternating(d) Divergent(e) Cannot be determined.
ANSWER:(b). Since the series is centered atx = 5 and converges atx = −5, the radius of convergence isR ≥ 10. The series
diverges atx = −10, soR ≤ 15. Since|11− 5| = 6 < R, the series converges absolutely atx = 11.

200 CHAPTER NINE Hughes Hallett et al c©2005, John Wiley & Sons
11. The power series∑
Cn(x− 5)n converges atx = −5 and diverges atx = −10. At x = 17, the series is
(a) Conditionally convergent(b) Absolutely convergent(c) Alternating(d) Divergent(e) Cannot be determined.
ANSWER:(e). Since the series is centered atx = 5 and converges atx = −5, the radius of convergence isR ≥ 10. The series
diverges atx = −10, soR ≤ 15. Since|17 − 5| = 12, which is between 10 and 15, we cannot tell whether the seriesconverges atx = 17.
12. The power series∑
Cn(x− 5)n converges atx = −5 and diverges atx = −10. At x = −13, the series is
(a) Conditionally convergent(b) Absolutely convergent(c) Alternating(d) Divergent(e) Cannot be determined.
ANSWER:(d). Since the series is centered atx = 5 and converges atx = −5, the radius of convergence isR ≥ 10. The series
diverges atx = −10, soR ≤ 15. Since| − 13− 5| = 18 > R, the series diverges atx = −13.

Chapter Ten
Chapter Ten

202 CHAPTER TEN Hughes Hallett et al c©2005, John Wiley & Sons
ConcepTests and Answers and Comments for Section 10.1
For Problems 1–10, supposeP2(x) = a + b(x− 1) + c(x− 1)2
2is a Taylor polynomial of degree two aboutx = 1 for some
functionf . Give the signs ofa, b, andc, if the graph off is as shown. (Note: 0 is also a possible answer for a and b, but not forc.)
1.
−2 −1 1 2
−2
−1
1
2
x
f(x)
ANSWER:0, +, +. The graph contains the point(1, 0) and is increasing and concave up there.COMMENT:Follow-up Question. What would be the signs ofa, b, andc if the Taylor series was about−1 instead of 1?Answer. 0,−, +, since the graph contains the point(−1, 0) and is decreasing and concave up whenx = −1.
2.
−2 −1 1 2
−2
−1
1
2
x
f(x)
ANSWER:+, +, +. At x = 1 the function is positive, increasing, and concave up.COMMENT:Follow-up Question. What would be the signs ofa, b, andc if the Taylor series was about−1 instead of 1?Answer. +,−, +. At x = −1 the function is positive, decreasing, and concave up.

CHAPTER TEN Hughes Hallett et al c©2009, John Wiley & Sons 203
3.
−2 −1 1 2
−2
−1
1
2
x
f(x)
ANSWER:−, +, +. At x = 1 the function is negative, increasing, and concave up.COMMENT:Follow-up Question. What would be the signs ofa, b, andc if the Taylor series was about−1 instead of 1?Answer. −,−, +. At x = −1 the function is negative, decreasing, and concave up.
4.
−2 −1 1 2
−2
−1
1
2
x
f(x)
ANSWER:0, −, −. The graph contains the point(1, 0) and is decreasing and concave down there.COMMENT:Follow-up Question. What would be the signs ofa, b, andc if the Taylor series was about−1 instead of 1?Answer. 0, +,−, since the graph contains the point(−1, 0) and is increasing and concave down there.

204 CHAPTER TEN Hughes Hallett et al c©2005, John Wiley & Sons
5.
−2 −1 1 2
−2
−1
1
2
x
f(x)
ANSWER:−, −, −. At x = 1 the function is negative, decreasing, and concave down.COMMENT:Follow-up Question. What would be the signs ofa, b, andc if the Taylor series was about−1 instead of 1?Answer. −, +,−. At x = −1 the function is negative, increasing, and concave down.
6.
−2 −1 1 2
−2
−1
1
2
x
f(x)
ANSWER:−, +, −. At x = 1 the function is negative, increasing, and concave down.COMMENT:Follow-up Question. What would be the signs ofa, b, andc if the Taylor series was about1.5 instead of 1?Answer. 0, 0,−. The point(1.5, 0) is on the graph. Also, whenx = 1.5, the functionf(x) has a horizontal tangent
and is concave down.

CHAPTER TEN Hughes Hallett et al c©2009, John Wiley & Sons 205
7.
−2 −1 1 2
−2
−1
1
2
x
f(x)
ANSWER:+, −, +. At x = 1 the function is positive, decreasing, and concave up.COMMENT:Follow-up Question. What would be the signs ofa, b, andc if the Taylor series was about1.5 instead of 1?Answer. 0, 0, +. The point(1.5, 0) is on the graph. Also, whenx = 1.5, the functionf(x) has a horizontal tangent
and is concave up.
8.
−2 −1 1 2
−2
−1
1
2
x
f(x)
ANSWER:+, −, −. At x = 1 the function is positive, decreasing, and concave down.COMMENT:Follow-up Question. What would be the signs ofa, b, andc if the Taylor series was about 0 instead of 1?Answer. 0, +, −. The point(0, 0) is on the graph. Also, whenx = 0, the functionf(x) is increasing and concave
down.

206 CHAPTER TEN Hughes Hallett et al c©2005, John Wiley & Sons
9.
−2 −1 1 2
−2
−1
1
2
x
f(x)
ANSWER:−, −, +. At x = 1 the function is negative, decreasing, and concave up.COMMENT:Follow-up Question. What would be the signs ofa, b, andc if the Taylor series was about 0 instead of 1?Answer. 0, −, +. The point(0, 0) is on the graph. Also, whenx = 0, the functionf(x) is decreasing and concave
up.
10.
−2 −1 1 2
−2
−1
1
2
x
f(x)
ANSWER:+, +, −. At x = 1 the function is positive, increasing, and concave down.COMMENT:Follow-up Question. What would be the signs ofa, b, andc if the Taylor series was about 0 instead of 1?Answer. −, +,−. At x = 0, the functionf(x) is negative, increasing, and concave down.
CHAPTER TEN Hughes Hallett et al c©2009, John Wiley & Sons 207
11. Which of (a)–(d) is the graph of the addition of the two functions in Figures 10.1 and 10.2?
−2 −1 1 2
1
2
x
y
Figure 10.1
−2 −1 1 2
−2
−1
1
2
x
y
Figure 10.2
−2 −1 1 2
−2
−1
1
2
x
y(a)
−2 −1 1 2
−2
−1
1
2
x
y(b)
−2 −1 1 2
−2
−1
1
2
x
y(c)
−2 −1 1 2
−2
−1
1
2
x
y(d)
ANSWER:(a). Both of the original functions are increasing forx > 0, so their sum must be also. This eliminates (b) and (c). At
x = −1, one function has a value 1, while the other has the value−1, so their sum is 0.COMMENT:You could also check what happens to the addition of functionvalues for several values ofx.
Follow-up Question. What if you subtract the two functions? (You could ask them todo it both ways. They should realizethat if both answers are graphed on the same set of axes, then one is a reflection across thex-axis of the other one.)
Answer. Answer (b) is the graph of the difference of the function in Figure 10.1 from the function in Figures 10.2.Answer (c) is the other difference between the two functions.

208 CHAPTER TEN Hughes Hallett et al c©2005, John Wiley & Sons
12. The graph in Figure 10.3 is generated by what combinationof the graphs of the three functionsf1, f2, andf3?
(a) f1 + 0(f2) + f3 (b) f1 − f2 + f3 (c) −f1 + 0(f2) + f3
(d) −f1 + 0(f2)− f3 (e) f1 + 0(f2)− f3 (f) −f1 + f2 + f3
−2 −1 1 2
−2
−1
1
2
x
y
Figure 10.3
−2 −1 1 2
−2
−1
1
2f1
x
y
−2 −1 1 2
1
2
f2
x
y
−2 −1 1 2
−2
−1
1
2f3
x
y
ANSWER:(c). The graph describes an odd function. This eliminates (b) and (f). The point (1,0) is on the graph which eliminates
(a) and (d). The functions is positive forx > 1 which eliminates (e).COMMENT:It may be worth asking which function,f1, f2, or f3, is not like the graph in Figure 10.3 when the question is first
presented to the class. This might encourage your students to think about an odd/even function argument.

CHAPTER TEN Hughes Hallett et al c©2009, John Wiley & Sons 209
13. The graph in Figure 10.4 is generated by what combinationof the graphs of the three functionsf1, f2, andf3?
(a) f1 + f2 + f3 (b) f1 − f2 + f3 (c) −f1 + f2 + f3
(d) −f1 + 0(f2)− f3 (e) f1 + 0(f2) + f3 (f) f1 + 0(f2)− f3
−2 −1 1 2
−2
−1
1
2
x
y
Figure 10.4
−2 −1 1 2
−2
−1
1
2f1
x
y
−2 −1 1 2
1
2
f2
x
y
−2 −1 1 2
−2
−1
1
2f3
x
y
ANSWER:(f). The point (1,0) is on the graph which eliminates (a), (b), (c), (d), and (e).COMMENT:While the answer gives a quick solution, you may want to spendmore time with geometric reasoning. For example,
the fact that the graph in Figure 10.4 is an odd function eliminates (a), (b), and (c).

210 CHAPTER TEN Hughes Hallett et al c©2005, John Wiley & Sons
14. The graph in Figure 10.5 is generated by what combinationof the graphs of the three functionsf1, f2, andf3?
(a) f1 + f2 + f3 (b) 0(f1)− f2 + f3 (c) −f1 + 0(f2) + f3
(d) −f1 + f2 − f3 (e) f1 + 0(f2)− f3 (f) 0(f1) + f2 + f3
−2 −1 1 2
−2
−1
1
2
x
y
Figure 10.5
−2 −1 1 2
−2
−1
1
2f1
x
y
−2 −1 1 2
1
2
f2
x
y
−2 −1 1 2
−2
−1
1
2f3
x
y
ANSWER:(f). The function is not odd which eliminates (c) and (e). Thepoint (−1, 0) is on the graph which eliminates (a), (b),
and (d).COMMENT:Notice thatf3 − f1 has a curve that looks somewhat like Figure 10.5 whenx < 0. However, they are quite different
for x > 0.

CHAPTER TEN Hughes Hallett et al c©2009, John Wiley & Sons 211
ConcepTests and Answers and Comments for Section 10.2
1. Which of the following have Taylor series about the originthat do not converge for all values ofx? Explain why.
(a) ex−1
(b)1
x− 4(c) arcsin(3x)(d) sin(x2)
ANSWER:
(b) and (c). In (b)1
x− 4= −1
4
(
1
1− x4
)
= −1
4
∑
(
x
4
)n
, which converges only for−1 < x/4 < 1. In (c) the
Taylor series forarcsin x converges for−1 < x < 1, so the Taylor series forarcsin(3x) will converge for−1 < 3x < 1.COMMENT:You could ask students to come up with other examples.
ConcepTests and Answers and Comments for Section 10.3
1. Given that the radius of convergence of the Taylor series for ln(1−x) aboutx = 0 is 1, what is the radius of convergencefor the following Taylor series aboutx = 0?
(a) ln(4− x)(b) ln(4 + x)(c) ln(1 + 4x2)
ANSWER:
(a) ln(4 − x) = ln(4(1 − x/4)) = ln(4) + ln(1 − x/4), so the Taylor series converges for−1 < x/4 < 1, or−4 < x < 4. The radius of convergence is 4.
(b) ln(4 + x) = ln(4(1 − (−x/4))) = ln(4) + ln(1− (−x/4)), so the Taylor series converges for−1 < −x/4 < 1,or 4 > x > −4. The radius convergence is 4.
(c) ln(1 + 4x2) = ln(1 − (−4x2)), so the Taylor series converges for−1 < −4x2 < 1. This givesx2 < 1/4, or−1/2 < x < 1/2. The radius of convergence is1/2.
COMMENT:You could ask for the interval of convergence as you expandln(4 − x) aboutx = 2. (Here you need to write
4− x = 4− (x− 2)− 2 = 2− (x− 2) = 2(1− (x− 2)/2.)
2. Examine the Taylor series of the following functions to rank them in order of smallest to largest for small positive valuesof x.
(a) e−x/2
(b) cos(√
x)(c) 1− ln(1 + x/2)(d) 1− sin(x/2)
ANSWER:
(a) e−x/2 = 1− x/2 + (x/2)2/2− · · · = 1− x/2 + x2/8− · · ·(b) cos(
√x) = 1− x/2 + x2/24− · · ·
(c) ln(1 + x/2) = 1− x/2 + (x/2)2 − · · · = 1− x/2 + x2/4 + · · ·(d) 1− sin(x/2) = 1− x/2 + (x/2)3/6− · · · = 1− x/2 + x3/48− · · ·Thus for small values ofx the order is (d), (b), (a), (c).
COMMENT:You could propose four other functions, where one is missinga first order term to point out the relative importance
of the exponent over the coefficient.

212 CHAPTER TEN Hughes Hallett et al c©2005, John Wiley & Sons
3. Given that the Taylor series forcos x is∞
∑
n=0
(−1)nx2n
(2n)!, then that of(1/2) cos(2x) is
(a) 1− x2/2 + x4/24− · · · (b) 1/2− x2/2! + x4/4!− · · ·(c) 1/2− x2/4 + x4/48− · · · (d) 1/2− x2 + x4/3− · · ·
ANSWER:(d). The Taylor series for(1/2) cos(2x) is 1/2 times the Taylor series forcos(2x), which is obtained from that of
cos x by replacingx with 2x.COMMENT:You could ask a similar question for another even function topoint out what happens to the constant term is usually
different from what happens to the higher order terms.
4. Given that the Taylor series fortan x = x + x3/3 + 21x5/120 + · · ·, then that of3 tan(x/3) is
(a) 3x + x3 + 21x5/120 + · · · (b) 3x + x3 + 21x5/40 + · · ·(c) x + x3/27 + 7x5/3240 + · · · (d) x + x3/3 + 21x5/120 + · · ·
ANSWER:(c). The Taylor series for3 tan(x/3) = 3(x/3+(x/3)3/3+21(x/3)5/120+ · · ·) = x+x2/27+7x5/3240+ · · ·COMMENT:You could ask a similar question for another odd function or one that is neither even nor odd.
ConcepTests and Answers and Comments for Section 10.5
1. Figure 10.6 contains the graph of the first three terms of the Fourier series of which of the following functions?
(a) f(x) =
{
0 , −1 < x < 0
1 , 0 < x < 1andf(x + 2) = f(x)
(b) f(x) =
{
−1 , −1 < x < 0
1 , 0 < x < 1andf(x + 2) = f(x)
(c) f(x) = |x| on−1 < x < 1 andf(x + 2) = f(x)
(d) f(x) =
{
1 + x , −1 < x < 0
1 , 0 < x < 1andf(x + 2) = f(x)
−2 −1 1 2
−2
−1
1
2
x
Figure 10.6
ANSWER:(a). The graph describes a function that is neither even nor odd. So this eliminates (b) and (c). The Fourier series for
(d) would have the value of 1 atx = 0, while the graph shows a value of1/2 there.COMMENT:Plotting the graphs in the four choices provides an efficientway to eliminate choices.

CHAPTER TEN Hughes Hallett et al c©2009, John Wiley & Sons 213
2. Figure 10.7 contains the graph of the first three terms of the Fourier series for which of the following functions?
(a) f(x) = 3(x/π)3 on−π < x < π andf(x + 2π) = f(x)
(b) f(t) = |x| on−π < x < π andf(x + 2π) = f(x)
(c) f(x) =
{
−3 , −π < x < 0
3 , 0 < x < πandf(x + 2π) = f(x)
(d) f(x) =
{
π + x , −π < x < 0
π − x , 0 < x < πandf(x + 2π) = f(x)
−6 −5 −4 −3 −2 −1 1 2 3 4 5 6
−4
−3
−2
−1
1
2
3
4
x
Figure 10.7
ANSWER:(b). The graph describes an even function, which eliminates(a) and (c). The Fourier series for (d) would have values
nearπ for x close to 0.COMMENT:Plotting the graphs in the four choices provides an efficientway to eliminate choices.

214 CHAPTER TEN Hughes Hallett et al c©2005, John Wiley & Sons
3. Figure 10.8 contains the graph of the first three non-zero terms of the Fourier series for which of the following functions?
(a) f(x) = 3(x/π)3 on−π < x < π andf(x + 2π) = f(x)
(b) f(t) = |x| on−π < x < π andf(x + 2π) = f(x)
(c) f(x) =
{
−3 , −π < x < 0
3 , 0 < x < πandf(x + 2π) = f(x)
(d) f(x) =
{
π + x , −π < x < 0
π − x , 0 < x < πandf(x + 2π) = f(x)
−6 −5 −4 −3 −2 −1 1 2 3 4 5 6
−4
−3
−2
−1
1
2
3
4
x
Figure 10.8
ANSWER:(c). The graph describes an odd function which eliminates (b) and (d). The graph stays close to−3 for x between
−3 and 0 which eliminates (a).COMMENT:Plotting the graphs in the four choices provides an efficientway to eliminate choices.

Chapter Eleven
Chapter Eleven
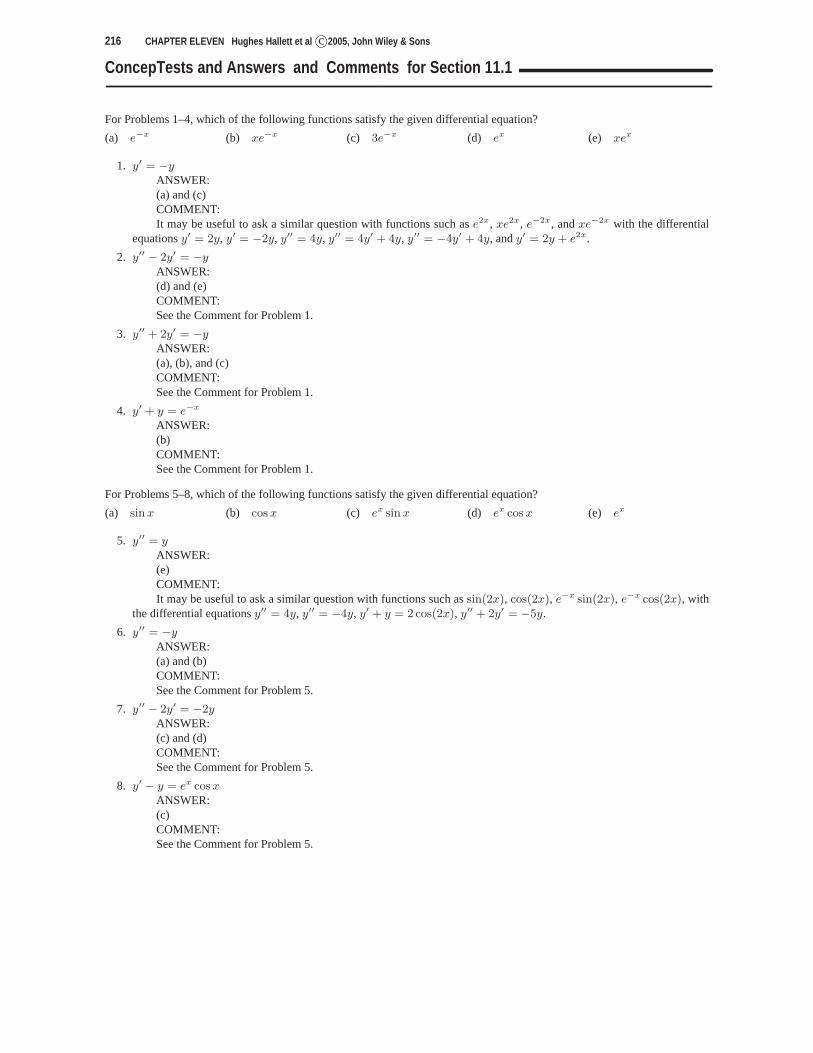
216 CHAPTER ELEVEN Hughes Hallett et al c©2005, John Wiley & Sons
ConcepTests and Answers and Comments for Section 11.1
For Problems 1–4, which of the following functions satisfy the given differential equation?
(a) e−x (b) xe−x (c) 3e−x (d) ex (e) xex
1. y′ = −yANSWER:(a) and (c)COMMENT:It may be useful to ask a similar question with functions suchase2x, xe2x, e−2x, andxe−2x with the differential
equationsy′ = 2y, y′ = −2y, y′′ = 4y, y′′ = 4y′ + 4y, y′′ = −4y′ + 4y, andy′ = 2y + e2x.
2. y′′ − 2y′ = −yANSWER:(d) and (e)COMMENT:See the Comment for Problem 1.
3. y′′ + 2y′ = −yANSWER:(a), (b), and (c)COMMENT:See the Comment for Problem 1.
4. y′ + y = e−x
ANSWER:(b)COMMENT:See the Comment for Problem 1.
For Problems 5–8, which of the following functions satisfy the given differential equation?
(a) sin x (b) cos x (c) ex sin x (d) ex cos x (e) ex
5. y′′ = yANSWER:(e)COMMENT:It may be useful to ask a similar question with functions suchassin(2x), cos(2x), e−x sin(2x), e−x cos(2x), with
the differential equationsy′′ = 4y, y′′ = −4y, y′ + y = 2 cos(2x), y′′ + 2y′ = −5y.
6. y′′ = −yANSWER:(a) and (b)COMMENT:See the Comment for Problem 5.
7. y′′ − 2y′ = −2yANSWER:(c) and (d)COMMENT:See the Comment for Problem 5.
8. y′ − y = ex cos xANSWER:(c)COMMENT:See the Comment for Problem 5.

CHAPTER ELEVEN Hughes Hallett et al c©2009, John Wiley & Sons 217
9. Which of (a)–(d) is a graph of a function that is equal to itsown derivative, i.e.f ′(x) = f(x) for all x?
−2 −1 1 2
−8
−6
−4
−2
2
4
6
8
x
y(a)
−2 −1 1 2
2
4
6
8
x
y(b)
−2 −1 1 2
2
4
6
8
x
y(c)
−2 −1 1 2
1
2
3
4
x
y(d)
ANSWER:(c). Becausef ′(x) = f(x), the graph off will be increasing whenf is positive and decreasing whenf is negative.COMMENT:This problem and the following one are repeats of earlier problems. They are meant as warm-up questions for Concept
Questions 1 - 3 of the next section.

218 CHAPTER ELEVEN Hughes Hallett et al c©2005, John Wiley & Sons
10. Which of (a)–(d) is a graph of a function that is equal to the negative of its own derivative, i.e.f(x) = −f ′(x)?
−3 −2 −1 1 2 3
1
2
3
4
5
6
x
y(a)
−3 −2 −1 1 2 3
1
2
3
4
5
6
x
y(b)
−3 −2 −1 1 2 3
1
2
3
4
5
6
x
y(c)
−3 −2 −1 1 2 3
−3
−2
−1
1
2
3
x
y(d)
ANSWER:(b). Fromf(x) = −f ′(x) we see that the graph will have negative slopes where it is positive and positive slopes
where it is negative. This eliminates (c) and (d). Also, larger values off(x) require steeper slopes.COMMENT:Students may find other reasons for contradictions.

CHAPTER ELEVEN Hughes Hallett et al c©2009, John Wiley & Sons 219
ConcepTests and Answers and Comments for Section 11.2
1. Which of the following graphs could be that of a solution tothe differential equationy′ = −xy?
−3 −2 −1 1 2 3
1
x
y(a)
−3 −2 −1 1 2 3
−10
−8
−6
−4
−2
2
4
6
8
10
x
y(b)
−3 −2 −1 1 2 3
2
4
6
8
10
x
y(c)
−3 −2 −1 1 2 3
2
4
6
8
10
12
14
16
18
20
x
y(d)
ANSWER:(a). Notice that solutions have positive slopes ifx < 0 andy > 0, and negative slopes ifx > 0 andy > 0. Also the
slope of the solution curve is zero ifx = 0 or y = 0.COMMENT:You could have students eliminate other choices by finding regions of the graph that contradict the fact that its slope
is given by−xy.

220 CHAPTER ELEVEN Hughes Hallett et al c©2005, John Wiley & Sons
2. Which of the following graphs could be that of a solution tothe differential equationy′ = −xy?
(a) (I)(b) (II)(c) (III)(d) (IV)(e) (I) and (IV)(f) (I), (II), and (IV)(g) (I) and (III)(h) (I), (II), and (III)(i) (I), (II), (III), and (IV)
−3 −2 −1 1 2 3
1
x
y(I)
1 2 3 4 5 6
1
x
y(II)
−3 −2 −1 1 2 3
1
2
3
4
5
6
7
8
x
y(III)
−3 −2 −1 1 2 3
1
2
3
4
5
6
7
8
x
y(IV)
ANSWER:(g). Fromy′ = −xy we see that solutions have positive slopes forx < 0 andy > 0 and negative slopes forx > 0
andy > 0. This eliminates (II). The remaining three graphs have zeroslope atx = 0. In addition, the slope at(3, 7) in(IV) should be−21, rather than almost zero as it is in (IV). This eliminates (IV).
COMMENT:Students may find other reasons for eliminating choices.
CHAPTER ELEVEN Hughes Hallett et al c©2009, John Wiley & Sons 221
3. Which of the following graphs could be that of a solution tothe differential equationy′ = 3y/x?
−2 −1 1 2
−8
−6
−4
−2
2
4
6
8
x
y(a)
−2 −1 1 2
−2
−1
1
2
x
y(b)
−2 −1 1 2
−2
−1
1
2
x
y(c)
−2 −1 1 2
−2
−1
1
2
x
y(d)
ANSWER:(a). Fromy′ = 3y/x, we see that solutions have positive slopes whenx andy have the same sign. This eliminates
(b). The slope wheny = x = 1 must be 3 which eliminates (c) and (d).COMMENT:Students may find other reasons for eliminating choices.

222 CHAPTER ELEVEN Hughes Hallett et al c©2005, John Wiley & Sons
4. Explain why the slope field in Figure 11.1 could only be thatof exactly one of the following.
(a) y′ = xy (b) y′ = x/y(c) y′ = y/x (d) y′ = −xy
x
y
Figure 11.1
ANSWER:(a). The slope field shows positive slopes in quadrants I and III, which eliminates (d). The slope field suggests
horizontal tangents wheny = 0, which eliminates (b). The slope field shows increasing slopes whenx increases for afixedy, which eliminates (c). The slope field is consistent with (a).
COMMENT:You could repeat this question showing the slope field ofy′ = −xy.
5. Explain why the slope field in Figure 11.2 could only be thatof exactly one of the following.
(a) y′ = xy (b) y′ = x/y(c) y′ = y/x (d) y′ = −xy
x
y
Figure 11.2
ANSWER:(b). The slope field shows positive slopes in quadrants I and III, which eliminates (d). The slope field suggests
horizontal tangents whenx = 0, which eliminates (c). The slope field suggests vertical tangents wheny = 0, whicheliminates (a). The slope field is consistent with (b).
COMMENT:You could repeat this question showing the slope field ofy′ = y/x.

CHAPTER ELEVEN Hughes Hallett et al c©2009, John Wiley & Sons 223
ConcepTests and Answers and Comments for Section 11.3
1. For which of the following differential equations will Euler’s method for approximating a solution which starts at(0, 1)give an underestimate?
(a) y′ = 2y(b) y′ = −2y(c) y′ = 2− y(d) y′ = y − 2
ANSWER:(a) and (b). For (a), differentiating givesy′′ = 2y′ = 4y, and for (b), we havey′′ = −2y′ = 4y. Thus solutions of
these two equations that start at(0, 1) are concave up, so tangent lines are below the curve, giving underestimates.
COMMENT:You could also ask which differential equations lead to overestimates.
ConcepTests and Answers and Comments for Section 11.4
1. Which of the following are separable differential equations?
(a) y′ = x(y2 + 2)(b) y′ = x2 + xy(c) y′ = ex+y
(d) y′ = y sin(2 + x)(e) y′ = ln x + ln y(f) y′ = x cos(y2)(g) y′ = yx arcsin x
ANSWER:(a), (c), (d), (f), and (g). The equations in (a), (d), (f), and (g) have the formy′ = g(x)f(y) or y′ = f(y)g(x), and
so they are separable. (c) can be written asy′ = exey, which is also separable. (b) can be written asy′ = x(x + y) and(e) asy′ = ln(xy), neither of which are separable.
COMMENT:Follow-up Question. Determine the solution of the separable equations.Answer. (f) does not have a simple antiderivative, and (g) will require integration by parts.

224 CHAPTER ELEVEN Hughes Hallett et al c©2005, John Wiley & Sons
ConcepTests and Answers and Comments for Section 11.5
1. Which of the following slope fields appear to have at least one equilibrium solution?
x
y(a)
x
y(b)
x
y(c)
x
y(d)
ANSWER:(a) and (b). On a graph, an equilibrium solution is a horizontal line. Thus on a slope field we should look for short
horizontal lines the same distance from thex-axis.COMMENT:This question may be repeated with other choices.

CHAPTER ELEVEN Hughes Hallett et al c©2009, John Wiley & Sons 225
2. A yam is put in an oven where its temperature,H, is modeled bydH
dt= −k(H −H0), wheret is time andk andH0 are
positive constants. Figure 11.3 shows four solutions of this differential equation. Which curve(s) correspond(s) to the
(a) Warmest oven?(b) Lowest initial temperature?(c) Same initial temperature?(d) Largest value ofk?
4 8 12 16 20
1
2
3
4
5
t
(I)
4 8 12 16 20
1
2
3
4
5
t
(II)
4 8 12 16 20
1
2
3
4
5
t
(III)
4 8 12 16 20
1
2
3
4
5
t
(IV)
Figure 11.3
ANSWER:
(a) The warmest oven results in the largest final temperature, therefore (I).(b) The lowest initial temperature is shown by (IV).(c) (II) and (III) have the same initial temperature.
(d) BecausedH
dt= −k(H −H0), and att = 0 the values ofH −H0 are equal to−2 for the curves in (I), (II) and (III),
the curve with the largest initial slope will correspond to the largest value ofk. The curve (III) has the largest initialslope of these three curves. The value ofH −H0 at t = 0 for the curve (IV) is smaller than−2 and the initial slopeis slightly less than that in curve (III), so the value ofk for curve (IV) must be smaller than that of curve (III).
COMMENT:You could point out that we can only make these comparisons because the scales on both axes are identical.

226 CHAPTER ELEVEN Hughes Hallett et al c©2005, John Wiley & Sons
ConcepTests and Answers and Comments for Section 11.6
1. A chemical is produced at a rate which is directly proportional to both(a− y) and(t + b), and inversely proportional to(y + c), wherey is the amount of chemical at timet, anda, b, andc are positive constants.
(a) Write the differential equation that describes this process.(b) Give all equilibrium solutions.
ANSWER:
(a)dy
dt=
k(a− y)(t + b)
y + c, wherek is a positive constant.
(b) There is only one equilibrium solution,y = a.
COMMENT:You could ask students to explain whyk > 0.
ConcepTests and Answers and Comments for Section 11.7
1. Consider solutions to a differential equation modeling exponential growth and solutions to a differential equationmodelinglogistic growth.
(a) Give at least two similarities between these solutions.(b) Give at least two differences between these solutions.
ANSWER:
(a) Solutions modeling exponential growth are increasing and concave up, which is also true for small values of thedependent variable for logistic growth. Both are always positive.
(b) Exponential solutions are unbounded, logistic solutions are bounded. Exponential solutions are concave up every-where, logistic solutions are concave down as they approachthe carrying capacity from below. Exponential solutionshave no inflection points, logistic solutions have an inflection point if their initial value is positive and less than halfthe carrying capacity.
COMMENT:To illustrate, you could graph solutions to two specific equations with the same initial conditions.
2. The logistic model for US oil production isdP
dt= kP
(
1− P
L
)
whereP is measured in billions of barrels of oil andt represents the year. Which is the meaning ofP (t)?
(a) The quantity of oil produced in the US in the yeart.(b) The total quantity of oil produced in the US in all years upto and including the yeart.(c) The quantity of oil still in the ground in the US in the yeart.(d) The fraction of oil originally in the ground in the US thatis produced in the yeart.
ANSWER:(b)COMMENT:This is a good opportunity to review the meanings of bothP anddP/dt and to make certain that students are clear
that peak oil production is about a maximum fordP/dt, not forP .
CHAPTER ELEVEN Hughes Hallett et al c©2009, John Wiley & Sons 227
3. The logistic model for US oil production isdP
dt= kP
(
1− P
L
)
whereP is measured in billions of barrels of oil andt represents the year. Which are the units ofL andk?
(a) L: billions of barrels;k: billions of barrels per year.(b) L: billions of barrels per year;k: billions of barrels.(c) L: billions of barrels;k: billions of barrels.(d) L: billions of barrels;k: year−1
(e) L: billions of barrels;k: no units attached.
ANSWER:(d) SinceL is an upper bound for the quantity of oil that will ever be produced, its units are billions of barrels.The units ofkP (1 − P/L) are the same as the units of the derivative,dP/dt, namely (billions of barrels)/(year).
SinceP has units of billions of barrels and(1− P/L) has no units attached, the constantk must have units(year)−1.COMMENT:Ask the students for the meaning ofk. In the early years, whenP/L is near zero, we havedP/dt ≈ kP , soP grows
approximately exponentially with growth ratek. At that time, every yearP increases approximately by a factor ofek. Ofcourse later on the growth rate(dP/dt)/P decreases dramatically, approaching zero as oil reserves are exhausted.
4. The Gompertz differential equation,dP/dt = −kP ln(P/L), wherek andL are positive constants, is used to modeltumors in animals. List at least two characteristics of solutions of this differential equation that are common to solutionsof the logistic differential equation,dP/dt = kP (1− P/L).
ANSWER:Both have an equilibrium solution atP = L, and are increasing for0 < P < L. For the Gompertz equation,
d2P
dt2= −k
(
dP
dtln(P/L) +
dP
dt
)
= −k(ln(P/L) + 1)dP
dt,
so solutions to both equations are concave down for values ofP just below the equilibrium solution atL.COMMENT:To illustrate, you could graph solutions to two specific equations with the same initial conditions.

228 CHAPTER ELEVEN Hughes Hallett et al c©2005, John Wiley & Sons
ConcepTests and Answers and Comments for Section 11.8
1. Figure 11.4 shows a phase trajectory for a SI-phase plane modeling an epidemic. From this figure, estimate
(a) The size of this population.(b) The maximum number infected, and the number who have never been infected at this time.(c) The number that never were infected during this epidemic.
200 400 600 800 1000
100
200
300
S
I
Figure 11.4
ANSWER:
(a) 1000(b) 230 and 400. Some have already recovered by this time, so these do not add to 1000.(c) 100
COMMENT:In estimating numbers from a graph, a range of answers is possible for choice part (b).

CHAPTER ELEVEN Hughes Hallett et al c©2009, John Wiley & Sons 229
ConcepTests and Answers and Comments for Section 11.9
1. Graph nullclines and determine all equilibrium points for the following differential equations.
(a) dx/dt = (x− 1)(y − 4), dy/dt = (x− 2)(y − 3)(b) dx/dt = (x− 4)(x− y − 1), dy/dt = y(2x− y − 4)
ANSWER:
(a) The nullclines where trajectories are horizontal arex = 2, andy = 3, those where the trajectories are vertical arex = 1 andy = 4. Thus the equilibrium points are(1, 3) and(2, 4). This is shown in Figure 11.5.
1 2 3 4
1
2
3
4
x
y
Figure 11.5
1 2 3 4
1
2
3
4
x
y
Figure 11.6
(b) The nullclines where trajectories are horizontal arey = 0 andy = 2x−4, those where the trajectories are vertical arex = 4 andy = x− 1. Thus the equilibrium points are(1, 0), (4, 0), (3, 2), and(4, 4). This is shown in Figure 11.6.
COMMENT:Using other products of functions ofx andy allows you to ask the same question for other differential equations.
ConcepTests and Answers and Comments for Section 11.10
1. The motion of a mass on a spring is governed by the initial value problemy′′ + py = 0, y(0) = A, y′(0) = B, wherep,A, andB are positive constants.
(a) What is the effect of increasingp?(b) What is the effect of increasingB?(c) What is the effect of increasingA?(d) What is the effect of makingB a negative number?(e) What is the effect of makingA a negative number?
ANSWER:
(a) Increasingp decreases the period of the oscillations.(b) IncreasingB for B > 0 increases the initial velocity, and therefore the amplitude of the oscillations ifA = 0.(c) IncreasingA for A > 0 increases the initial displacement, and therefore the amplitude of the oscillations, ifB = 0.(d) If B is a negative number andA positive, the initial motion will be toward the equilibriumposition. IfB andA are
both negative, the initial motion will be away from the equilibrium point.(e) If A is a negative number, the initial displacement is on the opposite side of the equilibrium position than when it is
positive.
COMMENT:You could repeat this questions havingA < 0, B > 0; thenA > 0, B < 0; and finally,A < 0, B < 0.

230 CHAPTER ELEVEN Hughes Hallett et al c©2005, John Wiley & Sons
2. Which of the following graphs is that of a function that satisfies the relationshipf ′′(x) = −f(x)?
1 2 3 4 5 6 7 8 9
−1
1
x
y(a)
1 2 3 4
−8
−6
−4
−2
2
4
6
8
x
y(b)
1 2 3 4 5 6 7 8 9
−4
−3
−2
−1
1
2
3
x
y(c)
1 2 3 4
−8
−6
−4
−2
2
4
6
8
x
y(d)
ANSWER:(a). Becausef ′′(x) = −f(x), solution curves will be concave down when the solution is positive, and concave up
where the solution is negative.COMMENT:You could also ask whatf ′′(x) = −f(x) implies about the location of the inflection points.

CHAPTER ELEVEN Hughes Hallett et al c©2009, John Wiley & Sons 231
3. Which of the following graphs is that of a function that satisfies the relationshipf ′′(x) = −f(x)?
(a) (I), (II), and (III)(b) (I) and (II)(c) (II) and (III)(d) (I) and (III)(e) (I)(f) (II)(g) (III)(h) None of these
1 2 3 4 5 6 7 8 9
1
2
x
y(I)
1 2 3 4 5 6 7 8 9
−1
−2
x
y(II)
1 2 3 4 5 6 7 8 9
−3
3
6
9
x
y(III)
ANSWER:(g). Becausef ′′(x) = −f(x), solution curves will be concave down when the solution is positive and concave up
when the solution is negative.COMMENT:You might point out that while functions that satisfyf ′′(x) = −f(x) are periodic, the converse is not true.
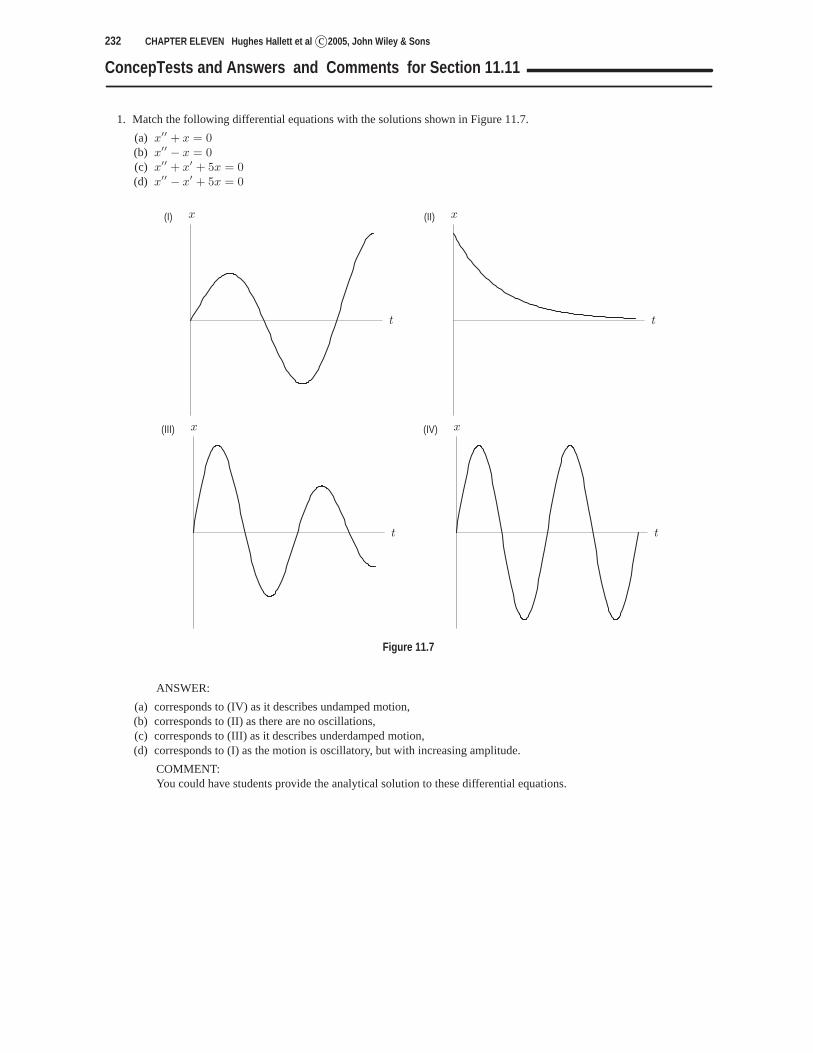
232 CHAPTER ELEVEN Hughes Hallett et al c©2005, John Wiley & Sons
ConcepTests and Answers and Comments for Section 11.11
1. Match the following differential equations with the solutions shown in Figure 11.7.
(a) x′′ + x = 0(b) x′′ − x = 0(c) x′′ + x′ + 5x = 0(d) x′′ − x′ + 5x = 0
t
x(I)
t
x(II)
t
x(III)
t
x(IV)
Figure 11.7
ANSWER:
(a) corresponds to (IV) as it describes undamped motion,(b) corresponds to (II) as there are no oscillations,(c) corresponds to (III) as it describes underdamped motion,(d) corresponds to (I) as the motion is oscillatory, but withincreasing amplitude.
COMMENT:You could have students provide the analytical solution to these differential equations.

CHAPTER ELEVEN Hughes Hallett et al c©2009, John Wiley & Sons 233
2. The motion of a mass on a spring is governed by4x′′ + 4bx′ + 9x = 0 whereb is a positive constant.
(a) For what values ofb is the motion underdamped?(b) For what values ofb is the motion overdamped?(c) For what values ofb is the motion critically damped?
ANSWER:The characteristic equation is4r2 + 4br + 9 = 0, with the solutions
r =−4b±
√16b2 − 4 · 4 · 92 · 4 =
−b±√
b2 − 9
2.
Thus motion is underdamped ifb2 − 9 < 0, i.e.0 < b < 3. The motion is overdamped ifb2 − 9 > 0, i.e. b > 3, andcritically damped ifb = 3.
COMMENT:Follow-up Question. What would happen ifb was a negative number?

234 CHAPTER ELEVEN Hughes Hallett et al c©2005, John Wiley & Sons

Chapter Twelve
Chapter Twelve

236 CHAPTER TWELVE Hughes Hallett et al c©2005, John Wiley & Sons
ConcepTests and Answers and Comments for Section 12.1
1. Look at the room you are in. Put a coordinate system in the room so that one corner is the origin. Find equations of theplanes that describe all walls, the floor and the ceiling.
ANSWER:The answer depends on the room, the choice of coordinate axes, and unit of distance.COMMENT:There will probably be a discussion on which corner to pick for the origin and what directions arex andy. As a
follow-up question, ask for coordinates of certain points inside and outside of the classroom.
2. Which of the pointsA = (3, 0, 3), B = (0, 4, 2), C = (2, 4, 1), andD = (2, 3, 4) lies closest to
(a) thexy-plane? (b) the origin?(c) they-axis? (d) the point(1, 2, 3)?
ANSWER:C is closest to thexy-plane, since the distance to thexy-plane is|z|.A is closest to the origin, since the distance to the origin is
√
x2 + y2 + z2.B is closest to they-axis, since the distance to they-axis is
√x2 + z2 .
D is closest to the point(1, 2, 3), since the distance to(1, 2, 3) is√
(x− 1)2 + (y − 2)2 + (z − 3)2.COMMENT:Ask the students to plot the four points.
3. In words, describe the surface given by the equation√
(x− 1)2 + (y + 2)2 + (z + 5)2 = 5.ANSWER:A sphere of radius5 centered at(1,−2,−5).COMMENT:It is helpful to students to be able to recognize the equationfor a sphere, a cylinder, a cone, and a paraboloid.
4. Sphere A is centered at the origin and the point(0, 0, 3) lies on it. Sphere B is given by the equationx2 + y2 + z2 = 3.Which of the following is true?
(a) A encloses B (b) B encloses A(c) A and B are equal (d) None of the above
ANSWER:(a) Both spheres are centered at the origin. Sphere A has radius 3, sphere B has radius
√3. Thus, A encloses B.
COMMENT:Follow-up Question. How would you change the equations of the spheres so that eachof the other three choices
happens?
ConcepTests and Answers and Comments for Section 12.2
1. Leth(x, t) = 3+3 sin( π10
x) cos(2πt) be the distance above the ground (in feet) of a jump ropex feet from one end aftert seconds. The two people turning the rope stand 10 feet apart.Thenh(x, 1
4) is
(a) Concave up (b) Concave down(c) Flat (d) Changes concavity in the middle
ANSWER:(c) At t = 1
4the cosine is zero. Therefore,h(x, 1
4) = 3 is constant, so its graph is a straight line.
COMMENT:Follow-up Question. Find a value fort at which the cross section is concave down.
2. The object in 3-space described byx = 2 is
(a) A point (b) A line(c) A plane (d) Undefined.
ANSWER:(c), a plane. Whilex is fixed at 2,y andz can vary freely.COMMENT:If all three variables do not appear in a problem, students sometimes forget that the missing variables are important.

CHAPTER TWELVE Hughes Hallett et al c©2009, John Wiley & Sons 237
3. The set of points whose distance from thez-axis equals the distance from thexy-plane describes a
(a) Plane (b) Cylinder (c) Sphere(d) Cone (e) Double cone (two cones joined at their vertices)
ANSWER:(e), double cone. Fix a value forz, for example,z = a, and draw the set of points in the planez = a that are
equidistant from thez-axis and thexy-plane. It is the set of points at distance|a| from thez-axis, namely a circle ofradius|a| in the planez = a. Putting all these circles together, we get two cones, with vertex at the origin, one above thexy-plane and one below it.
COMMENT:Note that you also have to consider negative values ofz. Students have a hard time visualizing surfaces in 3 dimen-
sions.
4. Which of the following objects cannot be obtained as the graph of a function of two variables with a single formula?
(a) Paraboloid(b) Plane(c) Cylinder(d) Sphere(e) Line(f) Parabolic cylinder
ANSWER:(c), cylinder; (d), sphere; (e), line.COMMENT:Follow-up Question. Give examples of functions whose graphs are the other surfaces.
ConcepTests and Answers and Comments for Section 12.3
1. Figure 12.1 shows contours of a function. You stand on the graph of the function at the point(−1,−1, 2) and start walkingparallel to thex-axis. Describe how you move and what you see when you look right and left.
x
y
3 2 1 0 1 2 3
Figure 12.1
ANSWER:You start to the left of they-axis on the contour labeled 2. At first you go downhill, and the slope is steep. Then it
flattens out. You reach a lowest point right on they axis and start going uphill; the slope is increasing as you go. To yourleft and right the terrain is doing the exact same thing; you are walking across a valley that extends to your right and left.
COMMENT:Follow-up Question. What happens if you walk in a different direction?

238 CHAPTER TWELVE Hughes Hallett et al c©2005, John Wiley & Sons
2. Which of the following is true? If false, find a counterexample.
(a) The values of contour lines are always 1 unit apart.(b) Any contour diagram that consists of parallel lines comes from a plane.(c) The contour diagram of any plane consists of parallel lines.(d) Contour lines can never cross.(e) The closer the contours, the steeper the graph of the function.
ANSWER:(c) and (e) are true. For (a), Figure 12.40 in the text, a contour diagram of the corn production function, is a
counterexample. For (b), the parabolic cylinder,z = x2, has parallel line contours. For (d), contour lines of the samevalue can cross, for example, the contour 0 inz = xy.
COMMENT:Follow-up Question. How would you have to change the statements to make them true (if possible)?
3. Which of the following terms best describes the origin in the contour diagram in Figure 12.2?
(a) A mountain pass (b) A dry river bed(c) A mountain top (d) A ridge
321−1−2−3
3
2
1
−1
−2
−3
x
y
0
00
0
2
4
2
4
2
4
2
4
Figure 12.2
ANSWER:A dry river bed.COMMENT:Follow-up Question. Imagine that you are walking on the graph of the function. Describe what you see and how
you move.
4. Draw a contour diagram for the surfacez = 1− x− y. Choose a point and determine a path from that point on which
(a) The altitude of the surface remains constant.(b) The altitude increases most quickly.
ANSWER:
(a) To maintain a constant altitude, we move along a contour.(b) To find the path on which the altitude increases most quickly, we move perpendicular to the level curves.
COMMENT:Find the equations of these paths in thexy-plane. Choose other paths on the plane and describe them.
5. Which of the following surfaces do not have circles as contours?
(a) A parabolic cylinder(b) A cone(c) A paraboloid(d) A hemisphere
ANSWER:(a), a parabolic cylinder has straight line contours.COMMENT:Follow-up Question. How can you change the equation of the paraboloidz = x2+y2 to make the contours ellipses?

CHAPTER TWELVE Hughes Hallett et al c©2009, John Wiley & Sons 239
ConcepTests and Answers and Comments for Section 12.4
1. Which of the following planes are parallel?
(a) z = −2− 2x− 4y(b) z = −1− x− 2y(c) (z − 1) = −2− 2(x− 1)− 4(y − 1)(d) z = 2 + 2x + 4y
ANSWER:(a) and (c) are parallel.COMMENT:Follow-up Question. How could we change the other two so that they are parallel?
2. True or False? If false give a counterexample.
(a) Any three points in 3-space determine a unique plane.(b) Any two distinct lines in 3-space determine a unique plane.(c) If the graph ofz = f(x, y) is a plane, then each cross section is a line.
ANSWER:
(a) False. If the three points lie on a line, there are many planes containing them.(b) False. If two lines don’t intersect and are not parallel,then there is no plane that contains them both.(c) True.
COMMENT:Ask what else must be assumed about the points in (a) and the lines in (b) to make the statements true.
3. Find as many conditions as possible that determine a unique plane. What information is needed to describe a uniqueplane?
ANSWER:
(a) Three points that are not collinear.(b) Two lines that intersect and are not identical.(c) Two parallel lines that are not identical.(d) A line and a point that does not lie on the line.(e) Other answers are possible.
COMMENT:There are many different ways to describe a unique plane. Once we know vectors there are even more. This question
can also be used at the end of Chapter 13.
4. Describe all the ways that three different planes can be positioned in 3-space so that they do not share any common points.For example: The three planes can all be parallel.
ANSWER:
(a) Two planes are parallel, and the third plane intersects each of the first two.(b) Two planes intersect in a line, and the third plane is parallel to that line, but not parallel to either of the first two
planes. The three planes enclose an infinite triangular prism.
COMMENT:It may take some time for students to come up with the second solution without any prompting. Playing around with
sheets of paper may help to visualize the planes.

240 CHAPTER TWELVE Hughes Hallett et al c©2005, John Wiley & Sons
ConcepTests and Answers and Comments for Section 12.5
1. Level surfaces of the functionf(x, y, z) = (x2 + y2)−1/2 are
(a) Circles centered at the origin.(b) Spheres centered at the origin.(c) Cylinders centered around thez-axis.(d) Upper halves of spheres centered at the origin.
ANSWER:(c). Cylinders centered around thez-axis.COMMENT:Follow-up Question. How do different level surfaces compare?
2. Describe in words the level surfaces ofV (x, y, z) = ln(x2 + y2 + z2).ANSWER:If ln(x2 +y2 + z2) = C, thenx2 +y2 + z2 = eC . Level surfaces are spheres of radiuseC/2 centered at the origin.COMMENT:Follow-up Question. As C increases, what happens to the level surfaces?
3. True or false? If false, give a counterexample.
(a) Any level surface of a function of 3 variables can be thought of as a surface in 3-space.(b) Any surface that is a graph of a 2-variable functionz = f(x, y) can be thought of as a level surface of a function of
3 variables.(c) Any level surface of a function of 3 variables can be thought of as the graph of a functionz = f(x, y).
ANSWER:
(a) False. The level surface off(x, y, z) = x2 + y2 + z2 given byf(x, y, z) = 0 is a single point, the origin(0, 0, 0).The level surface ofg(x, y, z) = (x− y)2 + z2 given byg(x, y, z) = 0 is the liney = x in thexy-plane.
(b) True(c) False, not every level surface is the graph of a function of two variables. For example:V (x, y, z) = x2 + y2 + z2
has spheres as its level surfaces, which are not the graphs offunctions ofx andy.
COMMENT:(b) and (c) are converses of each other. Only one is true. The implicit function theorem, available on the textbook
website, sheds light on (a).
ConcepTests and Answers and Comments for Section 12.6
In Problems 1–3, construct a functionf(x, y) with the given property.
1. Not continuous along the linex = 2; continuous everywhere else.ANSWER:
One possible answer isf(x, y) =
{
0 if x < 2
1 if x ≥ 2.
2. Not continuous at the point(2, 0); continuous everywhere else.ANSWER:One possible answer iff(x, y) = 1/((x− 2)2 + y2).
3. Not continuous along the curvex2 + y2 = 1; continuous everywhere else.ANSWER:One possible answer isf(x, y) = 1/(x2 + y2 − 1).

Chapter Thirteen
Chapter Thirteen

242 CHAPTER THIRTEEN Hughes Hallett et al c©2005, John Wiley & Sons
ConcepTests and Answers and Comments for Section 13.1
1. Consider the vector~v = −~i + 2~j + 7~k . Find a vector that
(a) Is parallel but not equal to~v .(b) Points in the opposite direction of~v .(c) Has unit length and is parallel to~v .
ANSWER:
(a) 2~v = −2~i + 4~j + 14~k(b) −~v =~i − 2~j − 7~k(c) ~v /||~v || = 1√
54(−~i + 2~j + 7~k )
Other answers are possible.COMMENT:Follow-up Question. How many vectors can you find in each case?
2. What would you get if you drew all possible unit vectors in 3-space with tails at the origin?ANSWER:A sphere of radius one.COMMENT:Follow-up Question. Is it just the surface of the sphere or is it a solid ball?
3. What object in three space is traced by the tips of all vectors starting at the origin that are of the form
(a) ~i +~j + b~k , whereb is any real number.(b) ~i + a~j + b~k , wherea andb are any real numbers.
ANSWER:
(a) A vertical line, parallel to thez-axis.(b) The planex = 1, parallel to theyz-plane.
COMMENT:This problem provides valuable practice in visualizing objects in three space.
4. Describe the object created by all scalar multiples of~v =~i +~j with tail at the point(0, 0, 1).ANSWER:This describes a line through the point(0, 0, 1) parallel to the vector~v = ~i + ~j . The line lies in the planez = 1
and is parallel to thexy-plane.COMMENT:Problems like this help students visualize lines in three space. This particular way of describing a line comes up in
the section on parameterizations.
5. Decide if each of the following statements is true or false:
(a) The length of the sum of two vectors is always strictly larger than the sum of the lengths of the two vectors.(b) ||~v || = |v1|+ |v2|+ |v3|, where~v = v1
~i + v2~j + v3
~k .(c) ±~i , ±~j , ±~k are the only unit vectors.(d) ~v and ~w are parallel if~v = λ~w for some scalarλ.(e) Any two parallel vectors point in the same direction.(f) Any two points determine a unique displacement vector.(g) 2~v has twice the magnitude as~v .
ANSWER:
(a) False(b) False(c) False(d) True(e) False(f) False(g) True
COMMENT:Follow-up Question. Find counterexamples for the false statements.

CHAPTER THIRTEEN Hughes Hallett et al c©2009, John Wiley & Sons 243
ConcepTests and Answers and Comments for Section 13.2
1. Decide if each of the following quantities is a vector or a scalar.
(a) Velocity(b) Speed(c) Force(d) Area(e) Acceleration(f) Volume
ANSWER:
(a) Vector(b) Scalar(c) Vector(d) Scalar(e) Vector(f) Scalar
COMMENT:Follow-up Question. Can you think of any other quantities that are vectors?
2. A plane wants to fly due south. There is a strong wind from thewest. In what direction should the pilot point the plane tostay on course?
(a) South(b) East(c) West(d) Between south and east(e) Between south and west
ANSWER:(e), between south and west.COMMENT:Follow-up Question. What shape is the path of an object that is dropped from the plane?
3. A car drives around an elliptical track, always going as fast as it can (without flying off the track). Compare the speed andthe velocity of the car at the given points in Figure 13.1.
P R
Q
S
Figure 13.1
ANSWER:The speeds are the same atP andR, but the velocity vectors point in opposite directions, tangent to the race track.
The same is true ofQ andS.COMMENT:Follow-up Question. What do the acceleration vectors look like at these points?

244 CHAPTER THIRTEEN Hughes Hallett et al c©2005, John Wiley & Sons
ConcepTests and Answers and Comments for Section 13.3
1. View the second and hour hands of a clock as vectors~s and~h in the plane. Describe~s · ~h over the course of 2 minutesbeginning at noon. If you increase the length of the second hand, what happens to the dot products?
ANSWER:Over the course of two minutes, the hour hand moves very little, while the second hand makes two complete revolu-
tions. The dot product starts out at a maximum with both vectors pointing at 12. As~s moves, the dot product decreasesuntil it is zero when the second hand is near 3, it keeps decreasing and becomes negative until it reaches a minimum when~s points approximately toward 6. After that, the dot product increases, reaches zero when~s points approximately at 9and keeps increasing until it reaches a maximum when~s points at about 12. During the second minute the dot productrepeats the same pattern with a slight variation due to the small movement of the hour hand.
If the length of~s is increased, the dot product goes through the same sign changes and has the same zeros but reachesa larger maximum value and a lower (negative) minimum.
COMMENT:This is a good place to reinforce that the dot product dependson both the magnitude and the angle between the
vectors.
2. Which of the following planes are parallel to one another?Which are perpendicular to one another?
(a) 2x + 3y − 5z = 4 (b) 2x− 3y − z = 3(c) 4x + 6y − 2z = 0 (d) z = 4− 2x− 3y(e) z = 4 + 2x + 3y (f) x + y + z = 1
ANSWER:(a) and (b) are perpendicular, (a) and (f) are perpendicular, (c) and (e) are parallel.COMMENT:Follow-up Question. Does this mean that (b) is perpendicular to (f)? Why not?
3. Draw a picture and describe a situation where
(a) The projection of a vector onto a line is the zero vector;(b) The projection of a vector onto a line is the vector itself.
ANSWER:
(a) The vector is perpendicular to the line.(b) The vector lies on the line.
COMMENT:It is important to be able to visualize projections, not justremember the formula.
4. True or false?
(a) ~v · ~w = 0 if and only if~v = ~0 or ~w = ~0 .(b) The zero vector is orthogonal to any other vector.(c) Any plane has only two distinct normal vectors.(d) If ||~v || and||~w || are large then~v · ~w is large.(e) The dot product of a vector with itself is its magnitude.(f) Any vector normal to a surface has length one.(g) Parallel planes share a same normal vector.(h) If two planes are perpendicular, so are their normal vectors.
ANSWER:
(a) False, the vectors could be perpendicular.(b) True(c) False. A plane has infinitely many normal vectors. It has two distinct unit normal vectors.(d) False. Not if the vectors are perpendicular or close to perpendicular.(e) False. It’s the square of its magnitude.(f) False(g) True(h) True
COMMENT:This problem may bring up students’ misconceptions about vectors.
CHAPTER THIRTEEN Hughes Hallett et al c©2009, John Wiley & Sons 245
ConcepTests and Answers and Comments for Section 13.4
1. Find~i ×~j graphically. Don’t use any formulas.ANSWER:By the right-hand-rule~i ×~j points in the direction of~k . Since~i and~j both have length one and are perpendicular,
they form the sides of a square of area one. Thus||~i ×~j || = 1, so~i ×~j = ~k .COMMENT:Follow-up Question. What about~j ×~i ?
2. View the second and hour hands of a clock as vectors~s and~h in a horizontal plane in 3-space. Suppose~h points at 12.At what time(s) during the next minute does~s × ~h have largest magnitude?
ANSWER:When the hands point in perpendicular directions, roughly after 15 and 45 seconds, the parallelogram that is formed
by the two hands is largest.COMMENT:Follow-up Question. What is the difference in the cross product at the two times?
3. Decide if each of the following quantities is a vector, a scalar, or undefined.
(a) ~v · ~w(b) ~v × ~w(c) (~u × ~v ) · ~w(d) ~u × (~v · ~w )
(e)~v × ~w
~v · ~w(f)
~v · ~w~v × ~wANSWER:
(a) Scalar(b) Vector(c) Scalar(d) Undefined(e) Vector or undefined(f) Undefined
COMMENT:~v × ~w
~v · ~w is undefined when~v and ~w are perpendicular.
4. Decide if each of the following statements is true or false.
(a) If ||~v || > ||~w || then||~v × ~u || > ||~w × ~u ||.(b) ~u × ~u = ~0 for all ~u .(c) ~u × ~v = ~v × ~u(d) ||~u × ~v || = ||~v × ~u ||(e) (~u × ~v ) · ~u = 0
ANSWER:
(a) False(b) True(c) False(d) True(e) True
COMMENT:Find a counterexample for each false statement. This encourages students to visualize.

246 CHAPTER THIRTEEN Hughes Hallett et al c©2005, John Wiley & Sons

Chapter Fourteen
Chapter Fourteen

248 CHAPTER FOURTEEN Hughes Hallett et al c©2005, John Wiley & Sons
ConcepTests and Answers and Comments for Section 14.1
Problems 1–2 concern the contour diagram for a functionf(x, y) in Figure 14.1.
9
7
5
3
1
−5 5
−5
5
Q
P
R
S
f(x, y)
x
y
Figure 14.1
1. At the pointQ, which of the following is true?
(a) fx > 0, fy > 0 (b) fx > 0, fy < 0(c) fx < 0, fy > 0 (d) fx < 0, fy < 0
ANSWER:(d), since both are negative.
2. List the pointsP , Q, R in order of increasingfx.
(a) P > Q > R (b) P > R > Q (c) R > P > Q(d) R > Q > P (e) Q > R > P
ANSWER:(b), sincefx(P ) > 0, fx(R) > 0, andfx(P ) > fx(R). Also fx(Q) < 0.

CHAPTER FOURTEEN Hughes Hallett et al c©2009, John Wiley & Sons 249
3. Use the level curves off(x, y) in Figure 14.2 to estimate
(a) fx(2, 1) (b) fy(1, 2)
1 2 3 4 5
1
2
3
4
5
29
28
27
26
25
24
23
22
21
x (m)
y (m)
Figure 14.2
ANSWER:
(a) We have
fx(2, 1) ≈ 26− 27
3.7− 2= − 1
1.7= −0.588.
(b) We have
fy(1, 2) ≈ 26− 26.5
2.5− 2= −1.

250 CHAPTER FOURTEEN Hughes Hallett et al c©2005, John Wiley & Sons
4. Figure 14.3 shows level curves off(x, y). At which of the following points is one or both of the partialderivatives,fx,fy , approximately zero? Which one(s)?
(a) (1,−0.5)(b) (−0.4, 1.5)(c) (1.5,−0.4)(d) (−0.5, 1)
−1.0 −0.5 0 0.5 1.0 1.5 2.0−1.0
−0.5
0
0.5
1.0
1.5
2.0
x
y
−1
0
1
2
2
3
4
Figure 14.3
ANSWER:
(a) At (1,−0.5), the level curve is approximately horizontal, sofx ≈ 0, butfy 6≈ 0.(b) At (−0.4, 1.5), neither are approximately zero.(c) At (1.5,−0.4), neither are approximately zero.(d) At (−0.5, 1), the level curve is approximately vertical, sofy ≈ 0, butfx 6≈ 0.
COMMENT:Ask students to estimate the nonzero partial derivative at one or more of the points.Ask students to speculate about the partial derivatives at(0, 0).
5. Figure 14.4 is a contour diagram forf(x, y) with thex andy axes in the usual directions. At the pointP , isfx(P ) positiveor negative? Increasing or decreasing as we move in the the direction of increasingx?
P
1 2 3 4 5
Figure 14.4
ANSWER:At P , the values off are increasing at an increasing rate as we move in the positivex-direction, sofx(P ) > 0, and
fx(P ) is increasing.COMMENT:Ask about howfx changes in they-direction and aboutfy.

CHAPTER FOURTEEN Hughes Hallett et al c©2009, John Wiley & Sons 251
6. Figure 14.5 is a contour diagram forf(x, y) with thex andy axes in the usual directions. At the pointP , if x increases,what is true offx(P )? If y increases, what is true offy(P )?
(a) Have the same sign and both increase.(b) Have the same sign and both decrease.(c) Have opposite signs and both increase.(d) Have opposite signs and both decrease.(e) None of the above.
� 1� 3
� 5P
Figure 14.5
ANSWER:We havefx(P ) > 0 and decreasing, andfy(P ) < 0 and decreasing, so the answer is (d).
ConcepTests and Answers and Comments for Section 14.2
1. Letf(x, y) = x2 ln(x2y). Which of the following are the two partial derivatives off? Which is which?
(a) 2x ln(x2y) + 2x,2x
y
(b)1
y, 2x ln(x2y) +
2x
y
(c)x2
y, 2x + 2x ln(x2y)
(d)2x3
y+ 2x ln(x2y),
x2
y
(e)2x
y+ 2x ln(x2y),
1
y
(f)2x
y, 2x ln(x2y) +
2x3
y
ANSWER:The partial derivatives are
fx(x, y) = 2x ln(x2y) + x2 · 1
x2y· 2xy = 2x ln(x2y) + 2x
fy(x, y) = x2 · 1
x2y· x2 =
x2
y.
Thus, the answer is (c), withfy first, fx second.

252 CHAPTER FOURTEEN Hughes Hallett et al c©2005, John Wiley & Sons
2. Which of the following functions satisfy the following equation (called Euler’s Equation):
xfx + yfy = f?
(a) x2y3 (b) x + y + 1 (c) x2 + y2 (d) x0.4y0.6
ANSWER:Calculate the partial derivatives and check. The answer is (d), and
x∂
∂x(x0.4y0.6) = x0.4x−0.6y0.6 = 0.4x0.4y0.6
y∂
∂y(x0.4y0.6) = yx0.40.6y−0.4 = 0.6x0.4y0.6.
Thusxfx + yfy = 0.4x0.4y0.6 + 0.6x0.4y0.6 = x0.4y0.6 = f.
ConcepTests and Answers and Comments for Section 14.3
1. Letf(2, 3) = 7, fx(2, 3) = −1, andfy(2, 3) = 4. Then the tangent plane to the surfacez = f(x, y) at the point(2, 3)is
(a) z = 7− x + 4y (b) x− 4y + z + 3 = 0 (c) −x + 4y + z = 7(d) −x + 4y + z + 3 = 0 (e) z = 17 + x− 4y
ANSWER:The tangent plane is
z = 7− 1(x− 2) + 4(y − 3),
which simplifies toz = −3− x + 4y or x− 4y + z + 3 = 0.
Thus, the answer is (b).
2. Figure 14.6 shows level curves of the functionf(x, y). The tangent plane approximation tof(x, y) at the pointP is
f(x, y) ≈ c + m(x− x0) + n(y − y0).
What are the signs ofc, m, andn?
(a) c > 0, m > 0, n > 0 (b) c < 0, m > 0, n < 0 (c) c > 0, m < 0, n > 0(d) c < 0, m < 0, n < 0 (e) None of the above
4
3
2
1
x
y
� P
Figure 14.6
ANSWER:Sincec = f(P ) ≈ 3.5, we havec > 0. Sincef increases in thex-direction and decreases in they-direction, we
knowm > 0 andn < 0, so the answer is (e).

CHAPTER FOURTEEN Hughes Hallett et al c©2009, John Wiley & Sons 253
3. The differential of a functionf(x, y) at the point(a, b) is given by the formula
df = fx(a, b) dx + fy(a, b) dy.
Which of the following are true? (There may be more than one answer.)
(a) Doublingdx anddy doublesdf .(b) Moving to a different point(a, b) may change the formula fordf .(c) If dx anddy represent small changes inx andy in moving away from the point(a, b), thendf approximates the
change inf .(d) The equation of the tangent plane toz = f(x, y) at the point(a, b) can be used to calculate values ofdf from dx and
dy.(e) None of these are true.
ANSWER:All of (a)–(d) are true.
4. A small business has $300,000 worth of equipment and 100 workers. The total monthly production, P (in thousands ofdollars), is a function of the total value of the equipment,V (in thousands of dollars), and the total number of workers,N .The differential ofP is given bydP = 4.9dN + 0.5dV . If the business decides to lay off 3 workers and buy additionalequipment worth$20,000, then
(a) Monthly production increases. (b) Monthly production decreases.(c) Monthly production stays the same.
ANSWER:(b), sincedN = −3 anddV = 20, dP = 4.9(−3) + 0.5(20) = −4.7. Thus, we see that production,P , decreases
(becausedP is negative) by $4700.
ConcepTests and Answers and Comments for Section 14.4
1. Figure 14.7 shows the temperatureT ◦C in a heated room as a function of distancex in meters along a wall and timet in minutes. Which is larger,|| gradT (15, 15)|| or || gradT (25, 25)||? Explain your choice without computing thesenumbers.
5 10 15 20 25 30
10
20
30
40
50
60
x (meters)
30
25
20
15
10
t (minutes)
Figure 14.7
ANSWER:We have|| gradT (15, 15)|| > || gradT (25, 25)|| because the contour lines are closer together at the point(15, 15)
than at(25, 25).

254 CHAPTER FOURTEEN Hughes Hallett et al c©2005, John Wiley & Sons
2. Table 14.1 gives values of the functionf(x, y) which is smoothly varying around the point(3, 5). Estimate the vectorgrad(f(3, 5)). If the gradient vector is placed with its tail at the origin,into which quadrant does the vector point?
(a) I (b) II (c) III (d) IV(e) Can’t tell without more information
Table 14.1
x
y
4.9 5 5.1
2.9 18.12 17.42 16.73
3 18.42 17.74 17.04
3.1 18.71 18.04 17.35
ANSWER:Estimating the gradient from the table, we find
∂f
∂x(3, 5) ≈ 18.04− 17.74
3.1− 3= 3
∂f
∂y(3, 5) ≈ 17.04− 17.74
5.1− 5= −7.
Thusgrad(f(3, 5)) ≈ 3~i − 7~j , sograd(f(3, 5)) points into Quadrant IV, so the answer is (d).
3. Let grad f(1, 1) = 3~i − 5~j . What is the sign of the directional derivative off in the directions given by each of thefollowing vectors?
(a) տ (b) ↑ (c) ← (d) ցANSWER:
(a) The vector is approximately in the direction of−~i +~j , so the directional derivative is negative.(b) The vector is approximately in the direction of~j , so the directional derivative is negative.(c) The vector is approximately in the direction of−~i , so the directional derivative is negative.(d) The vector is approximately in the direction of~i −~j , so the directional derivative is positive.
4. Which of the vectors shown on the contour diagram off(x, y) in Figure 14.8 could begrad f at the point at which thetail is attached?
(a) A (b) B (c) C (d) D
AB
C
D
1
2
3
4
3
2
1
−1
−2
−3−3 −2 −1 1 2 3
Figure 14.8
ANSWER:(d). The vectors atA andC point in the opposite direction ofgrad f . The vector atB is too short. The vector atD
could begrad f at this point.The magnitude ofgrad f is the rate of change off as we move perpendicular to the level curves. AtB andD, we
have|| grad f || ≈ 1/0.5 = 2.

CHAPTER FOURTEEN Hughes Hallett et al c©2009, John Wiley & Sons 255
5. At which of the pointsP,Q, R, S in Figure 14.9 does the gradient have the largest magnitude?
Q
P
R
S
f(x, y)
x
y
Figure 14.9
ANSWER:At S, the level curves are closest together, sograd f has the largest magnitude.COMMENT:As an extension, ask students to label contours and show direction ofgrad f at each point.
6. The surface of a hill is modeled byz = 25− 2x2 − 4y2. When a hiker reaches the point(1, 1, 19), it begins to rain. Shedecides to descend the hill by the most rapid way. Which of thefollowing vectors points in the direction in which shestarts her descent?
(a) −4x~i − 8y~j (b) 4x~i + 8y~j (c) −4~i − 8~j (d) 4~i + 8~j(e) None of the above
ANSWER:(d), sincegrad z = −4x~i − 8y~j , at the point(1, 1, 19), we havegrad z = −4~i − 8~j , which is the direction of
most rapid ascent. To descend, she must go the opposite direction, in the direction of4~i + 8~j .
ConcepTests and Answers and Comments for Section 14.5
1. Letf(x, y, z) represent the temperature in◦C at the point(x, y, z) with x, y, z in meters. Let~v be your velocity in metersper second. Give units and an interpretation of each of the following quantities.
(a) || grad f || (b) grad f · ~v (c) || grad f || · ||~v ||ANSWER:
(a) The units of|| grad f || are◦C per meter. It represents the rate of change of temperature with distance as you move inthe direction ofgrad f .
(b) The units ofgrad f ·~v are◦C per second. It represents the rate of change of temperaturewith time as you move withvelocity~v .
(c) The units of|| grad f || · ||~v || are◦C per second. It represents the rate of change of temperaturewith time if you movein the direction ofgrad f with speed||~v ||.
256 CHAPTER FOURTEEN Hughes Hallett et al c©2005, John Wiley & Sons
2. Forf(x, y, z), suppose
grad f(a, b, c) ·~i > grad f(a, b, c) ·~j > grad f(a, b, c) · ~k > 0.
The tangent plane to the surfacef(x, y, z) = 0 through the point(a, b, c) is given by
z = p + mx + ny.
Which of the following is correct?
(a) m > n > 0 (b) n > m > 0 (c) m < n < 0 (d) n < m < 0(e) None of the above
ANSWER:The inequalities given tell us that
fx(a, b, c) > fy(a, b, c) > fz(a, b, c) > 0.
The tangent plane tof(x, y, z) = 0 is given, for some constantd, by
fx(a, b, c)x + fy(a, b, c)y + fz(a, b, c)z = d,
so
z =d
fz(a, b, c)− fx(a, b, c)
fz(a, b, c)x− fy(a, b, c)
fz(a, b, c)y.
Thus,
m = −fx(a, b, c)
fz(a, b, c)and n = −fy(a, b, c)
fz(a, b, c),
som < n < 0, and the answer is (c).
3. Let~r = x~i + y~j + z~k and~r0 = x0~i + y0
~j + z0~k . Which of the following is/are not a possible equation(s) for the
tangent plane to the surfacef(x, y, z) = c at (x0, y0, z0)? Why not?
(a) grad f(x0, y0, z0) · ~r = grad f(x0, y0, z0) · ~r0
(b) grad f(x0, y0, z0)× ~r = grad f(x0, y0, z0)× ~r0
(c) z − f(x0, y0, z0) = fx(x0, y0, z0)(x− x0) + fy(x0, y0, z0)(y − y0)(d) fx(x0, y0, z0)x + fy(x0, y0, z0)y + fz(x0, y0, z0)z = fx(x0, y0, z0)x0 + fy(x0, y0, z0)y0 + fz(x0, y0, z0)z0
ANSWER:Only (b) and (c) are incorrect. The equation for the tangent plane is a scalar equation; (b) is a vector equation. In (c),
the left side should be−fz(x0, y0, z0)(z − z0).COMMENT:Have the students justify and explain the other equations.
4. The functionf(x, y) has gradientgrad f at the point(a, b). Which of the following statements is/are true?
(a) The vectorgrad f is perpendicular to the level curvef(x, y) = f(a, b).(b) The vectorgrad f is perpendicular to the surfacez = f(x, y) at the point(a, b, f(a, b)).(c) The vectorfx(a, b)~i + fy(a, b)~j + ~k is perpendicular to the surfacez = f(x, y).(d) If the vector~n is any vector which is perpendicular to the surface at the point wherex = a andy = b, then~n is a
scalar multiple of(grad f − ~k ).
ANSWER:
(a) True(b) False. The vectorgrad f is a 2-vector; the vector perpendicular to the surface has az-component.(c) False. The normal to the surfacez = f(x, y) is obtained by writing it in the form
f(x, y)− z = 0,
giving the normal asfx~i + fy
~j − ~k .(d) True. One normal isfx
~i + fy~j − ~k = grad f − ~k , so any other normal is a multiple of this one.

CHAPTER FOURTEEN Hughes Hallett et al c©2009, John Wiley & Sons 257
ConcepTests and Answers and Comments for Section 14.6
1. Figure 14.10 shows contours ofz = f(x, y). Figures 14.11 and 14.12 showx andy, respectively, as functions oft. Decide
ifdz
dt
∣
∣
∣
t=2is
(a) Positive (b) Negative(c) Approximately 0 (d) Can’t tell without further information
321−1−2−3
3
2
1
−1
−2
−3
x
y
4
4
2
2
6
6
8
8
Figure 14.10
−4 4
−4
4
t
x
Figure 14.11
−44
−4
4
t
y
Figure 14.12
ANSWER:By the chain rule
dz
dt= zxx′(t) + zyy′(t).
The graphs ofx(t) andy(t) show that att = 2, we havex ≈ 2 andy ≈ 1. In addition,x′(2) is negative, andy′(2)is positive, withx′(2) having a much larger magnitude. We look at the point(2, 1) on the contour diagram and see thatzx(2, 1) andzy(2, 1) are both positive, withzx(2, 1) larger. Thus
dz
dt
∣
∣
∣
t=2= (+)(−) + (+)(+),
and the relative magnitudes tells us that the first term, corresponding tozxx′(t), dominates, sodz
dt
∣
∣
∣
t=2is negative, and
the answer is (b).
2. Letz = g(u, v) andu = u(x, y, t), v = v(x, y, t) andx = x(t), y = y(t). Then the expression fordz/dt has
(a) Three terms (b) Four terms (c) Six terms(d) Seven terms (e) Nine terms (f) None of the above
ANSWER:By the chain rule,
dz
dt= guuxx′ + guuyy′ + guut + gvvxx′ + gvvyy′ + gvvt.
Thus, the answer is (c).
3. Lets = f(x, y, z) andx = x(u, v, w), y = y(u, v, w), z = z(u, v, w). To calculate∂s
∂u(1, 2, 3), which of the following
pieces of data do younot need?
(a) f(1, 2, 3) = 5 (b) f(7, 8, 9) = 6 (c) x(1, 2, 3) = 7(d) y(1, 2, 3) = 8 (e) z(1, 2, 3) = 9 (f) fx(1, 2, 3) = 20(g) fx(7, 8, 9) = 30 (h) xu(1, 2, 3) = −5 (i) xu(7, 8, 9) = −7
ANSWER:Since we evaluate∂s/∂u at (1, 2, 3), we are working atu = 1, v = 2, w = 3. We need the corresponding values
of x, y, z which arex = 7, y = 8, z = 9. In the formula for the chain rule, the partial derivatives of f are evaluatedat (7, 8, 9), and the partial derivatives ofx, y, z are evaluated at(1, 2, 3). Thus, we need (c), (d), (e), (g), and (h), butnot (a), (b), (f), (i).

258 CHAPTER FOURTEEN Hughes Hallett et al c©2005, John Wiley & Sons
ConcepTests and Answers and Comments for Section 14.7
1. Figure 14.13 shows level curves off(x, y). What are the signs offxx(P ) andfyy(P )?
−5 5
−5
5
P
2
3
4
f(x, y)
x
y
Figure 14.13
ANSWER:Sincefx is positive and increasing atP , we havefxx(P ) > 0. Sincefy is negative, but getting less negative atP ,
we havefyy(P ) > 0. However,fy is changing very slowly, so it would also be reasonable to sayfyy(P ) ≈ 0.COMMENT:As an extension, ask students to find the sign offxy(P ).
2. Figure 14.14 shows level curves off(x, y). What are the signs offxx(Q) andfyy(Q)?
−5 5
−5
5
Q
7
6
5
f(x, y)
x
y
Figure 14.14
ANSWER:Sincefx is positive and decreasing atQ, we havefxx(Q) < 0. Sincefy is positive and decreasing atQ, we have
fyy(Q) < 0. However,fy is changing very slowly, so it would also be reasonable to sayfyy(Q) ≈ 0.COMMENT:As an extension, ask students to find the sign offxy(Q).
CHAPTER FOURTEEN Hughes Hallett et al c©2009, John Wiley & Sons 259
3. Figure 14.15 shows the surfacez = f(x, y). What are the signs offxx(A) andfyy(A)?
x
y
z
A
Figure 14.15
ANSWER:Sincefx(A) is positive and decreasing as we move in the direction of increasingx, we havefxx(A) < 0. Since
fy(A) is negative and decreasing as we move in the direction of increasingy, we havefyy(A) < 0.COMMENT:Ask students to think about the sign offxy(A).
4. Figure 14.16 shows the surfacez = f(x, y). What are the signs offxx(P ) andfyy(P )?
x
y
z
?
P
Figure 14.16
ANSWER:Sincefx(P ) is decreasing in thex-direction,fxx(P ) < 0. Sincefy(P ) is increasing in they-direction,fyy(P ) > 0.

260 CHAPTER FOURTEEN Hughes Hallett et al c©2005, John Wiley & Sons
5. Figure 14.17 shows the temperatureT ◦C as a function of distancex in meters along a wall and timet in minutes. Choosethe correct statement and explain your choice without computing these partial derivatives.
(a)∂T
∂t(t, 10) < 0 and
∂2T
∂t2(t, 10) < 0. (b)
∂T
∂t(t, 10) > 0 and
∂2T
∂t2(t, 10) > 0.
(c)∂T
∂t(t, 10) > 0 and
∂2T
∂t2(t, 10) < 0. (d)
∂T
∂t(t, 10) < 0 and
∂2T
∂t2(t, 10) > 0.
5 10 15 20 25 30
10
20
30
40
50
60
x (meters)30
25
20
15
10
t (minutes)
Figure 14.17
ANSWER:(c). From the graph of the contour lines, we can see that alongthe linex = 10, the temperatureT is increasing, thus
∂T
∂t(t, 10) > 0. Since the distance between the contour lines is increasingas time increases along the linex = 10, the
rate of change of∂T
∂t(t, 10) is decreasing, so
∂2T
∂t2(t, 10) < 0.

CHAPTER FOURTEEN Hughes Hallett et al c©2009, John Wiley & Sons 261
6. The quadratic Taylor Polynomials (a)–(d) each approximate a function of two variables near the origin. Figures (I)–(IV)are contours near the origin. Match (a)–(d) to (I)–(IV).
(a) −x2 + y2 (b) x2 − y2 (c) −x2 − y2 (d) x2 + y2
4
4
2
2
6
6
8
8
(I)
0
00
0
2
4
2
4
−
2
−
4
−2
−
4
(II)
−
4
−
4
−
2
−
2
−
6
−
6
−
8
−
8
(III)
0
00
0
−
2 −
4
−
2
−4
2
4
2
4
(IV)
ANSWER:
(a) corresponds to (IV).(b) corresponds to (II).(c) corresponds to (III).(d) corresponds to (I).

262 CHAPTER FOURTEEN Hughes Hallett et al c©2005, John Wiley & Sons
ConcepTests and Answers and Comments for Section 14.8
1. Which of the following functionsf(x, y) is differentiable at the given point?
(a)√
1− x2 − y2 at (0, 0) (b)√
4− x2 − y2 at (2, 0)
(c) −√
x2 + 2y2 at (0, 0) (d) −√
x2 + 2y2 at (2, 0)
ANSWER:
(a) Differentiable; point is at top of hemisphere.(b) Not differentiable; hemisphere vertical at this point.(c) Not differentiable; top point of cone with ellipse-shaped cross-section.(d) Differentiable; point on side of cone.

Chapter Fifteen
Chapter Fifteen

264 CHAPTER FIFTEEN Hughes Hallett et al c©2005, John Wiley & Sons
ConcepTests and Answers and Comments for Section 15.1
Problems 1–3 refer to the functionsf(x, y):
(a) x2 + 2y3 (b) x2y + 4xy + 4y(c) x2y3 − x4 + 2y (d) x cos y
1. Which of these functions has a critical point at the origin?ANSWER:(a). Taking partial derivatives givesfx = 2x andfy = 6y2, sox = 0 andy = 0 give a critical point. The other
functions do not have a critical point at the origin.
2. True or False? Function (b) has a local maximum at the origin.ANSWER:False. Sincefy(0, 0) = 4, the origin is not a critical point off , so it cannot be a local maximum.
3. Which of the functions does not have a critical point?ANSWER:(c). Taking partial derivatives givesfx = 2xy3 − 4x3 andfy = 3x2y2 + 2. Becausefy is always greater than or
equal to 2, there are no critical points.
Problems 4–7 refer to the functionsf(x, y) :
(a) x2 + 2x + 2y3 − y2 (b) x2y + xy(c) x2y2 − (1/2)x4 + 2y (d) x4y − 7y
4. Which of the functions has a critical point at the origin?ANSWER:(b). Taking partial derivatives givesfx = 2xy + y = (2x + 1)y andfy = x2 + x = (x + 1)x, sox = 0 andy = 0
give a critical point. The others do not have a critical pointat the origin.
5. True or false? For the function (b), the second derivativetest shows that critical point(0, 0) is a local maximum.ANSWER:False. Taking partial derivatives givesfxx = 2y, fyy = 0, andfxy = 2x + 1, so
D = (2 · 0) · 0− (2 · 0 + 1)2 = −1,
so the second derivative test tells us(0, 0) is a saddle point.
6. Which of these functions does not have a critical point with y = 0?ANSWER:(c). Taking partial derivatives givesfx = 2xy2− 2x3 = 2x(y2−x2) andfy = 2x2y + 2 = 2(x2y + 1). At critical
points, we needy2 = x2 andx2y = −1, soy3 = −1, or y = −1. Thus,x may equal either 1 or−1, so the only twocritical points are(1,−1) and(−1,−1).
7. Which of these functions does not have a critical point with x = −1?ANSWER:(d). Taking partial derivatives givesfx = 4x3y andfy = x4 − 7, so the two critical points arex = ±71/4, y = 0.

CHAPTER FIFTEEN Hughes Hallett et al c©2009, John Wiley & Sons 265
ConcepTests and Answers and Comments for Section 15.2
1. Estimate the global maximum and minimum of the functions whose level curves are in Figure 15.1. How many times doeseach occur?
(a) Max= 6, occurring once; min= −6, occurring once(b) Max= 6, occurring once; min= −6, occurring twice(c) Max= 6, occurring twice; min= −6, occurring twice(d) Max= 6, occurring three times; min= −6, occurring three times(e) None of the above
y
x
0
00
0
12
34
5
6
11
2
3
45
6
6
−1
−
1
−
2
−
3
−
4
−5
−6
−
1
−
2
−
3
−
4
−5
−6
−6
Figure 15.1
ANSWER:The global max is about 6, or slightly higher. It occurs threetimes, twice on the negativey-axis and once on the
positivey-axis. The global min is−6, or slightly lower. It occurs three times, twice on the positive x-axis and once on thenegativex-axis. The answer is (d).
2. What are the global maximum and minimum values off(x, y) = x2 + y2 on the triangular region in the first quadrantbounded byx + y = 2, x = 0, y = 0?
ANSWER:The minimum value ofx2 + y2 occurs at the origin, so the minimum is 0. The maximum occurs at the other two
corners of the triangle, so at(2, 0) and(0, 2); the maximum value is 4.COMMENT:As an extension, ask for the global maximum and minimum on thehypotenuse of the triangle. Then, the maximum
remains the same, but the minimum becomes 2. This question can be used as a lead-in to Lagrange multipliers.

266 CHAPTER FIFTEEN Hughes Hallett et al c©2005, John Wiley & Sons
ConcepTests and Answers and Comments for Section 15.3
For Problems 1–2, use Figure 15.2. The grid lines are one unitapart.
f =1
f =2
f =3
f =4
f =5
g = c
f = 0
x
y
Figure 15.2
1. Find the maximum and minimum values off ong = c. At which points do they occur?ANSWER:The maximum isf = 4 and occurs at(0, 4). The minimum isf = 2 and occurs at about(4, 2).
2. Find the maximum and minimum values off on the triangular region belowg = c in the first quadrant.ANSWER:The maximum isf = 4 and occurs at(0, 4). The minimum isf = 0 and occurs at the origin.

CHAPTER FIFTEEN Hughes Hallett et al c©2009, John Wiley & Sons 267
Problems 3–4 concern the following:
(a) Maximizex2y2 subject tox2 + y2 = 4.
(b) Maximizex + y subject tox2 + y2 = 4.
(c) Minimizex2 + y2 subject tox2y2 = 4.
(d) Maximizex2y2 subject tox + y = 4.
3. Which one of (a)–(d) does not have its solution at the same point in the first quadrant as the others?ANSWER:The answer is (d).
(a) We solve
2xy2 = 2xλ
2x2y = 2yλ
x2 + y2 = 4,
giving x2 = y2, so2x2 = 4, so (since we are working in the first quadrant)x = y =√
2.(b) We solve
1 = 2xλ
1 = 2yλ
x2 + y2 = 4,
giving x = y, so2x2 = 4, so (since we are working in the first quadrant)x = y =√
2.(c) We solve
2x = 2xy2λ
2y = 2x2yλ
x2y2 = 4,
giving x2 = y2, so(x2)2 = 4, so (since we are working in the first quadrant)x = y =√
2.(d) We solve
2xy2 = λ
2x2y = λ
x + y = 4.
Dividing the first two equations givesx = y, so (since we are working in the first quadrant)x = y = 2.
Thus, (a), (b), and (c) have their solution atx = y =√
2, and (d) has its solution at a different point, namelyx = y = 2.
4. Which two of (a)–(d) have the same extreme value of the objective function in the first quadrant?ANSWER:
(a) We havef(√
2,√
2) = (√
2)2(√
2)2 = 4.(b) We havef(
√2,√
2) =√
2 +√
2 = 2√
2.(c) We havef(
√2,√
2) = (√
2)2 + (√
2)2 = 4.(d) We havef(2, 2) = 22 · 22 = 16.
Thus, (a) and (c) have the same extreme value.

268 CHAPTER FIFTEEN Hughes Hallett et al c©2005, John Wiley & Sons
5. Find the maximum of the production functionf(x, y) = xy in the first quadrant subject to each of the three budgetconstraints.
I. x + y = 12 II. 2x + 5y = 12 III. 3x + y/2 = 12
Arrange thex- andy-coordinates of the optimal point in increasing order. Pickone of (a)–(e) and one of (f)–(j).(a) x: I < II < III(b) x: III < II < I(c) x: II < III < I(d) x: II < I < III(e) x: III < I < II
(f) y: I < II < III(g) y: III < II < I(h) y: II < III < I(i) y: II < I < III(j) y: III < I < II
ANSWER:For (I), we have
y = λ
x = λ
x + y = 12,
sox = y and the solution isx = 6, y = 6.For (II), we have
y = 2λ
x = 5λ
2x + 5y = 12,
so2x = 5y, and the solution isx = 3, y = 1.2.For (III), we have
y = 3λ
x = λ/2
3x + y/2 = 12,
so3x = y/2, and the solution isx = 2, y = 12.Thus, forx: III <II<I
for y: II<I<IIIThe answer is (b) and (i).

CHAPTER FIFTEEN Hughes Hallett et al c©2009, John Wiley & Sons 269
6. The pointP is a maximum or minimum of the functionf subject to the constraintg(x, y) = x + y = c, with x, y ≥ 0.For the graphs (a) and (b), doesP give a maximum or a minimum off? What is the sign ofλ? If P gives a maximum,where does the minimum off occur? IfP gives a minimum, where does the maximum off occur?
x
y
� f = 3� f = 2
� f = 1
g(x, y) = c -
P
(a)
x
y
� f = 1� f = 2
� f = 3
g(x, y) = c -
P
(b)
ANSWER:
(a) The pointP gives a minimum; the maximum is at one of the end points of the line segment (either thex- or they-intercept). The value ofλ is negative, sincef decreases in the direction in whichg increases.
(b) The pointP gives a maximum; the minimum is at thex- or y-intercept. The value ofλ is positive, sincef andgincrease in the same direction.
7. Figure 15.3 shows the optimal point (marked with a dot) in three optimization problems with the same constraint. Arrangethe corresponding values ofλ in increasing order. (Assumeλ is positive.)
(a) I<II<III (b) II <III <I (c) III <II<I (d) I<III <II
f = 3f = 2f = 1x
y(I)
?
f = 3
f = 2
� f = 1x
y(II)
?
f = 3
f = 2
� f = 1x
y(III)
Figure 15.3
ANSWER:Sinceλ is the additionalf that is obtained by relaxing the constraint by 1 unit,λ is larger if the level curves off are
close together near the optimal point. The answer is I<II<III, so (a).

270 CHAPTER FIFTEEN Hughes Hallett et al c©2005, John Wiley & Sons

Chapter Sixteen
Chapter Sixteen

272 CHAPTER SIXTEEN Hughes Hallett et al c©2005, John Wiley & Sons
ConcepTests and Answers and Comments for Section 16.1
1. LetR be the region0 ≤ x ≤ 20, 0 ≤ y ≤ 40. The functionf(x, y) represents the performance index of a machine; itsvalues range from 0 to 1. Use the grid in Figure 16.1, which is acontour map off , to make upper and lower estimates of
I =
∫
R
f(x, y) dA.
−10 0 10 20 30 400
20
40
60
80
100
x
y
0.9
0.80.70.60.5
0.30.1
Figure 16.1
ANSWER:The grid has∆x = 10, ∆y = 20.
Lower estimate= (0.5 + 0.8 + 0.4 + 0.7)10 · 20 = 480
Upper estimate= (0.8 + 0.8 + 1 + 1)10 · 20 = 720
Many other answers are possible.
Problems 2–3 concern the integrals
(a)∫
Rx dA (b)
∫
Ry dA (c)
∫
Ty dA (d)
∫
R(x− x2) dA
(e)∫
T(y − y2)A (f)
∫
L(x2 − x) dA (g)
∫
L(y + y3) dA (h)
∫
R(2x + 3y) dA
HereR is the rectangle−1 ≤ x ≤ 1, −1 ≤ y ≤ 1, andT is the top half−1 ≤ x ≤ 1, 0 ≤ y ≤ 1, andL the left half−1 ≤ x ≤ 0,−1 ≤ y ≤ 1.
2. Without evaluating them, decide which of the integrals are positive, which are negative, and which are zero.ANSWER:Positive: (c), (e), (f)
Negative: (d), (g)Zero: (a), (b), (h)
3. Without evaluating them, arrange the integrals (a), (c),(e), (f) in ascending order.ANSWER:By symmetry, (a)=
∫
Rx dA = 0.
Since the region of integration,T , is the same in (c) and (e), and since0 ≤ y2 ≤ y for 0 ≤ y ≤ 1, we see that0 ≤ y − y2 ≤ y for points inT . Thus
∫
T
(y − y2) dA <
∫
T
y dA, so (e)< (c).
For (f), the region of integration isL, where−1 ≤ x ≤ 0, sox2 − x ≥ 0. Since bothx2 and−x are positive onL,we have
∫
L
−x dA ≤∫
L
(x2 − x) dA.
But∫
L−x dA =
∫
Ty dA, so (c)<(f). Putting these results together, we have
(a) < (e) < (c) < (f).

CHAPTER SIXTEEN Hughes Hallett et al c©2009, John Wiley & Sons 273
4. Let R be the region10 ≤ x ≤ 14, 20 ≤ y ≤ 30. Table 16.1 gives values off(x, y). Using upper and lower Riemannsums, what are the best possible upper and lower estimates for the integral
I =
∫
R
f(x, y) dx dy.
(a) 23 < I < 990 (b) 92 < I < 300 (c) 160 < I < 396(d) 160 < I < 300 (e) 92 < I < 396
Table 16.1
x
y
20 25 30
10 2.3 4.2 7.3
12 3.7 5.8 8.1
14 4.3 6.2 9.9
ANSWER:(d). The function appears to be increasing inx and iny, so since∆x∆y = 2 · 5 = 10
Lower estimate= (2.3 + 3.7 + 4.2 + 5.8)∆x∆y = 16 · 10 = 160.
Upper estimate= (5.8 + 6.2 + 8.1 + 9.9)∆x∆y = 30 · 10 = 300.
So160 ≤ I ≤ 300.
ConcepTests and Answers and Comments for Section 16.2
1. The integral∫ 1
0
∫ 1
0x2 dx dy represents the
(a) Area under the curvey = x2 betweenx = 0 andx = 1.(b) Volume under the surfacez = x2 above the square0 ≤ x, y ≤ 1 on thexy-plane.(c) Area under the curvey = x2 above the square0 ≤ x, y ≤ 1 on thexy-plane.
ANSWER:(b). The volume under the surfacez = x2 above the square0 ≤ x, y ≤ 1 on thexy-plane.COMMENT:Students may think that any integral represents an area.
2. The integral∫ 1
0
∫ 1
xdy dx represents the
(a) Area of a triangular region in thexy-plane.(b) Volume under the planez = 1 above a triangular region of the plane.(c) Area of a square in thexy-plane.
ANSWER:(a) and (b) are both right.COMMENT:Students may think that an integral can only have one interpretation.
3. Letf(x, y) be a positive function. Rank the following integrals from smallest to largest.
(a)∫ 1
0
∫ 1
x2 f(x, y) dy dx,
(b)∫ 1
0
∫ 1
x3 f(x, y) dy dx,
(c)∫ 1
0
∫ 1
0f(x, y) dy dx.
ANSWER:(a) is smaller than (b) which is smaller than (c). Since the regions are nested and the integrands are the same and
positive, the only thing that matters is the size of the region we integrate over.

274 CHAPTER SIXTEEN Hughes Hallett et al c©2005, John Wiley & Sons
4. Match the integral with the appropriate region of integration.
(a) R1 : The triangle with vertices(0, 0), (2, 0), (0, 1).(b) R2 : The triangle with vertices(0, 0), (0, 2), (1, 0).(c) R3 : The triangle with vertices(0, 0), (2, 0), (2, 1).(d) R4 : The triangle with vertices(0, 0), (1, 0), (1, 2).
(i)∫ 1
0
∫ 2−2x
0f(x, y) dy dx
(ii)∫ 1
0
∫ 2−2y
0f(x, y) dx dy
(iii)∫ 1
0
∫ 2x
0f(x, y) dy dx
(iv)∫ 1
0
∫ 2
2yf(x, y) dx dy
ANSWER:(a) and (ii); (b) and (i); (c) and (iv); (d) and (iii)COMMENT:Follow-up Question. Write each integral with the order of integration reversed.
5. Which of the following integrals is (are) equal to∫ 3
0
∫ 4x
0f(x, y) dy dx?
(a)∫ 4x
0
∫ 3
0f(x, y) dx dy
(b)∫ 12
0
∫ 3
y/4f(x, y) dx dy
(c)∫ 12
0
∫ y/4
3f(x, y) dx dy
(d)∫ 12
0
∫ y/4
0f(x, y) dx dy
(e)∫ 4x
0
∫ 3
0f(x, y) dy dx
ANSWER:(b)
∫ 12
0
∫ 3
y/4f(x, y) dx dy
COMMENT:Follow-up Question. Which of these integrals don’t make sense?
ConcepTests and Answers and Comments for Section 16.3
1. What does the integral∫ 1
0
∫ 1
0
∫ 1
0z dz dy dx represent?
(a) The volume of a cube of side 1.(b) The volume of a sphere of radius 1.(c) The area of a square of side 1.(d) None of the above.
ANSWER:(d) None of the above.COMMENT:Follow-up Question. What could it represent?
2. Set up a single, double, and triple integral, each of whichgives the volume of the region under the planez = x and abovethe rectangle0 ≤ x ≤ 1, 0 ≤ y ≤ 2. Explain what each integrand represents.
ANSWER:∫ 1
02x dx; here,2x is the area of a rectangular cross section of the three dimensional region parallel to theyz-plane.
Then,2x dx is the volume of a slab parallel to theyz-plane, but only infinitesimally thick in thex-direction.∫ 1
0
∫ 2
0x dy dx; herex is the length of a vertical line segment from the bottom to thetop of the region. Then,x dy dx
is the volume of a vertical column that is infinitesimally wide in thex- andy-directions.∫ 1
0
∫ 2
0
∫ x
0dz dy dx, here the entire region is described by the limits of integration. Then,dz dy dx represents the
volume of an infinitesimal box anywhere in the region.COMMENT:If you start with the triple integral, the other integrals are stages of the iterative solution.

CHAPTER SIXTEEN Hughes Hallett et al c©2009, John Wiley & Sons 275
3. For each integral (a)–(d) that makes sense, match it with its region of integration, I or II.
(a)∫ 3
1
∫ 2
y−1
∫ y
0f(x, y, z) dz dx dy
(b)∫ 3
1
∫ y
0
∫ y−1
2f(x, y, z) dx dy dz
(c)∫ 1
−1
∫
√1−x2
−√
1−x2
∫
√1−x2−y2
0f(x, y, z) dz dy dx
(d)∫ 1
−1
∫
√1−y2
−√
1−y2
∫
√1−x2−y2
0f(x, y, z) dz dx dy
I The region below the planez = y above the triangle with vertices(0, 1), (2, 1), (2, 3) in thexy-plane.II The region between the upper hemisphere ofx2 + y2 + z2 = 1 and thexy-plane.
ANSWER:I is the region of integration of the first integral, (a).II is the region of integration for the last two integrals, (c) and (d).COMMENT:Follow-up Question. What is wrong with the second integral?
4. Which of the following integrals is (are) equal to∫ 3
0
∫ 2
0
∫ y
0f(x, y, z) dz dy dx?
(a)∫ 2
0
∫ 3
0
∫ y
0f(x, y, z) dz dx dy
(b)∫ 2
0
∫ 3
0
∫ y
0f(x, y, z) dz dy dx
(c)∫ 3
0
∫ 2
0
∫ y
0f(x, y, z) dx dy dz
(d)∫ 3
0
∫ 2
0
∫ 2
zf(x, y, z) dy dz dx
(e)∫ 3
0
∫ 2
0
∫ z
0f(x, y, z) dy dz dx
ANSWER:(a)
∫ 2
0
∫ 3
0
∫ y
0f(x, y, z) dz dx dy and (d)
∫ 3
0
∫ 2
0
∫ 2
zf(x, y, z) dy dz dx
COMMENT:Follow-up Question. What is the region of integration of the other integrals?
5.∫ 1
−1
∫
√1−x2
−√
1−x2
∫
√1−x2−y2
−√
1−x2−y2(x2 + y2 + z2) dz dy dx describes the mass of
(a) A cone that gets heavier toward the outside.(b) A cone that gets lighter toward the outside.(c) A ball that gets heavier toward the outside.(d) A ball that gets lighter toward the outside.
ANSWER:(c) A ball that gets heavier toward the outside.COMMENT:Follow-up Question. How would the integral have to change to represent each of theother choices?
ConcepTests and Answers and Comments for Section 16.4
1. What geometric shape (i)–(iv) is described by the equations in (a)–(f)?
(i) line (ii) circle (iii) spiral (iv) none of the above
(a) r = θ (b) r = 4 (c) θ = 4(d) r = 1/θ (e) r = sin θ (f) r = 1/sin θ
ANSWER:
(a) is (iii), spiral(b) is (ii), circle(c) is (i), line(d) is (iii), spiral(e) is (ii), circle(f) is (i), line
COMMENT:Follow-up Question. How do the two lines, the two spirals, and the two circles differ?

276 CHAPTER SIXTEEN Hughes Hallett et al c©2005, John Wiley & Sons
2. Describe each of the following regions in words:
(a) 0 ≤ r ≤ 2, 0 ≤ θ ≤ 2π(b) 0 ≤ r <∞, 0 ≤ θ ≤ π(c) 0 ≤ r ≤ θ, 0 ≤ θ ≤ π(d) 2 ≤ r ≤ 4, π ≤ θ ≤ 3π/2
ANSWER:
(a) Disk of radius 2, centered at the origin.(b) Upper half ofxy-plane.(c) Region in the upper half plane beneath the first half-turnof the spiralr = θ, θ ≥ 0.(d) Sector of an annulus in the third quadrant.
COMMENT:Follow-up Question. Set up integrals that compute the areas of each region.
3. Which of the following integrals give the area of the unit circle?
(a)∫ 1
−1
∫
√1−x2
−√
1−x2dy dx
(b)∫ 1
−1
∫
√1−x2
−√
1−x2x dy dx
(c)∫ 2π
0
∫ 1
0r dr dθ
(d)∫ 2π
0
∫ 1
0dr dθ
(e)∫ 1
0
∫ 2π
0r dθ dr
(f)∫ 1
0
∫ 2π
0dθ dr
ANSWER:(a), (c), (e)COMMENT:Follow-up Question. Where does ther in the correct polar integrals come from?
4. Describe the region of integration for∫ π/2
π/4
∫ 4/ sin θ
1/ sin θf(r, θ)r dr dθ.
ANSWER:The region lies in the first quadrant and is bounded by four lines. The equationsr = 1/sin θ andr = 4/sin θ are
the horizontal linesy = r sin θ = 1 andy = r sin θ = 4. The equationθ = π/4 gives the liney = x, and the equationθ = π/2 gives they-axis.
COMMENT:Follow-up Question. Rewrite the integral in Cartesian coordinates.
ConcepTests and Answers and Comments for Section 16.5
1. Each of the following, (a)–(f), represents a point, a curve, a surface, or a solid region in cylindrical or spherical coordinates.Decide which it represents and describe the region in words.
(a) 0 ≤ ρ <∞, θ = π, 0 ≤ φ ≤ π(b) r = 3, 0 ≤ θ ≤ 2π, −∞ < z <∞(c) r = 3, θ = π
2, −∞ < z <∞
(d) 1 ≤ r ≤ 4, 0 ≤ θ ≤ 2π, −5 ≤ z ≤ 2(e) 1 ≤ ρ ≤ 4, 0 ≤ θ ≤ 2π, 0 ≤ φ ≤ π(f) ρ = 1, θ = 3, φ = 2
ANSWER:
(a) Surface. This is the half-planey = 0, x ≤ 0, which is vertical and perpendicular to they-axis.(b) Surface of the cylinder of radius 3 centered on thez-axis.(c) Line, parallel to thez-axis, withx = 0, y = 3.(d) Solid region. A solid cylinder of radius 4, centered onz-axis fromz = −5 to z = 2, with the central cylindrical core
core of radius 1 removed.(e) Solid region. A solid ball of radius 4, centered at the origin, with the smaller ball of radius 1 removed from its interior.(f) Point (−0.90, 0.13,−0.42), sincex = cos 3 sin 2 = −0.90, y = sin 3 sin 2 = 0.13, z = cos 2 = −0.42.
COMMENT:Follow-up Question. Can you describe the objects in another coordinate system?

CHAPTER SIXTEEN Hughes Hallett et al c©2009, John Wiley & Sons 277
2. Describe the region of integration of∫ 2
0
∫ π/4
−π/4
∫ 3
0f(r, θ, z)r dr dθ dz.
ANSWER:The region is a90◦ wedge of a solid cylinder of radius 3 and height 2, centered around thez-axis, sitting on the plane
z = 0. Laterally, the wedge is bounded by the vertical planesθ = −π/4 andθ = π/4. The edge of the wedge is on thez-axis.
COMMENT:Follow-up Question. Why do you want to use cylindrical coordinates to describe this region?
3. Which of the following integrals give the volume of the unit sphere?
(a)∫ 2π
0
∫ 2π
0
∫ 1
0dρ dθ dφ
(b)∫ π
0
∫ 2π
0
∫ 1
0dρ dθ dφ
(c)∫ π
0
∫ 2π
0
∫ 1
0ρ2 sin φ dρ dθ dφ
(d)∫ π
0
∫ 2π
0
∫ 1
0ρ2 sin φ dρ dφ dθ
(e)∫ π
0
∫ 2π
0
∫ 1
0ρ dρ dφ dθ
ANSWER:(c)
∫ π
0
∫ 2π
0
∫ 1
0ρ2 sin φ dρ dθ dφ
COMMENT:Follow-up Question. Why are spherical coordinates called spherical coordinates?
ConcepTests and Answers and Comments for Section 16.6
For Problems 1–7, letp(x, y) be a joint density function forx andy. Are the following statements true or false?
1.
∫ b
a
∫ ∞
−∞p(x, y) dy dx is the probability thata ≤ x ≤ b.
ANSWER:True
2. 0 ≤ p(x, y) ≤ 1 for all x.ANSWER:False
3. 0 ≤∫ ∞
−∞p(x, y) dy ≤ 1 for all x.
ANSWER:False
4.
∫ b
a
p(x, y) dx is the probability thata ≤ x ≤ b.
ANSWER:False
5. p(a, b) is the probability thatx = a andy = b.ANSWER:False
6.
∫ ∞
−∞
∫ ∞
−∞p(x, y) dy dx = 1.
ANSWER:True
7. limT→∞
∫ ∞
−∞
∫ T
−∞p(x, y) dy dx = 1.
ANSWER:True

278 CHAPTER SIXTEEN Hughes Hallett et al c©2005, John Wiley & Sons
ConcepTests and Answers and Comments for Section 16.7
In Problems 1–2, consider a change of variable in the integral∫
Rf(x, y) dA from x, y to s, t. Are the following statements true
or false?
1. If the Jacobian
∣
∣
∣
∣
∂(x, y)
∂(s, t)
∣
∣
∣
∣
> 1, the value of thes, t-integral is greater than the originalx, y-integral.
ANSWER:False. The change of variable leaves the value of the integral unchanged. Thus, calculating the value of thes, t-
integral gives you the value of thex, y-integral.
2. The Jacobian cannot be negative.ANSWER:False. The Jacobian can be negative; we use the absolute value of the Jacobian in the integral.

Chapter Seventeen
Chapter Seventeen

280 CHAPTER SEVENTEEN Hughes Hallett et al c©2005, John Wiley & Sons
ConcepTests and Answers and Comments for Section 17.1
1. Which of the following parameterizations describes the quarter circle in Figure 17.1?
(a) (cos t, sin t), 0 ≤ t ≤ π2
(b) (sin t, cos t), 0 ≤ t ≤ π2
(c) (− cos t, sin t), π2≤ t ≤ π (d) (cos t,− sin t), 3π
2≤ t ≤ 2π
1
1
x
y
Figure 17.1
ANSWER:(b), (c), (d). All except the first parameterization trace the given quarter circle.COMMENT:Students need practice with parameterizations of the unit circle, or any other curve. There are infinitely many different
parameterizations of any given curve.
2. Let(cos at, sin at) be the position at timet seconds of a particle moving around a circle, wherea > 0. If a is increased,
(a) The radius of the circle increases. (b) The speed of the particle increases.(c) The center of the circle changes. (d) The path ceases to bea circle.
ANSWER:(b) The speed of the particle increases. Asa increases, it takes less time for the particle to complete one revolution,
thus the speed increases.COMMENT:Follow-up Questions. What has to happen to decrease the speed? How can you modify the formulas to change the
radius and the center of the circle? To make the particle circle in the opposite direction?
3. Let(a cos t, a sin t) be the position at timet seconds of a particle moving around a circle, wherea > 0. If a is increased,
(a) The radius of the circle increases. (b) The speed of the particle decreases.(c) The center of the circle changes. (d) The path ceases to bea circle.
ANSWER:(a) The radius of the circle increases.COMMENT:Follow-up Questions. What has to happen to decreases the radius? How can you modifythe parameterization to
change the speed of the particle and the center of the circle?
4. Which of the following parametric curves trace out the unit circle (possibly more than once)?
(a) (cos t, sin t), 0 ≤ t ≤ 2π(b) (sin2 t, cos2 t), 0 ≤ t ≤ 2π(c) (sin(t2), cos(t2)), 0 ≤ t ≤ 2π(d) (sin 2t, cos 2t), 0 ≤ t ≤ 2π
ANSWER:(a), (c), (d). All parametric curves except the second one trace the unit circle.COMMENT:Follow-up Questions. How do the parametric curves differ? How would a particle move along each of the curves?
What does (b) look like?

CHAPTER SEVENTEEN Hughes Hallett et al c©2009, John Wiley & Sons 281
5. Which of the following parametric paths describe particles that are traveling along a straight line in 3-space?
(a) (1− t, 2 + 2t, 3− t)(b) (1− t2, 2 + 2t2, 3− t2)(c) (1, 2, 1− t)(d) (1, t, 1− t2)
ANSWER:(a), (b), (c). All except the last particle move along straight lines.COMMENT:It is easy to think that if parameterization involvest2, the path cannot be a line. But in (b) we could make a change
of variables = t2 and see that the particle still moves along a straight line. For (b): What happens to the particle astincreases from negative to positive?
6. The value ofc for which the linesl(t) = (c + 4t, 2− t, 3 + t) andm(t) = (4t, 1− 8t, 4 + 4t) intersect is
(a) 4(b) 0(c) −4(d) There is no suchc
ANSWER:The two parameters,t, in l(t) and m(t), represent different quantities, so we will call the secondone s. Thus
m(s) = (4s, 1− 8s, 4 + 4s). The lines intersect if
c + 4t = 4s
2− t = 1− 8s
3 + t = 4 + 4s.
Solving the last two equations givest = 1 ands = 0. Substituting into the first equation givesc = −4. Thus (c) isthe correct answer.
COMMENT:Two particles traveling along the lines with the given motions do not collide, but their paths cross ifc = −4. Follow-
up Questions. At what point in space do the paths cross? At what time does each of the particles reach the crossing?
ConcepTests and Answers and Comments for Section 17.2
1. Let~a and~v be the acceleration and velocity of a particle. Describe themotion of a particle such that
(a) ~a and~v are parallel and point in the same direction.(b) ~a and~v are parallel and point in opposite directions.(c) ~a and~v are perpendicular.(d) ||~a || and||~v || are constant.
ANSWER:Examples are:
(a) A particle moves along a straight line speeding up.(b) A particle moves along a straight line slowing down.(c) A particle moves around a circle at a constant speed.(d) A particle moves around a circle at a constant speed.
Other answers are possibleCOMMENT:For part (d) the easiest situation is given when~a and~v are both the zero vector—the particle is not moving at all.

282 CHAPTER SEVENTEEN Hughes Hallett et al c©2005, John Wiley & Sons
2. A car is moving on the race track in Figure 17.2. The car is going at constant speed as fast as possible without flying offthe track. Let~a be the acceleration of the car and~v the velocity of the car. Mark points on the track where
(a) ~a · ~v = 0.(b) ~a · ~v > 0.(c) ~a · ~v < 0.
Figure 17.2
ANSWER:
(a) ~a and~v are perpendicular at the leftmost and rightmost points on the track. At the midpoint of the straightaway, theacceleration is the zero vector.
(b) Going into the straightaway (coming out of the tight curve), the angle between the two vectors is less thanπ2
.(c) Going into the tight curve the angle between the two vectors is larger thanπ
2.
COMMENT:There are two very different sets of points where the dot product of the two vectors is zero. Discuss what is happening
at those points. The acceleration vector is opposite the direction in which the driver feels pressed against the seat or doorsof the race car. Some students may be able to solve this problem by vividly imagining themselves at the wheel during arace.
3. Are the following statements about a particle moving through space true or false? Give a counterexample to false state-ments.
(a) If the velocity of a particle is zero, then its speed is zero.(b) If the speed of a particle is zero, its velocity must be zero.(c) A particle that is not accelerating must have zero velocity.(d) A particle with constant speed must have zero acceleration.(e) A particle with zero acceleration must have constant speed.(f) A particle with constant velocity must have zero acceleration.(g) A particle with constant speed must have constant velocity.
ANSWER:
(a) True(b) True(c) False: A particle moving with constant speed along a straight line is not accelerating.(d) False: A particle moving with constant speed around a circle does not have zero acceleration.(e) True(f) True(g) False: A particle moving around a circle with constant speed has changing velocity since its direction changes.
COMMENT:If the particle is assumed to move in a straight line, some of the false statements would be true.

CHAPTER SEVENTEEN Hughes Hallett et al c©2009, John Wiley & Sons 283
ConcepTests and Answers and Comments for Section 17.3
In Problems 1–2, match the formulas (a)-(d) with the graphs of vector fields (I)-(IV). You do not need to find formulas forf , g,h, andk.
1. Match the formulas (a)–(d) with the graphs of vector fields(I)–(IV).
(a) f(x)~i(b) g(x)~j(c) h(y)~i(d) k(y)~j
(I) (II)
(III) (IV)
ANSWER:All vectors in the fieldsf(x)~i andh(y)~i point in the horizontal direction, since they are all multiples of the hori-
zontal vector~i . The graphs in (II) and (III) are the ones with horizontal vectors, but which is (a) and which is (c)? Sincethe length of the vectors in (II) changes wheny changes (moving upward in the graph) but not whenx changes (movinghorizontally), graph (II) must correspond to (c),h(y)~i . Thus (III) goes with (a),f(x)~i .
All vectors in the fieldsg(x)~j andk(y)~j point in the vertical direction, since they are all multiples of the verticalvector~j . The graphs in (I) and (IV) are the ones with vertical vectors. The length of the vectors in (I) changes whenxchanges but not wheny changes, so graph (I) must correspond to (b),g(x)~j . Thus (IV) goes with (d),k(y)~j .
The match-up is: a-III, b-I, c-II, d-IV.COMMENT:Students should be encouraged to read formulas for qualitative features.

284 CHAPTER SEVENTEEN Hughes Hallett et al c©2005, John Wiley & Sons
2. Match the formulas (a)–(d) with the graphs of vector fields(I)–(IV).
(a) f(x)~i + f(x)~j(b) g(x)~i − g(x)~j(c) h(y)~i + h(y)~j(d) k(y)~i − k(y)~j
(I) (II)
(III) (IV)
ANSWER:All vectors in the fieldsf(x)~i + f(x)~j = f(x)(~i + ~j ) andh(y)~i + h(y)~j = h(y)(~i + ~j ) point parallel to
~i +~j . The graphs in (II) and (III) are the ones with vectors parallel to~i +~j , but which is (a) and which is (c)? Since thelength of the vectors in (II) changes whenx changes (moving horizontally in the graph) but not wheny changes (movingvertically), graph (II) must correspond to (a),f(x)~i + f(x)~j . Thus (III) goes with (c),h(y)~i + h(y)~j .
All vectors in the fieldsg(x)~i − g(x)~j = g(x)(~i −~j ) andk(y)~i − k(y)~j = k(y)(~i −~j ) point parallel to~i −~j .The graphs in (I) and (IV) are the ones in this direction. The length of the vectors in (I) changes wheny changes but notwhenx changes, so graph (I) must correspond to (d),k(y)~i − k(y)~j . Thus (IV) goes with (b),g(x)~i − g(x)~j .
The match-up is: a-II, b-IV, c-III, d-I.

CHAPTER SEVENTEEN Hughes Hallett et al c©2009, John Wiley & Sons 285
3. Match the vector fields with the appropriate pictures.
(a) ~F 1(~r ) = ~r||~r ||
(b) ~F 2(~r ) = ~r(c) ~F 3(x, y) = y~i − x~j(d) ~F 4(x, y) = x~j
x
y(i)
x
y(ii)
x
y(iii) y
x
(iv)
ANSWER:(a) and (ii), (b) and (i), (c) and (iv), (d) and (iii)COMMENT:Process of elimination helps to do this problem.
4. For each of the vector fields in the plane,~F 1, ~F 2, ~F 3, decide which of the properties the vector field has:
~F 1(~r ) =~r
||~r ||~F 2(~r ) = −~r ~F 3(x, y) =
~i +~j
x2 + y2
A All vectors point toward the origin.B All vectors point away from the origin.C All vectors point in the same direction.D All vectors have the same length.E Vectors get longer away from the origin.F Vectors get shorter away from the origin.G The vector field has rotational symmetry about the origin.H Vectors that start on the same circle centered at the originhave the same length.
ANSWER:~F 1 : B, D, G, H~F 2 : A, E, G, H~F 3 : C, F, H
COMMENT:~F 3 is the most interesting of the vector fields. All vectors points northeast, and vectors on the same circle have
constant length.

286 CHAPTER SEVENTEEN Hughes Hallett et al c©2005, John Wiley & Sons
5. Compare and contrast the following vector fields:
~F 1(~r ) =~r
||~r ||~F 2(~r ) = ~r ~F 3(~r ) = − ~r
||~r ||2
ANSWER:~F 1 and ~F 2 look very similar, vectors point away from the origin. The only difference is that in~F 1 all vectors have
length 1, and in~F 2 vectors get longer as they move away from the origin. In~F 3 vectors point toward the origin and getshorter the farther away from the origin they are.
COMMENT:Vector fields of this form are used frequently for line and fluxintegrals. It is an advantage to be able to visualize
them.
6. Figure 17.3 shows the vector field~F = grad f . Which of the following are possible choices forf(x, y)?
(a) x2
(b) −x2
(c) −2x(d) −y2
Figure 17.3
ANSWER:(b),−x2, sincegrad(−x2) = −2x~i , which is parallel to thex axis and points toward they-axis. (a) is not possible
because its gradient points away from they-axis, and (c) is not possible because its gradient is the constant vector−2~i .(d) is not possible because its gradient is parallel to they-axis.
COMMENT:Ask students for other possible functions whose gradient isthe vector field shown.
7. Rank the length of the gradient vectors at the points marked on the contour plot in Figure 17.4.
1
7
5
3
x
y
Figure 17.4
ANSWER:All vectors point radially outward. Vectors on the contourz = 7 are longer than vectors on the contourz = 3 which
are longer than vectors on the contourz = 1.COMMENT:While the exact direction and length of the vectors is not that important in this problem, a qualitative comparison of
their lengths is.

CHAPTER SEVENTEEN Hughes Hallett et al c©2009, John Wiley & Sons 287
ConcepTests and Answers and Comments for Section 17.4
1. Which parameterized curve is not a flow line of the vector field ~F = x~i + y~j ?
(a) ~r (t) = et~i + et~j(b) ~r (t) = et~i + 2et~j(c) ~r (t) = 3et~i + 3et~j(d) ~r (t) = 2et~i + e2t~j
ANSWER:(d) The flow lines~r (t) = x(t)~i + y(t)~j solve the differential equationsdx/dt = x, dy/dt = y. The solutions are
all of the formx = aet andy = bet, so all but (d) are flow lines.COMMENT:How do the flow lines (a), (b), (c) for the vector field~F differ? Ask the students to describe the parameterized
curve in (d) (parabolic, on the parabolay = x2/4) or to find a vector field of which it is a flow line (for example,~F 1 = x~i + 2y~j ).
2. Which parameterized curves are flow lines of the vector field ~F = −y~i + x~j ?
(a) ~r (t) = cos t~i + sin t~j(b) ~r (t) = cos t~i − sin t~j(c) ~r (t) = sin t~i − cos t(d) ~r (t) = 2 cos t~i + 2 sin t~j
ANSWER:(a), (c), and (d) The flow lines~r (t) = x(t)~i + y(t)~j solve the system of differential equationsdx/dt = −y,
dy/dt = x. A direct check shows that only (b) fails to yield a solution.COMMENT:How do the flow lines (a), (c), and (d) for the vector field~F differ? Ask the students to describe the parameterized
curve in (b) (motion clockwise around a circle) or to find a vector field of which it is a flow line (for example,~F 1 =y~i − x~j ).
3. Match the vector fields (a)–(d) and flow lines I–IV.
(a) ~i + y~j(b) ~i + x2~j(c) x~i + x~j(d) y~i +~j
I. x = t, y = t3/3II. x = t2/2, y = tIII. x = et, y = et
IV. x = t, y = et
ANSWER:Match by substituting I–IV into~r ′(t) = ~F (~r (t)), where ~F is each of the vector fields; alternatively, solve the
differential equations. Then
(a) IV (b) I (c) III (d) II

288 CHAPTER SEVENTEEN Hughes Hallett et al c©2005, John Wiley & Sons
4. An object flowing in a vector field is at the point(1, 2) at timet = 5.00. Using one step of Euler’s method, match thevelocity fields~F i in (I)–(IV) with the approximate position of the object at timet = 5.01 given in (a)–(d).
(a) (1.02, 2)(b) (1.02, 2.01)(c) (1.01, 2)(d) (1.01, 2.02)
I. ~F 1 = x~i + y~jII. ~F 2 = y~i + x~jIII. ~F 3 = x~iIV. ~F 4 = y~i
ANSWER:Writing ~r (t) for the position vector of the object at timet, we have
~r (5.01) = ~r (5) + 0.01~F i(1, 2) = (~i + 2~j ) + 0.01~F i(1, 2).
(I) We have~r (5.01) = (~i + 2~j ) + 0.01(~i + 2~j ) = 1.01~i + 2.02~j . At t = 5.01 the object is at the point(1.01, 2.02).
(II) We have~r (5.01) = (~i + 2~j ) + 0.01(2~i + ~j ) = 1.02~i + 2.01~j . At t = 5.01 the object is at the point(1.02, 2.01).
(III) We have~r (5.01) = (~i + 2~j ) + 0.01~i = 1.01~i + 2~j . At t = 5.01 the object is at the point (1.01, 2.00).(IV) We have~r (5.01) = (~i + 2~j ) + 0.01(2~i ) = 1.02~i + 2~j . At t = 5.01 the object is at the point (1.02, 2.00).The match-up is: I-d, II-b, III-c, IV-aCOMMENT:Ask the students to approximate the position of the particleat t = 5.02 by completing a second step of Euler’s
method with∆t = 0.01.
5. True or false?
(a) Two different curves can be flow lines for the same vector field.(b) If one parameterization of a curve is a flow line for a vector field, then all its parameterizations are flow lines for the
vector field.
ANSWER:
(a) True. Every vector field has many flow lines. There is a flow line for a given vector field through every point in theplane.
(b) False. A flow line of a velocity field represents the motionof a particle with velocity specified by the vector field atevery point. Changing the parameterization can change the velocity of the particle even though the particle movesthrough exactly the same points.
COMMENT:Ask the students to give examples.
6. Are the following true or false? If~r (t) is a flow line for a vector field~F , then
(a) ~r 1(t) = ~r (t− 5) is a flow line for the same vector field~F .(b) ~r 1(t) = ~r (2t) is a flow line for the vector field2~F .(c) ~r 1(t) = 2~r (t) is a flow line for the vector field2~F .
ANSWER:
(a) True. Two particles with motion described by~r (t) and~r 1(t) = ~r (t − 5) move along exactly the same path, withthe second particle following 5 time units behind. Their velocities at a given point are the same and so can be givenby the same velocity field~F .
(b) True. Two particles with motion described by~r (t) and~r 1(t) = ~r (2t) move along exactly the same path, with thesecond particle moving twice as fast as the first at any given point. The velocity of the first at a point on its path is~F ,so the velocity of the second is2~F .
(c) False. A counterexample is given by~F = x~i , and~r (t) = et~i . Then~r 1(t) = 2et~i is not a flow line of2~F = 2x~i .

CHAPTER SEVENTEEN Hughes Hallett et al c©2009, John Wiley & Sons 289
ConcepTests and Answers and Comments for Section 17.5
1. Match the statements (a)–(e) and surfaces I–V. Note thatr, θ, z are cylindrical coordinates;ρ, φ, θ are spherical coordi-nates.
(a) 0 ≤ r ≤ 5, z = 10(b) 0 ≤ z ≤ 10, r = 5(c) 0 ≤ ρ ≤ 5, φ = π/3(d) 0 ≤ ρ ≤ 5, φ = π/2(e) θ = π/2
I. CylinderII. ConeIII. Disk abovexy-planeIV. Half planeV. Disk in xy-plane
ANSWER:
(a) III (b) I (c) II (d) V (e) IV
COMMENT:Ask the students to give parameterizations for the five surfaces. Point out that they need two and not three parameters
and that they cannot use the two coordinates appearing in statements (a)–(e) for parameters.
2. Match the statements (a)–(e) and parameterizations I–V.Note thatr, θ, z are cylindrical coordinates;ρ, φ, θ are sphericalcoordinates.
(a) Disk abovexy-plane(b) Cylinder(c) Cone(d) Disk in thexy-plane(e) Half-plane
I. x = 0, y = ρ sin φ, z = ρ cos φ, 0 ≤ ρ <∞, 0 ≤ φ ≤ πII. x = ρ sin(π/3) cos θ, y = ρ sin(π/3) sin θ, z = ρ cos(π/3),
0 ≤ θ ≤ 2π, 0 ≤ ρ ≤ 5III. x = r cos θ, y = r sin θ, z = 10, 0 ≤ r ≤ 5, 0 ≤ θ ≤ 2πIV. x = 5 cos θ, y = 5 sin θ, z = t, 0 ≤ θ ≤ 2π, 0 ≤ t ≤ 10V. x = ρ cos θ, y = ρ sin θ, z = 0, 0 ≤ θ ≤ 2π, 0 ≤ ρ ≤ 5
ANSWER:
(a) III (b) IV (c) II (d) V (e) I
COMMENT:Ask the students to give anr, θ parameterization of (e) in place of theρ, φ parameterization I.
3. Match the statements (a)–(e) and parameterizations I–V.Note thatr, θ, z are cylindrical coordinates;ρ, φ, θ are sphericalcoordinates.
(a) 0 ≤ r ≤ 5, z = 10(b) 0 ≤ z ≤ 10, r = 5(c) 0 ≤ ρ ≤ 5, φ = π/3(d) 0 ≤ ρ ≤ 5, φ = π/2(e) θ = π/2
I. x = 0, y = ρ sin φ, z = ρ cos φ, 0 ≤ ρ <∞, 0 ≤ φ ≤ πII. x = ρ sin(π/3) cos θ, y = ρ sin(π/3) sin θ, z = ρ cos(π/3),
0 ≤ θ ≤ 2π, 0 ≤ ρ ≤ 5III. x = r cos θ, y = r sin θ, z = 10, 0 ≤ r ≤ 5, 0 ≤ θ ≤ 2πIV. x = 5 cos θ, y = 5 sin θ, z = t, 0 ≤ θ ≤ 2π, 0 ≤ t ≤ 10V. x = ρ cos θ, y = ρ sin θ, z = 0, 0 ≤ θ ≤ 2π, 0 ≤ ρ ≤ 5
ANSWER:
(a) III (b) IV (c) II (d) V (e) I
COMMENT:Ask the students to give anr, θ parameterization of (e) in place of theρ, φ parameterization I.
4. A hemisphere of the sphere of radius 5 centered at the origin is parameterized by spherical coordinates in the usual way:
x = 5 sin φ cos θ y = 5 sin φ sin θ z = 5 cos φ.
Match the hemisphere (a)–(d) with the parameter limits (I)–(IV).
(a) z ≥ 0(b) y ≥ 0(c) x ≤ 0(d) y ≥ x
I. 0 ≤ θ ≤ π, 0 ≤ φ ≤ πII. π/2 ≤ θ ≤ 3π/2, 0 ≤ φ ≤ πIII. 0 ≤ θ ≤ 2π, 0 ≤ φ ≤ π/2IV. π/4 ≤ θ ≤ 5π/4, 0 ≤ φ ≤ π
ANSWER:The match-up is: I-b, II-c, III-a, IV-d.COMMENT:Ask the students to find parameter limits for other hemispheres.

290 CHAPTER SEVENTEEN Hughes Hallett et al c©2005, John Wiley & Sons
5. Match the parameterizations (I)–(IV) of the cylinders with their lengthL and radiusR in (a)–(d). In all cases0 ≤ s ≤ 2π,0 ≤ t ≤ 1.
I. x = 5 cos s y = t z = 5 sin sII. x = 5 cos s y = 5t z = 5 sin sIII. x = cos s y = t z = sin sIV. x = cos s y = 5t z = sin s
(a) L = 1, R = 1(b) L = 1, R = 5(c) L = 5, R = 1(d) L = 5, R = 5
ANSWER:I-b, II-d, III-a, IV-c.COMMENT:What aboutx = cos 5s y = t z = sin 5s ?
6. Match the parameterizations (I)–(IV) with the surfaces (a)–(d). In all cases0 ≤ s ≤ π/2, 0 ≤ t ≤ π/2. Note that onlypart of the surface may be described by the given parameterization.
(a) Cylinder(b) Plane(c) Sphere(d) Cone
I. x = cos s, y = sin t, z = cos s + sin tII. x = cos s, y = sin s, z = cos tIII. x = sin s cos t, y = sin s sin t, z = cos s
IV. x = cos s, y = sin t, z =√
cos2 s + sin2 t
ANSWER:(I) Part of a plane, sincez = x + y.(II) Part of a cylinder of radius 1 with center on thez-axis, sincex2 + y2 = 1.(III) Part of a sphere of radius 1 centered at the origin, since x2 + y2 + z2 = 1. With s = φ andt = θ this is the
usual parameterization of the sphere using spherical coordinates.(IV) Part of a cone with vertex at the origin and central axis on thez-axis, sincez =
√
x2 + y2.The match-up is: I-b, II-a, III-c, IV-dCOMMENT:Ask what part of each surface is described with0 ≤ s, t ≤ π/2.
7. True or false? The parameter curves on a parameterized plane are straight lines.ANSWER:False. The parameter curves depend on the parameterization. They could be straight lines, but they don’t have to be.
For example, if thexy-plane is parameterized in the usual way by polar coordinates, x = r cos θ, y = r sin θ, z = 0,then the parameter curves withr constant are circles.
COMMENT:Ask the students if there is a parameterization of the plane with parabolas as parameter curves.

Chapter Eighteen
Chapter Eighteen

292 CHAPTER EIGHTEEN Hughes Hallett et al c©2005, John Wiley & Sons
ConcepTests and Answers and Comments for Section 18.1
1. The vector field~F and the oriented curvesC1, C2, C3, C4 are shown in Figure 18.1. For which of the pathsCi is the lineintegral
∫
Ci
~F · d~r positive?
C2
C3
C4
C1
Figure 18.1
ANSWER:C2. The vector field~F and the line segments∆~r are approximately in opposite directions for the curvesC1 andC3.
So the contributions of each term~F ·∆~r are negative for these curves. Thus,∫
C1
~F · d~r and∫
C3
~F · d~r are negative.For the curveC4, the contribution from the first half of the curve cancels outthe contribution from the second half, so∫
C4
~F · d~r = 0. For the curveC2, the vector field and line segment∆~r are approximately in the same direction, so∫
C2
~F · d~r > 0.COMMENT:Point out that symmetry arguments can be used to show an integral is zero. Illustrate with a path symmetric about
thex axis.

CHAPTER EIGHTEEN Hughes Hallett et al c©2009, John Wiley & Sons 293
2. GivenC, a circle centered at the origin oriented clockwise, say forwhich of the vector fields below the circulation aroundC is positive.
x
y(i)
x
y(ii)
x
y(iii)
x
y(iv)
Figure 18.2
ANSWER:(iii). The vector field in (i) circles counterclockwise around the origin, so its circulation aroundC is negative. For
the vector field in (ii), the path integral along the left halfof C cancels out the path integral along the right half, so thecirculation is zero. The vector field in (iii) has a componentin the direction ofC all the way around (except at the verytop and bottom ofC), so the circulation is positive. The vector field in (iv) is perpendicular toC at every point, so thecirculation is zero.
COMMENT:For the vector field in (ii) you can also use a symmetry argument about thex-axis. In fact, the integral along each of
the top, bottom, left, or right semicircles is zero.
3. True or false? Given two circles centered at the origin, oriented counterclockwise, and any vector field~F , then the pathintegral of ~F is larger around the circle with larger radius.
ANSWER:False. The path integral is determined by the values of the vector field along the path, not simply by the size of the
path.COMMENT:For example, the vector field−y/(x2 + y2)3/2~i + x/(x2 + y2)3/2~j has a larger path integral around the circle of
radius 1 than around the circle of radius 2.
4. True or false? If~F is any vector field andC is a circle, then the integral of~F aroundC traversed clockwise is the negativeof the integral of~F aroundC traversed counterclockwise.
ANSWER:True. The integral of a vector field along a path changes sign when the path is reversed.COMMENT:Note that the statement is true even when the integral is zero, since in that case both integrals are zero, and the
negative of zero is zero.

294 CHAPTER EIGHTEEN Hughes Hallett et al c©2005, John Wiley & Sons
5. Group together the equal line integrals∫
C~F · d~r in (I)–(IV), whereC is the oriented curve fromP to Q, and ~F is the
vector field shown. The scale is the same on all four graphs.
P Q
x
y(I)
Q P
x
y(II)
P Q
x
y(III)
Q P
x
y(IV)
ANSWER:The vector fields in (I) and (II) look the same, but the curves are oriented in opposite directions, so the line integrals
in (I) and (II) have approximately the same absolute value but opposite sign.The oriented curves in (I) and (III) look the same but the vector fields point in opposite directions (with the same
magnitudes), so the line integrals in (I) and (III) have the same absolute value but opposite sign. Thus (II) and (III) giveapproximately equal line integrals, both opposite to (I).
The vector fields in (III) and (IV) look the same, but the curves are oriented in opposite directions, so the line integralsin (III) and (IV) have approximately the same absolute valuebut opposite sign. Thus (I) and (IV) give equal line integrals.
The grouping by equality is: (I) with (IV); (II) with (III).
6. Are the following statements about a line integral∫
C~F · d~r true or false? If the angle between the vector field~F and
the oriented curveC at every point ofC is
(a) An acute angle, then∫
C~F · d~r > 0.
(b) A right angle, then∫
C~F · d~r = 0.
(c) An obtuse angle, then∫
C~F · d~r < 0.
ANSWER:The line integrals
∫
C~F · d~r are approximated by Riemann sums
∑
i
~F (~r i) ·∆~r i =∑
i
‖~F (~r i)‖‖∆~r i‖ cos θi
whereθi is (approximately) the angle between the vector field~F (represented by the vector~F (~r i)) and the orientedcurveC (approximated by the vector∆~r i)
(a) True. In the Riemann sums all dot product terms are positive because the angleθi is acute, givingcos θi > 0.(b) True. In the limit, all dot product terms are zero becausethe angleθi is a right angle, givingcos θi = 0.(c) True. In the Riemann sums all dot product terms are negative because the angleθi is obtuse, givingcos θi < 0.

CHAPTER EIGHTEEN Hughes Hallett et al c©2009, John Wiley & Sons 295
7. The work done by the force field~F = y~i as an object moves along a straight line joining(1, 1) to (1,−1) is
(a) positive(b) negative(c) zero.
ANSWER:(c). Since the two points have the samex-coordinate, the straight line joining them is vertical. Onthe other hand, the
vector field points in the horizontal direction, and so is always perpendicular to the path of the object. Thus it does notwork on the object as it moves.
COMMENT:Follow-up. Ask the students to give paths for which the work is positive or negative. Ask for a vector field that would
make the work positive or negative along the given path.
8. A Riemann sum approximation for a line integral∫
Cgrad f ·d~r ≈ Σ grad f(~r i)·∆~r i is given for a very fine subdivision
of the oriented curveC. Which of the following can you conclude? The terms of the Riemann sum coming from segmentsof C
(a) WhereC crosses level curves off in the direction of increasing values are positive.(b) Wheref is positive are positive.(c) Wheregrad f is positive are positive(d) WhereC is tangent to a level curve off are positive.
ANSWER:(a) The vectorgrad f(~r i) is perpendicular to the level curve off at a pointP of C, and it points in the direction of
increasing values off . If C crosses the level curve atP in the direction of increasing values off , then a tangent vector toC atP in the orientation direction forms an acute angle withgrad f(~r i). The vector∆~r i is very nearly tangent toC, soit, too, will form an acute angle withgrad f(~r i). Thusgrad f(~r i) ·∆~r i > 0, a positive term in the Riemann sum.
Counterexamples can be constructed for statements (b) and (d). Statement (c) does not make sense becausegrad fis a vector, and a vector can not be positive or negative, onlya scalar can. Thus, statement (a) is the only conclusion wecan make.
ConcepTests and Answers and Comments for Section 18.2
1. If C1 is the path parameterized by~r 1(t) = (t, t), 0 ≤ t ≤ 1, and ifC2 is the path parameterized by~r 2(t) = (t2, t2),0 ≤ t ≤ 1, and if ~F = x~i + y~j , which of the following is true?
(a)∫
C1
~F · d~r >∫
C2
~F · d~r
(b)∫
C1
~F · d~r <∫
C2
~F · d~r
(c)∫
C1
~F · d~r =∫
C2
~F · d~r
ANSWER:(c) The two parameterizations give the same path, in the samedirection. Since a line integral does not depend on the
way the path is parameterized, the two line integrals are thesame.COMMENT:Have the students calculate the integrals explicitly to show the equality.
2. If C1 is the path parameterized by~r 1(t) = (t, t), 0 ≤ t ≤ 1, and ifC2 is the path parameterized by~r 2(t) = (1−t, 1−t),0 ≤ t ≤ 1, and if ~F = x~i + y~j , which of the following is true?
(a)∫
C1
~F · d~r >∫
C2
~F · d~r
(b)∫
C1
~F · d~r <∫
C2
~F · d~r
(c)∫
C1
~F · d~r =∫
C2
~F · d~r
ANSWER:(a). The two parameterizations give the same path, but one goes in the opposite direction to the other. Since~F points
away from the origin, andC1 is oriented away from the origin,∫
C1
~F · d~r is positive, so∫
C2
~F · d~r is negative.COMMENT:Point out to students that when comparing two paths to see if they are the same, you have to compare their orientations
as well as their shape.

296 CHAPTER EIGHTEEN Hughes Hallett et al c©2005, John Wiley & Sons
3. If C1 is the path parameterized by~r 1(t) = (t, t), for 0 ≤ t ≤ 1, and if C2 is the path parameterized by~r 2(t) =(sin t, sin t), for 0 ≤ t ≤ 1, and if ~F = x~i + y~j , which of the following is true?
(a)∫
C1
~F · d~r >∫
C2
~F · d~r
(b)∫
C1
~F · d~r <∫
C2
~F · d~r
(c)∫
C1
~F · d~r =∫
C2
~F · d~r
ANSWER:(a). The two parameterizations move along the liney = x in the direction away from the origin, but they have differ-
ent endpoints. The pathC1 goes from(0, 0) to (1, 1) and the pathC2 goes from(0, 0) to (sin 1, sin 1) ≈ (0.84, 0.84).Since~F points away from the origin, and both paths are oriented so that the direction of travel is oriented away from theorigin, the integral along the longer path is larger, so
∫
C1
~F · d~r >∫
C2
~F · d~r .COMMENT:Point out to students that for two parameterizations to givethe same path, they have to have the same endpoints.
4. Consider the pathC1 parameterized by~r 1(t) = (cos t, sin t), 0 ≤ t ≤ 2π and the pathC2 parameterized by~r 2(t) =(2 cos t, 2 sin t), 0 ≤ t ≤ 2π. Let ~F be a vector field. Is it always true that
∫
C2
~F · d~r = 2∫
C1
~F · d~r ?ANSWER:No. C1 is a circle of radius 1 centered at the origin andC2 is a circle of radius 2 centered at the origin. There is no
reason why the integral around a circle of radius 2 should be twice the size of the integral around a circle of radius 1. Theintegral depends on the values of the vector field along the path, not just on the shape of the path.
COMMENT:For example, the vector field−y/(x2 + y2)~i + x/(x2 + y2)~j has the same integral around both paths.
5. Consider the pathC1 parameterized by~r 1(t) = (cos t, sin t), 0 ≤ t ≤ 2π and the pathC2 parameterized by~r 2(t) =(cos(2t), sin(2t)), 0 ≤ t ≤ 2π. Let ~F be a vector field. Is it always true that
∫
C2
~F · d~r = 2∫
C1
~F · d~r ?ANSWER:Yes.C1 is a circle of radius 1 centered at the origin, traversed oncein the counterclockwise direction, andC2 is the
same circle traversed twice. Thus the integral aroundC2 will be twice the integral aroundC1.COMMENT:Follow-up. Ask the students to give a parameterized pathC3 that will make
∫
C3
~F · d~r = −2∫
C1
~F · d~r .
ConcepTests and Answers and Comments for Section 18.3
1. The line integral of~F = grad f along one of the paths shown in Figure 18.3 is different from the integral along the othertwo. Which is the odd one out?
1
1
C3
C2C1
x
y
Figure 18.3
ANSWER:C3. The two pathsC1 andC2 give the same line integral by the Fundamental Theorem of Calculus for line integrals,
since they have the same starting and ending points. The integral overC3 could be different because it goes in the oppositedirection, so the starting and ending points are swapped.
COMMENT:Follow-up Question. Is it possible for all integrals to be the same? Yes, iff(0, 1) = f(1, 0), then all three integrals
are zero.

CHAPTER EIGHTEEN Hughes Hallett et al c©2009, John Wiley & Sons 297
2. Rank the four line integrals∫
Ci
grad f · d~r from smallest to largest, whereCi, i = 1, 2, 3, 4 are the oriented curves onthe contour diagram off in Figure 18.4.
5
10
15
C1
C2
C3
C4
x
y
Figure 18.4
ANSWER:By the Fundamental Theorem of Calculus for Line Integrals,
∫
Ci
grad f · d~r = f(point at end ofCi)− f(point at start ofCi),
the difference of the values on the contour lines off where the curveCi starts and ends. Thus:I1 =
∫
C1grad f · d~r = 15− 15 = 0.
I2 =∫
C2grad f · d~r = 10− 15 = −5.
I3 =∫
C3grad f · d~r = 5− 15 = −10
I4 =∫
C4grad f · d~r = 10− 5 = 5.
The ranking isI3 < I2 < I1 < I4.

298 CHAPTER EIGHTEEN Hughes Hallett et al c©2005, John Wiley & Sons
3. Figure 18.5 shows the vector fieldgrad f , wheref is continuously differentiable in the whole plane. The two ends of anoriented curveC from P to Q are shown, but the middle portion of the path is outside the viewing window pictured inFigure 18.5. The line integral
∫
Cgrad f · d~r is
(a) Positive(b) Negative(c) Zero(d) Can’t tell without further information
PQ
C
C
Figure 18.5
ANSWER:(a) The line integral of the continuous gradientgrad f is path independent, so
∫
Cgrad f · d~r =
∫
C1grad f · d~r
whereC1 is the oriented straight-line path fromP to Q in Figure 18.6. Sincegrad f forms an acute angle with thedirection ofC1 at every point, the line integral overC1 is positive. Thus, the line integral overC is also positive.
P Q
C
CC1
Figure 18.6

CHAPTER EIGHTEEN Hughes Hallett et al c©2009, John Wiley & Sons 299
4. Which of the diagrams contain all three of the following: acontour diagram of a functionf , the vector fieldgrad f of thesame function, and an oriented pathC from P to Q with
∫
Cgrad f · d~r = 60?
−20−510
25
40
P
Q
C
(I)
−20−5
10
25
40
P
Q
C
(II)
−20−5
10
25
40
Q
P
C
(III)
−20−5
10
25
40
P
Q
C
(IV)
ANSWER:The vector fieldgrad f is perpendicular to the level curves off , so (IV) is wrong. Moreover,grad f points in the
direction of increasing values off , so (I) is wrong. Finally, by the Fundamental Theorem of LineIntegrals,∫
Cgrad f ·
d~r = f(Q)− f(P ), wheref(P ) is the value off at the starting point ofC andf(Q) is the value off at the terminatingpoint ofC. In (II), f(Q)−f(P ) = 40− (−20) = 60 and in (III) f(Q)−f(P ) = −20−40 = −60. The correct answeris (II)
5. If f is a smooth function of two variables that is positive everywhere and~F = grad f , which of the following can youconclude about
∫
C~F · d~r ?
(a) It is positive for all smooth pathsC(b) It is zero for all smooth pathsC(c) It is positive for all closed smooth pathsC.(d) It is zero for all closed smooth pathsC.
ANSWER:(d) is true since gradient fields are path-independent, by the Fundamental Theorem of Calculus for Line Integrals.
This contradicts (c), so that can’t be true. As for (a) and (b), the integral off along any path is the difference between thevalue off at the ending point and the value off at the starting point. Since the difference of two positive numbers couldbe any number, neither (a) nor (b) is true always.
COMMENT:Follow-up Question. Under what conditions onf is (b) true? Answer: whenf is constant.

300 CHAPTER EIGHTEEN Hughes Hallett et al c©2005, John Wiley & Sons
ConcepTests and Answers and Comments for Section 18.4
1. Figure 18.7 shows a curveC broken into two piecesC1 andC2. Which of the following statements is true for any smoothvector field~F ? (There might be more than one.)
(a)∫
C~F · d~r =
∫
C1
~F · d~r +∫
C2
~F · d~r
(b)∫
C~F · d~r =
∫
C1
~F · d~r −∫
C2
~F · d~r
(c)∫
C1
~F · d~r =∫
C2
~F · d~r .
(d)∫
C~F · d~r = 0
P
Q
C2
C1
C
Figure 18.7
ANSWER:Only statement (b) is true for an arbitrary vector field.COMMENT:Ask the students what conditions on the field are necessary tomake statements (c) and (d) true. (E.g.,~F is a gradient
field or a path-independent field.)
2. A smooth two dimensional vector field~F = F1~i + F2
~j , with ~F 6= ~0 satisfies∂F2
∂x=
∂F1
∂yat every point in the plane.
Which of the following statements is true? (There might be more than one.)
(a)∫
C~F · d~r = 0 for all smooth pathsC.
(b)∫
C1
~F · d~r =∫
C2
~F · d~r for any two smooth pathsC1 andC2 with the same starting and ending points.
(c) ~F = grad f for some functionf .(d) If C1 is the straight line from−1 to 1 on they-axis and ifC2 is the right half of the unit circle, traversed counter-
clockwise, then∫
C1
~F · d~r =∫
C2
~F · d~r .
ANSWER:Statements (b), (c), and (d) are true. Green’s theorem tellsus that~F is path-independent, and path-independent fields
are gradient fields, so statements (b) and (c) are true. Statement (d) is just a particular case of statement (b). Statement (a)would be true of it had the extra condition thatC was a closed path, but it is not true for all paths.
COMMENT:Follow-up Question. Would any of the statement be true if the vector field satisfiedthe partial derivative condition
everywhere except at the point(−1, 0)? (For example, if it were not defined at that point.) Only statement (d) would betrue in this case, since the region enclosed by the two paths does not contain(−1, 0).

CHAPTER EIGHTEEN Hughes Hallett et al c©2009, John Wiley & Sons 301
3. A vector field ~F in the plane is defined everywhere except at the point(2, 1), and∂F2
∂x=
∂F1
∂yat every point in its
domain. For each pathC in Figure 18.8, say whether Green’s theorem allows you to conclude that∫
C~F · d~r = 0.
−1 1
−1
1C
x
y(a)
1 2
−1
1 C
x
y(b)
3
45◦x
y(c)
1 2
1
C
x
y(d)
Figure 18.8
ANSWER:(a) and (b). For Green’s theorem to apply, the region enclosed by the curve cannot contain any holes in the domain
of ~F . The point(2, 1) is contained in the region enclosed by the path in (c), and is on the path in (d).COMMENT:Vary the hypothesis by replacing (2,1) with different points.

302 CHAPTER EIGHTEEN Hughes Hallett et al c©2005, John Wiley & Sons

Chapter Nineteen
Chapter Nineteen

304 CHAPTER NINETEEN Hughes Hallett et al c©2005, John Wiley & Sons
ConcepTests and Answers and Comments for Section 19.1
1. Consider the flux of~F = x~i through a disk of radius 1 oriented as in (a)–(d). In which cases is the flux positive?
(a) In theyz-plane, centered at the origin and oriented in the directionof increasingx.(b) In the planex = 2, centered on thex-axis and oriented away from the origin.(c) In the planey = 2, centered on they-axis and oriented away from the origin.(d) In the planex + y = 2, centered on thex-axis and oriented away from the origin.
ANSWER:The flux through the disks in parts (b) and (d) are positive. The flux in part (a) is zero, since~F = ~0 on theyz-plane.
The flux in part (c) is zero, since~F is parallel to the disk in this case.
2. Consider the flux of~F = y~i through a disk of radius 1 oriented as in (a)–(d). In which cases is the flux positive?
(a) In theyz-plane, centered at the origin and oriented in the directionof increasingx.(b) In the planex = 2, centered on thex-axis and oriented away from the origin.(c) In the planey = 2, centered on they-axis and oriented away from the origin.(d) In the planex + y = 2, centered on thex-axis and oriented away from the origin.
ANSWER:None. The flux through the surfaces in parts (a)–(d) is zero. In parts (a), (b), and (d), the flux integral is zero because
contributions from positive and negativey-values cancel. The flux in part (c) is zero because the vectorfield is parallel tothe disk.
3. For each oriented surface (I)–(V), pick all the vector fields from (a)–(e) that give a positive flux integral∫
S~F · d ~A .
(a) ~F = x~j (b) ~F = x~k (c) ~F = −y~k(d) ~F = y~j (e) ~F = −z~i (f) ~F = (z + x)~i
xy
z(I)
x y
z(II)
x
y
z(III)
x
y
z(IV)
x
y
z(V)
ANSWER:For (I), ~A is in the same direction as~i , the possible answers are (e) and (f). The surface hasx = 0, y ≥ 0, z ≥ 0,
so (f) is the only answer.For (II), ~A is in the same direction as~i , so the possible answers are (e) and (f). The surface hasx = 0, y ≥ 0,
z ≤ 0, so (e) is the only answerFor (III), ~A is in the same direction as−~k , so possible answers are (b) and (c). The surface hasx ≥ 0, y ≥ 0,
z = 0, so (c) is the only answer.For (IV), ~A is in the same direction as−~k , so the possible answers are (b) and (c). The surface hasx ≥ 0, y ≥ 0,
z ≥ 0, so (c) is the only answer.For (V), ~A is in the same direction as~j , so the possible answers are (a) and (d). On the surface,x ≥ 0, y = 0,
z ≥ 0, so (a) is the only answer

CHAPTER NINETEEN Hughes Hallett et al c©2009, John Wiley & Sons 305
4. Let ~F = ~r = x~i + y~j + z~k . For which of the surfacesS, in (a)–(d) is the flux∫
S~F · d ~A positive?
(a) Sphere of radius 1 centered at the origin.(b) Unit disk in thexy-plane, oriented upward.(c) Unit disk in the planex = 2, oriented toward the origin.(d) A cube of side 2, centered at the origin and with sides parallel to the axes.
ANSWER:The flux in parts (a) and (d) are positive. In each case, the surface is oriented away from the origin, and the vector
field points outward. The flux in part (b) is zero as the vector field is parallel to the surface. The flux in part (c) is negativeas the surface is oriented toward the origin and the vector field points in the direction of increasingx.
COMMENT:As an extension, ask students to compute the flux through these surfaces. Answers are
(a) 4π (b) 0 (c) −2π (d) 24
5. For each of the surfaces in (a)–(e), pick the vector field~F 1, ~F 2, ~F 3, ~F 4, ~F 5, with the largest flux through the surface.The surfaces are all squares of the same size. Note that the orientation is shown.
~F 1 = 2~i − 3~j − 4~k
~F 2 = ~i − 2~j + 7~k
~F 3 = −7~i + 5~j + 6~k
~F 4 = −11~i + 4~j − 5~k
~F 5 = −5~i + 3~j + 5~k
xy
z(a)
x y
z(b)
x
y
z(c)
x
y
z(d)
x
y
z(e)
ANSWER:For (a), we want the vector field with the largest~i component so~F 1.For (b), we want the vector field with the largest~i component so~F 1.For (c), we want the vector field with the most negative~k component, so~F 4.For (d), we want the vector field with the most negative~k component, so~F 4.For (e), we want the vector field with the largest~j component so~F 3.COMMENT:Assume each surface is a square of side 1. Calculate the largest flux through each surface.

306 CHAPTER NINETEEN Hughes Hallett et al c©2005, John Wiley & Sons
6. Let∫
S~F i · d ~A be the flux of the vector field~F i, for i =1–4, out of the sphere of radius 2 centered at the origin. For the
following vector fields, arrange the flux integrals in ascending order.
~F 1 =~r
||~r || ,~F 2 =
~r
||~r ||2 , ~F 3 = x~j , ~F 4 = ~r ||~r ||.
ANSWER:On the sphere, the vector fields~F 1, ~F 2, ~F 4 point radially outward and are everywhere perpendicular tothe surface.
Since the radius of the sphere is 2,||~F 4|| = 4, ||~F 2|| = 1/2, and||~F 1|| = 1. The vector field~F 3 points inward wherex < 0 and outward wherex > 0, and by symmetry,
∫
S~F 3 · d ~A = 0. All the other integrals are positive. Thus,
∫
S
~F 3 · d ~A <
∫
S
~F 2 · d ~A <
∫
S
~F 1 · d ~A <
∫
S
~F 4 · d ~A .
7. Without evaluating them, match the flux integrals (I)–(VI) with the values (a)–(f). The surfaceB1 is the closed box,−1 ≤ x ≤ 1,−1 ≤ y ≤ 1,−1 ≤ z ≤ 1. The surfaceB2 is the closed box,−2 ≤ x ≤ 2,−2 ≤ y ≤ 2,−2 ≤ z ≤ 2.
I.
∫
B1
~r · d ~A II.
∫
B2
~r · d ~A III.
∫
B1
(
~r − ~r
||~r ||3
)
· d ~A
IV.
∫
B1
− ~r
||~r ||3 · d~A V.
∫
B2
−~r · d ~A VI.
∫
B1
−~r · d ~A
(a) −24 (b) −12.6 (c) 192 (d) −192 (e) 11.4 (f) 24
ANSWER:Before matching integrals and answers, we arrange the integrals in ascending order. Since the boxes are closed, they
are oriented outward. Thus, the integrals I and II are positive and the integrals IV–VI are negative. Integrals I and II havethe same vector field, which increases in magnitude with distance from the origin. Since the surfaceB1 in I lies inside thesurfaceB2 in II, the integral II is larger than I. The vector field~r − ~r /||~r ||3 in III points outward on the surface ofB1,because||~r || is greater than or equal to 1 there, so integral III is also positive. Since the vector field in~r − ~r /||~r ||3 issmaller in magnitude than~r , integral I is larger than III (the surfaces are the same). Thus
I = 24 (f) , II = 192 (c) , III = 11.4 (e) .
The integrals IV, V, and (VI) are all negative. Since~r /||~r ||3 is smaller in magnitude than~r , integral IV is smallerin magnitude than VI (the surfaces are the same). Since surface B1 in VI lies insideB2 in V, integral VI is smaller inmagnitude than integral V. Thus
IV = −12.6 (b) , V = −192 (d) , VI = −24 (a) .

CHAPTER NINETEEN Hughes Hallett et al c©2009, John Wiley & Sons 307
8. Are the following statements about the flux integral∫
S~F · d ~A of a vector field~F through an oriented surfaceS true or
false? If at all points ofS the vector field~F is
(a) Tangent toS, then∫
S~F · d ~A = 0.
(b) Pointing to the same side ofS as the orientation normal vector~n , then∫
S~F · d ~A > 0.
(c) Normal toS, then∫
S~F · d ~A 6= 0.
ANSWER:The flux integrals
∫
S~F · d ~A are approximated by Riemann sums
Σ~F ·∆ ~A = Σ‖~F ‖‖∆ ~A ‖ cos θ
whereθ is the angle between the vector field~F and a surface normal vector∆ ~A in the direction of the orientation normalvector~n .
(a) True. A surface tangent vector is at right angles to the surface normal vector∆ ~A . In the limit, all dot product termsin the Riemann sums for
∫
S~F · d ~A are zero because the angleθ is a right angle, givingcos θ = 0. So the flux
integral equals zero.(b) True. A vector at a point ofS pointing to the same side ofS as the normal vector~n makes an acute angle with~n . All
dot product terms in the Riemann sums for∫
S~F · d ~A are positive because the anglesθ are acute, givingcos θ > 0.
Thus the integral is positive.(c) False. A counterexample is given by~F = x~k , and the square surfaceS in thexy-plane given by−10 ≤ x ≤ 10,−10 ≤ y ≤ 10, oriented upward in the direction of~k . The vector field~F is everywhere normal toS, but the fluxintegral
∫
S~F · d ~A is zero because the positive flux through thex > 0 part ofS cancels by symmetry the negative
flux through thex < 0 part ofS.

308 CHAPTER NINETEEN Hughes Hallett et al c©2005, John Wiley & Sons
ConcepTests and Answers and Comments for Section 19.2
1. The vector field,~F , in Figure 19.1 depends only onz; that is, it is of the formg(z)~k , whereg is an increasing function.The integral
∫
S~F · d ~A represents the flux of~F through this rectangle,S, oriented upward. In each of the following
cases, how does the flux change?
(a) The rectangle is twice as wide in thex-direction, with new corners at the origin,(2, 0, 0), (2, 1, 3), (0, 1, 3).(b) The rectangle is moved so that its corners are at(1, 0, 0), (2, 0, 0), (2, 1, 3), (1, 1, 3).(c) The orientation is changed to downward.(d) The rectangle is tripled in size, so that its new corners are at the origin,(3, 0, 0), (3, 3, 9), (0, 3, 9).
x
y
z
(1, 0, 0)
(1, 1, 3)
(0, 1, 3)
Figure 19.1
ANSWER:
(a) The surface can be considered as made up of two rectangles, the original one and another “next door” along thex-axis. Because the vector field is independent ofx, the flux through both rectangles are the same. Thus, the flux hasdoubled.
(b) Because the vector field does not depend onx, the flux is unchanged.(c) The sign is reversed, but the magnitude of the flux remainsthe same.(d) Tripling each side of the rectangle multiplies its area by 9. However, the surface now extends further up thez-axis,
where the vector field is not given. If the vector field is larger further up thez-direction (as suggested by the diagram),then the flux has multiplied by a factor of more than 9.

CHAPTER NINETEEN Hughes Hallett et al c©2009, John Wiley & Sons 309
2. To calculate the flux through each of the following surfaces, what coordinate system, rectangular, cylindrical, or spherical,would be a good choice?
(a) x2 + y2 = 9 (b) x− y + z = 5(c) 9− x2 − y2 − z2 = 0 (d) y2 + z2 = 5
ANSWER:
(a) Cylindrical, because the surface is a cylinder.(b) Rectangular, because the surface is a plane which can be written as the graph of a function ofx andy.(c) Spherical, because the surface is a sphere.(d) Cylindrical, because the surface is a cylinder. Since the cylinder is centered on thex-axis, we will have to usex in
place ofz.
3. To calculate a flux integral through the surfaces (I)–(V),which area element (a)–(e) would be a good choice? (There maybe more than one solution.) If you choose (f), give the functionf you would use.
x
yz(I)
x
y
z1
1
1
(II)
x y
z(III)
x y
z
31
2(IV)
x
y
z(V)
(a) d ~A = ~k dx dy(b) d ~A = ~j dx dz(c) d ~A =~i dy dz(d) d ~A = (sin φ cos θ~i + sin φ sin θ~j + cos φ~k )R2 sin φ dφ dθ(e) d ~A = (cos θ~i + sin θ~j )R dz dθ
(f) d ~A = (−fx~i + fy
~j + ~k ) dx dy
ANSWER:(I) For part of a sphere, use spherical coordinates, (d), or rectangular, (f) withf(x, y) = −
√
r2 − x2 − y2.(II) Use rectangular coordinates, (f), withf(x, y) = c + mx + ny.(III) Use cylindrical coordinates, (e).(IV) Since the surface is in thexz-plane, use (b).(V) For the half cylinder, we could use cylindrical coordinates (centered on they-axis rather than thez-axis), or
rectangular, (f) withz =√
r2 − x2.

310 CHAPTER NINETEEN Hughes Hallett et al c©2005, John Wiley & Sons
ConcepTests and Answers and Comments for Section 19.3
1. An oriented surfaceS is parameterized by~r = ~r (s, t). The flux of a vector field~F throughS is given by
Q =
∫
R
~F (~r (s, t)) ·(
∂~r
∂s× ∂~r
∂t
)
ds dt.
In each of the following cases, how is the value of the new integral related toQ?
(a)
∫
R
~F (~r (s, t)) ·(
∂~r
∂t× ∂~r
∂s
)
ds dt
(b)
∫
R
2~F (~r (s, t)) ·(
2∂~r
∂s
)
×(
2∂~r
∂t
)
ds dt
(c)
∫
R
(
∂~r
∂s× ∂~r
∂t
)
· ~F (~r (s, t)) ds dt
(d)
∫
R
||~F (~r (s, t))||∣
∣
∣
∣
∣
∣
∣
∣
∂~r
∂s
∣
∣
∣
∣
∣
∣
∣
∣
∣
∣
∣
∣
∣
∣
∣
∣
∂~r
∂t
∣
∣
∣
∣
∣
∣
∣
∣
ds dt
ANSWER:
(a) Since the order of the factors in the cross product has been reversed, the orientation of the surface has been reversed.Thus, the integral is−Q.
(b) Since each factor in the integral has been multiplied by 2, the integral is8Q.(c) The order of the vectors in a dot product does not affect the answer, so this integral is alsoQ.(d) Since a dot product of two vectors is no more than the product of the lengths of the vectors, and the length of a cross
product is also less than the product of the lengths of the twovectors, this integral is certainly positive, and at least aslarge as|Q|.
2. LetS be the hemispherex2 + y2 + z2 = 1 with x ≤ 0, oriented away from the origin. Which of the following integralsrepresents the flux of~F (x, y, z) throughS?
(a)
∫
R
~F (x, y, z(x, y)) · ∂~r
∂x× ∂~r
∂ydx dy
(b)
∫
R
~F (x, y, z(x, y)) · ∂~r
∂y× ∂~r
∂xdy dx
(c)
∫
R
~F (x, y(x, z), z) · ∂~r
∂x× ∂~r
∂zdx dz
(d)
∫
R
~F (x, y(x, z), z) · ∂~r
∂z× ∂~r
∂xdz dx
(e)
∫
R
~F (x(y, z), y, z) · ∂~r
∂y× ∂~r
∂zdy dz
(f)
∫
R
~F (x(y, z), y, z) · ∂~r
∂z× ∂~r
∂ydz dy
ANSWER:Since the half sphere isx = −
√
1− y2 − z2, we parameterize in the formx = x(y, z). Thus, the answer is either
(e) or (f). We have∂~r /∂y = (y/√
1− y2 − z2)~i +~j and∂~r /∂z = (z/√
1− y2 − z2)~i +~k , and∂~r /∂y×∂~r /∂z =
~i − (y/√
1− y2 − z2)~j − (z/√
1− y2 − z2)~k = −~r /√
1− y2 − z2. Our surface is oriented away from the origin,
so we want(∂~r /∂z)× (∂~r /∂y) = ~r /√
1− y2 − z2, so the answer is (f).

Chapter Twenty
Chapter Twenty

312 CHAPTER TWENTY Hughes Hallett et al c©2005, John Wiley & Sons
ConcepTests and Answers and Comments for Section 20.1
1. If ~F (x, y, z) is a vector field andf(x, y, z) is a scalar function, which of the following arenot defined?
(a) grad ~F (b) grad f (c) div ~F + f(d) ~F + grad f (e) div ~F + grad f
ANSWER:
(a) Not defined(b) Defined(c) Defined(d) Defined(e) Not defined; can’t add vector and scalar
2. Which of the following quantities are vectors?
(a) div(~F (x, y, z)) (b) grad f(x, y, z) · ~u (c) div grad(f(x, y, z))(d) (div ~F (x, y, z))~F (e) f(x, y, z) grad f(x, y, z)
ANSWER:Only (d) and (e) are vectors.
3. For~r = x~i + y~j + z~k , an arbitrary functionf(x, y, z) and an arbitrary vector field,~F (x, y, z), which of the followingis a vector field, and which is a constant vector field?
(a) grad f (b) (div ~F )~i (c) (div ~r )~i (d) (div~i )~F (e) grad(div ~F )
ANSWER:(a), (b), and (e) all depend on the point(x, y, z), so they are vector fields. Sincediv~r = 3 anddiv~i = 0, the vectors
in (c) and (d) are constant vector fields.
4. Are the following statements true or false? If all the flow lines of a vector field~F
(a) Are parallel straight lines, thendiv ~F = 0.(b) Radiate outward along straight lines from the origin, thendiv ~F > 0.
ANSWER:
(a) False. A counterexample is given by~F = x~i . The flow lines of~F are all straight lines parallel to the vector~i , butdiv ~F = 1 6= 0. Imagine cars driving on a straight highway where each car isalways going slower than the car justahead of it. The separation between the cars is increasing, so the cars are diverging.
(b) False. A counterexample is given by~F = (x2 + y2 + z2)−2(x~i + y~j + z~k ) in which the speed of the flow rapidlydecreases as it moves away from the origin. For this vector field div ~F = −(x2 + y2 + z2)−2 < 0.
This problem illustrates the fact that divergence can be caused by expansion and compression in the direction of the flowof a vector field, not only by convergence and divergence of the flow lines.
ConcepTests and Answers and Comments for Section 20.2
1. Let ~F = (5x + 7y)~i + (7y + 9z)~j + (9z + 11x)~k , and letQi be the flux of~F through the surfacesSi for i =1–4.ArrangeQi in ascending order, where
(a) S1 is the sphere of radius 2 centered at the origin(b) S2 is the cube of side 2 centered at the origin and with sides parallel to the axes(c) S3 is the sphere of radius 1 centered at the origin(d) S4 is a pyramid with all four corners lying onS3
ANSWER:Sincediv ~F = 5 + 7 + 9 = 21, by the Divergence Theorem, ifWi is the region insideSi, we have
Qi =
∫
Wi
21 dV = 21 · Vol Wi.
Thus, we arrangeQi by the volume ofWi, so
Q4 < Q3 < Q2 < Q1.

CHAPTER TWENTY Hughes Hallett et al c©2009, John Wiley & Sons 313
2. LetSi be the flux vector field~F i out of the unit sphere centered at the origin, fori =1–4. ArrangeSi in ascending order,where
~F 1 = (ez + x3)~i + ex~j + y3~k
~F 2 = (z3 + cos y)~i − y3~j + x3y3~k
~F 3 = z2~i − (x2 + z2)~j + (z3 + zy2)~k
~F 4 = (x4 − y4)~i + (z4 − 2x3y)~j + (y4 − 2x3z)~k
ANSWER:We have
div ~F 1 = 3x2
div ~F 2 = −3y2
div ~F 3 = 3z2 + y2
div ~F 4 = 4x3 − 2x3 − 2x3 = 0.
By the Divergence Theorem, ifW is the region inside the sphere
S1 =
∫
W
3x2dV, S2 = −∫
W
3y2dV, S3 =
∫
W
(3z2 + y2) dV, S4 =
∫
W
0 dV = 0.
Since the region of integration,W , is the same in each integral, we have
S2 < S4 = 0 < S1 < S3.
3. For surfaceSi, with i =1–4, the flux of~F = ~r /||~r ||3 out ofSi is Qi. Which of theQi are equal to one another? Whatare their values?
S1 : Sphere(x− 3)2 + (y − 3)2 + z2 = 1
S2 : Spherex2 + (y − 1)2 + z2 = 3
S3 : Box x = ±2, y = ±1, z = ±2
S4 : Box x = 1, x = 3, y = ±1, z = ±1
S5 : Sphere of radius 2 centered at the origin
S6 : Ellipsoidx2/4 + y2 + 3z2 = 1.
ANSWER:We know thatdiv ~F = 0 except at the origin. If the surface encloses the origin, theflux is 4π, otherwise, the flux is
0. SoQ1 = Q4 = 0
Q2 = Q3 = Q5 = Q6 = 4π.
314 CHAPTER TWENTY Hughes Hallett et al c©2005, John Wiley & Sons
4. Are the following statements true or false? The vector field ~F is defined everywhere in a regionW bounded by a surfaceS.
(a) If div ~F > 0 at all points ofW , then the vector field~F points outward at all points ofS.(b) If div ~F > 0 at all points ofW , then the vector field~F points outward at some points ofS.(c) If
∫
S~F · d ~A > 0, thendiv ~F > 0 at some points ofW .
ANSWER:
(a) False. A counterexample is given by~F = x~i , with W the solid cube1 ≤ x, y, z ≤ 2, andS the boundary surfaceof W . We havediv ~F = 1 > 0. But ~F points inward on the square face ofS wherex = 1, outward on the facewherex = 2, and tangent to the other four faces.
(b) True. By the Divergence Theorem,∫
Wdiv ~F dV =
∫
S~F · d ~A . Sincediv ~F > 0 at all points ofW , we have
∫
Wdiv ~F dV > 0. This means that
∫
S~F · d ~A > 0, which is impossible if~F is tangent toS or points inward at
every point ofS. Thus~F points outward at some point ofS.(c) True. By the Divergence Theorem,
∫
Wdiv ~F dV =
∫
S~F · d ~A > 0. The integral
∫
Wdiv ~F dV can not be positive
if div ~F is zero or negative at all points ofW . Thusdiv ~F is positive at some point ofW .
ConcepTests and Answers and Comments for Section 20.3
1. Of the following vector fields, which ones have a curl whichis parallel to one of the axes? Which axis?
(a) y~i − x~j + z~k (b) y~i + z~j + x~k (c) −z~i + y~j + x~k(d) x~i + z~j − y~k (e) z~i + x~j + y~k
ANSWER:
(a)
curl(y~i − x~j + z~k ) =
∣
∣
∣
∣
∣
∣
∣
~i ~j ~k∂
∂x∂∂y
∂∂z
y −x z
∣
∣
∣
∣
∣
∣
∣
= −2~k
(b)
curl(y~i + z~j + x~k ) =
∣
∣
∣
∣
∣
∣
∣
~i ~j ~k∂
∂x∂
∂y∂∂z
y z x
∣
∣
∣
∣
∣
∣
∣
= −~i −~j − ~k
(c)
curl(−z~i + y~j + x~k ) =
∣
∣
∣
∣
∣
∣
∣
~i ~j ~k∂
∂x∂∂y
∂∂z
−z y x
∣
∣
∣
∣
∣
∣
∣
= −2~j
(d)
curl(x~i + z~j − y~k ) =
∣
∣
∣
∣
∣
∣
∣
~i ~j ~k∂
∂x∂∂y
∂∂z
x z −y
∣
∣
∣
∣
∣
∣
∣
= −2~i
(e)
curl(z~i + x~j + y~k ) =
∣
∣
∣
∣
∣
∣
∣
~i ~j ~k∂
∂x∂∂y
∂∂z
z x y
∣
∣
∣
∣
∣
∣
∣
=~i +~j + ~k
So (a), (c), (d) are parallel to thez-, y-, andx-axes, respectively.
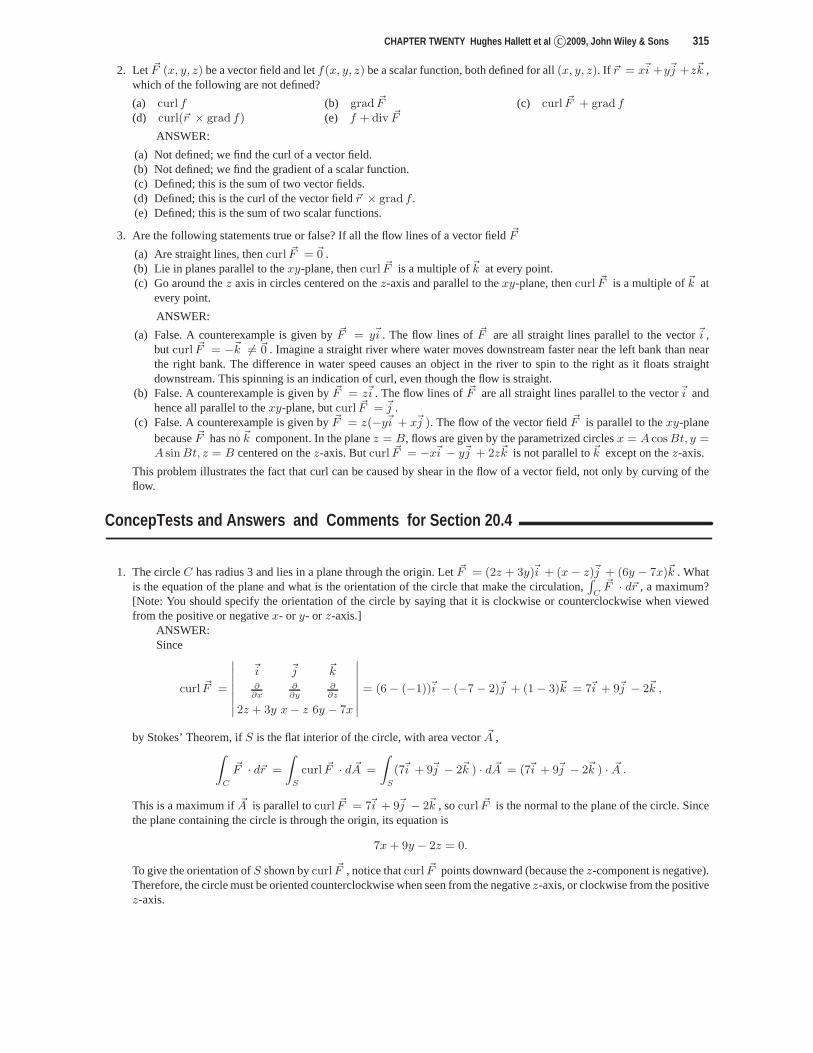
CHAPTER TWENTY Hughes Hallett et al c©2009, John Wiley & Sons 315
2. Let ~F (x, y, z) be a vector field and letf(x, y, z) be a scalar function, both defined for all(x, y, z). If ~r = x~i +y~j +z~k ,which of the following are not defined?
(a) curl f (b) grad ~F (c) curl ~F + grad f(d) curl(~r × grad f) (e) f + div ~F
ANSWER:
(a) Not defined; we find the curl of a vector field.(b) Not defined; we find the gradient of a scalar function.(c) Defined; this is the sum of two vector fields.(d) Defined; this is the curl of the vector field~r × grad f .(e) Defined; this is the sum of two scalar functions.
3. Are the following statements true or false? If all the flow lines of a vector field~F
(a) Are straight lines, thencurl ~F = ~0 .(b) Lie in planes parallel to thexy-plane, thencurl ~F is a multiple of~k at every point.(c) Go around thez axis in circles centered on thez-axis and parallel to thexy-plane, thencurl ~F is a multiple of~k at
every point.
ANSWER:
(a) False. A counterexample is given by~F = y~i . The flow lines of~F are all straight lines parallel to the vector~i ,but curl ~F = −~k 6= ~0 . Imagine a straight river where water moves downstream faster near the left bank than nearthe right bank. The difference in water speed causes an object in the river to spin to the right as it floats straightdownstream. This spinning is an indication of curl, even though the flow is straight.
(b) False. A counterexample is given by~F = z~i . The flow lines of~F are all straight lines parallel to the vector~i andhence all parallel to thexy-plane, butcurl ~F = ~j .
(c) False. A counterexample is given by~F = z(−y~i + x~j ). The flow of the vector field~F is parallel to thexy-planebecause~F has no~k component. In the planez = B, flows are given by the parametrized circlesx = A cos Bt, y =A sin Bt, z = B centered on thez-axis. Butcurl ~F = −x~i − y~j + 2z~k is not parallel to~k except on thez-axis.
This problem illustrates the fact that curl can be caused by shear in the flow of a vector field, not only by curving of theflow.
ConcepTests and Answers and Comments for Section 20.4
1. The circleC has radius 3 and lies in a plane through the origin. Let~F = (2z + 3y)~i + (x− z)~j + (6y − 7x)~k . Whatis the equation of the plane and what is the orientation of thecircle that make the circulation,
∫
C~F · d~r , a maximum?
[Note: You should specify the orientation of the circle by saying that it is clockwise or counterclockwise when viewedfrom the positive or negativex- or y- or z-axis.]
ANSWER:Since
curl ~F =
∣
∣
∣
∣
∣
∣
∣
~i ~j ~k∂
∂x∂
∂y∂∂z
2z + 3y x− z 6y − 7x
∣
∣
∣
∣
∣
∣
∣
= (6− (−1))~i − (−7− 2)~j + (1− 3)~k = 7~i + 9~j − 2~k ,
by Stokes’ Theorem, ifS is the flat interior of the circle, with area vector~A ,∫
C
~F · d~r =
∫
S
curl ~F · d ~A =
∫
S
(7~i + 9~j − 2~k ) · d ~A = (7~i + 9~j − 2~k ) · ~A .
This is a maximum if~A is parallel tocurl ~F = 7~i + 9~j − 2~k , socurl ~F is the normal to the plane of the circle. Sincethe plane containing the circle is through the origin, its equation is
7x + 9y − 2z = 0.
To give the orientation ofS shown bycurl ~F , notice thatcurl ~F points downward (because thez-component is negative).Therefore, the circle must be oriented counterclockwise when seen from the negativez-axis, or clockwise from the positivez-axis.

316 CHAPTER TWENTY Hughes Hallett et al c©2005, John Wiley & Sons
2. Without evaluating them, decide which of the following integrals have the same value.
(a)∫
Scurl(y3~i + z3~j − x3~k ) · d ~A whereS is the diskx2 + y2 ≤ 2, z = 3, oriented upward.
(b)∫
Scurl(y3~i + z3~j − x3~k ) · d ~A whereS is the top half of the spherex2 + y2 + (z − 3)2 = 2, oriented upward.
(c)∫
C(y3~i + z3~j −x3~k ) ·d~r whereC is the circlex2 + y2 = 2, z = 3, oriented counterclockwise when viewed from
above.(d)
∫
Scurl(y3~i + z3~j − x3~k ) · d ~A whereS is the disky2 + z2 ≤ 2, x = 3, oriented away from the origin.
ANSWER:All four integrals are equal. Integrals (a) and (b) are both equal to integral (c) by Stokes’ Theorem. We have
curl(y3~i + z3~j − x3~k ) =
∣
∣
∣
∣
∣
∣
∣
~i ~j ~k∂
∂x∂∂y
∂∂z
y3 z3 −x3
∣
∣
∣
∣
∣
∣
∣
= −3z2~i + 3x2~j − 3y2~k .
In part (a),d ~A = ~k dx dy, so Stokes’ Theorem shows that the integrals in (a), (b), (c)are all given by
Integral (a) =
∫
x2+y2≤2,z=3
(−3z2~i + 3x2~j − 3y2~k ) · ~k dx dy =
∫
x2+y2≤2
−3y2dx dy.
Applying Stokes’ Theorem to the integral in (d), whered ~A =~i dy dz, we have
Integral (d) =
∫
y2+z2≤2,x=3
(−3z2~i + 3x2~j − 3y2~k ) ·~i dy dz =
∫
y2+z2≤2
−3z2dy dz.
By substitutingy for z andx for y in the integral for (d), we see that the integrals for (a) and (d) are equal. Thus, all fourintegrals have the same value.
COMMENT:Is the common value of the integral positive or negative? (Answer: negative.) Find the value of the integral. (Requires
the integral table or numerical methods.)

CHAPTER TWENTY Hughes Hallett et al c©2009, John Wiley & Sons 317
3. Figure 20.1 shows the vector fieldcurl ~F at points of a disk; no formula for the vector field~F is given. The orientedcurveC is a circle, perpendicular tocurl ~F . The line integral
∫
C~F · d~r is
(a) Positive(b) Negative(c) Zero(d) Can’t tell without further information.
curl ~F
C
Figure 20.1
ANSWER:(b) By Stokes’ Theorem
∫
C~F · d~r =
∫
Scurl ~F · d ~A , whereS is the circular disk bounded byC and the surface
S is oriented downward, with orientation normal vector~n . Sincecurl ~F points to the opposite side ofS from~n at everypoint ofS, the flux integral ofcurl ~F throughS is negative. Thus, the line integral of~F overC is also negative.

318 CHAPTER TWENTY Hughes Hallett et al c©2005, John Wiley & Sons
4. Figure 20.2 shows the vector field~F at points of a disk. The surfaceS is oriented upward and perpendicular to~F atevery point. The flux ofcurl ~F through the surface,
∫
Scurl ~F · d ~A is
(a) Positive(b) Negative(c) Zero(d) Can’t tell without further information
~F
S
Figure 20.2
ANSWER:(c) By Stokes’ theorem
∫
Scurl ~F ·d ~A =
∫
C~F ·d~r whereC is the oriented path along the boundary (circumference)
of the diskS. Since~F is perpendicular to the direction ofC at every point ofC, the line integral of~F overC is zero.Thus, the flux integral ofcurl ~F throughS is also zero.
ConcepTests and Answers and Comments for Section 20.5
1. Letf(x, y, z) be a scalar function with continuous second partial derivatives. Let ~F (x, y, z) be a vector field with con-tinuous second partial derivatives. Which of the followingquantities are identically zero?
(a) curl grad f (b) ~F × curl ~F (c) grad div ~F (d) div curl ~F (e) div grad f
ANSWER:
(a) is zero, since, for example,∂
∂z
(
∂f
∂y
)
− ∂
∂y
(
∂f
∂z
)
= 0.
(b) is not zero. Let~F = x~j + x~k , then
curl ~F =
∣
∣
∣
∣
∣
∣
∣
~i ~j ~k∂
∂x∂∂y
∂∂z
0 x x
∣
∣
∣
∣
∣
∣
∣
= −~j + ~k ,
so ~F × curl ~F 6= ~0 .
(c) has components like∂
∂x
(
∂F1
∂x+
∂F2
∂y+
∂F3
∂z
)
, not zero.
(d) is zero, since∂
∂x
(
∂F3
∂y− ∂F2
∂z
)
+∂
∂y
(
∂F1
∂z− ∂F3
∂x
)
+∂
∂z
(
∂F2
∂x− ∂F1
∂y
)
= 0.
(e) is∂2f
∂x2+
∂2f
∂y2+
∂2f
∂z2, not zero.

CHAPTER TWENTY Hughes Hallett et al c©2009, John Wiley & Sons 319
Problems 2–3 concern the following integrals:I1 =
∫
Scurl(y3~i + z3~j + x3~k ) · d ~A , whereS is the spherex2 + y2 + (z − 4)2 = 9.
I2 =∫
Cgrad(y3 + z3 + x3) · d~r , whereC is the circlex2 + (y − 4)2 = 9, z = 5, oriented counterclockwise when viewed
from above.I3 =
∫
Wdiv(grad(x2 + y2 + z2)) dV , whereW is the interior of the spherex2 + y2 + (z − 4)2 ≤ 9.
I4 =∫
Cgrad div(x3~i + y3~j + z3~k ) · d~r , whereC is the line from(0, 0, 0) to (1, 2, 3).
2. Without calculating any of them, decide which of the integralsI1, I2, I3, I4 are 0.ANSWER:Since the integral of a curl vector field over a closed surfacegives 0, we knowI1 = 0. Since the integral of a gradient
vector field around a closed curve gives 0, we knowI2 = 0. The other integrals are not zero
3. Calculate the integralsI1, I2, I3, I4.ANSWER:I1 = 0, since the surface is closed.I2 = 0, since the curve is closed.Sincegrad(x2 + y2 + z2) = 2x~i + 2y~j + 2z~k , we havediv grad(x2 + y2 + z3) = 2 + 2 + 2 = 6, so
I3 =
∫
W
6 dV = 6 · Volume ofV = 6 · 43π33 = 216π.
Sincediv(x3~i + y3~j + z3~k ) = 3x2 + 3y2 + 3z2, by the Fundamental Theorem of Line Integrals, we know thatI4 isthe difference in the values of the potential function,3x2 + 3y2 + 3z2, at the end points:
I4 =
∫
C
grad(3x2 + 3y2 + 3z2) · d~r = 3x2 + 3y2 + 3z2
∣
∣
∣
∣
(1,2,3)
(0,0,0)
= 42.