Calling the Greek Referendum on the Nose with …ftp.iza.org/dp9569.pdf · IZA Discussion Paper No....
12
Forschungsinstitut zur Zukunft der Arbeit Institute for the Study of Labor DISCUSSION PAPER SERIES Calling the Greek Referendum on the Nose with Google Trends IZA DP No. 9569 December 2015 Nikos Askitas
Transcript of Calling the Greek Referendum on the Nose with …ftp.iza.org/dp9569.pdf · IZA Discussion Paper No....

Forschungsinstitut zur Zukunft der ArbeitInstitute for the Study of Labor
DI
SC
US
SI
ON
P
AP
ER
S
ER
IE
S
Calling the Greek Referendum on the Nosewith Google Trends
IZA DP No. 9569
December 2015
Nikos Askitas

Calling the Greek Referendum on the Nose
with Google Trends
Nikos Askitas IZA
Discussion Paper No. 9569 December 2015
IZA
P.O. Box 7240 53072 Bonn
Germany
Phone: +49-228-3894-0 Fax: +49-228-3894-180
E-mail: [email protected]
Any opinions expressed here are those of the author(s) and not those of IZA. Research published in this series may include views on policy, but the institute itself takes no institutional policy positions. The IZA research network is committed to the IZA Guiding Principles of Research Integrity. The Institute for the Study of Labor (IZA) in Bonn is a local and virtual international research center and a place of communication between science, politics and business. IZA is an independent nonprofit organization supported by Deutsche Post Foundation. The center is associated with the University of Bonn and offers a stimulating research environment through its international network, workshops and conferences, data service, project support, research visits and doctoral program. IZA engages in (i) original and internationally competitive research in all fields of labor economics, (ii) development of policy concepts, and (iii) dissemination of research results and concepts to the interested public. IZA Discussion Papers often represent preliminary work and are circulated to encourage discussion. Citation of such a paper should account for its provisional character. A revised version may be available directly from the author.

IZA Discussion Paper No. 9569 December 2015
ABSTRACT
Calling the Greek Referendum on the Nose with Google Trends* In a bold and risky political move the Greek prime minister Alexis Tsipras called for a referendum on June 27 2015 quitting ongoing negotiations with Greece’s creditors in Brussels. The referendum framed as a yes or no question asked the Greek voters to decide whether or not they approve or reject the latest take-it-or-leave-it proposal for “program continuation” by Greece’s creditors. What followed was a chaotic week leading to the referendum with intense campaigning by the two camps. Due to tense debates and increasing polarisation it became increasingly impossible to rely on traditional polling. Even the first exit polls (performed by phone on Sunday evening) could only see a marginal lead for one or the other vote at different times. Quite possibly people were jumping party lines and were unwilling to reveal their preferences. Using Google Trends I could tap into voters’ true and unbiased revealed preferences and nowcast hourly what the ratio of the No vote to the Yes vote is and called an over 60% No vote well ahead of the closing of the voting urns. In this paper I document this nowcasting exercise. JEL Classification: D72, G34 Keywords: nowcasting, Greek Referendum, greferendum, exit polls, complexity,
behaviour, data science, computational social science, complex systems Corresponding author: Nikos Askitas Institute for the Study of Labor (IZA) Schaumburg-Lippe-Strasse 5-9 53113 Bonn Germany E-mail: [email protected]
* I would like to thank Konstantinos Tatsiramos for a very useful critical reading of the manuscript. Opinions and errors are mine.

2 N. ASKITAS
1. INTRODUCTION
On the 25th of January 2015 the left-wing party of ΣΥΡΙΖΑ, campaigning on an anti-austerity platform, won the general elections in Greece and quickly formed a coalition govern-ment with, what many perceived to be an unlikely partner, right wing ΑΝΕΛ. On February20, 2015 a first preliminary agreement was reached between the new Greek government andthe country’s creditors which was based on the now infamous concept of ”creative vagueness”(language which would allow all sides to claim a victory while crafting a ”honorable” com-promise). The months which followed proved that belief to be overly optimistic if not flatout wrong. Turning that first agreement into a concrete joint plan proved impossible as itrevealed the unbridged differences between the two sides. Ever since we have been witnessinglong and fruitless negotiations between the Institutions formerly known as ”Troika” and theGreek government.
Negotiations came to an end when Greek prime minister Alexis Tsipras claiming an impassein the negotiations surprised friends and foes, quit the negotiations and flew home from Brusselson June 26. In the wee hours of June 27 he called for a referendum on the last take-it-or-leave-it proposal from the creditors: a vote of yes would mean that the voter accepts that lastultimatum while a vote of no would mean the opposite.
Amid concerns of constitutionality of the referendum1 and conflicting attempts to frame a novote both as identical with an exit from the eurozone but also as the best chance to stay in itthe referendum took place with remarkable stoicism on behalf of the public. In the meantimea bank run over the weekend following Tsipras’ departure from Brussels forced the greekgovernment to enforce capital controls and a week long banking holiday, starting Monday, at atime when thousands of pensioners were expecting their pensions, which complicated matterseven more. Several European representatives as well as Greek opposition parties called for ayes vote while the prime minister himself, his party and their coalition partner called for a novote. A number of ΑΝΕΛ members of parliament defected from party line and contributed to ahighly complex and unpredictable situation. In the meantime the country’s creditors withdrewthe offer which was the basis for the referendum leading many to argue that the referendumwas baseless.
In this extremely complicated situation where emotion, contagion, national pride, existentialanxiety and economic despair are intertwined, behaviour and consensus formation becomes acomplex system which is out of reach of traditional polling, also because revealed preferencesneed not persist in time or need not be faithfully represented. This is the type of situationwhere a small slice of Big Data available at high frequencies and in a timely fashion can showits strength.
Using hourly data of Google searches2 for yes and no respectively I am able to get to the
1Due both to its short notice and the fact that the Greek constitution does not allow a referendum on fiscalmatters
2During a discussion with Nikos Tachtsidis, a staffer at the Greek Presidency, I started thinking aboutwhether or not I could nowcast this situation. On the 5th of July at 18:59 hrs, one minute because votingended, I tweeted: (@askitas) "My 2 cents: 60% NO is "on the table". Selection bias (picking up
the young) might cause this to be off #Greferendum" pointing to a blog post of mine at http://www.

CALLING THE GREFERENDUM 3
true preferences of the voter population (while polls could get to only the revealed ones) andhence identify good proxies for intent to vote yes or no respectively. This allowed me to quiteaccurately forecast the No vote, which was the vote whose prevalence the entire world wasinterested in.
Askitas and Zimmermann (2015b) compile a good portion of social science research usingInternet data but to the best of my knowledge there are no forecasting papers using hourlyGoogle Trends data. There are of course such papers using hourly twitter data for examplesuch as Botta et al. (2015) which also studies behavioural complexity or Cunha et al. (2014)which like we do studies voting.
The rest of the paper is structured as follows. In Section 2 I describe the data while in Section3 I discuss a selection of relevant events and explain how the data predicts the outcome. Section4 draws come conclusions.
2. DATA
Before proceeding to describe the data some background information is necessary to betterexplain how I arrived at choosing my time series. Around midnight of June 26 rumours surfacedof an imminent call to a referendum by the Greek government on the ultimatum the creditorshad put on the table. In the wee hours of June 27 shortly before 4 AM the Greek premier A.Tsipras made the rumours official indeed. On Sunday June 28th at 4:00 AM the parliamentapproved the referendum: in just six days the voter body was called to cast a yes or no vote ona complex draft of macroeconomic planning. In the meantime over the weekend a bank run wasunfolding as masses of people were driving around in search of ATMs which would dispensecash. Reports had it that the ATMs were drying up but at the same time trust in the mediawas deteriorating rapidly3. We were nearing the final part of the so called ”left parenthesis”4.
In the afternoon of that same Sunday reports surfaced that a combination of capital controlsand a week long banking holiday is imminent. At 21:00 hrs A. Tsipras spoke on TV insistingon the referendum, we have only our fear to fear he said. The stage was set. Come Mondaybanks were closed, capital controls were in place pensioners were lining up to get fragments oftheir already depleted pensions and EU president J.C. Juncker was calling the greeks to voteyes ”no matter what the question was”.
As polls don’t work, revealed preferences are both volatile and untrustworthy, trust in themedia is waning and polarisation intensifies how can we put an ear on the ground to sensewhat’s going on? Looking at Google Trends and at searches containing ναί the Greek word for
askitas.com/2015/07/05/greferendum-now/. As it turned out the final count of the NO vote was 61.31%and no professional pollster saw it coming. The entire world was looking at Greece between June 26 and July 5wondering what the result of the referendum will be. It continues to do so at this writing pondering over whatthe no vote can buy but this is a different story which goes beyond this paper.
3According to the Eurobarometer as of November 2014 80% of the Greek people don’t trust Television, 60%don’t trust radio and 38% mistrust the internet.
4A plan commonly attributed to A. Samaras the country’s previous prime minister according to which helet Tsipras come to power (something which seemed inevitable at the end of 2014) expecting his left-winggovernment to fall apart under the impossibility of meeting the country’s financial obligations come July 2015and hence recapture power.

4 N. ASKITAS
yes and όχι the greek word for no we can only conclude that the searches are becoming moreintense by the day as we are approaching the referendum and they peak around midnight.Moreover the top searches contained both ναί and όχι. All of them were of the sort yes or
no referendum revealing only that people were trying to get information on the upcomingreferendum.
The time series of searches containing yes without containing no and searches that containno without containing yes: ‘οχι -ναι’ and ‘ναι -οχι’ were more promising. These timeseries appeared to indeed capture the no and yes voters as they were searches trying to findout where and when a demonstration or a concert in favour of these votes was taking place orwhich prominent people were for this or that vote. In other words these searches appeared tobe searches by people whose mind was made up and they were trying to locate like mindedones and events or platforms were they could express themselves (this can nicely and clearlybe read off of Figure 3 where the No demonstrations occur at the peak of a surge of the nosearches relative to the yes searches).
The time series I looked at was exactly these ‘οχι -ναι’ and ‘ναι -οχι’. I used GoogleTrends (https://www.google.com/trends/) setting the country to Greece and the time frameto“last seven days”. This gives us hourly data for the last seven days and are available by thehour. The downside is that the hourly data cannot exceed the last seven days. I took howeverthree measurements: one early on and two later and glued them together to prolong the series.For the forecasting exercise we do not need the prolongation. We only use hourly data between4:00 AM on June 28 at which point the parliament votes the referendum into effect and 7:00AM on July 5 at which point voting starts. It is however useful in order to get a better morecomplete understanding of our time series. The time series looks as follows.

CALLING THE GREFERENDUM 5
01ju
l201
5 03
:00:
44
03ju
l201
5 13
:00:
41
020
4060
8010
0
27jun2015 04:53:20
29jun2015 12:26:40
01jul2015 20:00:00
04jul2015 03:33:20
06jul2015 11:06:40
hour by hour
yes noData Collection by N. Askitas
Google Searches in Greece
Figure 1.— YES searches are ¨ναι -οχι’ and NO searches are ¨οχι -ναι’
The time series is hourly and is updated by the hour. So one can really do nowcasting with hourly frequencyof incoming results. It is clear from the graph that for most of the time except a few hours in the middle theNO searches were more than the YES searches. Data Source: Google Trends (www.google.com/trends).
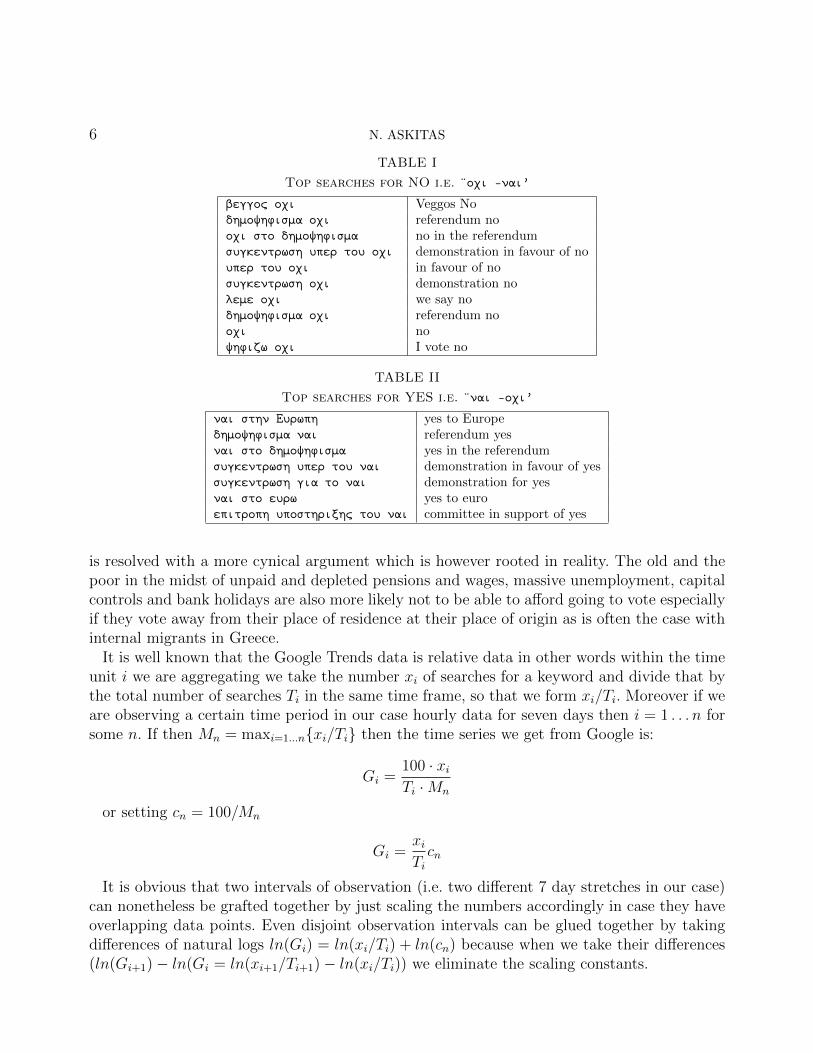
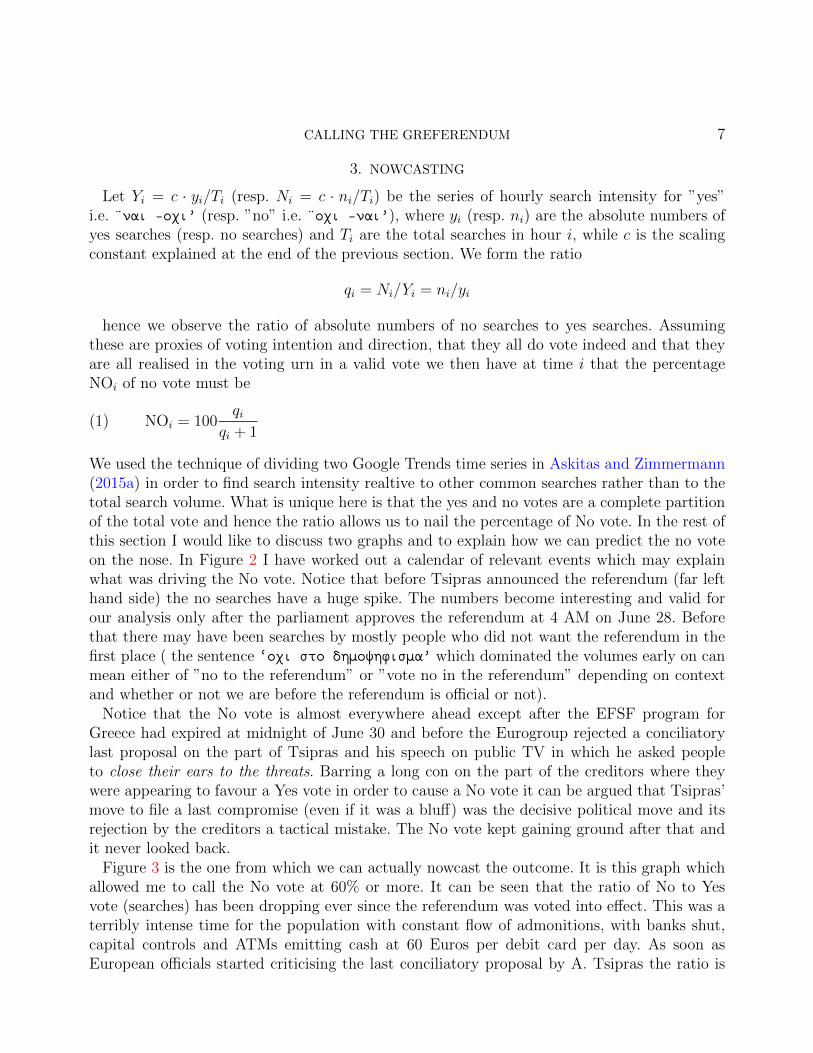
For completeness I am providing the tables of the top searches of each category in originalGreek and in translation. One keyword is of particular cultural importance. The search βεγγος
οχι is trying to locate a scene in a greek tragicomedy involving Veggos a legendary greekcomedic actor who plays a voter in a referendum shouting No while he is bombarded with Yesand physically abused.
The tables establish that it would not be a far fetched claim that our time series capture thesupporters of the yes and no vote. Two issues need to be discussed however.
The first issue is that yes or no searches may also exist which are not relevant to the refer-endum and which are also counted in our time series. The counterargument which convincedme to continue is that firstly if there are such searches they are probably tiny compared tothose relevant to such a pressing issue (as can be seen by the right hand side of Figure 1 afterthe vote the numbers drop close to zero) and secondly there is no reason to assume that theseirrelevant searches are not distributed in some uniform way across the two options.
The second issue is that of selection. Most of the internet activity comes from around Athens(as I could see in Google Trends) and we are not capturing the poor and the old (who aremost likely not online). With almost half of the Greek population living in Athens it is nosurprise that it dominates internet activity. This means though that Athens is a 50% sampleof Greece. Since most of the population in Athens are internal migrants with ties, friends andfamily to their place of origin we can easily view them as sampled from across Greece. Theremaining problem that we are probably not capturing the old and the poor (who are offline)
6 N. ASKITAS
TABLE I
Top searches for NO i.e. ¨οχι -ναι’
βεγγος οχι Veggos Noδημοψηφισμα οχι referendum noοχι στο δημοψηφισμα no in the referendumσυγκεντρωση υπερ του οχι demonstration in favour of noυπερ του οχι in favour of noσυγκεντρωση οχι demonstration noλεμε οχι we say noδημοψηφισμα οχι referendum noοχι noψηφιζω οχι I vote no
TABLE II
Top searches for YES i.e. ¨ναι -οχι’
ναι στην Ευρωπη yes to Europeδημοψηφισμα ναι referendum yesναι στο δημοψηφισμα yes in the referendumσυγκεντρωση υπερ του ναι demonstration in favour of yesσυγκεντρωση για το ναι demonstration for yesναι στο ευρω yes to euroεπιτροπη υποστηριξης του ναι committee in support of yes
is resolved with a more cynical argument which is however rooted in reality. The old and thepoor in the midst of unpaid and depleted pensions and wages, massive unemployment, capitalcontrols and bank holidays are also more likely not to be able to afford going to vote especiallyif they vote away from their place of residence at their place of origin as is often the case withinternal migrants in Greece.
It is well known that the Google Trends data is relative data in other words within the timeunit i we are aggregating we take the number xi of searches for a keyword and divide that bythe total number of searches Ti in the same time frame, so that we form xi/Ti. Moreover if weare observing a certain time period in our case hourly data for seven days then i = 1 . . . n forsome n. If then Mn = maxi=1...n{xi/Ti} then the time series we get from Google is:
Gi =100 · xi
Ti ·Mn
or setting cn = 100/Mn
Gi =xi
Ti
cn
It is obvious that two intervals of observation (i.e. two different 7 day stretches in our case)can nonetheless be grafted together by just scaling the numbers accordingly in case they haveoverlapping data points. Even disjoint observation intervals can be glued together by takingdifferences of natural logs ln(Gi) = ln(xi/Ti) + ln(cn) because when we take their differences(ln(Gi+1)− ln(Gi = ln(xi+1/Ti+1)− ln(xi/Ti)) we eliminate the scaling constants.
CALLING THE GREFERENDUM 7
3. NOWCASTING
Let Yi = c · yi/Ti (resp. Ni = c · ni/Ti) be the series of hourly search intensity for ”yes”i.e. ¨ναι -οχι’ (resp. ”no” i.e. ¨οχι -ναι’), where yi (resp. ni) are the absolute numbers ofyes searches (resp. no searches) and Ti are the total searches in hour i, while c is the scalingconstant explained at the end of the previous section. We form the ratio
qi = Ni/Yi = ni/yi
hence we observe the ratio of absolute numbers of no searches to yes searches. Assumingthese are proxies of voting intention and direction, that they all do vote indeed and that theyare all realised in the voting urn in a valid vote we then have at time i that the percentageNOi of no vote must be
(1) NOi = 100qi
qi + 1
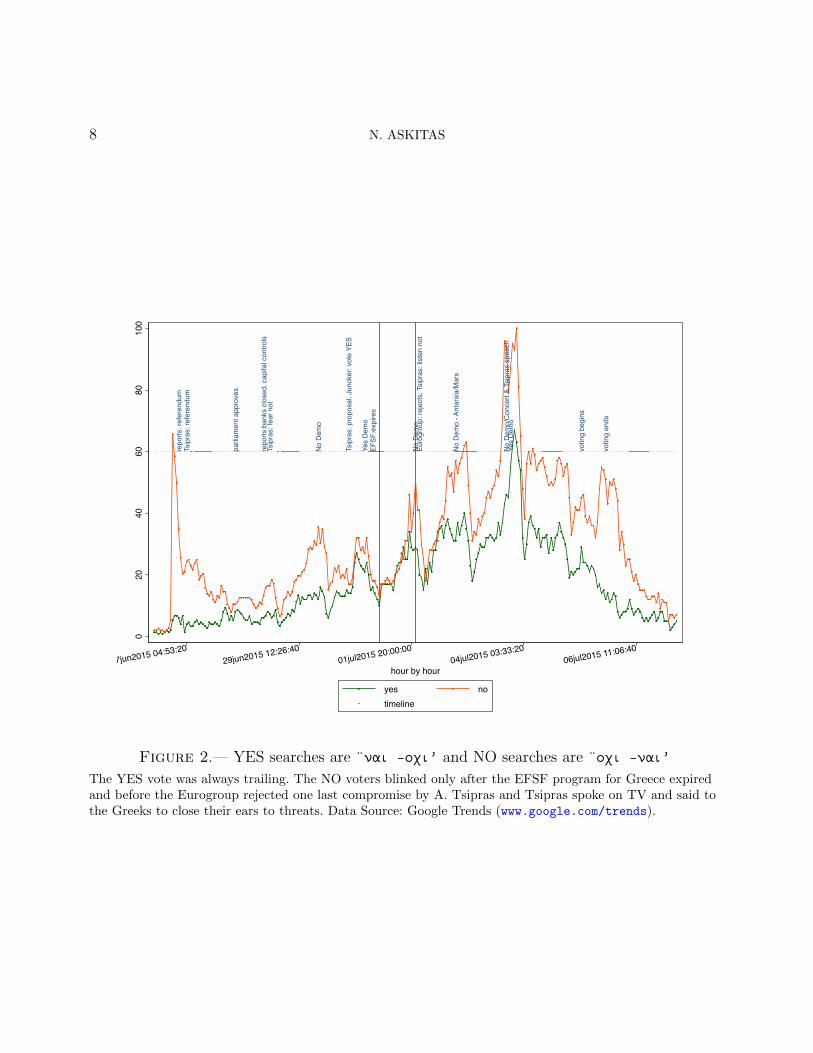
We used the technique of dividing two Google Trends time series in Askitas and Zimmermann(2015a) in order to find search intensity realtive to other common searches rather than to thetotal search volume. What is unique here is that the yes and no votes are a complete partitionof the total vote and hence the ratio allows us to nail the percentage of No vote. In the rest ofthis section I would like to discuss two graphs and to explain how we can predict the no voteon the nose. In Figure 2 I have worked out a calendar of relevant events which may explainwhat was driving the No vote. Notice that before Tsipras announced the referendum (far lefthand side) the no searches have a huge spike. The numbers become interesting and valid forour analysis only after the parliament approves the referendum at 4 AM on June 28. Beforethat there may have been searches by mostly people who did not want the referendum in thefirst place ( the sentence ‘οχι στο δημοψηφισμα’ which dominated the volumes early on canmean either of ”no to the referendum” or ”vote no in the referendum” depending on contextand whether or not we are before the referendum is official or not).
Notice that the No vote is almost everywhere ahead except after the EFSF program forGreece had expired at midnight of June 30 and before the Eurogroup rejected a conciliatorylast proposal on the part of Tsipras and his speech on public TV in which he asked peopleto close their ears to the threats. Barring a long con on the part of the creditors where theywere appearing to favour a Yes vote in order to cause a No vote it can be argued that Tsipras’move to file a last compromise (even if it was a bluff) was the decisive political move and itsrejection by the creditors a tactical mistake. The No vote kept gaining ground after that andit never looked back.
Figure 3 is the one from which we can actually nowcast the outcome. It is this graph whichallowed me to call the No vote at 60% or more. It can be seen that the ratio of No to Yesvote (searches) has been dropping ever since the referendum was voted into effect. This was aterribly intense time for the population with constant flow of admonitions, with banks shut,capital controls and ATMs emitting cash at 60 Euros per debit card per day. As soon asEuropean officials started criticising the last conciliatory proposal by A. Tsipras the ratio is
8 N. ASKITAS
repo
rts: r
efer
endu
mTs
ipra
s: re
fere
ndum
parli
amen
t app
rove
s
repo
rts:b
anks
clo
sed,
cap
ital c
ontro
lsTs
ipra
s: fe
ar n
ot
No
Dem
o
Tsip
ras:
pro
posa
l, Ju
ncke
r: vo
te Y
ES
Yes
Dem
oEF
SF:e
xpire
s
No
Dem
oEu
rogr
oup:
reje
cts,
Tsi
pras
: lis
ten
not
No
Dem
o - A
ntar
sia/
Mar
s
No
Dem
o/C
once
rt &
Tsip
ras
spee
chYe
s D
emo
votin
g be
gins
votin
g en
ds
020
4060
8010
0
27jun2015 04:53:2029jun2015 12:26:40
01jul2015 20:00:0004jul2015 03:33:20
06jul2015 11:06:40
hour by hour
yes notimeline
Figure 2.— YES searches are ¨ναι -οχι’ and NO searches are ¨οχι -ναι’
The YES vote was always trailing. The NO voters blinked only after the EFSF program for Greece expiredand before the Eurogroup rejected one last compromise by A. Tsipras and Tsipras spoke on TV and said tothe Greeks to close their ears to threats. Data Source: Google Trends (www.google.com/trends).

CALLING THE GREFERENDUM 9
surging again and after his proposal was rejected and he appeared on TV he had locked thevictory and he only had to play the game to the end without any mistakes. Hours after themoving average of the No to Yes vote surged above the 1.5 line it never dropped below again.The value of 1.5 is simply the maximum ratio that was upheld for the longest time beforevoting started which however local minima of the hourly time series kept approaching fromabove again and again without ever reaching or crossing (right hand side of Figure 3).
parli
amen
t app
rove
s
repo
rts:b
anks
clo
sed,
cap
ital c
ontro
lsTs
ipra
s: fe
ar n
ot
No D
emo
Tsip
ras:
pro
posa
l, Ju
ncke
r: vo
te Y
ES
Yes
Dem
oEF
SF:e
xpire
s
No D
emo
Euro
grou
p: re
ject
s, T
sipra
s: lis
ten
not
No D
emo
- Ant
arsia
/Mar
s
No D
emo/
Conc
ert &
Tsip
ras
spee
chYe
s De
mo
votin
g be
gins
12
34
5
28jun2015 02:00:4429jun2015 05:47:24
30jun2015 09:34:0401jul2015 13:20:44
02jul2015 17:07:2403jul2015 20:54:04
05jul2015 00:40:44
hour by hour
NO divided by YES 24h moving avgevents
Figure 3.— YES searches are ¨ναι -οχι’ and NO searches are ¨οχι -ναι’. The ratio ofNo to Yes votes and its 24 hour moving average.
The moving average bottoms out on July 1st at 1.143911 and increases ever since crossing the line y = 1.5 onJuly 3 at 13:00 hrs. It never dropped below 1.5 after that point. Data Source: Google Trends(www.google.com/trends).
The reader can now figure out that setting qi = 1.5 in equation 1 produces NOi = 605.
5I tweeted my prediction to @mark carrigan at 10:26 on July 5 and shortly after that I emailed K. F.Zimmermann my prediction. I tweeted it publicly at 3:39 PM, to @D Blanchflower at 5:41 PM and at 18:59PM one minute before closing of voting I tweeted that am calling it ”60%” for No. At 7:23 PM Greek TVreported that based on 7.4% of the vote the No vote comes slightly under 60%. Nikos Tachtsidis whom I alsosent the result to one minute before closing of the vote and who, in disbelief, replied that exit polls are callingit only marginally for No contacted me soon after the first TV report placed the no vote close to 60% to

10 N. ASKITAS
So to summarise. Our identification strategy was to look at searches containing yes withoutno and those that contain no with yes. We established that the top searches are a) relevant tothe referendum and b) partial to the corresponding vote. Moreover by looking at such searchesbefore the referendum emerged and days after it was completed we established that those ofthe yes and no searches that had no relation to the referendum were of insignificant volume(besides the reasonable assumption that they must be uniformly shared). Hence our two timeseries are reasonably good candidates for proxies of the corresponding vote and our empiricalexercise proved this to be right.
4. CONCLUSIONS
This paper is the first to our knowledge to use the hourly ”last seven days” option of GoogleTrends and I suggest that this option ought to be explored more by researchers. I used asmall slice of big data and a lot of intuition (in lack of better access to search microdata) tocreate a simple live nowcasting of the Greek referendum. The simplicity of the yes/no voteand the fact that people wanted to join demonstrations in support of their own convictionworked to my advantage and hence I could nicely capture the ratio of one vote to the other.This paper is a small data vignette to demonstrate that in a situation of breaking news andwild dynamics where behaviour is complex and professional polling is unable to perform wellI could forecast the result of the referendum which took place in short notice and in highlyvolatile circumstances on the nose.
REFERENCES
Askitas, N. and K. F. Zimmermann (2015a): “Health and well-being in the great recession,” InternationalJournal of Manpower, 36, 26–47.
——— (2015b): “The internet as a data source for advancement in social sciences,” International Journal ofManpower, 36, 2–12.
Botta, F., H. S. Moat, and T. Preis (2015): “Quantifying crowd size with mobile phone and Twitterdata,” Royal Society Open Science, 2.
Cunha, E., G. Magno, M. A. Gonalves, C. Cambraia, and V. Almeida (2014): “He Votes or SheVotes? Female and Male Discursive Strategies in Twitter Political Hashtags,” PLoS ONE, 9, e87041.
congratulate me at which point I doubled down: it is going to settle well above 60% I said. The final resultcame in at 61.31%. I have also produced 4 relevant blog posts on my site at http://www.askitas.com