California’s Energy Future The View to 2050 -...
80
California’s Energy Future - The View to 2050 Moderator: John Weyant, Precourt Energy Efficiency Center Panelists: Jane Long, Lawrence Livermore National Lab Jeff Greenblatt, Lawrence Berkeley National Lab Heather Youngs, UC Berkeley #SVEnergy2011
Transcript of California’s Energy Future The View to 2050 -...

California’s Energy Future -
The View to 2050
Moderator: John Weyant, Precourt Energy Efficiency Center
Panelists: Jane Long, Lawrence Livermore National Lab
Jeff Greenblatt, Lawrence Berkeley National Lab
Heather Youngs, UC Berkeley
#SVEnergy2011

Silicon Valley Energy Summit,
Stanford University24 June 2011
Jane C. S. LongHeather YoungsJeff Greenblatt

Presenters
Jane Long
Introduction, overview and main results
Heather Youngs
Biomass and biofuels
Jeff Greenblatt
Advanced strategies

California Context
• AB 32 Requires reducing GHG emissions to 1990 levels by 2020 - a reduction of about 25 percent,
• Governor’s executive order S-3-05 (2005) requires an 80 percent reduction below 1990 levels by 2050.
• We must go from 480 mmT CO2e today to 80 mmT CO2e in 40 years
• “Existence proof”: Can it be done, and what needs to change to allow us to get there?
• Focus on technology, GHG emissions and other impacts, not economics
Approach
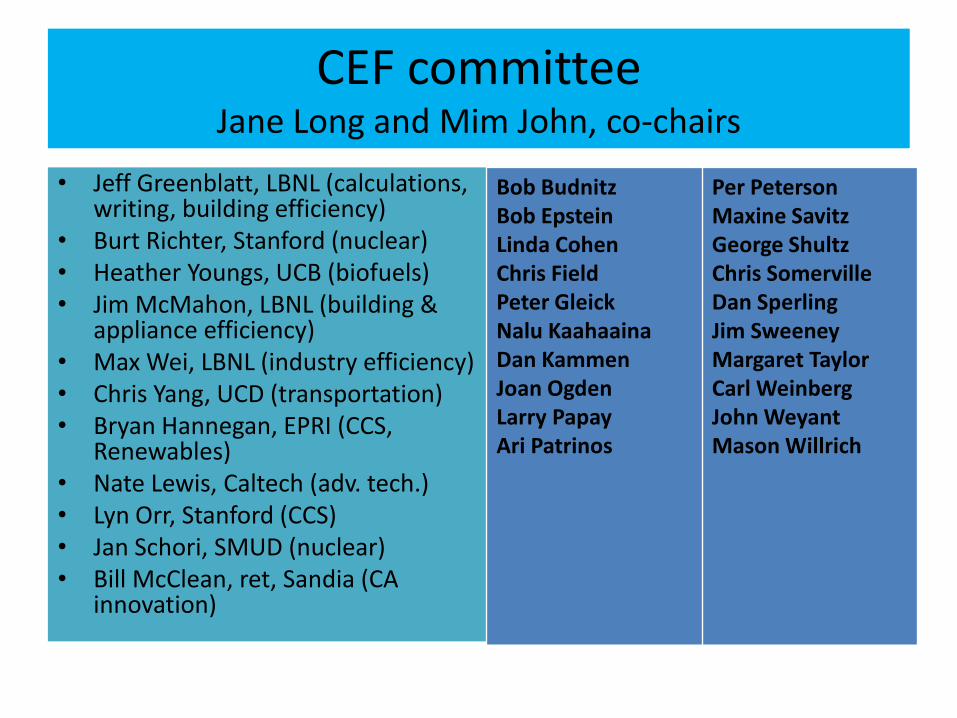
CEF committeeJane Long and Mim John, co-chairs
• Jeff Greenblatt, LBNL (calculations, writing, building efficiency)
• Burt Richter, Stanford (nuclear)• Heather Youngs, UCB (biofuels)• Jim McMahon, LBNL (building &
appliance efficiency)• Max Wei, LBNL (industry efficiency)• Chris Yang, UCD (transportation)• Bryan Hannegan, EPRI (CCS,
Renewables)• Nate Lewis, Caltech (adv. tech.)• Lyn Orr, Stanford (CCS)• Jan Schori, SMUD (nuclear)• Bill McClean, ret, Sandia (CA
innovation)
Bob BudnitzBob EpsteinLinda CohenChris FieldPeter GleickNalu KaahaainaDan KammenJoan OgdenLarry PapayAri Patrinos
Per PetersonMaxine SavitzGeorge ShultzChris SomervilleDan SperlingJim SweeneyMargaret TaylorCarl WeinbergJohn WeyantMason Willrich

The short answer: Yes, we can
• We can achieve 80% cuts in emissions and still meet our energy needs.
• We can get ~60% of the cuts with technology we largely know about.– Technology in use today or in demonstration. – Deployment will depend more on policy.
• Remaining emissions are due to remaining fossil fuel use
• We can get the rest of the cuts to 80% below 1990, but this will require new technology innovation and development.
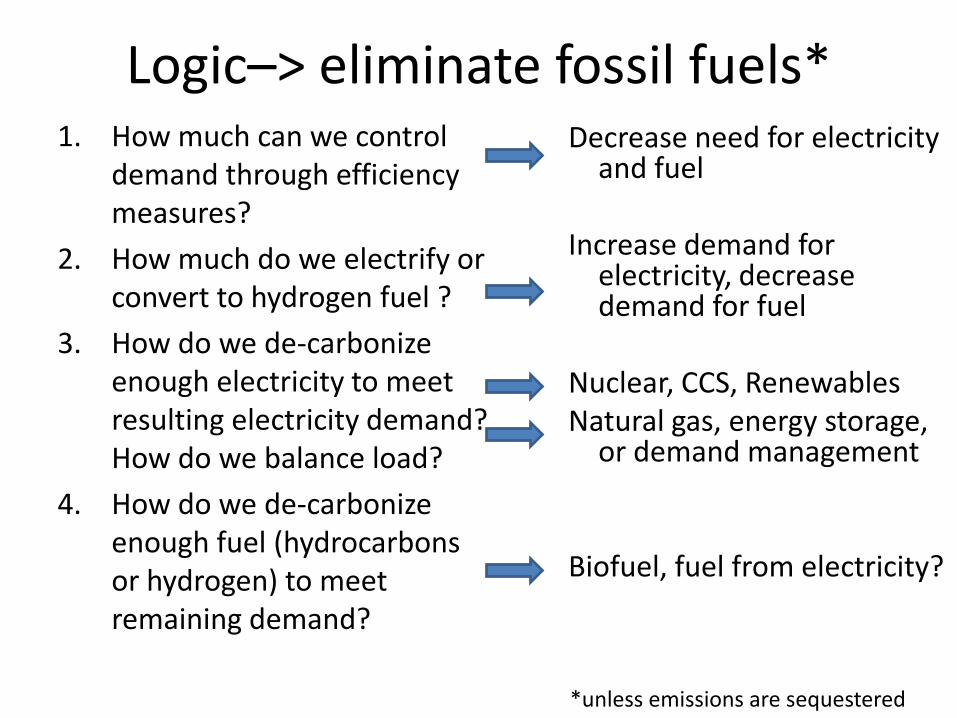
Logic–> eliminate fossil fuels*1. How much can we control
demand through efficiency measures?
2. How much do we electrify or convert to hydrogen fuel ?
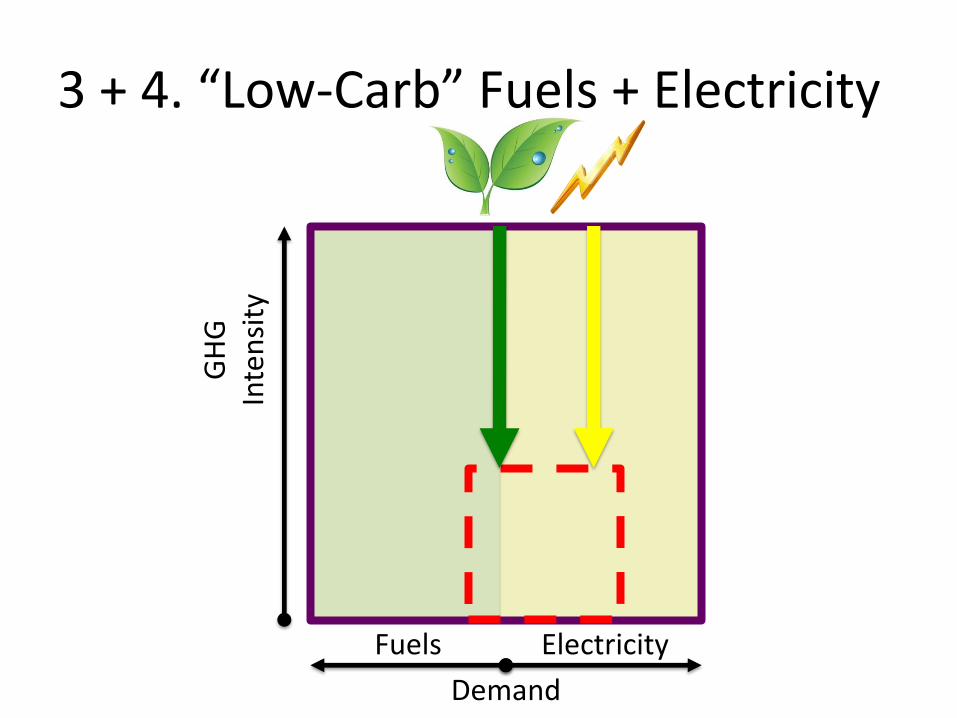
3. How do we de-carbonize enough electricity to meet resulting electricity demand? How do we balance load?
4. How do we de-carbonize enough fuel (hydrocarbons or hydrogen) to meet remaining demand?
Decrease need for electricity and fuel
Increase demand for electricity, decrease demand for fuel
Nuclear, CCS, RenewablesNatural gas, energy storage,
or demand management
Biofuel, fuel from electricity?
*unless emissions are sequestered
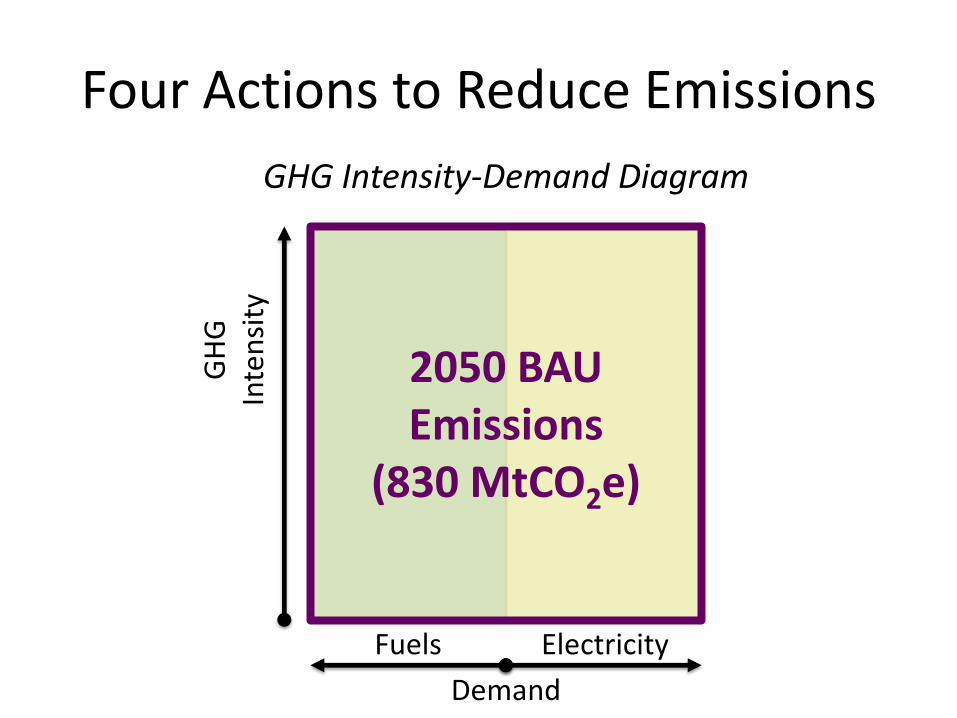
2050 BAU Emissions
(830 MtCO2e)
Demand
GH
G
Inte
nsi
ty
Fuels Electricity
Four Actions to Reduce Emissions
GHG Intensity-Demand Diagram

GH
G
Inte
nsi
ty
Demand
Fuels Electricity
1. Efficiency
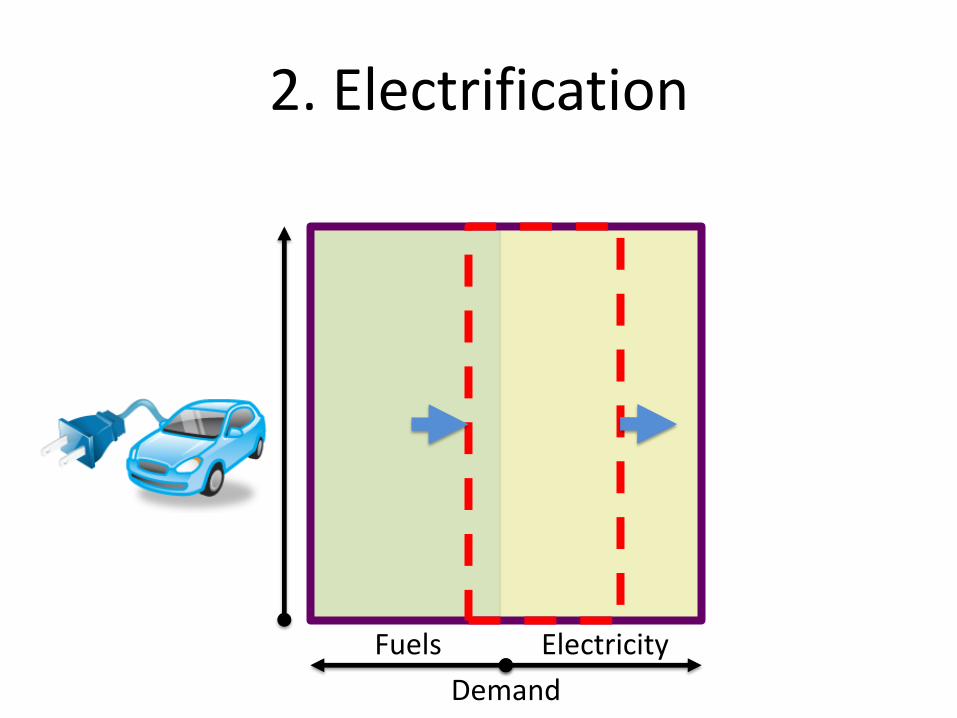
Demand
Fuels Electricity
2. Electrification
GH
G
Inte
nsi
ty
Demand
Fuels Electricity
3 + 4. “Low-Carb” Fuels + Electricity

“Low-Carb”Fuels + Electricity
GH
G
Inte
nsi
ty
Electrification Efficiency
Demand
Fuels Electricity
2050 Target Emissions
(80 MtCO2e)
Summary
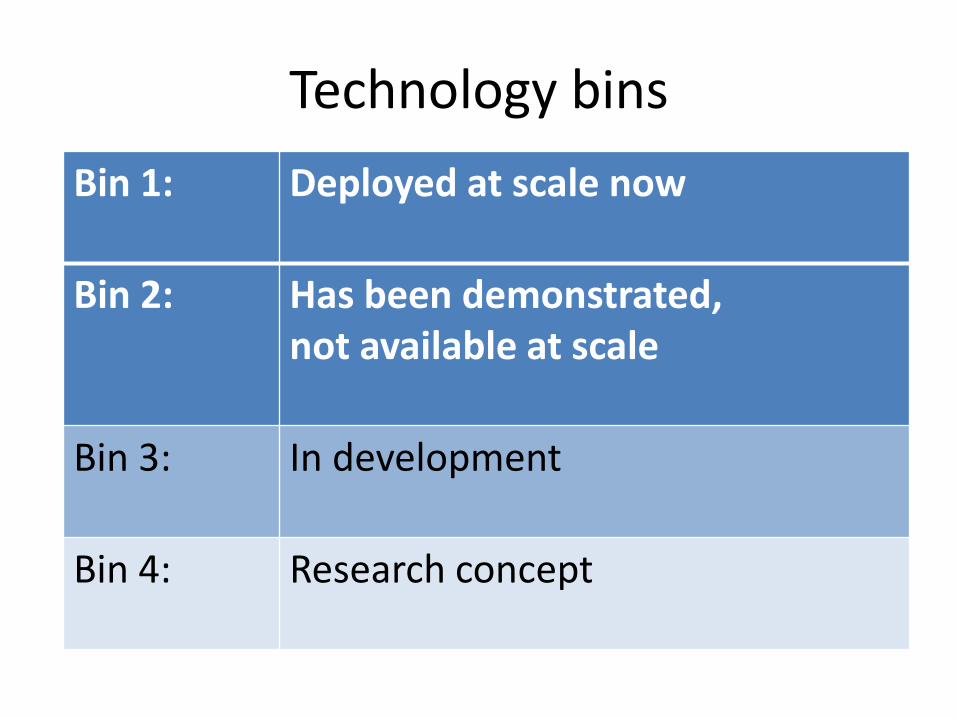
Technology bins
Bin 1: Deployed at scale now
Bin 2: Has been demonstrated,not available at scale
Bin 3: In development
Bin 4: Research concept

Three sectors of efficiencyand electrification
– Buildings
– Industry
– Transportation

Building efficiency
New
Retrofit
New
Retrofit
Cumulative energy decrease
Building stock turnover
Pre-2010New
Retrofit
Efficiency decrease in energy from BAU
Energ
y d
ecre
ase r
ela
tive t
o B
AU

Light-duty vehicle scenario
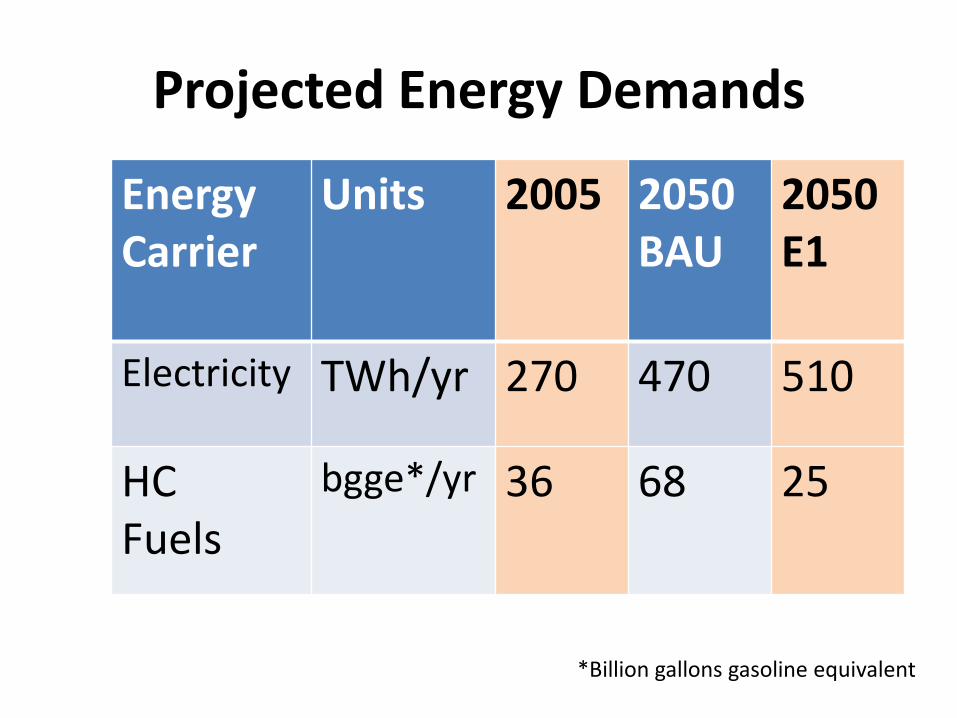
Projected Energy Demands
Energy Carrier
Units 2005 2050 BAU
2050 E1
Electricity TWh/yr 270 470 510
HCFuels
bgge*/yr 36 68 25
*Billion gallons gasoline equivalent

Double electricity and de-carbonize it
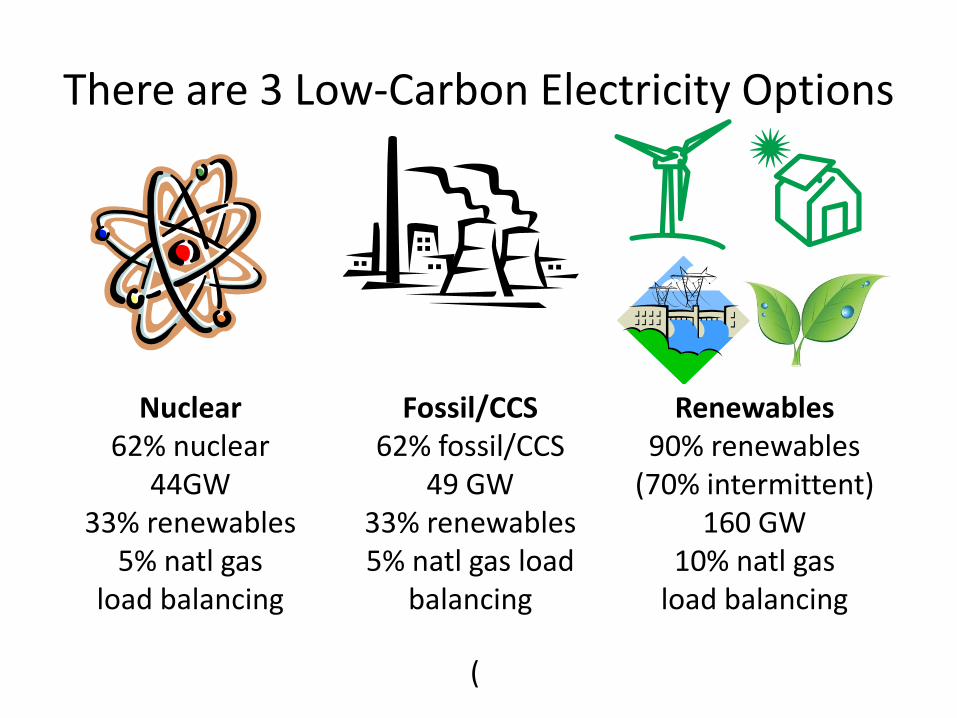
There are 3 Low-Carbon Electricity Options
Nuclear62% nuclear
44GW33% renewables
5% natl gas load balancing
Fossil/CCS62% fossil/CCS
49 GW 33% renewables5% natl gas load
balancing
Renewables90% renewables
(70% intermittent)160 GW
10% natl gasload balancing
(

Natural Gas*
Flexible LoadsEnergy Storage
Increasingemissions
More difficultto implement
Moreexpensive
Load balancing can add emissions:
* May be possible with CCS in future

Zero-Emission Load Balancing (ZELB)

ZELB
• More challenging for the maximum renewables case– GW-days of storage needed
– Smart grid solution is a challenge• Smart meter fiasco
• Completely change business model to demand follows load vs load follows demand
• Need whole different system of system control – but will this ever solve the GW-day problem?
• Would be easier to have significant baseload power– No more hydro likely
– Renew interest in geothermal energy
– Choose nuclear or CCS
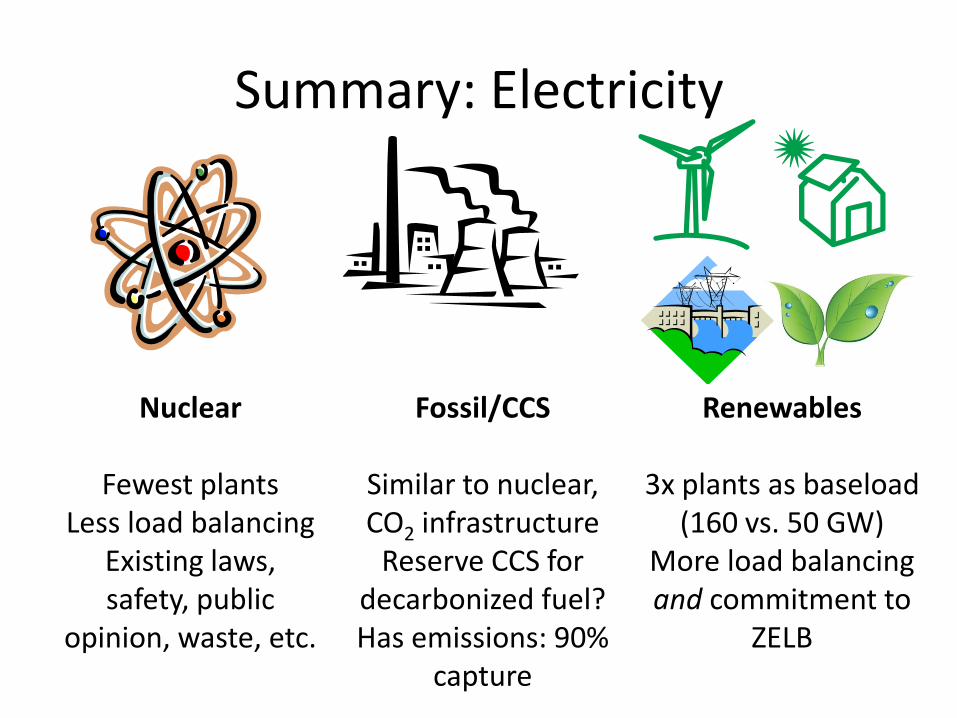
Summary: Electricity
Nuclear
Fewest plantsLess load balancing
Existing laws,safety, public
opinion, waste, etc.
Fossil/CCS
Similar to nuclear, CO2 infrastructure
Reserve CCS for decarbonized fuel?Has emissions: 90%
capture
Renewables
3x plants as baseload(160 vs. 50 GW)
More load balancing and commitment to
ZELB
The median electricity case
• About equal parts of nuclear/renewable/CCS
• A robust choice
• Meets current RPS, but doesn’t exceed it
• ZELB “WAG”: Assume
– ½ load balancing is without emissions
– ½ is with natural gas
• Almost all emissions from electricity are from load balancing

Are we going to have base load power?
• If yes, then:– Do we want to deal with the issues of nuclear poweror– Can we do CCS /fossil for baseload?
• If no, then– Accept the emissions associated with load balancing with
natural gas?– Commit to completely restructure the electric utility?)– Will there be a major breakthrough in energy storage
technology to handle GW-days of demand?– Should we decide to give up on electricity reliability?

• Can’t electrify– Heavy duty transport– Airplanes
• Plus fuel for– Load following– High quality heat
• Biofuels are the choice in the pipeline
Still need 27 billion gge/yr fuel that can’t have CCS

California Biomass

41-121mdt/yr
3-10bgge/yr
California Biomass

41-121mdt/yr
5.5bgge/yr
3 GW(2.0 bgge/yr)
+
7.5bgge/yr
+
Imported
Median Case

Biomass GHG Intensity and Supply

Historical and BAU Emissions

Getting to 60%: Any Single Action

Getting to 60%: Any 2 Actions

Getting to 60%: Any 3 Actions
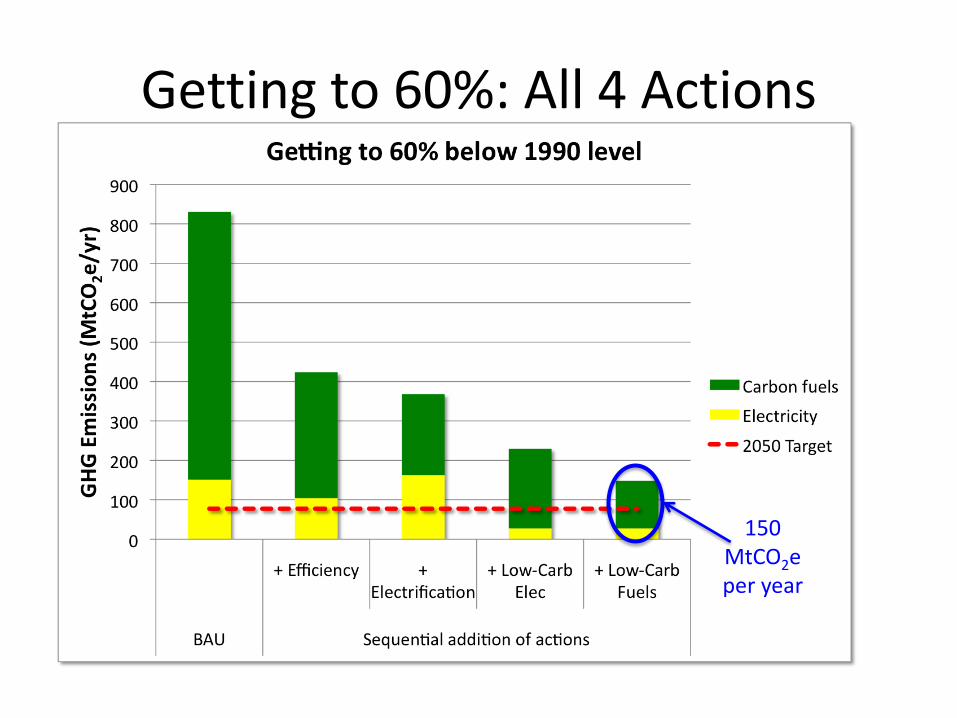
Getting to 60%: All 4 Actions
150MtCO2eper year
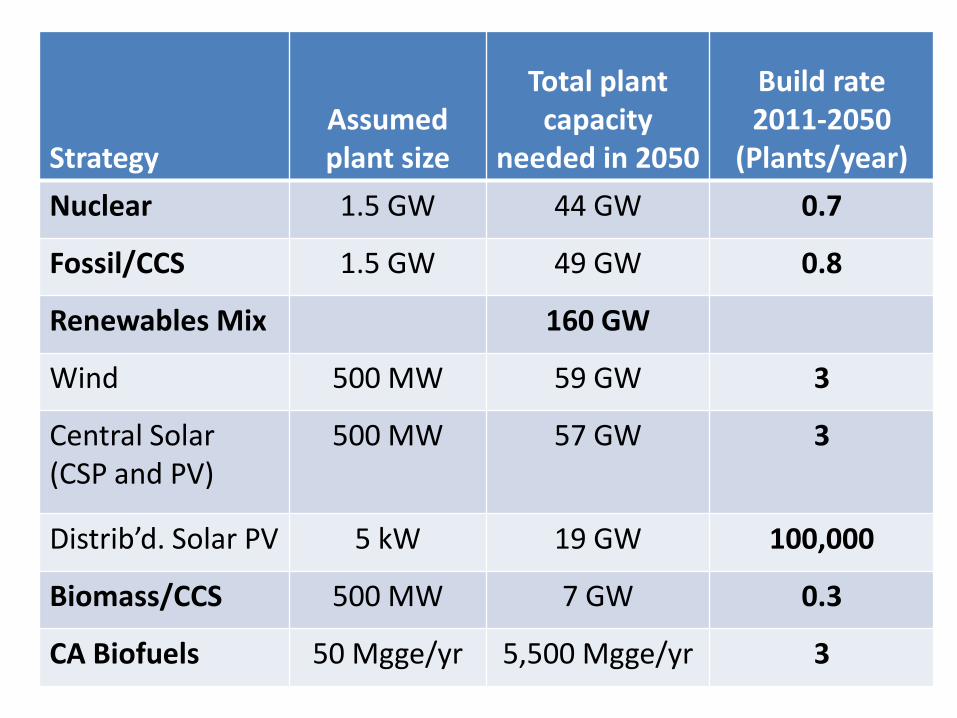
Strategy Requirements and build rate
Strategy Assumed plant size
Total plant capacity
needed in 2050
Build rate 2011-2050
(Plants/year)
Nuclear 1.5 GW 44 GW 0.7
Fossil/CCS 1.5 GW 49 GW 0.8
Renewables Mix 160 GW
Wind 500 MW 59 GW 3
Central Solar(CSP and PV)
500 MW 57 GW 3
Distrib’d. Solar PV 5 kW 19 GW 100,000
Biomass/CCS 500 MW 7 GW 0.3
CA Biofuels 50 Mgge/yr 5,500 Mgge/yr 3

Key challenges:
• Need aggressive efficiency and electrification– largely not a technology issue
• To baseload or not to baseload:– Load balancing without emissions needed for predominant
renewables portrait– Nuclear power and Fukushima incident or CCS?
• Biofuels are important, uncertain, and probably limited – more from Heather
• Getting to 80% below 1990 level requires advanced approaches – more from Jeff
Conclusions
• Yes, we can: Achieve 60% below 1990 level with technologies we largely know about
– The magnitude of the changes required and the pace of implementation will not occur without sustained and substantial capital investment and policy interventions.
• And yes we could do the whole 80% with significant innovation…

Median biofuel estimate
• CA has 3-10 bgge/yr from sustainable biomass– About 2 bgge/yr would go to electricity– Estimate about 5.5 bgge/yr would go to gaseous and
liquid fuel
• Estimate domestic plus international imports could be about 7.5 bgge (equal to biomass from CA)
• Estimate total ~13 bgge/yr = ~ ½ that required• Can improve carbon signature, but biomass
supply is likely a limitation in meeting all fuel needs

Buildings efficiency technologyBin
no.Space
conditioning and building envelope
Water heating Appliances Electronics Other
1 High efficiency
furnaces (including
heat pumps), high
efficiency air
conditioning
equipment,
occupancy
sensors, fiberglass
super-insulation, cool roofs
High efficiency
water heaters, on-
demand water heaters
Energy Star
appliances
(~20%), soil
sensing clothes-
and
dishwashers,
horizontal- axis
clothes washers,
high-spin clothes dryers
Automatic sleep
mode, more
efficient transformers
More efficient
motors and
fans, LED
lighting,
magnetic
induction
cooktops
2 Vacuum panel
insulation, whole-
building optimal
energy
management
Heat pump water
heaters, solar hot
water, waste heat
recovery, whole-
system integration
Higher efficiency
appliances (~40-
50%)
Network proxying Organic LED
lighting
3 Non-invasive
insulation retrofits
4 Magnetic
refrigeration
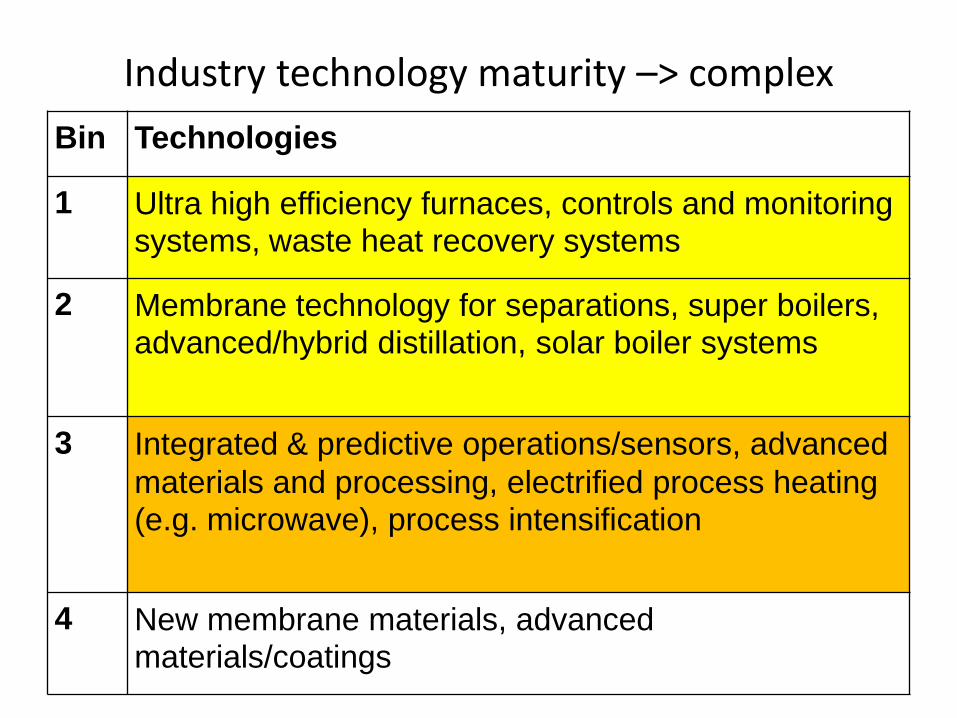
Industry technology maturity –> complex
Bin Technologies
1 Ultra high efficiency furnaces, controls and monitoring systems, waste heat recovery systems
2 Membrane technology for separations, super boilers, advanced/hybrid distillation, solar boiler systems
3 Integrated & predictive operations/sensors, advanced
materials and processing, electrified process heating (e.g. microwave), process intensification
4 New membrane materials, advanced materials/coatings
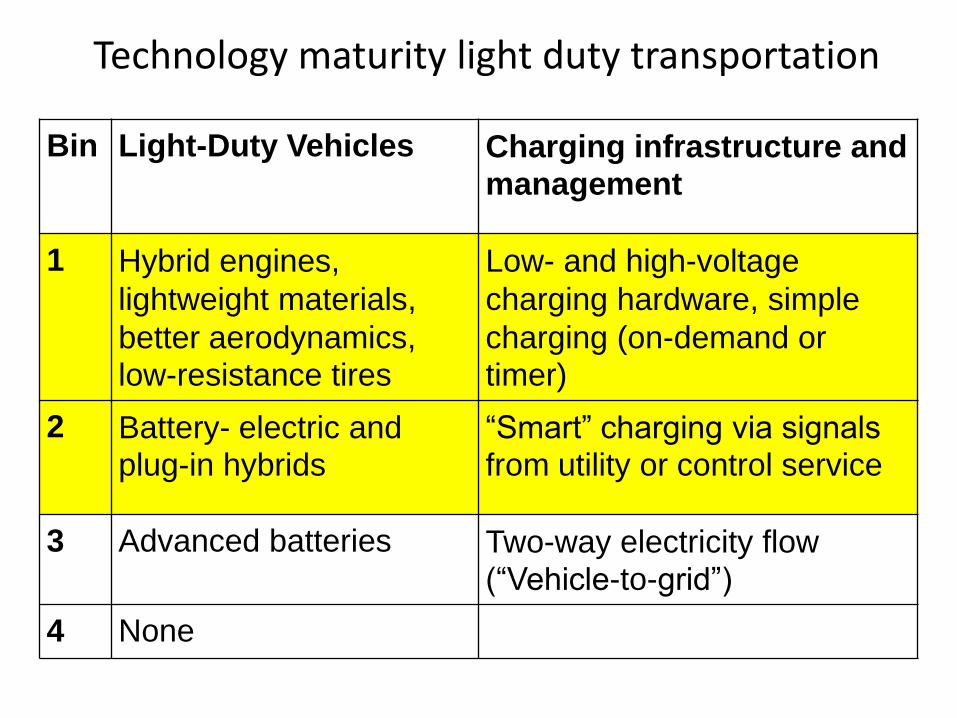
Technology maturity light duty transportation
Bin Light-Duty Vehicles Charging infrastructure and management
1 Hybrid engines,
lightweight materials,
better aerodynamics, low-resistance tires
Low- and high-voltage
charging hardware, simple
charging (on-demand or timer)
2 Battery- electric and plug-in hybrids
“Smart” charging via signals from utility or control service
3 Advanced batteries Two-way electricity flow (“Vehicle-to-grid”)
4 None

Nuclear and CCS technology binsBin Nuclear
Technology
Coal or Natural Gas CO2 Capture CO2 Storage
1 Generation III+
reactors
High-efficiency coal gasification, high-efficiency
natural gas combined cycle, ultra-supercritical
pulverized coal combustion, solid-oxide fuel cell
(SOFC), solvent separation
Injection into
oil/gas reservoirs
2 Small modular
reactors (LWR)
Post-combustion CO2 capture technologies with 90%
capture efficiency, integrated gasification systems
with CCS, amine solvent separation
Saline aquifer
injection
3 Generation IV
(including small
modular Na-
cooled reactors)
New capture methods with >90% effectiveness,
lower cost CO2 capture technologies of all kinds,
metal-organic framework separations, membrane
separation
Coal bed injection
4 None None Shale injection

Renewable technology binsBin Wind Concentra-
ted Solar
Power
(CSP)
Solar
Photovol-
taic (PV)
Geothermal Hydro
and
Ocean
Biomass
1 Onshore,
shallow
offshore
turbines
Parabolic
trough,
central
receiver
Silicon PV,
Thin-film
PV,
Concen-
trating PV
Conventional
geothermal
Conven-
tional
hydro
Coal/bio-
mass co-
firing,
direct fired
biomass
2 Dish Stirling Biomass
gasification
3 Floating
(deepwater)
offshore
turbines
”Third
generation”
PV
Wave,
tidal and
river
turbines
4 High-
altitude
wind
Enhanced
geothermal
systems
(EGS)
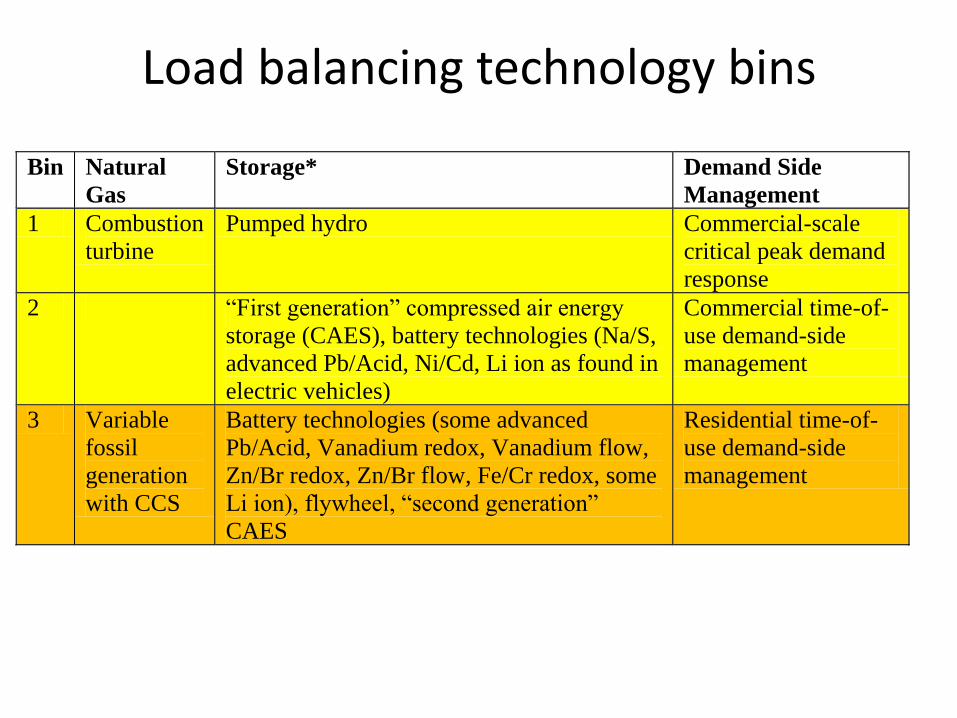
Load balancing technology bins
Bin Natural
Gas
Storage* Demand Side
Management
1 Combustion
turbine
Pumped hydro Commercial-scale
critical peak demand
response
2 “First generation” compressed air energy
storage (CAES), battery technologies (Na/S,
advanced Pb/Acid, Ni/Cd, Li ion as found in
electric vehicles)
Commercial time-of-
use demand-side
management
3 Variable
fossil
generation
with CCS
Battery technologies (some advanced
Pb/Acid, Vanadium redox, Vanadium flow,
Zn/Br redox, Zn/Br flow, Fe/Cr redox, some
Li ion), flywheel, “second generation”
CAES
Residential time-of-
use demand-side
management
Heather Youngs, PhDBioenergy AnalystUniversity of California, Berkeley
Youngs – California's Energy Future 2011

California Fuel Demand: 23 bgge
Youngs – California's Energy Future 2011
2050*
16
bb
ge
38
bb
ge
2006
2030
2050(doubling)
Effi
cien
cy +
El
ectr
ific
atio
n
Liquid Fuel
2005
2050(doubling)
23
.9 b
bge
(28
Bth
erm
s)2050*
7 b
bge
(0.8
Bth
erm
s)
Effi
cien
cy +
El
ectr
ific
atio
n
Gaseous Fuel (an additional 3-6 bgge could be required for electricity load balancing)

Need deep replacement of fuels to meet the GHG Goals
Youngs – California's Energy Future 2011

Assumptions behind decarbonizing fuel
– Decarbonizing fuel could be resource limited• Policy goal is 75% in-state production by 2050
• 60% available biomass residues are used (ag, forest, MSW)
• Limited energy crop production to 50% of abandoned agland and 50% unused timber land
• Imported biofuels are limited to equal the in-state supply
Youngs – California's Energy Future 2011

California Feedstocks: Plants
Agave
Youngs – California's Energy Future 2011
Eucalyptus – salt tolerantAgave - drought tolerant

Woody energy crops(0-20 mtons/yr)*
Woody residues(17-24 mtons/yr)
Herbaceous energy crops(4.5-21 mtons/yr)
Crop residues(4-7 mtons/yr)
MSW(10-40 mtons/yr)
Animal Waste(5.5-9 mtons/yr)
Municipal Wastewater(3 billion gallons per day)**
*technical recoverable yield (50-80% of gross biomass production depending on type)**not currently used for energy production
Biogas(220 Mtherms)
Liquid Biofuel(7.5 bgge)
Electricity(12 GW)
Cogeneration(125 plants)
1
2
Cogeneration(125 plants)
combustion
combustion
4
3
1.3 GW
2.5 bgge
3 bgge
6.6 x10¹² btu
10.8 x10¹² btu/yr
2 bgge
10 GW
4.5 x10¹² btu
0.7 GW
31 mtons/yr
10 mtons/yr
Decisions regarding biomass use
Youngs – California's Energy Future 2011
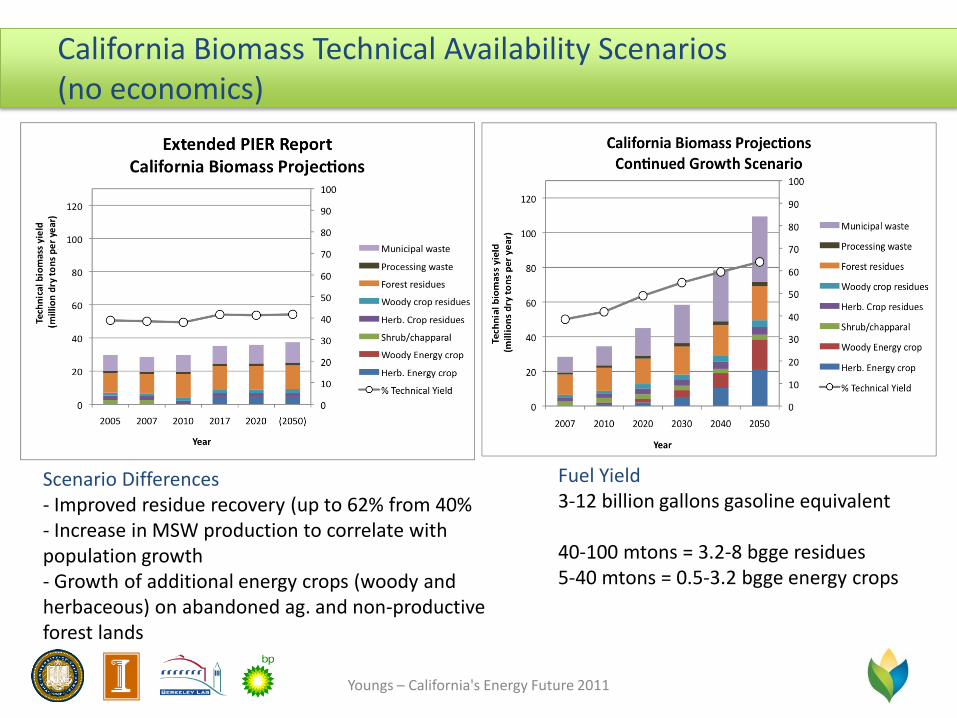
California Biomass Technical Availability Scenarios (no economics)
Youngs – California's Energy Future 2011
Fuel Yield3-12 billion gallons gasoline equivalent
40-100 mtons = 3.2-8 bgge residues5-40 mtons = 0.5-3.2 bgge energy crops
Scenario Differences- Improved residue recovery (up to 62% from 40%- Increase in MSW production to correlate with population growth- Growth of additional energy crops (woody and herbaceous) on abandoned ag. and non-productive forest lands

How much biofuel can be produced from CA resources?
Youngs – California's Energy Future 2011
• Policy goal is 75% in-state production by 2050 • Our projections indicate only 12-45% of high efficiency liquid fuel demand is possible from in-state resources without substantial effects on agriculture • California will likely have to import biofuels
(the state imported 73% of refined petroleum products in 2007and 96% of ethanol, mostly from the Midwest and Brazil)
• Limitations on biofuel production and import lead to fossil fuel use and increased GHG emissions
CA biomass (high yield)
10 bgge
Imported biofuel 13 bgge
Deficit load balancing 3-
6 bgge
(low yield)3.5 bgge
Imported biofuel
19.5 bgge)
Deficit load balancing 3-
6 bgge
CA biomass median
case7.5 bgge
Imported biofuel
7.5 bgge
Deficit Fossil Use
8 bgge
Deficit load balancing 3-
6 bgge
16
bb
ge2050 high efficiency
target(16 bgge)
23
bb
ge
2050 high eff. target
(7 bgge/0.8 Btherms)
7-1
3 b
bge
(0.8
-1.4
Qu
ads)
Liq
uid
fu
elG
aseo
us
fuel
Load balancing 60% 3 bgge
Load balancing 80% 3 bgge
29
bb
ge
Residues7.5 bgge
Enegycrops20 bgge
low median high max
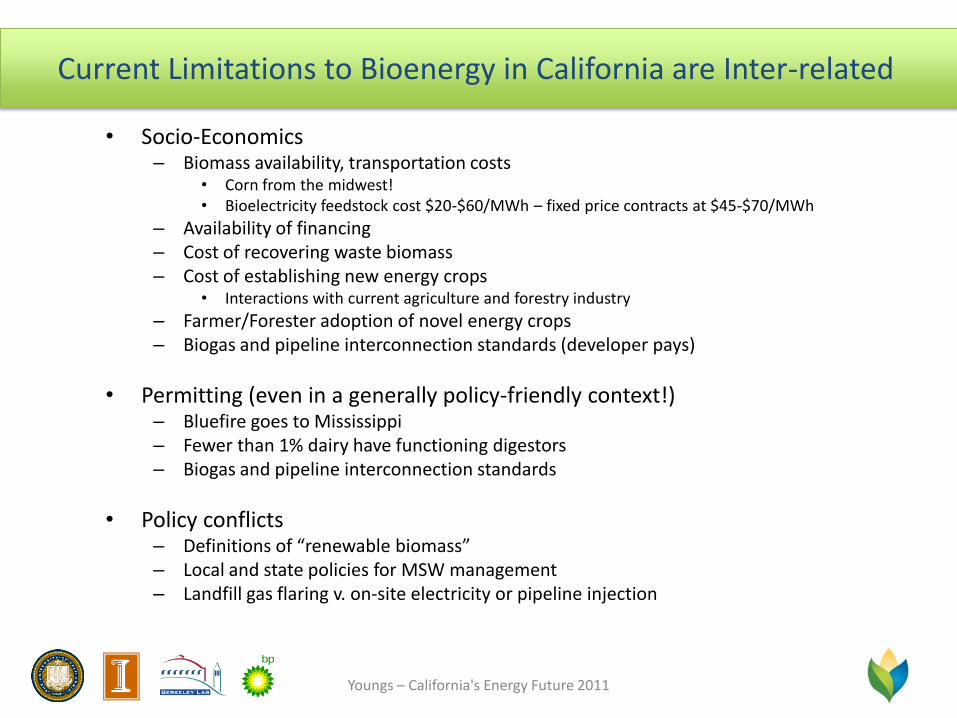
Current Limitations to Bioenergy in California are Inter-related
• Socio-Economics– Biomass availability, transportation costs
• Corn from the midwest!• Bioelectricity feedstock cost $20-$60/MWh – fixed price contracts at $45-$70/MWh
– Availability of financing – Cost of recovering waste biomass– Cost of establishing new energy crops
• Interactions with current agriculture and forestry industry
– Farmer/Forester adoption of novel energy crops– Biogas and pipeline interconnection standards (developer pays)
• Permitting (even in a generally policy-friendly context!)– Bluefire goes to Mississippi– Fewer than 1% dairy have functioning digestors– Biogas and pipeline interconnection standards
• Policy conflicts– Definitions of “renewable biomass”– Local and state policies for MSW management– Landfill gas flaring v. on-site electricity or pipeline injection
Youngs – California's Energy Future 2011
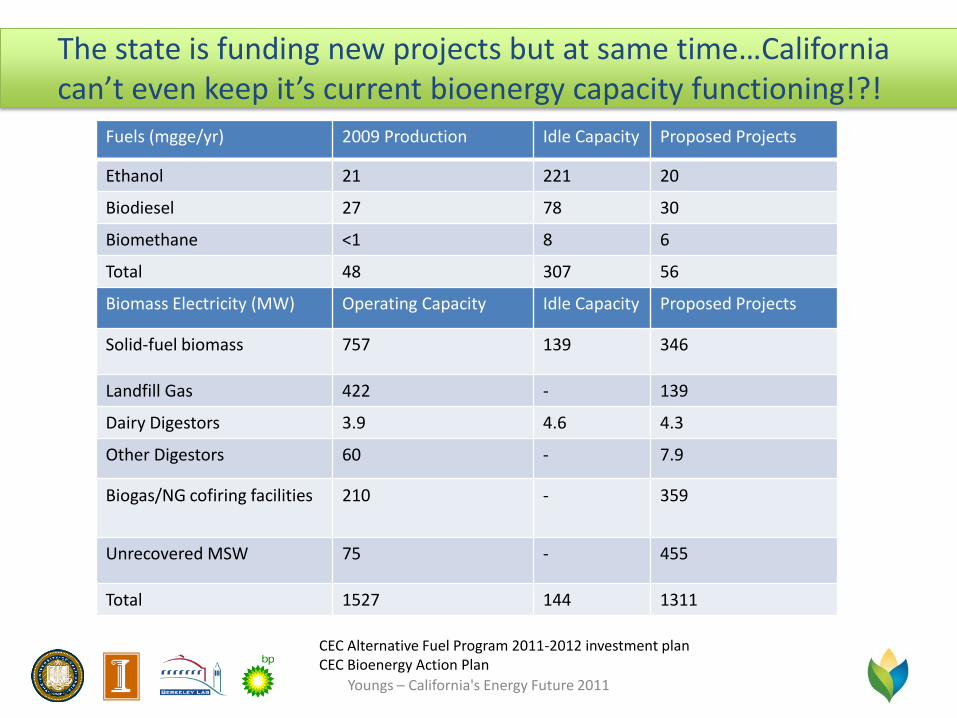
The state is funding new projects but at same time…California can’t even keep it’s current bioenergy capacity functioning!?!
Youngs – California's Energy Future 2011
Fuels (mgge/yr) 2009 Production Idle Capacity Proposed Projects
Ethanol 21 221 20
Biodiesel 27 78 30
Biomethane <1 8 6
Total 48 307 56
Biomass Electricity (MW) Operating Capacity Idle Capacity Proposed Projects
Solid-fuel biomass 757 139 346
Landfill Gas 422 - 139
Dairy Digestors 3.9 4.6 4.3
Other Digestors 60 - 7.9
Biogas/NG cofiring facilities 210 - 359
Unrecovered MSW 75 - 455
Total 1527 144 1311
CEC Alternative Fuel Program 2011-2012 investment planCEC Bioenergy Action Plan
Youngs – CA biofuels - AAAS 2011
0
1
2
3
4
5
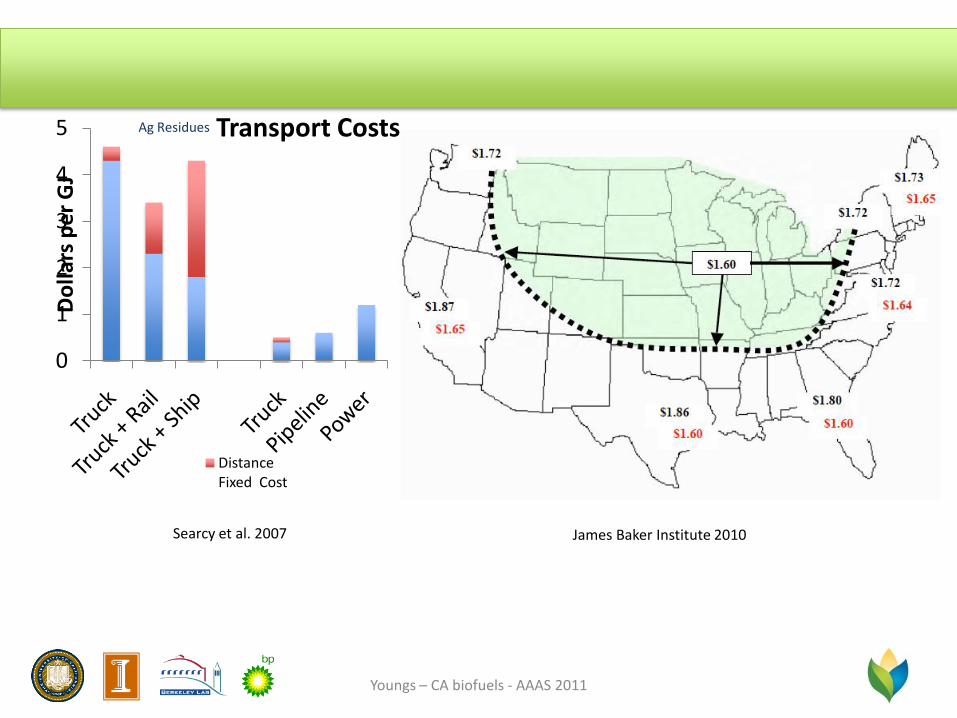
Do
llars
pe
r G
J
Transport Costs
Distance Fixed Cost
Ag Residues
Searcy et al. 2007 James Baker Institute 2010

Conclusions
• Bioenergy is emerging as a critical player in meeting California’s GHG goals– Required to provide baseload power if nuclear and CCS are off
the table (e.g woody biomass to electricity)
– Required as a replacement for natural gas to for industrial use and to provide firming of intermittant renewables such as wind and solar
– Required to decarbonize fuels
• Advanced (drop-in) biofuels from residues or low-input lignocellulosic residues do better than E85 and conventional biodiesel
• California will likely need to import at least half its biofuel(the state imported 73% of refined petroleum products in 2007and 96% of ethanol, mostly from the Midwest and Brazil)
Youngs – California's Energy Future 2011

Residues Alone are Not Enough
• Increase in-state biomass– Policy Need: Supports to adopt efficient, non-food bioenergy
crops on idle lands and encourage residue/waste biomass use– Risk: Inappropriate choices could have impacts on water
resources, soil quality, and ecosystem services
• Rely heavily on imported biofuels – Policy Need: Establish sustainable biomass/biofuel certification
standards (e.g. Council on Sustainable Biomass Production)– Risks: Difficult to enforce compliance and leakage (sources
produce low carbon fuel for CA but increase fossil use locally)
Youngs – California's Energy Future 2011
Two Choices

California’s Energy Future:Getting to 80% GHG Reductions
Jeffery GreenblattLawrence Berkeley National Laboratory
Silicon Valley Energy SummitStanford University
24 June 2011

Demand
80% Reduction Target
(77 MtCO2/yr)
Fossil Fuels
Bio-mass Fuels
60% ReductionPortrait
(150 MtCO2/yr)
Fuel Electricity
030 Ggge/yr 500 TWh/yr
Biomass electricity
NG/CCS
Natural Gas Load Following
Nuclear & Renewables
(net zero)
GH
G In
ten
sity
Rel
ati
ve P
erce
nta
ge
0%
100%

Strategies for Getting to 80%
1. 100% effective CCS2. Eliminate fossil/CCS (use nuclear instead)3. 100% ZELB for load balancing4. Net-zero GHG biomass5. Behavior Change (10% reduction in demand)6. Biomass/CCS (20% of electricity, offsets fuels)7. Hydrogen (30% replacement of HC fuels)8. Double biomass supply9. Biomass/Coal/CCS (make fuels + electricity)10. Fuel from sunlight (need net-zero carbon source)11. Fusion electricity12. Others?
Small
GHG Impact
Moderate
Large
Trans-formative

Getting to 80%: Single Strategies from the median
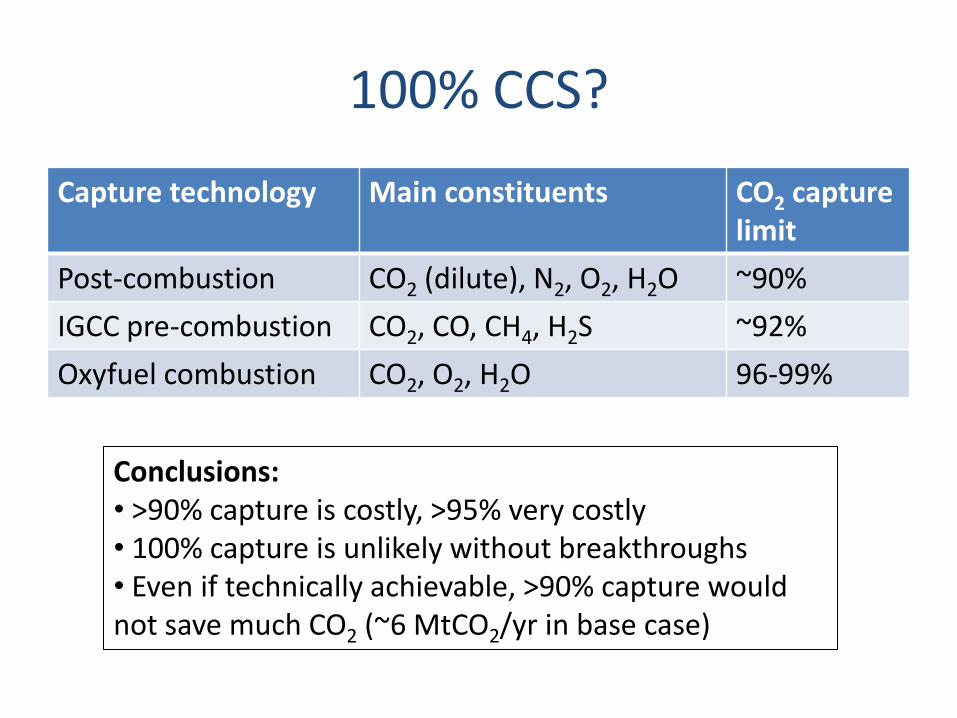
100% CCS?
Capture technology Main constituents CO2 capture limit
Post-combustion CO2 (dilute), N2, O2, H2O ~90%
IGCC pre-combustion CO2, CO, CH4, H2S ~92%
Oxyfuel combustion CO2, O2, H2O 96-99%
Conclusions:• >90% capture is costly, >95% very costly• 100% capture is unlikely without breakthroughs• Even if technically achievable, >90% capture would not save much CO2 (~6 MtCO2/yr in base case)

Elimination of CCS
• Slightly greater CO2 savings than 100% CCS (due to reduced refining emissions), but:
• CCS is probably needed for more than fossil electricity production, e.g., biomass…
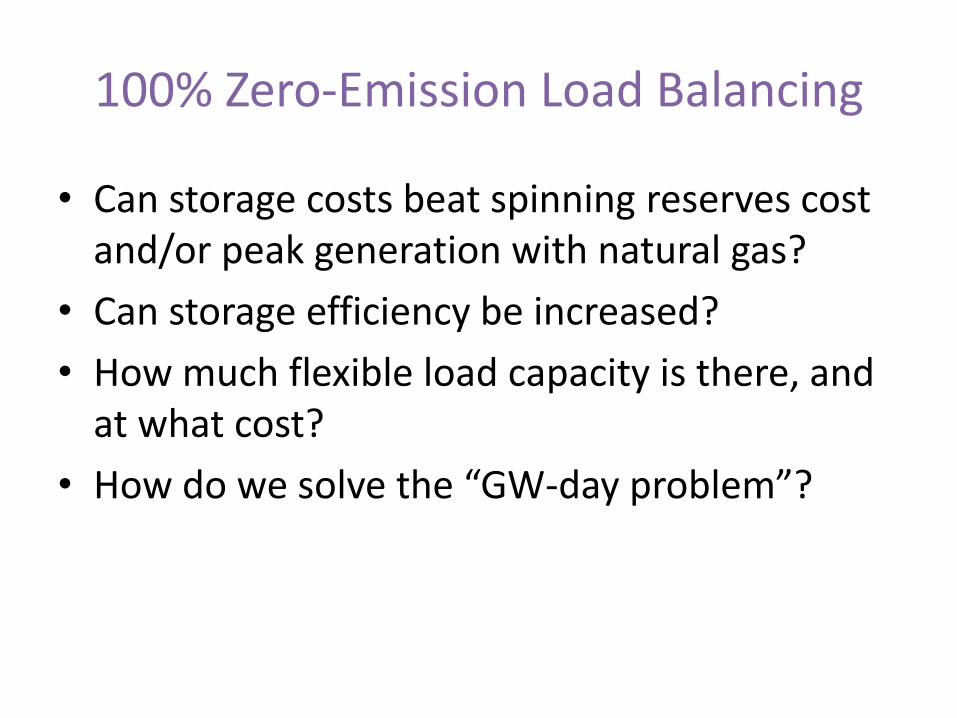
100% Zero-Emission Load Balancing
• Can storage costs beat spinning reserves cost and/or peak generation with natural gas?
• Can storage efficiency be increased?
• How much flexible load capacity is there, and at what cost?
• How do we solve the “GW-day problem”?

Net Zero GHG Biomass
• Can lifecycle costs be reduced to zero?
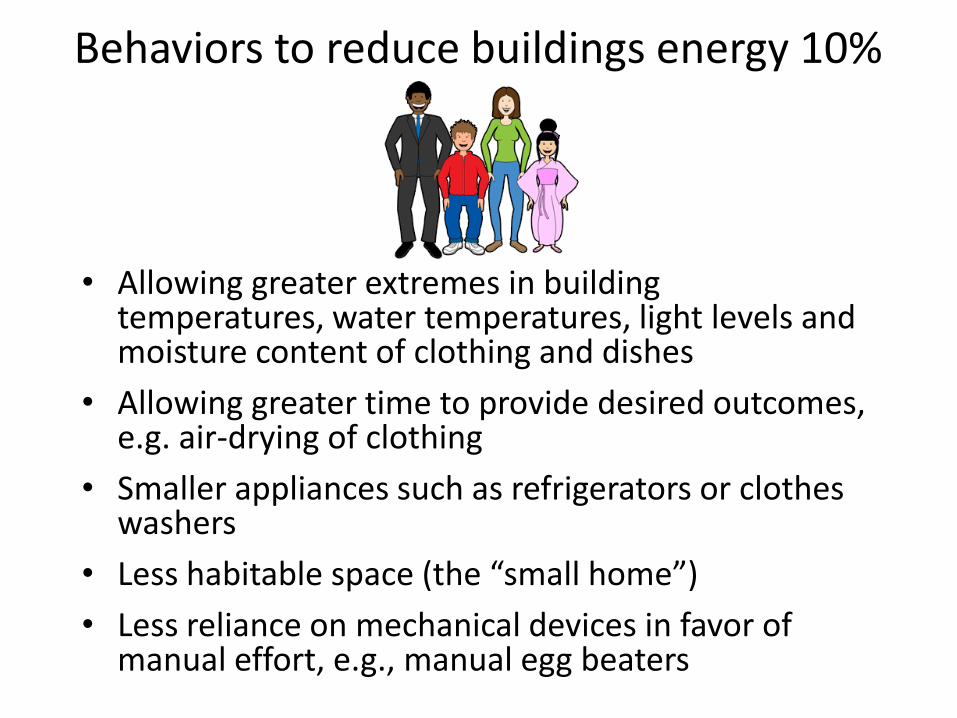
Behaviors to reduce buildings energy 10%
• Allowing greater extremes in building temperatures, water temperatures, light levels and moisture content of clothing and dishes
• Allowing greater time to provide desired outcomes, e.g. air-drying of clothing
• Smaller appliances such as refrigerators or clothes washers
• Less habitable space (the “small home”)
• Less reliance on mechanical devices in favor of manual effort, e.g., manual egg beaters

• Less reliance on electronic entertainment, e.g., playing the guitar instead of watching TV
• Sacrificing quality, e.g., air-dried clothing is often stiffer than when heat-dried
• Lifestyle decisions regarding single family / less urban vsmulti-family/ more urban and within SF/MF choice, and habitable space (above)
• Interactions with other behaviors such as telecommuting
• Technologies such as room dependent space conditioning and occupancy sensor
Behaviors to reduce buildings energy 10%
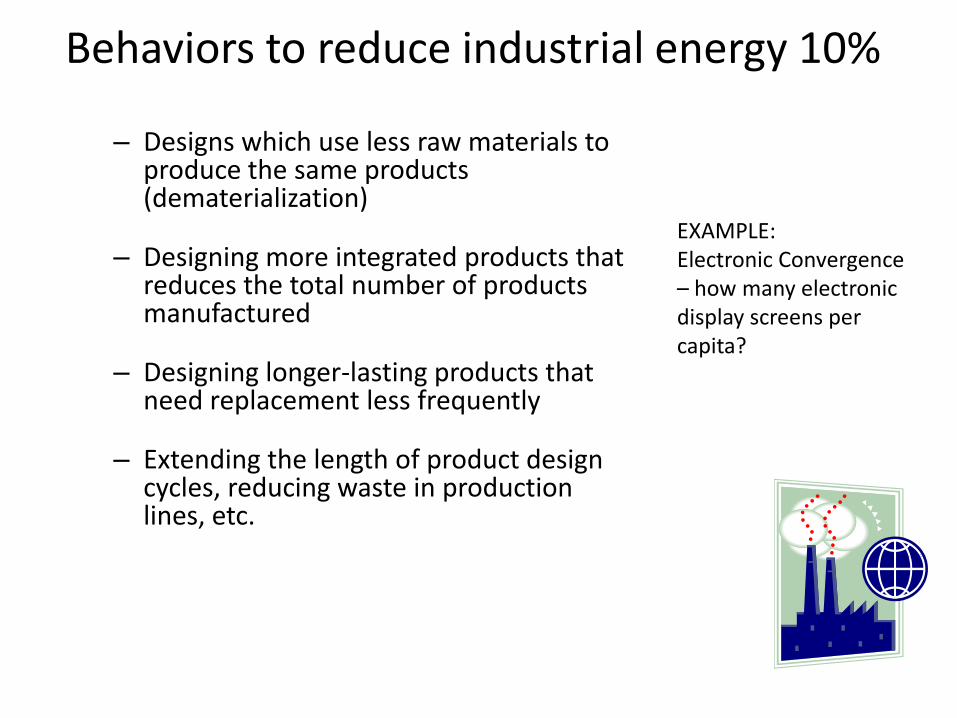
Behaviors to reduce industrial energy 10%
– Designs which use less raw materials to produce the same products (dematerialization)
– Designing more integrated products that reduces the total number of products manufactured
– Designing longer-lasting products that need replacement less frequently
– Extending the length of product design cycles, reducing waste in production lines, etc.
EXAMPLE:Electronic Convergence – how many electronic display screens per capita?

– Include life-cycle analysis and impacts in business practices such as supply chain management and product design
– Design for ease of recycling or re-use
– Change to less energy-intensive materials
• e.g. composite replacements for steel
– Minimize packaging
– Change business model from consumer ownership to business rental/service –
• could result in more repair and re-use, better recycling and disposal of products, and better maintained and thus efficient end use products
Behaviors to reduce industrial energy 10%
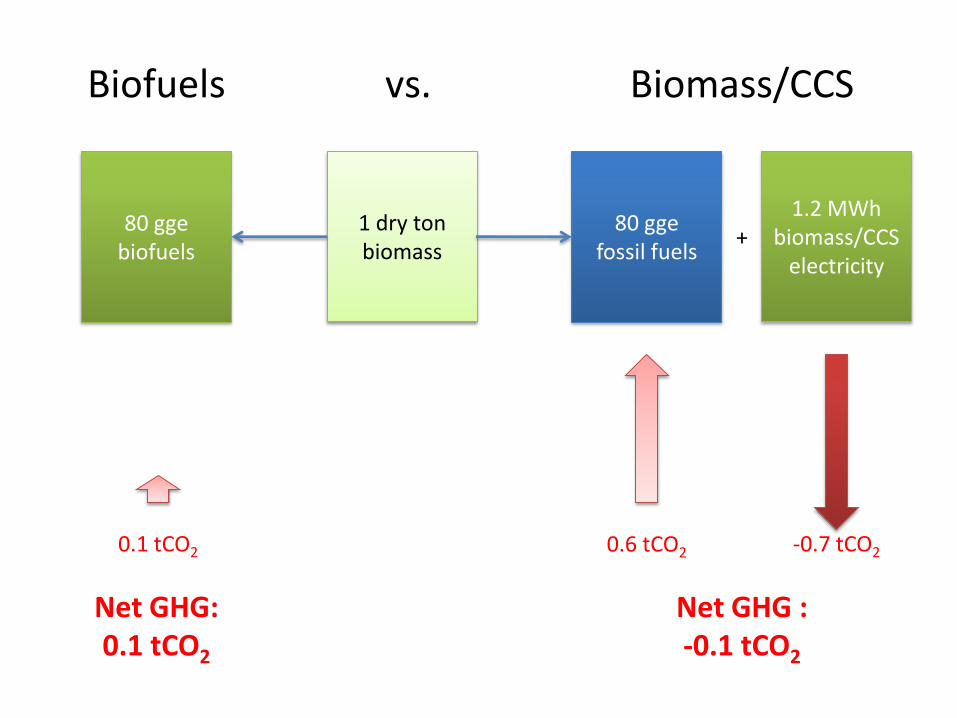
1.2 MWhbiomass/CCS
electricity
1 dry ton biomass
80 ggebiofuels
-0.7 tCO20.1 tCO2
80 ggefossil fuels
0.6 tCO2
+
Net GHG :-0.1 tCO2
Net GHG:0.1 tCO2
Biofuels Biomass/CCSvs.

Hydrogen case
H2 demand rel. to median case
Buildings 0% Cars 22%
Industry 21% Trucks 9%
Fuel shifts Airplanes 0%
Electricity -49 TWh Bus 100%
Fuels -7.7 bgge Rail 0%
Hydrogen 8.0 bgge Marine 0%
H2

Doubling Biomass Supply
15bgge/yr
total188 mdt/yr
raw biomass
CA Biofuels
Imported Biofuels
Fossil Fuels*
(2 bgge/yrelectricity)
13bgge/yr
fuels
Median case*Not including natural gas for CCS

Doubling Biomass Supply
CA Biofuels
Imported Biofuels
Additional CA
Biofuels
30bgge/yr
total376 mdt/yr
raw biomass (2 bgge/yrelectricity)
CA grown?Requires 12%
of CA land!
Where could this land come from?9 million acres abandoned crop land +
8 million acres unproductive timber land Half this acreage = 12 bgge/yr!
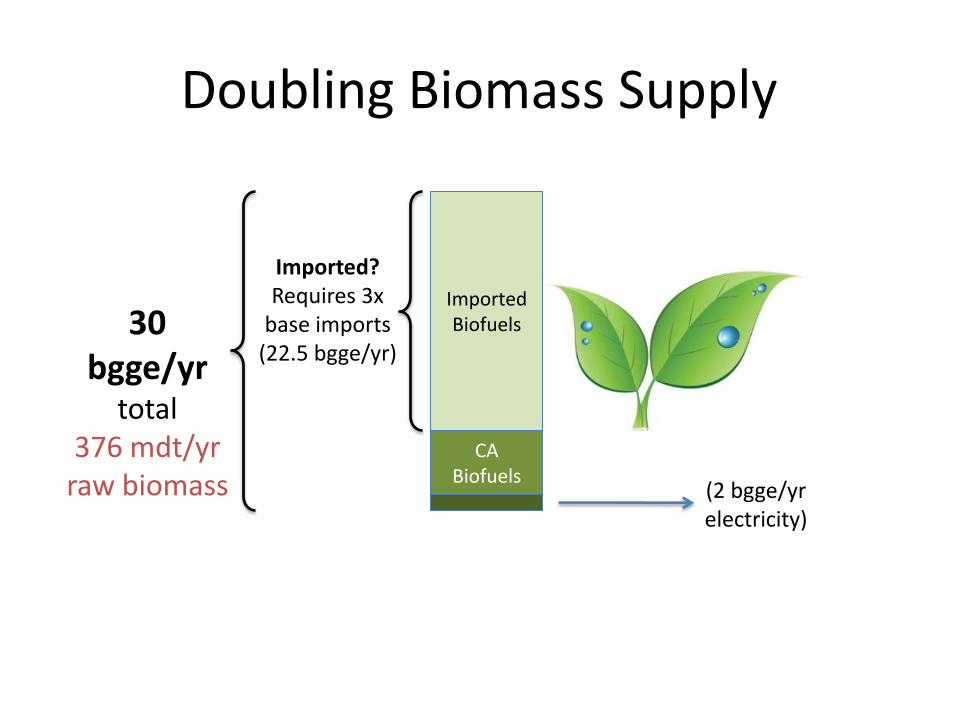
Doubling Biomass Supply
CA Biofuels
Imported Biofuels30
bgge/yrtotal
376 mdt/yrraw biomass (2 bgge/yr
electricity)
Imported?Requires 3x
base imports(22.5 bgge/yr)

Biomass and Coal with CCS
45%Biomass
55%Coal
Low Carbon Fuels
CO2(sequestered)
~60%
Electricity4%
46%
94 mdt/yr biomass 12-15 bgge/yr fuels
Life cycle GHGs:~10% of fossil
fuels
Example plant design
Source: Guangjian Liu, Eric D. Larson, Robert H. Williams, Thomas G. Kreutz and Xiangbo Guo (2010) Making Fischer- Tropsch Fuels and Electricity from Coal and Biomass: Performance and Cost Analysis. Energy Fuels, Article ASAP doi: 10.1021/ef101184e
IGCC/FT/CCSplant
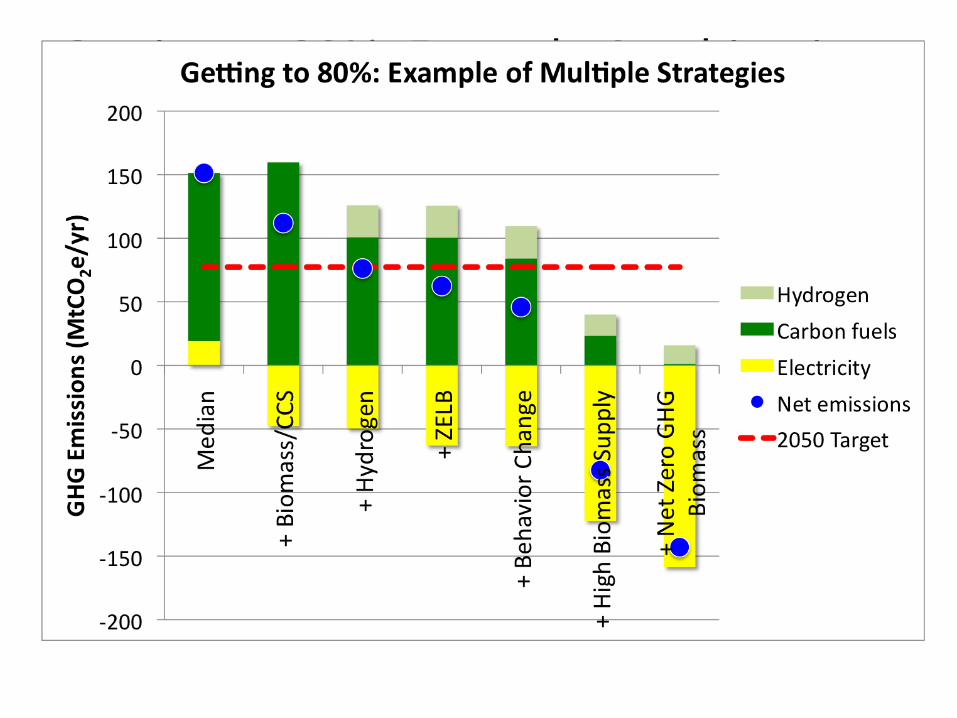
Getting to 80%: Example Combinations from the median
Advanced Technologies
• Fuel from sunlight
• Fusion: Really cheap electricity?
• What else could help?

Conclusions
• 80% solutions are achievable with technical (and for behavior, social) innovation
• Multiple strategies are probably needed• Key uncertainties/challenges:
– Biofuels are uncertain, and greatly expanded supplies would change nature of solution
– CCS is an important enabling technology; will it work at scale?– How should hydrogen best be used?– Load balancing without emissions needed (storage and flexible
loads), particularly for renewables
• Further research needed:– Biomass/CCS for electricity– Biomass/Coal/CCS for fuels– Fuel from sunlight