México 2050: Backcasting for a sustainable future
79
Julián Patrón Coppel México 2050: Backcasting for a sustainable future Supervisor Jordi Segalàs Master Thesis Barcelona, 2011 Presented at Universitat Politècnica de Catalunya Master in Sustainability
Transcript of México 2050: Backcasting for a sustainable future

Julián Patrón Coppel
México 2050: Backcasting for a sustainable future
Supervisor
Jordi Segalàs
Master Thesis
Barcelona, 2011
Presented at
Universitat Politècnica de Catalunya
Master in Sustainability

2

3
Acknowledgments
I would like to thank my supervisor Jordi Segalàs for his expertise and guidance. Without the input from
him, this research paper would have not turned out to be the way it is.
I would also like to acknowledge my family and friends for their endless support; as well as my
colleagues from this master program.
Abstract This thesis develops two future scenarios for the possible development of the energy sector within
México in order to achieve sustainability. Despite the fact that sustainability encompasses too many
dimensions within the possible lines of development, in this study is assumed as a state where society‘s actions do not compromise the needs of future generations. To be more specific, it focuses on energy
consumption as way to achieve it.
The rationale behind this study lies under the potential impacts that climate change may enhance for
future society‘s development; which has been mostly driven by an increase in GHG atmospheric
concentrations as a result of human activities throughout the last years. Of such activities, energy use is considered to be the major contributor to such increase by the burning of fossil fuels. On the other hand,
energy has also been perceived as a key element in society‘s development by enhancing quality of life.
México is no exception in such trends; whereas its energy sector is compromised in its majority by fossil fuels. Thus, if sustainability is to be achieved in the long term, actions must start as soon as possible.
Hence that the overall aim of this study is to stimulate decision-makers and society in general to take
insight into what changes may be required to achieve sustainability within the Mexican energy sector. For this, an 85%-50% reduction in CO2eq emissions from the overall energy sector in México by the year
2050 from the 2000 levels is proposed.
Thence two future scenarios are created, the Business As Usual (BAU), which pictures what may happen
if we continue to develop under current trends, and; one normative scenario done by a backcasting
approach, which envisions a sustainable energy sector throughout the previously stated aim in order to
introduce a set of possible strategies on how to attain it.

4
Contents
Acknowledgments ................................................................................................................................... 3
Abstract ................................................................................................................................................... 3
1. Introduction ..................................................................................................................................... 6
1.1 Energy and society ......................................................................................................................... 6
1.2 Energy and climate change............................................................................................................. 7
1.2.1 Climate change basic concepts ................................................................................................ 7
1.2.2 Climate change and energy ...................................................................................................... 9 1.3 Climate change, energy use and sustainable development ......................................................... 10
1.4 Rationale ..................................................................................................................................... 11
1.5 Energy and Mexico ...................................................................................................................... 11 1.6 Future scenarios and energy ......................................................................................................... 14
1.7 Structure of the study ................................................................................................................... 15
2. Aim and objectives ........................................................................................................................... 16
2.1 Aim ............................................................................................................................................. 16
2.2 Objectives .................................................................................................................................... 16
2.3 Scope ........................................................................................................................................... 17
3. Future scenarios and backcasting: a literature review ......................................................................... 18
3.1 Future studies and scenario building ............................................................................................. 18
3.1.1 Predictive scenarios ............................................................................................................... 19
3.1.2 Explorative scenarios ............................................................................................................ 19
3.1.3 Normative scenarios .............................................................................................................. 20
3.2 Backcasting ................................................................................................................................. 20
3.2.1 History .................................................................................................................................. 20 3.2.2 Backcasting features.............................................................................................................. 21
3.3 Backcasting approaches comparison ............................................................................................ 23
3.3.1 The Natural Step ................................................................................................................... 23
3.3.2 In-path oriented backcasting .................................................................................................. 25
3.3.2 Target-oriented backcasting................................................................................................... 26
3.3.4 Participatory backcasting....................................................................................................... 27
4. Methodology ..................................................................................................................................... 29
4.1 Forecasting future final energy demand ........................................................................................ 29 4.2 Images of the future ..................................................................................................................... 29
4.3 General assumptions and limitations ............................................................................................ 30
5. Present situation in México ................................................................................................................ 31
5.1 Legislation ................................................................................................................................... 31
5.1.1 Structure ............................................................................................................................... 31 5.1.2 Policy and programs .............................................................................................................. 31
5.1.3 International commitment...................................................................................................... 35
5.2 Energy sources............................................................................................................................. 35

5
5.2.1 Oil ........................................................................................................................................ 35
5.2.2 Natural gas ............................................................................................................................ 37 5.2.3 Coal ...................................................................................................................................... 38
5.2.4 Hydro.................................................................................................................................... 39
5.2.5 Geothermal ........................................................................................................................... 39
5.2.6 Solar ..................................................................................................................................... 40 5.2.7 Wind ..................................................................................................................................... 40
5.2.8 Nuclear ................................................................................................................................. 41
5.2.9 Biomass ................................................................................................................................ 41
5.3 Energy flows as of 2009 ............................................................................................................... 42
5.3.1 Energy supply ....................................................................................................................... 42 5.3.2 Energy consumption.............................................................................................................. 43
5.4 Energy intensity ........................................................................................................................... 45
6. 2050: Business As Usual (BAU) scenario .......................................................................................... 46
6.1 General assumptions .................................................................................................................... 46
6.2 Energy demand by end-use sectors ............................................................................................... 46
6.2.1 Transport sector .................................................................................................................... 46
6.2.2 Industrial sector..................................................................................................................... 48
6.2.3 Residential sector .................................................................................................................. 49 6.2.4 Service sector ........................................................................................................................ 50
6.2.5 Agricultural sector................................................................................................................. 51
6.2.6 Summary of final energy consumption .................................................................................. 52
6.3 Energy demand by transformation sectors .................................................................................... 53
6.3.1 Electricity sector ................................................................................................................... 53
6.3.2 Oil and gas sector .................................................................................................................. 55 6.3.3 Summary of energy industries energy consumption ............................................................... 58
6.4 GHG emissions ............................................................................................................................ 58
7. 2050: Backcasting scenario (vision) ................................................................................................... 60
7.1 Background ................................................................................................................................. 60
7.2 Normative characteristics ............................................................................................................. 60
7.2.1 GHG mitigation .................................................................................................................... 60
7.2.2 Energy security ..................................................................................................................... 61
7.3 Description of the envisioned scenario ......................................................................................... 61
7.3.1 Transport sector .................................................................................................................... 61
7.3.2 Electricity generation ............................................................................................................ 62 7.3.3 End-use consumption patterns ............................................................................................... 64
7.3.3 Other considerations.............................................................................................................. 64
8. Discussion ......................................................................................................................................... 65 9. Conclusions ....................................................................................................................................... 67
9.1 Future scenarios ........................................................................................................................... 67 9.2 The energy sector and México...................................................................................................... 67
10. References ....................................................................................................................................... 68
11. Annexes .......................................................................................................................................... 77

6
1. Introduction
This chapter starts outlining how energy has been a key detonator in human development throughout
history and its present situation in broad terms (1.1), followed by an introduction to the basic concepts of
climate change and how energy is tightly related to it (1.2), in order to highlight their repercussion towards sustainable development (1.3); all of which compose the rationale for this thesis work (1.4).It
explains briefly the energy sector in México and its shortcomings towards a sustainable development
(1.5,) and explores the concept of future scenarios (1.6) in an effort to enhance sustainability and reduce Greenhouse Gas (GHG) emissions within the Mexican energy sector. It also describes the outline of this
thesis (1.7).
Sustainability in the energy sector arises as a global necessity, due to the expanding use of energy resources worldwide and, the environmental impacts of energy processes and their broad scope beyond
local to global domains. Energy is directly coupled to sustainability since energy resources drive almost
all of the global economy. Likewise, the services delivered by energy flows enhance good living standards, social stability, and cultural and social development. On the other hand, the energy sector
represents a key driver in climate change due to its associated GHG emissions, which are expected to
grow in the following years and compromises a barrier for sustainable development.
1.1 Energy and society
Energy, in the form of heat and work, has been a key detonator in the development of human society as a whole; enhancing economic, environmental and technological developments throughout history [Royal
Commission on Environmental Pollution (RCEP), 2000].
In the past, communities have been dependant on heat from combustion and on work delivered by human and animal muscles in order to fulfill their needs; but as society and its needs (whether real or fictitious)
have evolved and grown, other sources of energy have been exploited on a larger scale [RCEP, 2000].
Hence, steam engines substituted prime movers (humans and animals) to obtain work from heat, being powered by the combustion of fossil fuels instead of the available biomass from Earth‘s crust;
consequently bringing different impacts both in the environment and social wealth ever since.
Such transition began in some European nations centuries ago and was attained by all industrialized
nations during the 20th century; whereas most of the low-income economy nations (especially in Africa)
haven‘t attained yet [Smil, 2004]. Before the modern era, Europe benefited from its water resources and
the energy produced by moving such water (hydropower), increasing productivity and decreasing its dependence on human and animal work; which consequently enhanced locations with proficient water
resources as centers of economic and industrial activity. On the other hand, wind power allowed to move
sailing ships across oceans and connected Europe with America, resulting in the introduction of water-powered mills from Latin-America to Canada [The Franklin Institute, 2006].
By the time of the Industrial Revolution in the 18th
century, industry both in Europe and America heavily
depended on water power to produce its required energy needs. Nevertheless, the introduction of steam power by coal mines and steam engines in order to meet a growing demand for energy supplanted water
power as a more geographically flexible and ―economic‖ energy source [The Franklin Institute, 2006].
Thus, a linkage between fossil energy resources and industrialization was permanently framed [Barbour, et al., 1982].
Shortly after, the scarceness and high costs of coal, coupled with discoveries of petroleum, resulted in the development of oil as steam fuel for power during the 19
th-20
th century. Meanwhile, developments for

7
production and transmission of electricity took place, dramatically changing the character of industry
during the 20th
century as machinery powered by electric motors could be situated at even distant places from its primary energy source [The Franklin Institute, 2006].
As electricity use became widespread, the exploitation of energy resources has increased greatly ever
since. All modernizing economies have been indirectly consuming increasingly amounts of fossil fuels in the form of electricity, enclosing new sources of primary energy into the energy matrix in order to meet
the increasing demand for energy; nuclear fission by the mid-20th
century and recently, wind turbines and
photovoltaic cells, despite their limited share over fossil fuels. The merging of these factors along with improvements in energy efficiency has resulted in lower electricity and energy costs, which consequently
have stimulated even more energy consumption within society [The Franklin Institute, 2006][Smil, 2004].
Thus, during the 20
th century, world primary energy increased approximately ten-fold, and world
population grew four-fold from 1.6 billion to 6.1 billion [Sims, et al., 2007]. The higher growth in
demand has been for electricity and mobility; whereas between 1971 and 1995, electricity final demand
grew by 147% and mobility final energy demand grew by 82% [RCEP, 2000]. Nowadays, the global energy market is still being supplied and dominated by the combustion of fossil fuels, accounting
approximately for 80% of the world energy supply, in an effort to meet the increasingly demand for
electricity, heat and transport fuels [Sims, et al., 2007].
While it can be said that the ultimately goal of all energy transformations is to supply services that may
improve and enhance productivity and consequently, quality of life within society [Hall, et al., 2003], trends and experiences in the energy area show that the world is not on course to attain a sustainable
energy future [Sims, et al., 2007]. The demand for all forms of energy is expected to continue rising in
order to meet expanding economies and world population growth [Sims, et al., 2007].
1.2 Energy and climate change
1.2.1 Climate change basic concepts
The mean global climate at Earth is driven by the Sun‘s incoming energy and by the inherent properties of the Earth and its atmosphere; such as reflection, absorption and emission of energy within the Earth‘s
surface and atmosphere. Throughout the last years, changes have taken place in several facets of the
surface and atmosphere, altering the energy budget within Earth, which consequently may cause changes
in current climate patterns. Among these changes, higher concentrations of greenhouse gases (GHG) at the atmosphere emerge as an important driving force, since they increase the atmospheric absorption of
outgoing solar radiation and alter the cloud‘s radiative properties [Solomon, et al., 2007].
While several of the major GHG occur naturally,
an increase in their atmospheric concentrations
over the last 250 years are attributed to human activities, mainly driven by the industrial
revolution. Human activities thus, are attributed to
the emission of four principal GHG: carbon dioxide
(CO2), methane (CH4), nitrous oxide (N2O) and the halocarbons. Of these, CO2 is attributed to cause
the largest radiative forcing over the
aforementioned period [Forster, et al., 2007].
Prior to 1750, the atmospheric concentration of
CO2 remained stable around 260 and 280 parts per
million (ppm) for approximately 10,000 years;
8
however, such concentration has grown at an increasingly rate to nearly reach 380 ppm in 2005. This
increase is mostly due to the burning of fossil fuels as an energy source for power generation and movility [Denman, et al.; Rogner, et al., 2007]. It is to be noted that during such increase, the first 50 ppm growth
was reached at the 1970s (after 220 years from the industrial revolution); while the remaining 50 ppm
growth took place in the last 30 years, as appreciated in figure 1.1 [Forster, et al., 2007]. The current
atmospheric concentration of CO2 equivalent1 (CO2eq) is around 455 ppm [Rogner, et al., 2007].
The increase in such concentrations have already risen by more than half a degree Celsius (°C) the Earth‘s
temperature in the last years; being expected to rise by another half a degree over the next decades due to the climate system‘s inertia [Stern, 2006]. Although the exact direct relation between GHG atmospheric
concentrations and the climate system are not fully understood, the IPCC Fourth Assessment Report
suggest a relationship between temperature and atmospheric CO2eq concentrations based on climate sensitivity estimates; as appreciated in table 1.1.
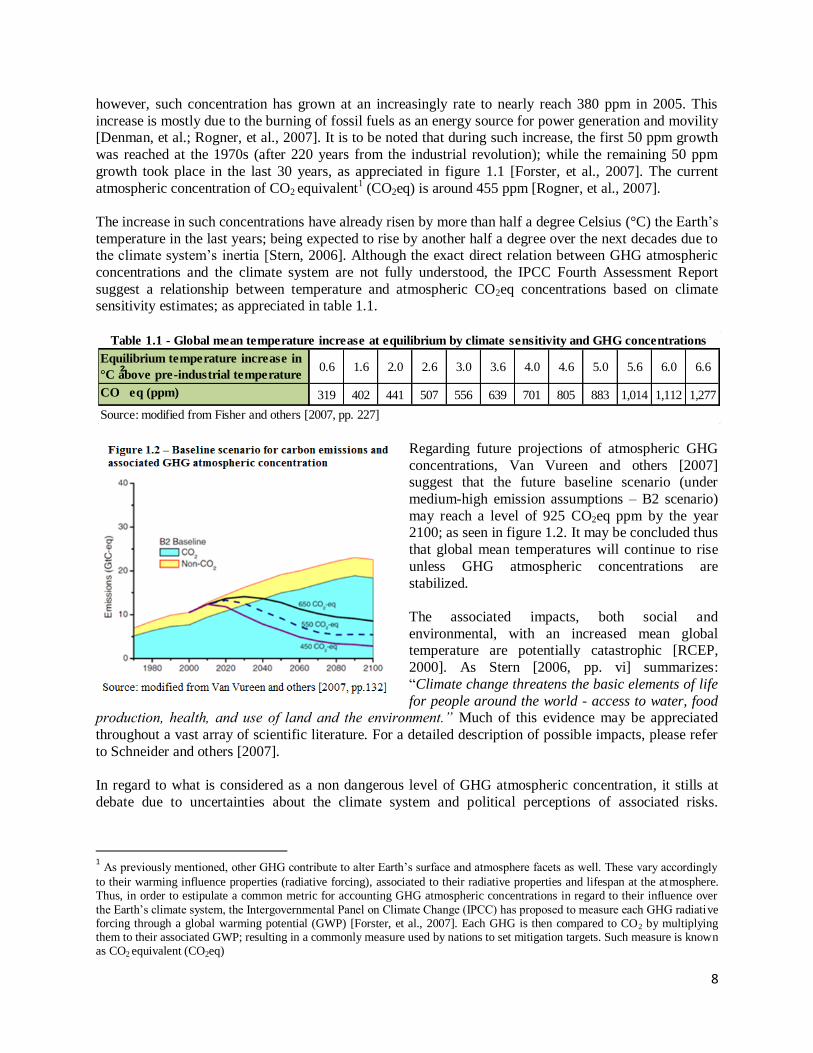
Regarding future projections of atmospheric GHG
concentrations, Van Vureen and others [2007] suggest that the future baseline scenario (under
medium-high emission assumptions – B2 scenario)
may reach a level of 925 CO2eq ppm by the year 2100; as seen in figure 1.2. It may be concluded thus
that global mean temperatures will continue to rise
unless GHG atmospheric concentrations are
stabilized.
The associated impacts, both social and
environmental, with an increased mean global temperature are potentially catastrophic [RCEP,
2000]. As Stern [2006, pp. vi] summarizes:
―Climate change threatens the basic elements of life
for people around the world - access to water, food production, health, and use of land and the environment.‖ Much of this evidence may be appreciated
throughout a vast array of scientific literature. For a detailed description of possible impacts, please refer
to Schneider and others [2007].
In regard to what is considered as a non dangerous level of GHG atmospheric concentration, it stills at
debate due to uncertainties about the climate system and political perceptions of associated risks.
1 As previously mentioned, other GHG contribute to alter Earth‘s surface and atmosphere facets as well. These vary accordingly
to their warming influence properties (radiative forcing), associated to their radiative properties and lifespan at the atmosphere. Thus, in order to estipulate a common metric for accounting GHG atmospheric concentrations in regard to their influence over
the Earth‘s climate system, the Intergovernmental Panel on Climate Change (IPCC) has proposed to measure each GHG radiative forcing through a global warming potential (GWP) [Forster, et al., 2007]. Each GHG is then compared to CO2 by multiplying them to their associated GWP; resulting in a commonly measure used by nations to set mitigation targets. Such measure is known as CO2 equivalent (CO2eq)
Equilibrium temperature increase in
°C above pre-industrial temperature0.6 1.6 2.0 2.6 3.0 3.6 4.0 4.6 5.0 5.6 6.0 6.6
CO
₂
eq (ppm) 319 402 441 507 556 639 701 805 883 1,014 1,112 1,277
Table 1.1 - Global mean temperature increase at equilibrium by climate sensitivity and GHG concentrations
Source: modified from Fisher and others [2007, pp. 227]
9
Nevertheless, is worth to be noted that the benefits from limiting a temperature increase between 1.6°C
and 2.6° above pre-industrial levels are substantial [Fisher, et al., 2007]; such as:
Lowering deglaciation of the Greenland Ice Sheet
Avoidance of large-scale transformation of ecosystems and coral reefs degradation
Prevention of transforming terrestrial vegetation into a carbon source
Constraining species extinction between 10 – 40%
Preservation of unique habitats
Reducing increases in floodings, droughts, heat waves and fires
Reducing the risk of extreme weather events; among others.
Several scientific studies regarding stabilization scenarios show that in order to achieve a 2°C temperature
target above pre-industrial levels, there is a high certainty degree that the GHG atmospheric concentration must be stabilized at least between 445 to 490 ppm of CO2eq; or 350 to 400 ppm of CO2, since CO2 is the
main driver of increased GHG concentrations [Van Vureen, et al.; Fisher, et al., 2007]. In order to
stabilize at such ranges, global emissions must be reduced by 2050 in a 50 to 85% range from the 2000
emission levels. The outcomes of these scientific studies are summarized at table 1.2.
1.2.2 Climate change and energy
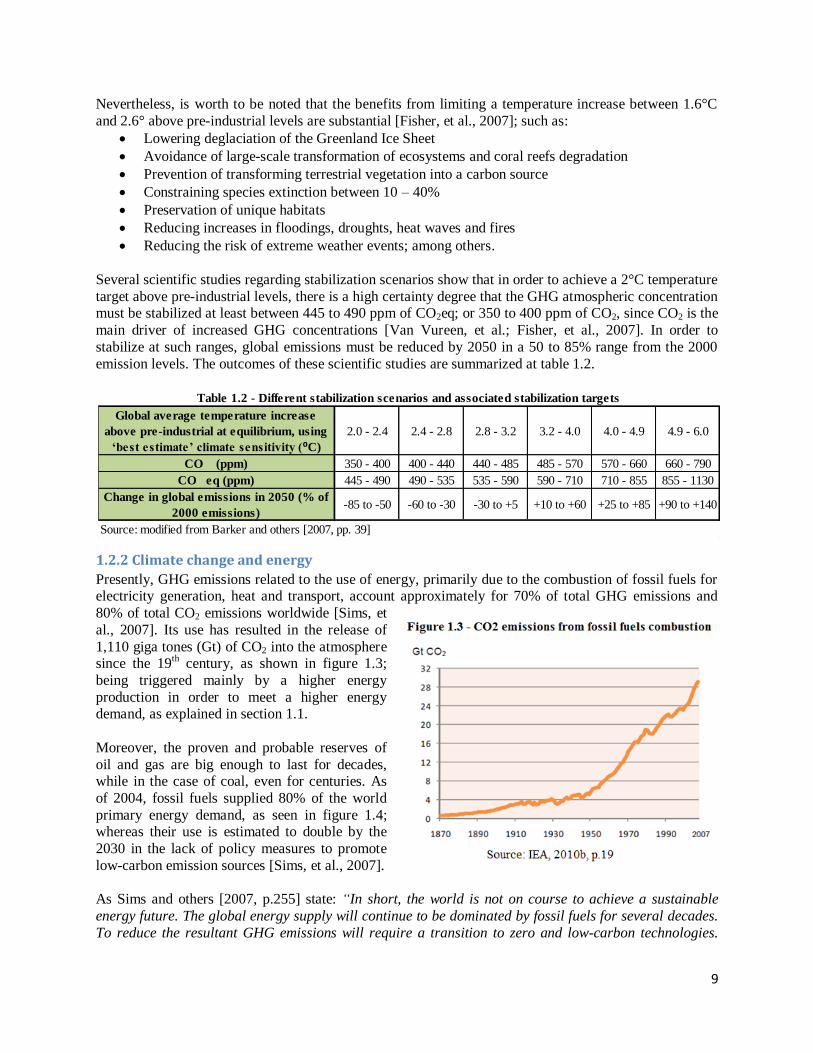
Presently, GHG emissions related to the use of energy, primarily due to the combustion of fossil fuels for electricity generation, heat and transport, account approximately for 70% of total GHG emissions and
80% of total CO2 emissions worldwide [Sims, et
al., 2007]. Its use has resulted in the release of
1,110 giga tones (Gt) of CO2 into the atmosphere since the 19
th century, as shown in figure 1.3;
being triggered mainly by a higher energy
production in order to meet a higher energy demand, as explained in section 1.1.
Moreover, the proven and probable reserves of
oil and gas are big enough to last for decades, while in the case of coal, even for centuries. As
of 2004, fossil fuels supplied 80% of the world
primary energy demand, as seen in figure 1.4; whereas their use is estimated to double by the
2030 in the lack of policy measures to promote
low-carbon emission sources [Sims, et al., 2007].
As Sims and others [2007, p.255] state: ―In short, the world is not on course to achieve a sustainable
energy future. The global energy supply will continue to be dominated by fossil fuels for several decades.
To reduce the resultant GHG emissions will require a transition to zero and low-carbon technologies.
Global average temperature increase
above pre-industrial at equilibrium, using
‘best estimate’ climate sensitivity (⁰C)
2.0 - 2.4 2.4 - 2.8 2.8 - 3.2 3.2 - 4.0 4.0 - 4.9 4.9 - 6.0
CO
₂
(ppm) 350 - 400 400 - 440 440 - 485 485 - 570 570 - 660 660 - 790
CO
₂
eq (ppm) 445 - 490 490 - 535 535 - 590 590 - 710 710 - 855 855 - 1130
Change in global emissions in 2050 (% of
2000 emissions)-85 to -50 -60 to -30 -30 to +5 +10 to +60 +25 to +85 +90 to +140
Source: modified from Barker and others [2007, pp. 39]
Table 1.2 - Different stabilization scenarios and associated stabilization targets

10
This can happen over time as business opportunities and co-benefits are identified. However, more rapid
deployment of zero- and low-carbon technologies will require policy intervention with respect to the complex and interrelated issues of: security of energy supply; removal of structural advantages for fossil
fuels; minimizing related environmental impacts, and achieving the goals for sustainable development.
This is why the energy sector emerges as a fundamental driving force in the climate change debate
[U.S. Energy Information Administration (EIA),
2010a], due to its high contribution of CO2 emissions into the atmosphere. The future evolution of energy
systems and the type of energy consumed are key
determinants to the future GHG emissions and consequently climate change potential [Fisher, et al.,
2007].
1.3 Climate change, energy use and sustainable
development
Sustainable development (SD) may be defined by the
World Commission on Environment and Development
(WECD) [1987, p.43] as: ―a development that meets the needs of the present without compromising the ability of future generations to meet their own needs.‖
Since SD covers both socio-economic and environmental dimensions; properly designed climate change responses may enhance SD, being mutually reinforcing. As Rogner and others [2007, pp.100-101]
conclude: ―Mitigation, by limiting climate change, can conserve or enhance natural capital (ecosystems,
the environment as sources and sinks for economic activities) and prevent or avoid damage to human systems and, thereby, contribute to the overall productivity of capital needed for socio-economic
development, including mitigative and adaptive capacity. In turn, sustainable development paths can
reduce vulnerability to climate change and reduce GHG emissions. The projected climate changes can
exacerbate poverty and thereby undermine sustainable development, especially in developing countries, which are the most dependent on natural capital and lack financial resources. Hence global mitigation
efforts can enhance sustainable development prospects in part by reducing the risk of adverse impacts of
climate change.‖
In this sense, the energy sector represents a big potential for mitigating climate change, and thus enable
SD. Energy is also closely tied to social development in a broad sense. During 2007, the one billion people from developed countries adhered to the Organisation for Economic Co-operation and
Development (of which the majority of members may be considered as wealthy nations), consumed about
half of the global primary energy use; whereas the one billion poorest people from developing regions
consumed only 4%, mainly in the form of traditional biomass [International Energy Agency (IEA), 2006].
The lack of access to energy services is a grave impediment to development; it represents a barrier for the
aspirations of many developing regions [Organisation for Economic Co-operation and Development, 2004]. An analysis from 125 nations made by Bailis and others [2005] indicates that the level of well-
being and development is correlated with the rate of modern energy services consumed per capita. Access
to energy services is crucial for the provision of water, sanitation and healthcare; providing a broad range
of benefits to development throughout lighting, heating, cooking, mechanical power, transportation and telecommunications [IEA, 2010a].
On the other hand, fossil fuels are a non-renewable resource; as stated by Giampietro and Pimentel [1993], ―fossil energy is a stock type resource that is limited in its time dimension – sooner or later it will

11
be exhausted – but, while the stock lasts, it can be exploited at a virtually unlimited rate‖. Fossil fuels are
considered a non-renewable resource due to the fact that it takes millions of years for them to form, whereas stocks are being depleted faster that their regeneration rate. Since modern society currently
depends heavily on the use of fossil fuels (current share of 80% in world energy supply [Sims, et al.,
2007]), society could eventually run out of a resource that supports most of its structure if these trends
continue to develop in the future and no change is introduced, making the whole process of development within society unsustainable: it may address the need of present generations, compromising the ability of
tomorrow‘s generations to satisfy their needs.
Even though there is no universal agreement on the concept of energy sustainability, in spite of presented
definitions and descriptions [Haberl, 2006; Rosen, 2002; Goldemberg, et al., 1988; Zvolinschi, et al.,
2007], it may be concluded that a sustainable energy sector is one that involves a sustainable supply, provided for everyone in a manner that, today and tomorrow, is sufficient to cover society‘s basic
necessities, not prejudicial to the environment, and acceptable to communities. Hence that energy
sustainability is recognized as a key element to attain SD [Rosen, 2010].
1.4 Rationale
As it has been reviewed, energy is a key driving force for development in broad terms. Its use has
drastically altered society‘s development and evolution in the last century, enhancing population and economic growth. Moreover, as population is expected to increase, so it is the demand for energy; which
consequently (if managed inadequately) may bring a greater pressure to the environment and human
wealth due to: a) Increasing natural resources depletion, mainly driven by fossil fuels exploitation.
b) Increasing concentrations of GHG in the atmosphere, resulting in a change of climate pattern that
could degrade the ecosystems and natural processes sustaining life itself. c) Energy access is not available to everyone, undermining some people‘s capacity to meet their
needs. Moreover, while some may benefit from energy use for their own development, world
society and the environment as a whole equally absorbs the associated impacts.
Hence, providing a secure, equitable and sustainable energy supply to society is essential for a prosperous
future, since energy flows and its conversions support and delimitate the life of all organisms and
superorganisms in Earth, such as societies and civilizations [Smil, 2004].
Similar to global trends, México is no exception and its energy supply is a worrying issue since it is
mainly dependent on fossil fuels; coupled with a population and economic growth that is increasingly
demanding electricity and energy use for the transport, industry and domestic sectors [Santoyo, et al., 2011]. Thus, I feel is my duty as a Mexican citizen to reinforce the efforts made by my country in
achieving an energetic transition; being this thesis work an effort to frame supportive guidelines that
could bring an equilibrium within the Mexican energy sector to attain a sustainable future.
1.5 Energy and Mexico
Mexico is considered a newly industrialized
country [Bożyk, 2006] with nearly 112 million
inhabitants living in and a average annual growth rate of 1.8% [Instituto Nacional de
Estadística y Geografía (INEGI), 2011] ranked
11th worldwide as of 2010 [Central Intelligence
Agency (CIA), 2011]. Its territory is rich in natural energy resources having coal, natural
gas, crude oil, uranium and renewable sources
0
50
100
150
200
250
300
Cru
de
oil
-b
illi
on
ba
rre
ls
2009 2010
Figure 1.5 - Top crude oil proven reserves by country Source: own estimation based on information from EIA, 2011

12
such as wind, geothermal, hydro and plenty of sunlight. From those, gas and crude oil are definitely the
most significant energy sources within the country, respectively ranked as the 31st and 17
th for its proven
reserves worldwide, as appreciated in figure 1.5 [EIA, 2011] [International Atomic Energy Agency
(IAEA), 2005].
With a total primary energy production of 10,284.55 PJ in 2008, it represented a share of 1.9% from the global primary energy production ranking 10
th among energy producers. On the other hand, Mexico
ranked 15th in global energy consumption, with a share of 1.4% [Secretaría de Energía (SENER), 2010a].
México is a net exporter of energy, during 2009, total primary energy production accounted for 9,852.93
PJ, while its primary energy supply was of 8,246.96 PJ, as seen in figures 1.6 and 1.7 respectively;
satisfying the national energy demand with most of its current production. Nevertheless, in the same year México imported 927.8 PJ of secondary energy, primarily in the form of gasoline and naphtha, in order to
meet its increasing internal demand [SENER, 2010]. This is mainly due to the lack of high efficiency
refinery plants for crude oil transformation into fuels, which accounts for 61.5% of its total primary
energy production [Burns, 2010].
As of 2009, fossil fuels resources continued to be the major source of primary energy produced at the
country with a share of 92.7% (figure 1.6), of which 47.3% went into exports, accounting for 2,868.66 PJ.
Renewable energies represented a share of 6.2%, nuclear energy 1.1% and mineral coal 2.2%. In regard to its primary energy supply, fossil fuels accounted for a share of 91.3% (figure 1.7) [SENER, 2010].
Thence México ranked 7th among world oil producers in 2009, occupying the 2
nd position in the U.S.A.
oil supply chain, the major oil consumer in the world. Its oil production is controlled completely
by the state-owned company Petróleos Mexicanos
(PEMEX), which holds a monopoly on the country and is one of the largest oil companies worldwide,
in spite of its lower efficiency levels against
international standards [EIA, 2010b][SENER,
2010b].
The oil industry within México plays an essential
function for the national development. Despite the declining of its relative importance to the economy
over the long term, it still generates over 15% of
Mexico‘s earnings from exports. More crucially,
61.5%
29.1%
2.1%1.1%
6.2% Crude oil
Natural gas and condensates
Coal
Nuclear
Renewables
44.7%
42.3%
4.3%1.4%
7.3% Crude oil
Natural gas and condensates
Coal
Nuclear
Renewables
0.00
1,000.00
2,000.00
3,000.00
4,000.00
5,000.00
6,000.00
1965
1968
1971
1974
1977
1980
1983
1986
1989
1992
1995
1998
2001
2004
2007
En
erg
y f
ina
l co
nsu
mp
tio
n -
PJ
Industrial Agricultural Transport Public Commercial Residential
Figure 1.6 – Total primary energy production 2009 9,852.9PJ Source: own estimation based on information from SENER,
2010
Figure 1.7 – Total primary energy supply 2009 8,246.96 PJ Source: own estimation based on information from SENER,
2010
Figure 1.8 - Final energy consumption by sector Source: own estimation based on information from SENER, 2011a

13
the state relies upon incomes from the oil sector (including taxes and direct payments from PEMEX)
accounting for approximately 40% of the total government revenues. However, its oil production has started to decrease as one of the biggest production fields within the country is in its declining stage [EIA,
2010b].
Over the past 40 years, energy consumption within México has increased substantially in every sector of the economy, as appreciated in figure 1.8; being economic growth the main driving force. Final energy
consumption tripled in the residential sector, increased five-fold in the transport sector, four-fold in the
industrial sector, and tripled in the agricultural sector [Ibarrarán, et al., 2006]. Mexico‘s total final consumption in 2009 accounted for 4,795.24 PJ, which consisted mostly of gasoline and naphtha (32.8%),
followed by diesel (16.0%), electricity (14.4%) and gas (20.8%); while all other fuel types contributed
smaller quantities to the national overall energy mix [SENER, 2010a].
The CO2 emissions associated to the combustion of fossil fuels summed up a total of 408.3 million tones
(Mt) during 2008, with an annual growth rate of 3.96% from 1971 to 2008; against the 29,381.4 million
tones emitted worldwide, contributing with a share of approximately 1.39%. Regarding
emissions per capita, during 2008, these
accounted for 3.83 CO2 tone s per capita, with an annual growth rate of 1.84% from 1971
to 2008, below the world average of 4.39 CO2
tones per capita [IEA, 2010b]. Both trends are displayed in figure 1.9. During 2009, fossil
fuels for the transport sector generated the
higher quantity of CO2eq emissions from the
energy sector (38.4%), followed by electricity generation (28.1%), industry sector (14%) and
energy sector own consumption (11%)
[SENER, 2010a].
Government measures within the energy sector in the past years have aimed at: inversions to increase the
share of proven fossil fuels reserves, enlargement of the electricity generation capacity and, the expansion
of households with energy access. Nevertheless, there are still some important shortcomings: the
dependence of fossil fuels coupled with the increasingly technical complexity to exploit available deposits, the low share of clean energies participation in the energy matrix, low efficiency operations
against international standards, energy supply costs, and the lack of an adequate human resource force
and technological development within the sector [SENER, 2011b].
The energy sector in México is an essential driving force for the national economy and one of the key
parameters that contributes to the social and productive development of the country. Crude oil and its derivates not only have boosted industry. With the revenues obtained from its exploitation it has been
possible to finance a substantial part of its socio-economic development. Today, México faces a great
challenge, since its fossil fuels reserves are located at deposits under complex circumstances for their
extraction; linked with the lack of adequate structure for its exploitation [SENER, 2007]. Thus, it is of high importance the identification of a solid strategy about the sector‘s future at the medium and long
terms in order to guide today‘s actions and efforts to achieve a sustained development [SENER, 2010b].
The future of the energy sector in México is a choice and not a destiny. There exists the possibility of a
transition towards a safer and a more sustainable sector by changing the current paradigms [SENER,
2010b]. Such situation cannot be quickly shifted to a sustainable path. As Quist [2007, p.9] states:
0
0.5
1
1.5
2
2.5
3
3.5
4
4.5
0
50
100
150
200
250
300
350
400
450
1971 1975 1980 1985 1990 1995 2000 2005 2006 2007 2008
Pe
r cap
ita
CO
2 e
mis
sio
ns
-to
nn
es
Tota
l CO
2 e
mis
sio
ns
-mil
lio
n to
nn
es
Total CO2 emissions Per capita CO2 emissions
Figure 1.9 – México CO2 emissions from combustion of fossil fuels
Source: own estimation based on information from IEA, 2010b

14
―sustainable development is a complex, ambiguous and explicitly normative concept; involving and
covering long time frames, multiple aspects, levels and interpretations, and potentially conflicting interests and numerous actors‖. Therefore, it is needed to think ahead into the future and try to find
solutions if we are to achieve a sustainable future as society. The development of future scenarios in
energy matters, particularly backcasting scenarios, emerges as a possible solution to explore the
requirements and associated impacts needed to achieve a specific vision; which will be briefly outlined in the following section.
1.6 Future scenarios and energy
Scenarios are essentially a tool to take a long view perspective in a world of great uncertainty [Nielsen
and Karlsson, 2007]. As Schwartz [1991] states: ―Scenarios are stories about the way the world might
turn out tomorrow, stories that can help us recognize and adapt to changing aspects of our present environment. They form a method for articulating the different pathways that might exist for you
tomorrow, and finding your appropriate movements down each of those possible paths. Scenario
planning is about making choices today with an understanding of how they might turn out‖.
Scenario planning has been used to discuss and prioritize the future of energy systems around the world;
being adopted by energy companies, researches, international organizations and governments. The main
reason for its use within the energy area is the need for planning in long term horizons, since associated technologies may last several decades in the market and it may take other several decades to develop new
ones [Nielsen and Karlsson, 2007].
There is a variety of different approaches to analyze what will, could or should happen in the future,
whereas is not imperative for one approach to oppose another; nevertheless, clear differences between
approaches may be identified [Höjer and Mattsson, 2000].
Backcasting or normative scenarios is a future study approach that has been acknowledged as a
productive way for addressing sustainable development issues; mainly by the fact that sustainable
development is a complex concept which calls for major changes and for which prevalent trends represent part of the problem itself [Owens and Driffill, 2008]. As referred by Holmberg and Robèrt [2000] ―In the
context of sustainable development, it means to start planning from a description of the requirements that
have to be met when society has successfully become sustainable, then the planning process proceeds by linking today with tomorrow in a strategic way‖.
Within energy planning, experience has proved the difficulty in foreseeing and developing technological
solutions, since both society‘s perception and the energy system requirements are constantly changing. Such uncertainty is tied to energy resources availability, as well as the social, economic and
environmental impacts related to energy technologies and systems [Nielsen and Karlsson, 2007].
Thus backcasting emerges as an alternative to traditional forecasting [Robinson, 1990]; by envisioning
future desired conditions and defining the necessary steps to attain them, rather than developing steps of
present methods extrapolated into the future. Dreborg [1996], identifies that backcasting is suited under the following circumstances: ―the studied problem is complex, dominant trends are part of the problem,
there is a need for major change, the problem to a great extent is a matter of externalities, and, the scope
is wide enough and time horizon long enough to leave considerable room for deliberate choice‖.
Backcasting is therefore able to highlight divergences between the present situation and a desirable future, integrating large and exuberant changes [Geurs and van Wee, 2004].
As Peet [1992, p.198] suggests, energy use is an issue in which society as a whole have a great freedom of choice and to fabricate its future within the limits of physical and social reality. Hence that backcasting
represents a more creative activity than choosing between current alternatives, because it acknowledges

15
that society can invent development paths that haven‘t been established yet; such as a sustained energy
sector.
It is for these reasons that normative scenarios and backcasting are more suited for this study, due to the
interest in exploring how to attain a certain target, rather than working with predictions or uncertain
explorations of future developments. It is worth mentioning that while in some recent sustainability backcasting studies there is an increasing tendency for stakeholder involvement [Börjeson, et al., 2005;
Quist, 2007; Quist, et al., 2011]; is not the case of this study due to the time and resources needed.
1.7 Structure of the study
This study is structured as it follows. The introduction in Chapter 1 is followed by the aims and of
objectives in Chapter 2. In Chapter 3, literature in future studies and backcasting-related approaches is reviewed. Chapter 4 describes the backcasting approach selected from the preceding Chapter and the
general methodology of the whole study. In Chapter 5 the current energy situation in México with its
associated flows is presented. Chapter 6 is destined to the development of a forecasting scenario in order to analyze what are the impacts if México continues to develop under current trends. Chapter 7 describes
an envisioned scenario through a backcasting approach in order to analyze possible strategies on how to
attain it. Chapter 8 contains both discussion and conclusions about this study.

16
2. Aim and objectives
2.1 Aim
The overall aim of this study is to present a possibility of attaining a future which fulfills the requirements of a sustainable energy sector within México.
But, what is considered a sustainable energy sector? In this research it will be interpreted as an 85%-50%
reduction in CO2eq emissions from the overall energy sector by the year 2050 from the 2000 levels; whilst assuring a secure future energy supply available to everybody, due to the analogy previously made
in sections 1.2, 1.3 and 1.4.
During 2000, the associated emissions to the energy sector in México accounted for 387.33 MtCO2eq and
336.95 MtCO2 (60.18% from total GHG emissions). In this sense, and assuming an 85% emissions
reduction in order to avoid the aforementioned impacts of a temperature rise by stabilizing CO2
atmospheric concentrations between 350 to 400 ppm, GHG emissions would need to be in the order of 58.1 MtCO2eq by 2050. If a 50% reduction is assumed, GHG emissions would need to be in the order of
193.66 MtCO2eq. The reduction target considered for this study will be left open between such range, so
that the audience is free to decide which mitigation target is more appropriate depending on knowledge and driving forces that go beyond the scope of this study.
On the other hand, assuring a secure and sustainable energy supply in the future allows energy to be accessible, which consequently is correlated to social development. This is due to the fact that Mexico
heavily depends on fossil fuels to cover its energy needs; whereas the possible emergence of a peak oil
crisis in the near future could be reflected in a limited energy access within the country.
For this, two future scenarios are created, the Business As Usual (BAU), which pictures what may happen
if we continue to develop under current trends, and; one normative scenario done by a backcasting
approach, which envisions a sustainable energy sector throughout the previously stated aims and introduces a set of possible strategies on how to attain it.
Thus, the purpose of this study is to present images of the future coupled with some recommendations on how to attain them departing from the present situation; in order to stimulate decision-makers and society
in general to take insight into what changes may be required to achieve sustainability within the Mexican
energy sector. On the other hand, decreasing GHG emissions contributes to the current global effort
against climate change in order to attain global sustainability.
2.2 Objectives
Objectives are generated on terms of how to attain the aim. Focus rests on providing a secure and sustainable energy supply for the national final energy demand by 2050.
The identified objectives are:
Learn about future scenarios and current backcasting methodologies throughout literature review.
Explore available energy sources and their potential within the Mexican territory.
Analyze energy supply and demand patterns and their potential for CO2 mitigation.
Development of a BAU future scenario in order to estimate final energy consumption and
associated CO2 emissions.
Development of a normative (backcasting) future scenario in order to create target-fulfilling
images of the future.
Discuss and propose possible strategies to attain the normative scenario.

17
2.3 Scope
The scope of this study will be delimited by the following dimensions:
Space – Covers the geographic area that is considered as Mexican territory.
Time – It is considered from the period of 2009 until 2050. The year 2009 is the reference year,
since further data is not fully available.
Environment – Activities describing secondary reactions to human activities, such as the behavior
of ecological, biogeochemical or biogeophysical systems are excluded. Only the direct effects of
human activities are included.
Economy – Economic performance, such as energy costs, future energy prices, technology costs,
emissions costs, among others, are to be left out due to the high uncertainty on their future
fluctuation.
Technology – Only available technologies will be considered, since their development and
deployment largely depends upon market forces. Thus, by including new technologies that could
never be deployed, the targets would be unattainable.
The data utilized is collected primary from governmental Mexican institutions; since international
organizations such as the IEA, EIA, World Bank, UN, and others, mainly gather their data from each country government‘s submissions. However, there is some specific data that is only available from such
international organizations, being used as a secondary source where needed.

18
3. Future scenarios and backcasting: a literature
review This chapter starts by introducing the concept of future studies and scenario building (3.1), followed by a
literature review on backcasting scenarios (3.2). Then a set of selected backcasting approaches are
compared in order to identify potential characteristics for the development of this study (3.3).
3.1 Future studies and scenario building
Future studies comprise a broad array of studies and approaches; being conducted at an extensive range of
instances within society, such as higher education and special research institutes, as well as a structured part of the work of some authorities and companies. The scope of such studies is multidisciplinary and is
pertinent in areas such as economy, social planning and technology; being one of the main reasons for its
development the need to foresee and adapt to forthcoming situations or to either explore the possibility to influence evolution.
Future studies are deeply rooted in western culture and it may be appreciated in the vast number of utopias and prophecies throughout history [Cornish, 1977]. However, modern future studies started to be
developed after World War II as a military strategy exercise in the U.S., which was quickly followed by
other organizations for strategic decision-making under uncertain future circumstances [IEA, 2003].
Forecasting methods started to be deployed by the mid 1930s in order to make economic predictions
[Clements and Hendry, 1998]; being rewarded by 1950-1970 as a successful method to predict the future,
due to a growth in economy at the industrialized world. Nevertheless, in the following decade, unforeseen situations such as the oil crisis changed the conditions of how the future was studied [Godet, 1979]. Thus,
forecasting methods frequently proved to be of little use and a new method for exploring a set of different
possible futures was formulated. On the other hand, a normative planning approach called backcasting emerged as well during the 1970s, in a response to the need for a future study approach that could deal
with situations on how to attain specific targets even when forecasts demonstrated that such targets could
not be met. Backcasting started to be used for planning energy and electricity supply [Börjeson, et al.,
2005].
Within the subject of future studies, the term ―scenario‖ is one of the most basic ones, since it may refer
both to a description of a potential future state and a description of development [Börjeson, et al., 2005]. An underlying characteristic of scenarios is that they must be consistent, logical and plausible fabrications
of how the future may develop. Thence that scenario building is a multi-disciplinary process since it
needs to consider the same issue under its different perspectives [IEA, 2003]. Scenarios should be able as
well to challenge the user‘s mental maps, since that is when a genuine possibility of learning emerges [Davis, 1998].
While some of the future studies typologies presented over the last century share similarities, others have a particular focus or approach [Börjeson, et al., 2005]. Based on its expected outcome, a future study may
be used either for prediction, exploration or anticipation [Nielsen and Karlsson, 2007]; being
distinguished by a likely, possible or preferable future. Hence and referring on Börjeson and others [2005, p. 14], three scenario categories with their associated approaches and structure may be differentiated: 1)
predictive scenarios, 2) explorative scenarios and, 3) normative scenarios.
In addition to the principal categorization above, there is another important distinction regarding the structure of the study system. Scenarios may be either qualitative or quantitative. Qualitative scenarios are

19
in the form of pure narrative storylines picturing how the future may unfold or the relationships between
the different parts of the system; while quantitative scenarios are frequently represented through the use of a mathematical model, where equations are the interpretation of the system‘s structure [IEA, 2003;
Börjeson, et al., 2005].
A main feature of model based studies is their ability to calculate and compare associated impacts throughout the use of accurate data [Nielsen and Karlsson, 2007]. Models, however, present some
limitations. They are deterministic and present difficulties in addressing unexpected events. Moreover,
many aspects of human and social behavior cannot be fully represented by mathematical equations [IEA, 2003]. Similarly, non-model based studies tend to allow a broader scenario envisioning, by introducing
radical system innovations and focusing on describing the circumstances under which these innovations
are likely to occur [Nielsen and Karlsson, 2007].
Thus, it may be concluded that scenarios are meant as interpretations of likely possibilities, designed to
extend imagination, provoke debate and enhance corrective actions when future shortcomings are
identified [Raskin, et al., 2010].
3.1.1 Predictive scenarios
Predictive scenarios are an effort to predict what will happen in the future. They center on likely futures and are projective in essence by the extrapolation of trends and quantitative historical data [Quist, 2007].
Predictive scenarios are conceived in order to plan and adapt to circumstances that are expected to
happen; being useful to users who need handle with anticipated challenges to make it possible to take advantage of anticipated opportunities. They are as well useful to raise awareness of problems that are
likely to emerge if certain conditions are met. Their focus is on causalities.
Another characteristic of predictions is that they can be self-fulfilling. A prediction in energy demand
growth, for example, may lead to an increase in energy production and its availability to users, which
consequently could increase even more energy demand. Such characteristic is useful for long term
planning and associated required investments. Nevertheless, since predictions may enhance the preservation of past and present trends, it may also draw a barrier to change undesirable trends [Börjeson,
et al., 2005].
On the other hand, since predictive scenarios are conditioned by what will occur if the most likely
development blossoms, there is a greater degree of uncertainty associated to its long term deployment.
Hence that predictive scenarios are most suited for well defined and stable systems; such as the ones in
the short term [Quist, 2007].
3.1.2 Explorative scenarios
Explorative scenarios aim at describing a number of plausible futures that may be possible, desirable,
feared, and/or realizable; usually from a variety of perspectives [Nielsen and Karlsson, 2007]. Typically, a
set of scenarios is built up so that a broad scope of possible developments gets covered within the study.
The explorative scenario typology is useful to explore future developments that the user may need to
consider in one way or another. They are deployed in circumstances where there is an uncertain structure
to build scenarios; for example, in situations of rapid and irregular changes or when the settings that will evoke an undesirable future scenario are not fully comprehended. They may also be utile in situations
where the user may lack of an adequate knowledge regarding how the system interacts at present, but is
concerned in exploring the consequences of alternative development paths [Börjeson, et al., 2005].
Explorative scenarios are commonly utilized to express a strategy development of a planning
organization; supplying a framework to develop and assess policies and strategies. The scenarios created

20
are usually general and their results form a foundation for discussion on different measures, helping the
user to create resilient strategies that will endure among various kinds of development [Börjeson, et al., 2005].
Well known examples of exploratory scenarios are the global system scenario approaches, such as the
ones made by the Intergovernmental Panel on Climate Change (IPCC) [IPCC, 2011] and the one made by the International Energy Agency (IEA) [IEA, 2003].
3.1.3 Normative scenarios
Normative scenarios are the least used approach. They center on desirable, but still achievable futures.
Backcasting is a well known instance of this typology. Prior to the development of backcasting, reference
was made as normative forecasting and ―la prospective‖ [Godet, 2000; Quist, 2007].
Normative scenarios are of great importance from the perspective of sustainable development, due to their
prioritized outcome through the setting of specific targets to be reached. This has brought an increasing interest in this typology of future studies, particularly in backcasting [Quist, 2007]. Their proper
description and discussion will be explored in depth at the following section.
3.2 Backcasting
Backcasting is a future studies approach involving the development of normative scenarios in order to
examine the feasibility and impacts associated to the achievement of specific desired end-points [Dreborg, 1996].
3.2.1 History
Backcasting scenarios started to be developed in the 1970s as an alternate energy planning method, in
order to switch from a solely supply oriented perspective, towards a perspective that included the demand
side as well, and; for displacing the attention to fossil fuels and nuclear power towards renewable energy sources [Lovins, 1977; Nielsen and Karlsson, 2007].
With the emergence of the first oil crisis (1973-1974), whereas energy planning was merely based on forecasting techniques; energy planners started to be interested in developing complex computer models
that could precisely predict the future energy demand. On the other hand, there was a new necessity for an
alternative planning technique that could cope with such situations [Anderson, 2001]. Backcasting was
initially popularized by Lovins [1977], under the term ―backwards-looking analysis‖, and followed by Robinson [1982], who proposed the term ―energy backcasting‖ [Quist, 2007].
This new approach in future studies meant a radical transformation from the usual approach of predicting likely energy futures. The assumption was that, instead of comprehending complex and uncertain supply
and demand trends, it would be proficient to picture a desirable future or set of futures, and subsequently
asses how such futures could be attained. The principle sustaining this assumption was that future energy demand is mainly a function of current policy measures [Anderson, 2001].
By that time, most of the backcasting studies were focused on soft energy (policy) paths, centering in the
starting point on a low energy demand society and the development of renewable energy technologies. This was triggered as a response to regular energy planning studies, all of which extrapolated trends and
projected a rapidly growing energy consumption, focusing vigorously on the use of fossil fuels and
nuclear power in order to cope with the predicted growth [Quist, 2007]. While the approach on energy backcasting relied on the analysis and development of policy goals, the backcasting of different
alternative energy futures relied on the implications of different policy goals, so that possibilities and
opportunities for policy measures could be identified [Robinson, 1982; Quist, 2007].

21
More recently, it has been realized that backcasting may be potentially applied in sustainability issues to a broad range of subjects due to its normative characteristics. Such studies have been developed in many
countries, but especially throughout Europe and Canada. The subjects cover themes such as transportation
and mobility systems [Höjer, 1998, 2000; Höjer and Matsson, 2000; Åkerman and Höjer, 2006; Geurs
and van Wee, 2004; Banister, et al., 2000], water issues [Falkenrmark, 1998; Kasper Kok, et al., 2011], exploration of futures for a region (Baltic Sea)[Dreborg, et al., 1999], urban energy metabolism [Höjer, et
al., 2011], CO2 emission mitigation [Fujino, et al., 2008], for the housing sector [Johnston, et al., 2005;
Svenfelt, et al., 2011], combining industrial ecology with backcasting [Giurco, et al., 2011], among others. Other efforts have been focused in combining backcasting with other approaches. For a
comparison and analysis of such hybrid studies, refer to the study made by Vergragt and Quist [2011].
3.2.2 Backcasting features
The main characteristic of backcasting scenarios is not concerned with futures that are likely to unfold,
but with how desirable futures may be achieved. Hence that it is explicitly normative, requiring working backwards from a specific desired end-point in the future towards the present situation; so that it is
possible to determine the feasibility of that future and, what is required in order to reach such end-point.
As stated by Robinson [1990]: ―backcasting is explicitly intended to suggest the implications of different
futures, chosen not on the basis of their likelihood but on the basis of other criteria defined externally to the analysis (e.g. criteria of social or environmental desirability)‖.
The commonly used time horizon for backcasting studies is 50 years. The reason that makes it appealing is because it is realistic and long enough to permit major shifts and even disruptions in technology,
lifestyles, cultural norms and values [Vergragt and Quist, 2011].
The starting point in these studies is a highly prioritized target that appears to be unattainable if current
trends and development paths continue to unfold [Höjer and Matsson, 2000]. It requires rationalization at
the initial stage in order to determine the desirable circumstances of the envisioned future, expressed as
measurable targets [IEA, 2003]. Thence that future goals and objectives need first to be set and used afterwards to develop the future scenario. Such scenario is then assessed in terms of its physical,
technological and, socioeconomic feasibility [Robinson, 1990].
According to Dreborg [1996, p.816], the use of backcasting is purposeful when:
The problem under study is complex, affecting various sectors and levels of society.
There is a need for major change.
Dominant trends are part of the problem itself.
The problem to a great extent is a matter of externalities.
The scope and time horizon are wide enough to allow deliberate choice.
The objective is then to promote a search for new development paths when the conventional ones do not seem to work out the problem. As stated by Höjer and Matsson [2000, p. 629]: ―If used in a clever way,
backcasting can be helpful in opening eyes to overlooked options. Thus, rather than being a method,
backcasting is an attitude to the research task‖.
Dreborg [1996, p.819], following the same line, emphasizes that the attributes of backcasting should in a
great extent be judged not under the context of justification, but rather in the context of discovery. It
constitutes an approach which may enhance creativity by shifting the attention from present circumstances to a future situation long enough to allow radical change. Dreborg also stresses that our
perception of what may be possible or reasonable could represent a major obstacle to real change. Hence

22
that the backcasting approach is only purposeful if the reason for analyzing the future is a willingness to,
and belief in change [Höjer and Matsson, 2000].
Another characteristic of backcasting studies accordingly to Höjer and Matsson [2000, p.629], is that they
are dependent on forecasts. They begin with a desired envisioned future and are then compared to current
predictions. If the envisioned future does not seem to be attainable according to such predictions, the task is to bring forth images of the future, scenarios that meet the targets stated at the vision.
The results obtained from a backcasting study are usually a set of target-fulfilling images of the future. They present a solution to a social problem, coupled with a discussion of what changes are required with
its associated impacts, in order to reach such future images [Börjeson, et al., 2005]. Thence, scenarios of a
backcasting study should broaden the range of possible solutions by describing new alternatives and different futures [Quist, 2007]. Moreover, the exercise of backcasting stimulates the conceptualization of
critical interrogations, the identification of uncertainties and, the recognition of bottlenecks and priority
areas for policy measures, research and technological development [IEA, 2003].
Therefore, backcasting represents a critical change of perspective. It provides a utilitarian process to focus
attention on key factors: actions and conditions that must be developed at particular points in time in
order to make the scenario attainable. The stress relies on planning to attain a specific result rather than on being prepared to response uncertain situations. It represents a more proactive attitude [IEA, 2003]. The
main drawback regarding backcasting is that its results may be translated into decisions representing a
high investment in the short term; while in the long term, the previously defined targets, or available options, may be altered before the end-point is reached [Börjeson, et al., 2005].
On the other hand, Robinson [1990] examines the broader conceptual and methodological outcomes of
backcasting: the role of learning in regards to current dominant perspectives about the future, the fact of broadening the process to a larger group of potential users and, how to shift the hegemony of present
dominant perspectives.
Such outcomes are reinforced by Vergragt and Quist [2011, p.3]: ―In its essence backcasting is a reflexive
and iterative methodology: it does not assume that a group of experts or a group of stakeholders can
develop a finalized vision of the future, which then will act as an immovable utopia. Rather, it assumes
that both vision development and pathway development encompass processes of higher order learning, in which participants learn not only about preferable futures and their contradictions, but also about the
present, about each other, about barriers and incentives, about the change agents, and about how to
improve the future vision to make it more appealing and resilient…Moreover, a vision generated in a backcasting study can become a guiding image for actors and networks, who will subsequently influence
and adopt the vision ‖.
In spite of the variety of presented backcasting approaches through different case studies, it cannot be
concluded that there is an exact or appropriate methodology for a backcasting study. The approach taken
is concerned with the specific issue and context that the user may want to address. As concluded by
Dreborg [1996, p.819]: ―It is not in itself a method in any strict sense, nor does it require any specific backcasting methods. Clearly, a backcasting study depends on scientific methods for its credibility and
this is the context of justification; but these methods should be chosen in accordance with praxis within
the scientific disciplines involved.‖
A common characteristic however, is that backcasting approaches tend to be more goal-oriented than
other approaches, by starting with a clear goal instead of finding the best suited solutions in terms of specific criteria. A long term perspective, coupled with an effort to think beyond current trends while
searching for paths to attain the target, appears to be a common characteristic of most backcasting

23
approaches [Höjer, et al., 2011]. Summaries of various backcasting approaches can be found in [Quist,
2007; Vergragt and Quist, 2011; Höjer, et al., 2011; Quist, et al., 2011]. It is in the following section where such specific features will be highlighted, through a broad classification of backcasting approaches
built from the previously stated references and aforementioned studies in this chapter.
3.3 Backcasting approaches comparison
Throughout a literature review, not claiming to be extensive, it is appreciated how a vast variety of
backcasting methodologies has evolved over the last years. As Vergragt and Quist [2011, p3] state: ―there are differences in whether stakeholder participation has been organized, in the number of steps in which
the methodology has been split, the methods that are used, the kinds of topics being addressed, the nature
and scale of the systems addressed (e.g. local, regional, national, consumption systems, or societal domains), the number of visions developed and how the visions have been developed.‖
Nevertheless, according to the structure of how the backcasting study is carried, in addition to the expected outcome, four categories of backcasting approaches may be differentiated based on previously
made studies. These are as follow:
The Natural Step: Holmberg [1998]; Holmberg and Robert [2000].
In-path oriented backcasting: Robinson [1982, 1990]; Geurs and van Wee [2004]
Target oriented backcasting: Höjer and Matsson [2000]; Åkerman and Höjer [2006]; Höjer and
others [2011].
Participatory backcasting: Quist and Vergragt [2006], Quist [2007], Vergragt and Quist [2011],
Quist and others [2011].
3.3.1 The Natural Step
The natural step methodology was proposed by Holmberg [1998] and the Natural Step Foundation (TNS) [TNS, 2011]. It lies under the rationale that in order to find strategies to achieve an envisioned scenario, it
is necessary to operate under guiding principles which may act as a framework for possible futures. While
the future may not be foreseen, its principles do. In order to fit the backcasting methodology, such principles should refer to the outcome (sustainability), and not the transition (sustainable development).
Moreover, they must be first-order principles, broad enough to cover pertinent aspects of sustainability,
allow coordination on various levels and still avoid overlapping. Strategies are then constructed aligned with the first-order principles.
Here, four general long term principles are used as a foundation for decision making. There are no images
of the future or path descriptions. Is the other way around, the aim is for the principles to guide decision making; leading to an adaptive planning. [Höjer and Matsson, 2000].
These sustainability principles are as follows [Holmberg and Robert, 2000]: 1. Nature‘s functions and diversity are not systematically subject to increasing concentrations of
substances extracted from Earth‘s crust;
2. Nature‘s functions and diversity are not systematically subject to increasing concentrations of substances produced by society;
3. Nature‘s functions and diversity are not systematically impoverished by over-harvesting or other
forms of ecosystem manipulation, and;
4. Resources are used fairly and efficiently in order to meet basic human needs worldwide.
Hence, while the three first principles give a framework for ecological sustainability, the fourth principle
refers to social sustainability. Such principles are not aimed at being prescriptive, but rather at helping

24
different actors to structure their perception of sustainability and thus serve as guidelines when they ask
themselves relevant questions.
Thus, an approach for strategic planning in sustainability consisting of four steps is described by
Holmberg [1998]:
1. Define criteria for sustainability, based on the four sustainability principles previously stated. 2. Describe current situation in relation to the criteria for sustainability. Current activities and
competences are analyzed. For each of the four principles, a number of relevant interrogations
may be formulated in order to identify if present products, services, production processes or other activities meet the principles. This makes it possible to identify bottlenecks.
3. Envision and discuss the future. Future possibilities are envisioned based on the principles (step
1) and the inventory of current situation (step 2). Given the restrictions and possibilities set by steps 1 and 2, there is usually a variety of future options. A key aspect in this step is the
avoidance of a static view from current situation by focusing on the intended service rather than
on the commodity. The main idea here is to free the mind of restrictions set by present activities
and to open the mind for future alternative options. 4. Find strategies for sustainability. Strategies that may link current situation with the envisioned
future are identified. When identifying strategies the following interrogations should be
considered: a. Will each measure bring us closer to sustainability?
b. Is each measure a flexible platform for the next step towards sustainability?
c. Will each measure pay off soon enough? d. Will the measures taken together help society making changes to achieve sustainability
without too many looses during transition?
On the other hand, Holmberg [1998] emphasizes the use of an upstream analysis, which requires the understanding of the overall system principles so that the upstream causes of a problem may be properly
understood and addressed. Thus, measures dealing with downstream problems will flow more logically.
It is worth noting that this methodology is mostly aimed at companies and organizations trying to achieve
sustainability. There is stakeholder involvement for generating ideas on how to become a sustainable
organization, mainly from the participation of employees and consultation within all levels of the
organization. Even doe no specific method is outlined, employee involvement and training, creativity techniques, and strategy development may be highlighted as proposed methods [Quist, 2007]. A summary
of this method may be appreciated in figure 3.1.
Figure 3.1 – The Natural Step backcasting methodology. Source: Holmberg, 1998, p. 33
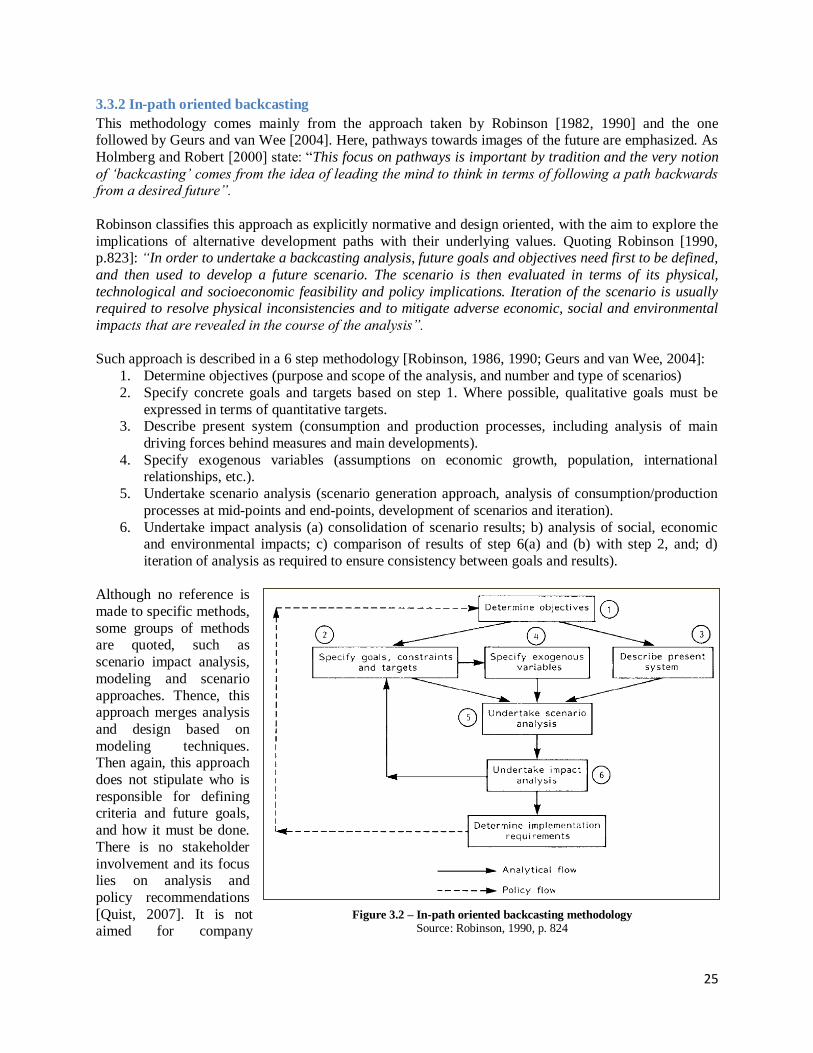
25
3.3.2 In-path oriented backcasting
This methodology comes mainly from the approach taken by Robinson [1982, 1990] and the one followed by Geurs and van Wee [2004]. Here, pathways towards images of the future are emphasized. As
Holmberg and Robert [2000] state: ―This focus on pathways is important by tradition and the very notion
of ‗backcasting‘ comes from the idea of leading the mind to think in terms of following a path backwards from a desired future‖.
Robinson classifies this approach as explicitly normative and design oriented, with the aim to explore the
implications of alternative development paths with their underlying values. Quoting Robinson [1990, p.823]: ―In order to undertake a backcasting analysis, future goals and objectives need first to be defined,
and then used to develop a future scenario. The scenario is then evaluated in terms of its physical,
technological and socioeconomic feasibility and policy implications. Iteration of the scenario is usually required to resolve physical inconsistencies and to mitigate adverse economic, social and environmental
impacts that are revealed in the course of the analysis‖.
Such approach is described in a 6 step methodology [Robinson, 1986, 1990; Geurs and van Wee, 2004]:
1. Determine objectives (purpose and scope of the analysis, and number and type of scenarios)
2. Specify concrete goals and targets based on step 1. Where possible, qualitative goals must be
expressed in terms of quantitative targets. 3. Describe present system (consumption and production processes, including analysis of main
driving forces behind measures and main developments).
4. Specify exogenous variables (assumptions on economic growth, population, international relationships, etc.).
5. Undertake scenario analysis (scenario generation approach, analysis of consumption/production
processes at mid-points and end-points, development of scenarios and iteration).
6. Undertake impact analysis (a) consolidation of scenario results; b) analysis of social, economic and environmental impacts; c) comparison of results of step 6(a) and (b) with step 2, and; d)
iteration of analysis as required to ensure consistency between goals and results).
Although no reference is
made to specific methods,
some groups of methods are quoted, such as
scenario impact analysis,
modeling and scenario
approaches. Thence, this approach merges analysis
and design based on
modeling techniques. Then again, this approach
does not stipulate who is
responsible for defining criteria and future goals,
and how it must be done.
There is no stakeholder
involvement and its focus lies on analysis and
policy recommendations
[Quist, 2007]. It is not aimed for company
Figure 3.2 – In-path oriented backcasting methodology Source: Robinson, 1990, p. 824

26
planning processes, but rather on exploring societal choices. A summary of this method may be
appreciated in figure 3.2.
3.3.2 Target-oriented backcasting
This methodology is extracted mainly by the work from Höjer and Matsson [2000], Åkerman and Höjer [2006] and, Höjer and others [2011]. Here, the focus lies in targets and descriptions of target fulfillment.
A greater attention is placed on the intrinsic values of the scenario instead the process values, in order to
assure far-reaching measures. This focus is supported by the assumption that too much emphasis on the process qualities may put a barrier to the development of strong and resilient measures to attain the
targets.
The primary justification for this approach is its ability to connect short and long term targets, identify possible conflicts between required measures and, exhibit the effects of attaining such targets.
The approach is described in a four step methodology [Höjer, et al., 2011]: 1. Target definition. A long term target is defined; it should be of crucial relevance and difficult to
reach.
2. Target analysis. The target feasibility is analyzed; if it results that the target cannot be attained in
regards to available forecasts and prevailing structure, the study continues to be developed by step 3.
3. Development of target-fulfilling scenarios or images of the future.
4. Analysis of images of the future. Such images are analyzed in terms of: a. Desirability measured by other means that those in the target.
b. Paths towards images of the future.
Throughout the approach, steps 1 and 3 are emphasized. Höjer and others [2011] stress out the importance
of understanding the goal and its fulfillment; being that by no accepting target non-fulfillment within the
study, the target fulfilling potential and associated effects may be presented and visualized. They do not
present a formal methodology doe, on whom and how should this be carried out. ‗Models or other tools‘ are presented as important instruments to help quantify the potential effects of several measures.
Åkerman and Höjer [2006] emphasize that due to the inherent uncertainty about the future, is not that relevant to work out a detailed path between future images and current situation. This is supported by the
opinion that a realistic policy must be flexible enough to cope with unexpected circumstances.
Nevertheless, future images may provide a guiding framework on what policies to start with in order to
link them towards the targets, avoiding prejudicial lock-in situations.
Another characteristic of this approach is that forecasting and backcasting are complementary. A
summary of this method may be appreciated at figure 3.3.
Figure 3.3 – Target oriented
backcasting methodology 1. Definition of target. 2. Target analysis. 3. Images of the future. 4. Analysis of the images of the future Source: Höjer, et al., 2011, p. 821

27
3.3.4 Participatory backcasting
Participatory backcasting started to be deployed in the Netherlands during the early 1990‘s. It was aimed on attaining the fulfillment of sustainable needs in the future, through a backcasting approach involving
broad stakeholder participation, future visions and, creativity use to reach beyond presently mindsets and
paradigms [Quist, 2007]. Such approach has become more commonly used throughout recent years [Höjer, et al., 2011].
It implies stakeholder involvement from every sector (companies, research bodies, government and public
interest groups and, the general public), and a continuous feedback between desirable futures and present actions. As Quist and others [2011, p. 4] quote: ―In the backcasting experiment stakeholders meet and
are involved in developing, assessing, discussing and adjusting future visions. Learning may not only
result in increased awareness of and support for these sustainable futures, but also lead to formulating follow-up agendas or transition paths. This process also leads to diffusion of the visions, and the visions
can become guiding images to the actors involved.‖
The underlying principle here is that our societies are shaped by society itself, implying that backcasting
studies originate from societal interaction processes which involve several social actors; thus, the plural
character of present societies must be considered.
Quist and Vergragt [2006] stress out that the desirable future o future visions in participatory backcasting
are not merely analytical constructs, but social constructs as well; shaped by several actors. Thence, such
visions may possess the capacity to address problems for which there is a lack of associated rules or institutions. They also highlight the benefit of higher-order learning; since interactions and negotiations
between actors may lead to learning processes on the cognitive level, values, attitudes and underlying
convictions.
For the aforementioned reasons, a feature of this approach is that different demands can be made. The
framework differentiates three types of demands, all of which need to be stated at the beginning of the
study [Quist, et al., 2011]:
Normative demands. Goal-related requirements for the desirable future, and; how the study
defines sustainability and translates it into the principles or criteria that the desirable future should
meet.
Process demands. Requirements for the involvement of stakeholders and their influence levels
regarding the way in which issues, problems and potential solutions are framed and addressed.
Knowledge demands. Requirements both to the scientific and non-scientific knowledge
endeavored for, and how these appraise each other.
Hence that several goals may be identified, not only on the content of the desirable future; but on the
whole process of follow-up and implementation as well. However, they are not necessarily evenly relevant; this will vary according to the specific nature of the study.
The approach is described in a five step methodology: 1. Strategic problem orientation. Setting of normative assumptions and goals, upon agreement
among involved stakeholders.
2. Development of future visions or scenarios 3. Backcasting analysis
4. Elaborate future alternative and define follow-up agenda
5. Embed results and agenda & stimulate follow-up / Embedding of results and generating follow-
up and implementation.

28
Quist [2007, pp.29-30] highlights that even doe the approach is deployed in a linear path; there is a
mutual influence between each step, where iteration cycles may be possible. On the other hand, he emphasizes the necessity of using a set of methods and tools; being grouped in four categories according
to their aim (each step may involve methods and tools from all the categories):
Stakeholder participation. It includes workshop tools, stakeholder creativity generation tools and,
tools for a participatory construction of vision and scenarios.
Design and development. Meant for scenario construction, as well as elaboration and detailing of
systems and, process design.
Analysis. Related to the assessment of scenarios and designs, such as consumer acceptance
studies, environmental assessments and, economic analysis. On the other hand, it is related as
well as to methods for process analysis and evaluation, stakeholder identification and stakeholder
analysis.
Process and stakeholder management. This includes methods for communication, in order to
shape and maintain stakeholder networks originated from the backcasting study itself; as well as
methods for process management.
Thus, participatory backcasting is both interdisciplinary and transdisciplinary by nature. It is
interdisciplinary by combining and incorporating methods and knowledge from diverse disciplines; whilst
it is transdisciplinary since it involves stakeholders, stakeholder knowledge and, stakeholder values
[Vergragt and Quist, 2006; Quist, 2007; Quist, et al., 2011].
A summary of this method may be appreciated at figure 3.4.
Figure 3.4 – Participatory backcasting methodology. Source: Quist, 2007, p. 232
29
4. Methodology This thesis work is focused in achieving a sustainable energy future for México. What is considered as
sustainable energy future in this case is previously stated at chapter 2.
Future scenarios are developed on the basis of final energy demand by each economic sector of México (transport, industrial, residential, services and agricultural) due to economic and population development,
availability of resources, and possible technology innovation. Both a forecasting and a backcasting
approach for future scenario development are utilized. While the forecasting approach is used to assess the possible final energy demand by 2050 for each sector and how the energy sector is likely to meet
such demand; the backcasting approach is used to establish images of the future to meet such demand in a
sustainable manner. The development of scenarios is mostly qualitative, being quantitative where possible, based on the collection and synthesis of data from different sources. No modelling technique is
utilized due to limited availability of time and resources. Prior to the development of scenarios, the
present energy situation in México is analyzed, in order to identify possible driving forces. Such analysis
is useful both for the forecasting and backcasting scenarios.
4.1 Forecasting future final energy demand Due to the case that the government of México publishes a set of studies forecasting future energy
demand and system configuration [SENER, 2010c; 2010d; 2010e; 2010f; 2011c]; the figures in these publications will be utilized for the BAU scenario up to the year 2025, which is the latest available data. It
was decided to include such figures since these studies consider detailed information regarding driving
forces that go beyond the scope of this study. Moreover, this is how the government plans to develop the energy sector in the following years.
From the 2025 to 2050 period, energy demand and supply will be forecasted according to a trend analysis
extrapolation, including a set of identified driving forces.
The way in how future energy demand evolves, will be mostly based on the annual growth rate and
participation of energy supply historical data from the period 2010-2025. Thus, GHG emissions will be calculated according to the use of energy throughout the energy system. The employed method for
calculating GHG emissions is the one proposed by the 2006 IPCC Guidelines for National Greenhouse
Gas Inventories, particularly Tier 1 method. For detailed information of such method please refer to
[IPCC, 2006].
4.2 Images of the future Once the future final energy demand requirements are estimated for each sector by the BAU scenario,
images of the future will be developed in order to provide a sustainable energy supply: 85% CO2 emissions reduction from the 2000 levels, whilst available to everybody. In this sense, such target was set
in accordance to the four overarching sustainability principles from the natural step backcasting approach,
previously described at section 3.1.1: 1. Nature‘s functions and diversity are not systematically subject to increasing concentrations of
substances extracted from Earth‘s crust;
2. Nature‘s functions and diversity are not systematically subject to increasing concentrations of
substances produced by society; 3. Nature‘s functions and diversity are not systematically impoverished by over-harvesting or other
forms of ecosystem manipulation, and;
4. Resources are used fairly and efficiently in order to meet basic human needs worldwide.

30
The next step is to create images of the future to attain target fulfillment, which will be envisioned based
on the on the sustainability principles from the natural step approach, and on the different energy sources within México and associated technologies potential reviewed in chapter 5 (current situation). As
proposed by Holmber [1998, p.38]: ―A key aspect in this step is the avoidance of a static view from
current situation by focusing on the intended service rather than on the commodity…The main idea here
is to free the mind of restrictions set by present activities and to open the mind for future alternative options.‖
The following step is to propose pathways in order to attain such sustainable future from the present situation. In this study, a higher emphasis is placed upon the inherent values of the scenario than on the
process values, so to secure far-reaching measures as proposed by the target-fulfilling backcasting
approach, previously described at section 3.3.2. As Höjer and others [2011, p.822] conclude: ―Little emphasis is placed on describing a pathway to the images of the future. Such descriptions would have
been important if the destinations (the images of the future) had been intended as planning goals and if
they had been possible to build. However, the images of the future here are intended as illustrations of
target fulfilment of some targets... By analysing such images, it should be possible to find general trends that counteract target fulfilment, as well as benefits and barriers, risks and potentials…The development
of images of the future can give new perspectives to the problem, and the discussion and analysis of the
images can actually alter what is seen as a possible change...Developing paths towards the images risks diverting attention from the main message— the increased awareness generated by presentation of
possible alternatives to mainstream futures.‖
Nevertheless, a set of general recommendations, not claiming to be exhaustive, will be proposed in how
to achieve the images of the future. These will be qualitatively evaluated following the some of the
interrogations proposed at the natural step backcasting approach, previously described at section 3.3.1:
Will each measure bring us closer to sustainability?
Is each measure a flexible platform for the next step towards sustainability?
Will the measures taken together help society making changes to achieve sustainability without
too many looses during transition?
4.3 General assumptions and limitations The electricity sector in México is composed by two modalities: 1) electricity generated by the State
company Comisión Federal de Electricidad (CFE) and by independent producers who sell their generated electricity to CFE, all of which is considered as ―electric public service‖ since it is sold by the State to the
final consumers; and 2) electricity generated for auto-supply. In this study, only the first category will be
considered due to availability or time and resources; and since it is estimated by 2025 to represent 91.5% of the total electricity generation within the country [SENER, 2010d].
For the development of scenarios, a 3.5% annual GDP growth is considered for the whole studied period.
Regarding population growth, it is expected to reach 121.9 million inhabitants by 2050 [Consejo Nacional de Población (CONAPO); 2006]

31
5. Present situation in México
This chapters starts by outlining the current legislation in México in terms of energy (5.1), followed by an
analysis of the energy resources for which México accounts for (5.2); so to analyze its energy flows as of
the year 2009 (5.3), and concludes with an analysis of its energy intensity (5.4).
5.1 Legislation
5.1.1 Structure
The regulatory framework in México establishes that the State holds the right over its natural resources
and their management, in order to maintain an ecological balance; whereas the private initiative may only exploit natural resources under permissions granted by the State. Hence that the State holds control of the
energy sector in its majority. This is established by the 27th
article of the Mexican Constitution; which
clearly states that in regard to all forms of hydrocarbons, there will not be any permissions nor concessions granted, falling exclusively to the Nation the exploitation of such resources. Moreover, it
states that it falls exclusively to the Nation the generation, conduction, transformation, distribution and
supplying of electric energy; as well as the exploitation and regulation of nuclear fuels for nuclear energy.
Thus, the production, refining and first-hand sales of hydrocarbons are activities reserved for the State,
carried out by the State company Petróleos Mexicanos (PEMEX), as well as the storage and distribution
of crude and liquid hydrocarbons prior to first-hand sales. Although the transport, storage and distribution of natural gas and Liquefied Petroleum Gas (LPG) are open to the private sector, a strict regulatory
framework is applied.
Generation and distribution of electricity, considered a public service, is also reserved for the State;
carried out by the State power company Comisión Federal de Electricidad (CFE). However, independent
energy producers may generate electricity, as long as it is sold to CFE; or destined either for self-supply,
co-generation or energy production smaller than 30 MW. Most of the private electricity generation is done for self-supply; being renewable energy projects the major source.
The energy sector in México is regulated by the Secretariat of Energy (Secretaría de Energía – SENER); being energy planning within México supported mainly by methodologies evaluating short-term
economic production costs [British Chamber of Commerce (BCC), 2010].
In order to understand México‘s actual situation, it is worth highlighting that industrial development
policies until early 1980s, comprised the expropriation of oil companies and subsidies destined to energy
goods descended from oil. The outcome was a broad use of oil-based energy sources, mostly through
inefficient processes and without consideration to the associated environmental impacts [Food and Agriculture Organization of the United Nations (FAO), 2008].
5.1.2 Policy and programs
National Development Plan 2007 - 2012 (Plan Nacional de Desarrollo – PND)
The PND is a 6 year planning instrument which basically covers all the activities enhancing development within México. It is issued at each presidential period; whereas right now it covers the Administration
from the actual president Felipe Calderón. It is aimed at establishing the national objectives, strategies
and priorities that will rule the actions derived from the present Administration, in order to create a clear development path. The ruling principle of the PND 2007-2012 is a sustainable human development;
assuming that ―the purpose of development consists in creating an atmosphere where everybody may be
32
able to grow their capacity, and opportunities may be broaden to present and future generations‖. It is
conceived under five main axes: 1) State of right and security, 2) Competitive economy, 3) Equal opportunities, 4) Environmental sustainability and, 5) Democracy.
In this sense, two objectives with associated strategies regarding energy themes are to be outlined:
1. To assure a reliable, quality and price competitive energy supply demanded by final users. 2. To reduce GHG emissions.
Energy Sectoral Program 2007 – 2012 (Programa Sectorial de Energía – PSE)
The PSE is a program derived from the National Development Plan, as well as from a relevant actors
consultation from the energy sector. Its aim is to express the objectives, strategies and actions that will
define the performance of institutions and organisms from the energy sector. The policy to be followed looks at assuring the energy supply needed to the development of the country, whilst mitigating the
environmental impact and operating with international quality standards; promoting as well a rational use
of energy and a diversification of the primary energy sources. The following subsectors with their associated objectives are to be highlighted:
Hydrocarbons
The direct domain over petroleum resources must be preserved to the State, while maximizing its
exploitation and enhancing its supply over the long term in a sustained manner; due to their importance as an input in the majority of the productive processes and, for representing a source
of high government revenues.
Promotion of schemes that allows PEMEX to increase reserves and enhance production, through
the introduction and development of new technology. It will be promoted and developed the
required infrastructure for production, transport, storage and distribution of hydrocarbons.
Electricity
To achieve a high efficiency within the organisms responsible of providing electricity as a public
service in order to reduce actual electricity tariffs.
To balance the primary energy sources portfolio, incorporating risk of availability, dependence
over imports, prices volatility and associated environmental costs. There is a clear strategy stating
the interest in analyzing the feasibility of broadening electricity generation through nuclear energy.
Energy efficiency, renewables and biofuels
To promote an efficient energy production and use; looking to provide the same service with a
lower energy consumption. This may be done by implementing financial mechanisms to allow
both the public and private sector to adopt efficient energy technologies; marketing campaigns
regarding energy use; and promotion of schemes to maximize the independent energy producer‘s participation in electricity generation through self-supply and co-generation.
To enhance the exploitation of renewable energy sources and biofuels which are technical, socio-
economic and environmentally feasible.
Environment and climate change
To mitigate to growth of GHG emissions; through actions that could decouple economic growth
from GHG emissions. This may specifically be done through more efficient production processes
and energy use patterns; as well as being lees dependant from fossil fuels.

33
National Energy Strategy 2009 – 2024 (Estrategia Nacional de Energía – ENE)
The ENE is a new instrument introduced in the national energy planning, which under new regulations as of February of 2010, it is required to be issued on a yearly basis with a horizon of a fifteen year term plan.
It derives from the National Development Plan and its purpose is to coordinate the multiple actors within
the energy sector under a common vision, set at 2024. It is composed by three main axes: energy security, productive and economic efficiency, and environmental sustainability. Departing from such axes, the
following objectives have been identified:
1. To restitute reserves, revert crude oil production decline, and maintain natural gas production
2. Diversify energy sources, increasing the share of clean technologies 3. Increase efficiency levels at energy consumption
4. Reduce environmental impacts from the energy sector
5. Invest in processing capacity in order to reduce energy supply costs 6. Strengthen transportation, storage and distribution network of oil and gas
7. Provide quality energy at competitive price at marginated regions
8. Promote technological development and human capital within the sector
Thus, the impacts of such strategy aim towards achieving the following goals by 2024:
3.3 mbopd of crude oil production (against actual levels of 2.6 mbopd)
100% replacement of hydrocarbons proven reserves (against actual levels of 72%)
8% in electricity losses (against actual levels of 11%)
98.5% electricity access (against actual levels of 97.3%)
99.4% use of natural gas (against actual levels of 90.2%)
35% of renewable energy sources participation for power generation, including nuclear and hydro
(against actual levels of 27%)
280 TWh savings in final energy consumption
The strategy also highlights the establishment of fiscal incentives for promoting investments in
sustainable energy projects, the elimination of subsidies for energy production and consumption from
fossil fuels, to enhance the participation of the private sector in the production of low intensity energy production, and the support of research in low energy intensity technologies [FAO].
Nevertheless, the strategy may be criticized because it lacks any account of scenario analysis. In order to meet the growing energy demand, the ENE relies only on the achievement of its objectives under an
optimistic scenario development; whereas the impacts or measures if this scenario is not attained are not
addressed [BBC, 2010].
National Program for a Sustainable Energy Use (Programa Nacional para el Aprovechamiento
Sustentable de Energía)
This program was created and published on November 2009 by mandate of the Law for a Sustainable
Energy Use, published in November 2008. The program defines a strategy to address the impact
generated by the final energy consumption, in order to lower energy demand and enhance energy savings
while delivering the same service. It is conceived under a vision set at 2030 and a reference scenario is accompanied with low and a high mitigation scenarios. For the low mitigation scenario the energy
reduction potential is estimated at 2,566 TWh from 2010 until 2030, representing a 12% reduction in
regard to the reference scenario; whilst the high mitigation scenario potential is estimated at 4,017 TWh, representing an 18% reduction. The major areas of opportunity identified are transport, illumination and
co-generation.
The relevant identified actions are as follow:
Transport – to limit the use of imported used cars which have high energy consumption.

34
Illumination – considers a norm that will be effective by 2012, which reduces sales of incandescent bulbs
and low efficiency fluorescent tubes. Co-generation - considers that PEMEX will be energy auto-supplied by 2012.
Home appliances – implementation of a norm which limits low efficiency fridges and heaters
Buildings – a major use of isolated materials at new residential developments located at warm climates
Special Program for the Use of Renewable Energies (Programa Especial para el Aprovechamiento de
Energías Renovables)
This program was created and published on August 2009 by mandate of the Law for the Exploitation of
Renewable Energies and Financing the Energetic Transition, published in November 2008. The program
aims at incorporating renewable energy sources into the national energy matrix, which in combination
with other initiatives associated to an efficient energy use, it will contribute to GHG emissions mitigation from the electric sector. Thus, three main objectives are set by the year 2012:
1. 7.6% share of renewable energy sources in the national installed capacity (against actual levels of
3.3%) 2. 4.5% - 6.6% share of renewable energy sources in the national electric generation (against actual
levels of 3.9%)
3. Expand electric service coverage to rural communities by renewable energies
In order to attain such objectives, the following strategies are to be outlined: promotion to information
access, development of mechanisms for the use of renewable energy sources, infrastructure and
regulation, and technology research and development.
In addition, this program includes a set of supportive subprograms:
Proyecto de Servicios Integrales de Energía – its purpose is to supply electricity access to an
approximate of 2,500 rural communities in the southern states of México without electric energy services. It is supported by the World Bank.
Proyecto de Energías Renovables a Gran Escala – started at 2007 and it aims at reducing GHG
emissions and actual barriers for the interconnection of renewable technologies to the national
electric grid. It is supported by the World Bank.
Programa Transversal de Vivienda Sustentable – it aims at transforming the concept and
constructive practices of social housing in México, through the incorporation renewable energies
and rational use of resources.
Green Mortgage – constitutes a credit which includes an additional amount so that the working
force may be able to buy an ecological housing; composed mainly by eco-technologies that
diminish gas and electricity use.
Program for the Introduction of Biofuels (Programa de Introducción de Bioenergéticos)
This program was created and published on September 2009 by mandate of the Law for Promotion and Development of Biofuels, published in February 2008. Its purpose is to develop a biofuels supply chain
and consumption within the country, as an alternative to be incorporated at the transport fuel mix. For
this, the agricultural and energetic sectors have been merged in order to determine the scope of such industry, appropriated technologies, and development of sustainable crops. In this sense, biofuels will
need to meet the national market quality requirements on a first instance, until there is enough capacity
for exports. A strong emphasis is placed into maintaining the food production integrity derived from agriculture. The replacement of forest for agriculture land in order to produce biofuels is prohibited;
biofuels crops are limitied to the available agricultural land.
The program foresees the production of both ethanol and biodiesel in the period 2007-2012 as follows:

35
Ethanol – to introduce ethanol instead of Metil Terciario Butil Eter (MTBE) through 2010-2012,
as the oxidizing component at a share of 6% on the gasoline volume within the three metropolitan
areas of México: Guadalajara, Jalisco, at a first stage, followed by Monterrey, Nuevo León, and México Valley, including Mexico City.
Biodiesel – to exploit the regional demand for diesel at agricultural and fishing activities, in order
to gradually supplant it with biodiesel.
The following strategies identified as means to attain the aim of this program are to be outlined: encourage information access, promote research, and enhance the formation of biofuels development
associations.
Climate Change Special Program 2009 – 2012 (Programa Especial de Cambio Climático)
This program was published on August 2009 and derives both from the National Strategy for Climate
Change, published on May 2007; and from the objectives set at the National Development Plan 2007 – 2012. Throughout this program, México disposes to decouple economic growth from carbon intensity.
The goal set is to reduce 50 MtCO2e by 2012 (through energy generation; energy use; agriculture, forests
and other soil uses; and waste); in order to draw the starting line for a national decarbonization.
More specifically, regarding energy generation and use, the mitigation goal represents a share of 59% out
of the 50 MtCO2e, targeted at 29.9 MtCO2e. This is mainly done by improving energy efficiency during
production and use, increasing the share of renewable energy sources, use of nuclear energy, and possibly CO2 capture and storage. On the other hand, this program proposes a vision of achieving a 30% reduction
in CO2e emissions by 2020 against the business as usual scenario, accounting for 700 MtCO2e, and a
50% reduction by 2050 (339 MtCO2e) in comparison to the year 2000 levels (644 MtCO2e); however, no clear strategies or actions are outlined after 2012. These visions are achievable under the assumption of
provision of adequate financial and technological support from developed countries as part of a global
agreement.
5.1.3 International commitment
Even doe México in not obligated by the IPCC, nor the Kyoto Protocol, to satisfy quantitative mitigation targets for reducing GHG emissions; it is committed to develop mitigation and adaptation measures, as
well as to present the ―National Communications‖ towards the United Nations (UN) competent
organisms. Such communications contain information regarding GHG emissions and the adopted
measures within the country in response to climate change.
In this sense as previously mentioned, México is willing to promote global limits to its GHG emissions,
equivalent to a 30% reduction by 2030 against the business as usual scenario; as long as these limits are not translated into barriers for socio-economic development. For this, México requires support from
industrialized countries in the form of technology cooperation, finance and capacity building. Such
schemes of cooperation are known as NAMAs; which are considered in the Climate Change Special Program 2009-2012.
5.2 Energy sources
5.2.1 Oil
Oil represents the major source of energy and the most important one within the country. According to PEMEX [2010], México had 13.99 billion barrels of oil equivalent (Bboe) proven reserves (P1) as of
January 1st, 2010. Of such reserves, 10.42 billion barrels corresponded just to crude oil (74.5%); most of
which consist of heavy crude oil varieties (62.2%), followed by light oil (29%), and extra-light oil (8.8%).
The remaining 3.57 Bboe (25.5%) is composed by condensates, natural gas liquids, and refinery
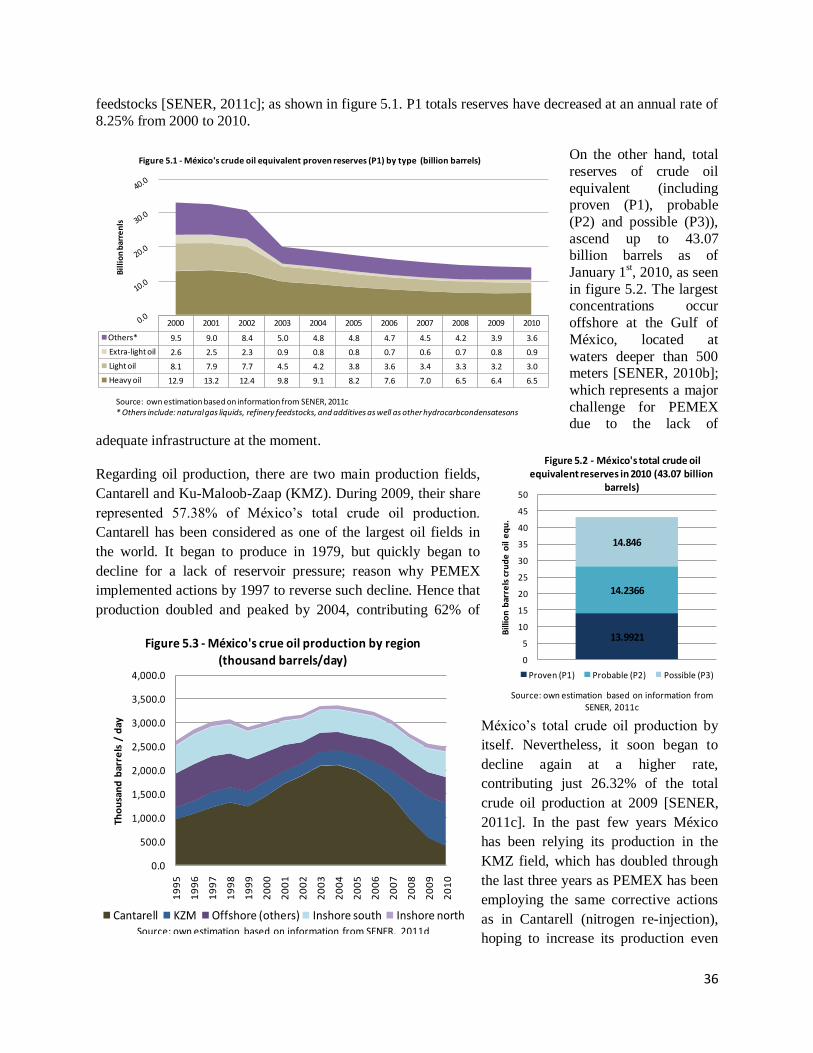
36
feedstocks [SENER, 2011c]; as shown in figure 5.1. P1 totals reserves have decreased at an annual rate of
8.25% from 2000 to 2010.
On the other hand, total
reserves of crude oil
equivalent (including proven (P1), probable
(P2) and possible (P3)),
ascend up to 43.07 billion barrels as of
January 1st, 2010, as seen
in figure 5.2. The largest concentrations occur
offshore at the Gulf of
México, located at
waters deeper than 500 meters [SENER, 2010b];
which represents a major
challenge for PEMEX due to the lack of
adequate infrastructure at the moment.
Regarding oil production, there are two main production fields,
Cantarell and Ku-Maloob-Zaap (KMZ). During 2009, their share
represented 57.38% of México‘s total crude oil production.
Cantarell has been considered as one of the largest oil fields in
the world. It began to produce in 1979, but quickly began to
decline for a lack of reservoir pressure; reason why PEMEX
implemented actions by 1997 to reverse such decline. Hence that
production doubled and peaked by 2004, contributing 62% of
México‘s total crude oil production by
itself. Nevertheless, it soon began to
decline again at a higher rate,
contributing just 26.32% of the total
crude oil production at 2009 [SENER,
2011c]. In the past few years México
has been relying its production in the
KMZ field, which has doubled through
the last three years as PEMEX has been
employing the same corrective actions
as in Cantarell (nitrogen re-injection),
hoping to increase its production even
2000 2001 2002 2003 2004 2005 2006 2007 2008 2009 2010
Others* 9.5 9.0 8.4 5.0 4.8 4.8 4.7 4.5 4.2 3.9 3.6
Extra-light oil 2.6 2.5 2.3 0.9 0.8 0.8 0.7 0.6 0.7 0.8 0.9
Light oil 8.1 7.9 7.7 4.5 4.2 3.8 3.6 3.4 3.3 3.2 3.0
Heavy oil 12.9 13.2 12.4 9.8 9.1 8.2 7.6 7.0 6.5 6.4 6.5
Bil
lio
n b
arre
nls
Figure 5.1 - México's crude oil equivalent proven reserves (P1) by type (billion barrels)
Source: own estimation based on information from SENER, 2011c* Others include: natural gas liquids, refinery feedstocks, and additives as well as other hydrocarbcondensatesons
13.9921
14.2366
14.846
0
5
10
15
20
25
30
35
40
45
50B
illio
n b
arre
ls c
rud
e o
il e
qu
.
Figure 5.2 - México's total crude oil equivalent reserves in 2010 (43.07 billion
barrels)
Proven (P1) Probable (P2) Possible (P3)
Source: own estimation based on information from SENER, 2011c
0.0
500.0
1,000.0
1,500.0
2,000.0
2,500.0
3,000.0
3,500.0
4,000.0
19
95
19
96
19
97
19
98
19
99
20
00
20
01
20
02
20
03
20
04
20
05
20
06
20
07
20
08
20
09
20
10
Tho
usa
nd
bar
rels
/ d
ay
Figure 5.3 - México's crue oil production by region
(thousand barrels/day)
Cantarell KZM Offshore (others) Inshore south Inshore northSource: own estimation based on information from SENER, 2011d

37
more. However, experts in the oil sector foresee a peak production at KMZ in the medium term [EIA,
2010b]. The remaining oil production comes mainly from smaller fields located at the southern part of
México; both offshore and inshore, as appreciated in figure 5.3. As of 2009, México produced 2,601.48
barrels of oil, accounting for 6.058.73 PJ. However, from the year 2004 (year that the Cantarell field
production and total oil production peaked) to 2010, Cantarell production has decreased at an annual rate
of 23.91%, while total oil production at an annual rate of 4.4%.
On the other hand, México relies its future oil production in Chicontepec, a field located nearby Mexico
City. Presumably, it is a potentially large source of oil, with an estimated of 17.7 Bboe of possible (P3)
reserves. Despite its potential, Chicontepec faces multiple challenges: a) it is composed by 29 different small fields spread over a large area, with a high declination rate; b) the geological conditions of the rock
and the reduced size of the fields result in low productivity dwells and low recovery rates; and c) the
fields are located underneath a dense urban population, where social issues must be first addressed. In
addition, this region lacks adequate infrastructure for large scale oil development.
As mentioned before and as appreciated in figure 5.1, the majority of oil within México is a heavy crude
oil variety. This is an issue, since México lacks the necessary refining capacity to processes heavy crudes. Thus, the country generally retains most of the lighter oil for internal consumption and exports the heavy
oils. The distribution of oil is managed by a pipeline network operated by PEMEX, connecting major
production centers with national refineries and export terminals. Most of the exports depart via tanker from three terminals located in the south of the country.
Expert‘s opinion is that oil production in México has peaked and will consequently decline; driven mainly
by the declining production of Cantarell field.
5.2.2 Natural gas
According to SENER [2010c], México had proven
(P1) reserves of natural gas
accounting for 16.81 trillion cubic feet (Tcf), as of January
1st, 2010. The majority of
natural gas within the country is mixed within the crude oil
fields, known as associated
natural gas; representing
63.73% of P1 reserves during 2010, as seen in figure 5.4.
Hence that if figures 5.1 and
5.4 are compared, it may be appreciated how a decline in
crude oil represents a decline
in associated natural gas as
well; while non-associated natural gas, which is located at independent fields, has maintained a steady balance over the past years. From 2001 to 2010, natural gas P1 reserves have decreased at an annual rate
of 9.52%.
On the other hand, total reserves of natural gas (including proven (P1), probable (P2) and possible (P3)),
ascend up to 61.23 Tcf as of January 1st, 2010, as seen in figure 5.5. Of these, 71.93% represents
associated natural gas [SENER, 2010c].
2001 2002 2003 2004 2005 2006 2007 2008 2009 2010
Non-associated 6.99 6.69 5.76 5.81 6.4 6.68 6.34 6.28 6.18 6.1
Associated 34.4 32.26 15.87 14.93 14.03 13.28 12.58 11.79 11.47 10.72
05
1015202530354045
Tril
lio
n c
ub
ic fe
et
Figure 5.4 - México's natural gas proven (P1) reserves
(trillion cubic feet)
Source: own estimation based on information from PEMEX, 2004; 2005

38
According to PEMEX [2010], the largest percentage (38.54%) of P1 reserves are located inshore south of the country; whilst the higher percentage (57.68%) of P3 reserves are located inshore north of the country,
accounting for 35.32 possible Tcf. Hence, this region is likely to be the center of future growth.
Natural gas production in 2009 was 8.2 billion cubic feet (Bcf)/day; accounting for 2,775.57 PJ. The production sites are
geographically spread throughout the country. It is worth noting
that while crude oil production at Cantarell field has been declining, its natural gas production has risen importantly;
nevertheless, due to the lack of adequate capacity to capture and
process such rise in production, natural gas flaring has increased as well. From 1999 to 2009, natural gas production increased at
an annual rate of 3.91%.
Natural gas is managed by a pipeline network operated by PEMEX, which includes import connections with the United
States (U.S.); most of the network is situated at the southern part
of the country. PEMEX processes natural gas through 11 processing centers, which is then distributed to consumption
centers mostly by PEMEX, since the private sector is allowed to
distribute it after it has been processed. It is not to be omitted that in 2009, México exported 28.3 Bcf of natural gas to the U.S., while it imported 338 Bcf [EIA, 2010b]. The rise of its demand lies in the
introduction of combined-cycle centrals for electricity generation, its substitution for oil fuel in the
industrial and electric sectors, higher demands for the oil industry processes, and a rise in gas use at the
residential and service sectors accomplished by private distributors. From 1999 to 2009, natural gas imports grew at an annual rate of 10.98%.
5.2.3 Coal
According to BP [2010] México had 1,211 million tones of coal reserves by the end of 2009 (0.1% of
world total reserves); whereas the largest percentage of reserves is located at the northern part of the country. The quality of coal is commonly poor, with high
ash content. Of the 1,211 million tones of reserves,
approximately 860 million tones (71.02%) are
bituminous coal2 with modest quantities metamorphosed
to anthracite, and 350 million tones (28.98%) are sub-
bituminous [The Encyclopedia of Earth, 2011; Wallace,
2009].
As of 2009, the majority of coal used within the country
was destined to coal-fired electricity plants of CFE (≈82%), and the rest was destined mostly to the iron and
steel industry (≈18%) [SENER, 2011d]. Even doe
México possess potential reserves for its exploitation, the
lack of adequate infrastructure and the high investment required, make production unable to meet the total
demand, mainly driven by the electricity sector. This has
2 Bituminous coal represents the most used and desired type of coal, mainly for steam, heating, gas and coking
[Wallace, 2009].
050
100150200250300350400450500
PJ
Figure 5.6 - México's coal production and imports (PJ)
Production Imports
Source: own estimation based on information from SENER, 2011d
16.81
20.7
23.72
0
10
20
30
40
50
60
70
Trill
ion
cu
bic
fe
et
Figure 5.5 - México's natural gas total reserves in 2010 (43.07 trillion cubic feet)
Proven (P1) Probable (P2) Possible (P3)
Source: own estimation based on information from SENER, 2011a
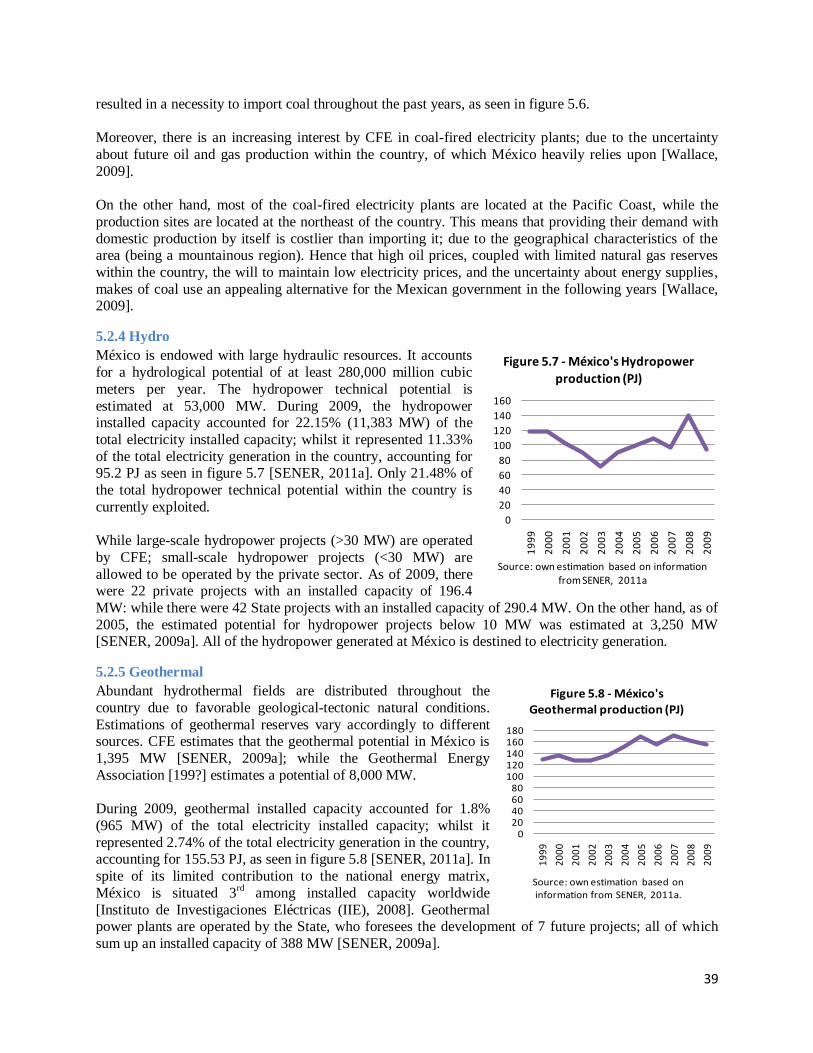
39
resulted in a necessity to import coal throughout the past years, as seen in figure 5.6.
Moreover, there is an increasing interest by CFE in coal-fired electricity plants; due to the uncertainty
about future oil and gas production within the country, of which México heavily relies upon [Wallace,
2009].
On the other hand, most of the coal-fired electricity plants are located at the Pacific Coast, while the
production sites are located at the northeast of the country. This means that providing their demand with
domestic production by itself is costlier than importing it; due to the geographical characteristics of the area (being a mountainous region). Hence that high oil prices, coupled with limited natural gas reserves
within the country, the will to maintain low electricity prices, and the uncertainty about energy supplies,
makes of coal use an appealing alternative for the Mexican government in the following years [Wallace, 2009].
5.2.4 Hydro
México is endowed with large hydraulic resources. It accounts
for a hydrological potential of at least 280,000 million cubic
meters per year. The hydropower technical potential is
estimated at 53,000 MW. During 2009, the hydropower installed capacity accounted for 22.15% (11,383 MW) of the
total electricity installed capacity; whilst it represented 11.33%
of the total electricity generation in the country, accounting for 95.2 PJ as seen in figure 5.7 [SENER, 2011a]. Only 21.48% of
the total hydropower technical potential within the country is
currently exploited.
While large-scale hydropower projects (>30 MW) are operated
by CFE; small-scale hydropower projects (<30 MW) are
allowed to be operated by the private sector. As of 2009, there were 22 private projects with an installed capacity of 196.4
MW: while there were 42 State projects with an installed capacity of 290.4 MW. On the other hand, as of
2005, the estimated potential for hydropower projects below 10 MW was estimated at 3,250 MW [SENER, 2009a]. All of the hydropower generated at México is destined to electricity generation.
5.2.5 Geothermal
Abundant hydrothermal fields are distributed throughout the
country due to favorable geological-tectonic natural conditions.
Estimations of geothermal reserves vary accordingly to different sources. CFE estimates that the geothermal potential in México is
1,395 MW [SENER, 2009a]; while the Geothermal Energy
Association [199?] estimates a potential of 8,000 MW.
During 2009, geothermal installed capacity accounted for 1.8%
(965 MW) of the total electricity installed capacity; whilst it
represented 2.74% of the total electricity generation in the country, accounting for 155.53 PJ, as seen in figure 5.8 [SENER, 2011a]. In
spite of its limited contribution to the national energy matrix,
México is situated 3rd
among installed capacity worldwide
[Instituto de Investigaciones Eléctricas (IIE), 2008]. Geothermal power plants are operated by the State, who foresees the development of 7 future projects; all of which
sum up an installed capacity of 388 MW [SENER, 2009a].
0
20
40
60
80
100
120
140
160
19
99
20
00
20
01
20
02
20
03
20
04
20
05
20
06
20
07
20
08
20
09
PJ
Figure 5.7 - México's Hydropower production (PJ)
Source: own estimation based on information from SENER, 2011a
020406080
100120140160180
19
99
20
00
20
01
20
02
20
03
20
04
20
05
20
06
20
07
20
08
20
09
PJ
Figure 5.8 - México's Geothermal production (PJ)
Source: own estimation based on information from SENER, 2011a.
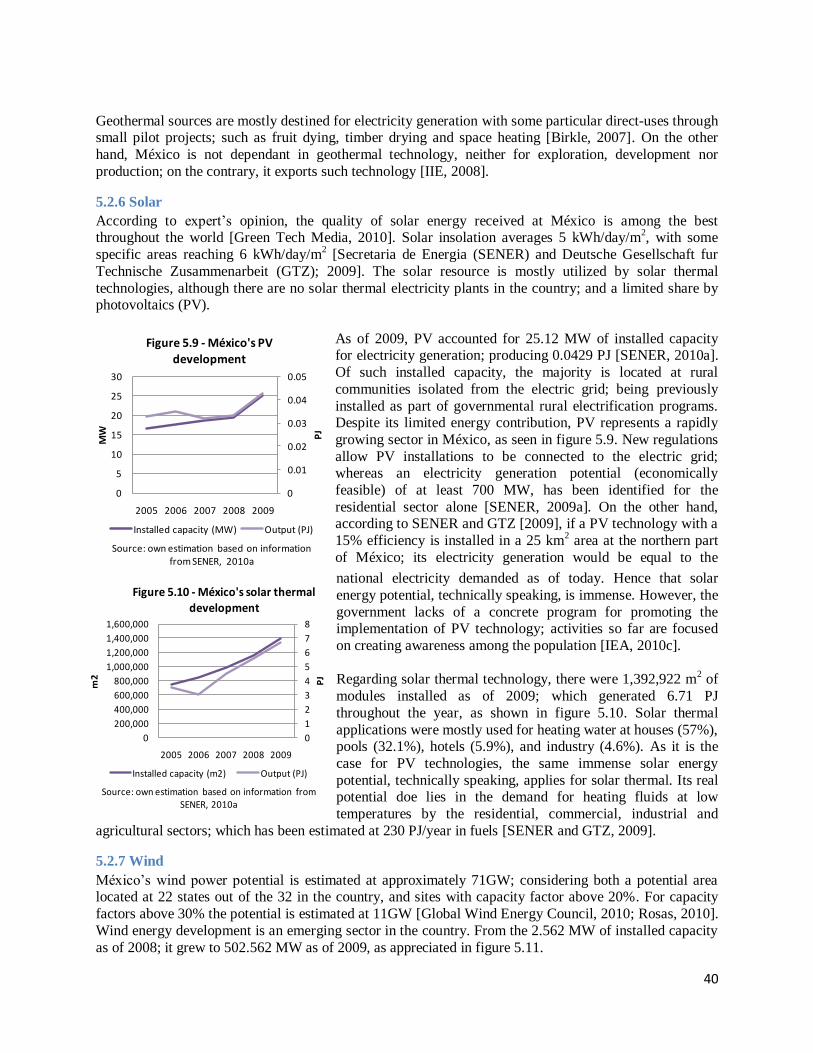
40
Geothermal sources are mostly destined for electricity generation with some particular direct-uses through small pilot projects; such as fruit dying, timber drying and space heating [Birkle, 2007]. On the other
hand, México is not dependant in geothermal technology, neither for exploration, development nor
production; on the contrary, it exports such technology [IIE, 2008].
5.2.6 Solar
According to expert‘s opinion, the quality of solar energy received at México is among the best throughout the world [Green Tech Media, 2010]. Solar insolation averages 5 kWh/day/m
2, with some
specific areas reaching 6 kWh/day/m2 [Secretaria de Energia (SENER) and Deutsche Gesellschaft fur
Technische Zusammenarbeit (GTZ); 2009]. The solar resource is mostly utilized by solar thermal
technologies, although there are no solar thermal electricity plants in the country; and a limited share by photovoltaics (PV).
As of 2009, PV accounted for 25.12 MW of installed capacity for electricity generation; producing 0.0429 PJ [SENER, 2010a].
Of such installed capacity, the majority is located at rural
communities isolated from the electric grid; being previously
installed as part of governmental rural electrification programs. Despite its limited energy contribution, PV represents a rapidly
growing sector in México, as seen in figure 5.9. New regulations
allow PV installations to be connected to the electric grid; whereas an electricity generation potential (economically
feasible) of at least 700 MW, has been identified for the
residential sector alone [SENER, 2009a]. On the other hand, according to SENER and GTZ [2009], if a PV technology with a
15% efficiency is installed in a 25 km2 area at the northern part
of México; its electricity generation would be equal to the
national electricity demanded as of today. Hence that solar
energy potential, technically speaking, is immense. However, the
government lacks of a concrete program for promoting the implementation of PV technology; activities so far are focused
on creating awareness among the population [IEA, 2010c].
Regarding solar thermal technology, there were 1,392,922 m
2 of
modules installed as of 2009; which generated 6.71 PJ
throughout the year, as shown in figure 5.10. Solar thermal
applications were mostly used for heating water at houses (57%), pools (32.1%), hotels (5.9%), and industry (4.6%). As it is the
case for PV technologies, the same immense solar energy
potential, technically speaking, applies for solar thermal. Its real potential doe lies in the demand for heating fluids at low
temperatures by the residential, commercial, industrial and
agricultural sectors; which has been estimated at 230 PJ/year in fuels [SENER and GTZ, 2009].
5.2.7 Wind
México‘s wind power potential is estimated at approximately 71GW; considering both a potential area located at 22 states out of the 32 in the country, and sites with capacity factor above 20%. For capacity
factors above 30% the potential is estimated at 11GW [Global Wind Energy Council, 2010; Rosas, 2010].
Wind energy development is an emerging sector in the country. From the 2.562 MW of installed capacity
as of 2008; it grew to 502.562 MW as of 2009, as appreciated in figure 5.11.
0
0.01
0.02
0.03
0.04
0.05
0
5
10
15
20
25
30
2005 2006 2007 2008 2009
PJ
MW
Figure 5.9 - México's PV
development
Installed capacity (MW) Output (PJ)
Source: own estimation based on informationfrom SENER, 2010a
0
1
2
3
4
5
6
7
8
0
200,000
400,000
600,000
800,000
1,000,000
1,200,000
1,400,000
1,600,000
2005 2006 2007 2008 2009
PJ
m2
Figure 5.10 - México's solar thermal development
Installed capacity (m2) Output (PJ)
Source: own estimation based on information from SENER, 2010a

41
Moreover, the government plans to sum up an installed capacity of 2,564 MW by 2012, through the development of
various wind power projects mainly in the state of Oaxaca.
Most of the projects are located at Oaxaca since it is where
interconnection developments to the electric grid have took place during the last years [SENER, 2009a].
On the other hand, a small share of wind power is utilized by water wind pumps; accounting for 2.2 MW of installed
capacity as of 2009, which generated 0.0174 PJ. However, this
sector has not experienced any growth in the past years, and there are not any government plans promoting its future use.
5.2.8 Nuclear
Nuclear energy in México is operated by law by the State, through
CFE; being destined for electricity generation. As of 2009,
nuclear energy installed capacity represented 2.64% (1,365 MW)
of total installed capacity for electricity generation; and its production accounted for 112.725 PJ (4.49% of the total
electricity generated).
As it is shown in figure 5.12, nuclear energy production has
maintained more or less the same level over the years; due to the
fact that its installed capacity has been the same ever since it was introduced in México. This has been possible by one nuclear plant
operating with two reactors. However, there is high-level
government support for nuclear energy expansion in order to
produce electricity and reduce its dependence on natural gas [SENER, 2007; World Nuclear Association (WNA), 2011].
Regarding nuclear fuel reserves, México has identified reserves of approximately 2,000 tones of uranium, although they have not been mined yet [WNA, 2011].
5.2.9 Biomass
The primary biomass sources used in the country are: 1) wood,
mainly used by the residential sector for heating and cooking
at rural communities, and; 2) sugar cane bagasse, mainly used by the sugar cane industry sector for producing heat and
electricity through 53 co-generation technology projects. As of
2009, biomass represented 3.6% of the total primary energy
produced, and 7.76% of the total final energy consumed; accounting for 354.75 PJ [SENER, 2010a]. As it is shown in
figure 5.13, energy production from biomass has maintained
more or less the same level over the years. Energy potential from biomass goes beyond from its current
use within the country. Although there are no exact figures,
the technical potential is estimated between 3,000 and 4,500
PJ per year; mostly composed by wood from agricultural and
0
20
40
60
80
100
120
140
19
99
20
00
20
01
20
02
20
03
20
04
20
05
20
06
20
07
20
08
20
09
PJ
Figure 5.12 - México's nuclear energy production
Source: own estimation based on information from SENER, 2011a
050
100150200250300350400
19
99
20
00
20
01
20
02
20
03
20
04
20
05
20
06
20
07
20
08
20
09
PJ
Figure 5.13 - México's biomass energy production
Sugar cane bagasse Wood
Source: own estimation based on information from SENER, 2011a
0
1
2
3
4
5
6
7
0
100
200
300
400
500
600
2005 2006 2007 2008 2009
PJ
MW
Figure 5.11 - México's wind power
development
Installed capacity (MW) Output (PJ)
Source: own estimation based on information from SENER, 2009a

42
forest waste, energy crops and biogas landfills [SENER and GTZ, 2009]. On the other hand, for the sugar
cane industry sector, an electricity generation potential of 10.8 PJ per year, from co-generation technology, has been estimated [SENER, 2009b].
5.3 Energy flows as of 2009
5.3.1 Energy supply
The geographical situation of México
has allowed an intensive exploitation
of fossil energy resources throughout
the years, participating with a share of 92.69% from the total primary energy
produced in 2009, as shown in figures
5.14 and 5.15. Even doe fossil fuel participation in the primary energy
production has maintained steady in
the last decade (92.6% as of 2000), a difference may be appreciated in
specific fossil fuels contribution. While
crude oil contribution decreased 7.5%;
natural gas contribution increased by 7.8%. Such behavior is mostly due to
the crude oil production decline in the
Cantarell field, as previously mentioned in section 5.3.1. Regarding
the remaining energy sources participation: nuclear energy increased by 0.2%; and renewables increased
by 0.1% [SENER, 2011d]. Despite the fact that renewables participation to the energy matrix is limited, they have experienced an important growth in the last years.
As of 2009, the total primary energy produced accounted for 9,852.92 PJ; while the total primary energy
supply (TPES)3 accounted for 8,246.96 PJ, whereas fossil fuels still contributed to the majority of the
TPES, with a share of 91.31%, as seen in figure 5.16. Within fossil fuels, natural gas and condensates
showed the higher growth from 2000 to 2009, with an annual growth of 4.6%; mostly derived from its
increased production and higher imports. On the other hand, despite the fact that crude oil supply
3 The sum of primary energy production and net trade balance of primary and secondary energy, minus unused primary energy.
Coal2.2%
Crude oil61.5%
Condensates0.9%
Natural gas28.2%
Nuclear energy1.1%
Hydro 1%
Geothermal1.6% Solar
wind 0%
Biomass3.5%
Renewables7%
Figure 5.15 - México's 2009 total primary energy production ( 9,852.92 PJ)
Source: own estimation based on information from SENER, 2011a
Coal and coke coal 4%
Crude oil 45%
Natural gas and
condensates
42%
Nuclear energy 2%
Hydro 1%
Geo, solar and wind 2%
Biomass 4%
Renewables7%
Figure 5.16 - México's 2009 total primary energy supply (8,246.96 PJ)
Source: own estimation based on information from SENER, 2011a
0
2,000
4,000
6,000
8,000
10,000
12,000
1999 2000 2001 2002 2003 2004 2005 2006 2007 2008 2009
PJ
Figure 5.14 - México's total primary energy production
Coal Crude oil Condensates Natural gas Nuclear energy Renewables
Source: own estimation based on information from SENER, 2011a

43
increased 0.6% annually from 2000 to 2009, its contribution to the TPES decreased by 6.8%; mainly due
to the higher participation of natural gas. This may be appreciated at figure 5.17. Of the 8,246.96 PJ of TPES during 2009, the total final consumption (TFC) within the country accounted for 4,795.24 PJ
(including non-energetic use). Table 5.1 shows how TPES was distributed.
Energy sector consumption refers to the energy needed for the operation of the
energy sector itself. Transformation is
achieved either by coal coking plants, oil refinery plants, gas plants, and electricity
plants; whereas the energy consumed
refers to the losses from the transformation process. Own consumption is the energy
required to operate the system structure.
Recirculation denotes the utilized gas used
reinjected at the oil fields in order to increase production. Statistical difference
is an adjusted variable to compensate
differences between supply and demand. Non-energetic consumption is the energy
that serves as input for the production of
non-energetic goods. It is to be noted that all of the renewable energies consumed
come from their primary production, except for sugar cane bagasse, since they are neither traded nor
stored; however, their consumed share varies from their production share due to the fossil fuels offer
[SENER, 2010a; 2011d].
5.3.2 Energy consumption
Total final energy consumption (TFEC) is the energy required in its final form by the transport, industrial, residential, commercial, public and agricultural sectors within the country. Their consumption evolution
may be appreciated in figure 5.18. As of 2009 (figure 5.19), TFEC accounted for 4,568.07 PJ (55.39% of
the TPES). Transport sector was the major energy consumer, with a share of 48.70% (2,224.50 PJ); and a consumption annual rate of 3.63% from 2000 to 2009, mainly by a GDP growth. Furthermore, the
number of registered vehicles for circulation increased at an annual rate of 7.6% through the last decade
[SENER, 2011d].
TPES allocation PJ %
National consumption (total) 8,246.96 100.00%
Energy sector consumption 2,826.55 34.27%
- Transformation 1,805.05 21.89%
- Own consumption 837.04 10.15%
- Distribution losses 184.45 2.24%
Recirculations 627.88 7.61%
Statistical difference -2.71 -0.03%
Total final consumption 4,795.24 58.15%
- Non-energetic consumption 227.17 2.75%
- Energetic consumption 4,568.07 55.39%
Table 5.1 - 2009 TPES allocation
Source: Own estimation based on information from SENER, 2011a
0
1,000
2,000
3,000
4,000
5,000
6,000
7,000
8,000
9,000
1999 2000 2001 2002 2003 2004 2005 2006 2007 2008 2009
PJ
Figure 5.17 - México's total primary energy supply
Coal Crude oil Natural gas Nuclear Renewables
Source: own estimation based on information from SENER, 2011a

44
Industrial sector has maintained its position as the second largest energy consumer from 2000 to 2009;
although its energy consumption decreased at annual rate of 0.5%. This was mostly due to an annual rate
decrease of 0.3% at the manufacturing industry GDP. During 2009, it industry represented 28.10% (1,283.6 PJ) of the TFEC.
Residential sector represents the third largest energy consumer, with a share of 16.68% (761.79 PJ) as of 2009; growing at a 0.46% annual rate from 2000 to 2009, period in which the national population
increased by 1%. The commercial and public, and agricultural sectors represent just 6.53% of the TFEC;
whereas their consumption has maintained at steady levels over the years [SENER, 2011d].
As appreciated in figure 5.18, the main driver for an increased TFEC has been a growth in the energy
demanded by the transport sector; which needs to be covered mostly by oil and oil derivates, as shown in
table 5.2. Hence that from 2000 to 2009, oil and oil derivates consumption grew at an annual rate of 2.02%; mostly due to a 4.6% annual increase in gasoline and naphtha. Thus, as of 2009, gasoline and
naphtha represented the major source of energy consumed, accounting for 32.81% (1,498.76 PJ) of the
TFEC. Diesel represented the second major source of energy consumed, accounting for 15.99% (730.48 PJ) of the TFEC and an annual growth rate of 2.75%; mainly driven by the transport sector as well.
0
1,000
2,000
3,000
4,000
5,000
6,000
19
99
20
00
20
01
20
02
20
03
20
04
20
05
20
06
20
07
20
08
20
09
PJ
Figure 5.18 - Total final energy consumption evolution by sector
Industrial
Agricultural
Transport
Commercial and publicResidential
Source: own estimation based on information from SENER, 2011a
Residential16.68%
Commercial and public
3%
Transport48.70%
Agricultural3.21%
Industrial28.10%
Figure 5.19 - 2009 Total final energy consumption by sector (4,568.07 PJ)
Source: own estimation based on information from SENER, 2011a
Energy source / Sector Transport Industry ResidentialCommercial
and publicAgricultural Total Percentage
Gasoline and naphtha 1498.764 - - - - 1498.764 32.81%
Diesel 567.607 51.755 - 3.334 107.788 730.484 15.99%
Electricity 4.018 365.774 177.167 76.63 33.476 657.065 14.38%
Natural gas 0.536 478.7 29.079 8.659 - 516.974 11.32%
LNG 38.94 39.489 290.178 60.423 5.217 434.247 9.51%
Renewables - 87.624 264.525 2.592 - 354.741 7.77%
Oil coke - 129.444 - - - 129.444 2.83%
Kerosene 109.872 0.001 0.839 - 0.05 110.762 2.42%
Oil fuel 4.765 84.074 - - - 88.839 1.94%
Coal coke - 40.805 - - - 40.805 0.89%
Coal - 5.937 - - - 5.937 0.13%
Total 2224.502 1283.603 761.788 151.638 146.531
Percentage 48.70% 28.10% 16.68% 3.32% 3.21%4568.07
Table 5.2 - 2009 Total final energy consumption by energy source vs. sector (PJ)
Source: Own estimation based on information from SENER, 2011a

45
Electricity consumption represented 14.38% (657.07 PJ) of the TFEC as of 2009; growing at an annual
rate of 1.75% during 2000 to 2009. This was mainly driven by the industrial sector, which is the major electricity consumer, followed by the residential sector. Followed by electricity, natural gas consumed
11.32% (516.97 PJ) of the TFEC; mainly due to the industrial sector as well, the major natural gas
consumer sector.
5.4 Energy intensity
Economic growth, measured in terms of GDP, shows a tight relation towards the total amount of energy
demanded at the country. In this sense, energy intensity (figure 5.20) measures the energy required to produce a
Mexican peso (national currency) of GDP. From 2000 to
2005, it is appreciated a growth in energy intensity, due to the fact that national energy consumption grew at a higher
rate than GDP. From 2005 to 2007 a decline in energy
intensity emerged due to a more rational use of energy; mostly because of the industry sector and a higher
efficiency at the gas and electric generation plants. The
last couple of years showed a higher energy intensity;
mainly due to the global financial crisis, affecting the economic and productive activities of the country
[SENER, 2011d].
860
880
900
920
940
960
980
1,000
MJ
Figure 5.20 - Energy intensity evolution (KJ/$ produced)
Source: own estimation based on information from SENER, 2011a

46
6. 2050: Business As Usual (BAU) scenario
This chapters starts by specifying the general assumptions made for the scenario building (6.1), followed
by forecasting the future energy demand for each energy consuming sector within the entire energy
system (6.2); in order to forecast how the Mexican energy system will meet such demand (6.3). Thus, a calculation of GHG emissions within the energy system will be made in order to estimate if such
emissions meet the required target for mitigating climate change, and identify potential opportunity areas
to reduce GHG emissions if such target is not met (6.4)
6.1 General assumptions As explained in section 4.1, there are a set of official publications from the Mexican government
[SENER, 2010c; 2010d; 2010f; 2010e; 2011c] in order to forecast future energy demand and supply up to the year 2025. For the development of this scenario, the figures and assumptions created at such
publications will be utilized. For the period from 2025 to 2050, trends will be extrapolated based on
annual compound growth rates and identified driving forces from the period 2010 to 2025. It is to be
noted that all of the aforementioned government programs, initiatives and new reforms in the Mexican energy sector (section 5.1), are considered as driving forces and assumed in the development of the
Mexican publications for the period 2010-2025.
Due to the fact that such publications already consider and assume the participation of renewable energy
sources into the energy matrix to meet energy demand, this study will exclude from the future final
energy demand the energy contributed by such sources; since these are considered as clean energies with
zero or minimum emissions that contribute to climate change. Thus, if the final objective of this study is to account for GHG emissions and their possible mitigation, it will only focus on the energy sources that
contribute to climate change.
On the other hand, since all the figures estimated at the Mexican publications are measured in different
units, in order to express them in terms of energy and uniformly throughout this study, the associated
conversion factors used are the ones published by SENER [2010a, p.99] for the year 2009. For further detail refer to annex 6a. Also, a value of 364.25 days per year was assumed, since several data is
published in terms of barrels per day. Hence that the calculated figures may present final statistical
differences in accordance to the assumed conversion factors.
Regarding activity levels, it is assumed that GDP will keep on growing at an annual rate of 3.5% until the
period 2050 [CICC, 2009], and that population will reach 121.9 million inhabitants by 2050 [CONAPO,
2006].
6.2 Energy demand by end-use sectors
6.2.1 Transport sector
6.2.1.1 Auto-transport
By 2025, it is estimated that the there will be 50.1 million vehicles for auto-transportation; from which
95.6% will be gasoline-based, 4.2% diesel-based, 0.2% LP gas-based, and 0.01% compressed natural gas (CNG) based. A reduction in LP gas vehicles takes place due to future LP gas prices against its
competitors (gasoline, diesel and CNG). Although hybrid and electric vehicles are included in this
projection, they represent a limited share among the total vehicle fleet.

47
For this projection, the main determinants are GDP, fuel price, and probable technology penetration in the
number of vehicles for each year. Vehicle size is also considered (light, compact, sub-compact or luxury)
with their associated efficiency development. It is assumed as well that new regulations will take place regarding minimum quality standards for the marketed vehicles. Gasoline will still be the major energy
resource for the auto-transport sector, as shown in table 6.2; mainly driven by an increase in gasoline-
based vehicles. Hence that gasoline will need to be imported in order to meet its demand, despite two infrastructure projects to produce more gasoline which will start operating by 2012 and 2016.
6.2.1.2 Railway, maritime and aerial
The railway system in México is driven by diesel. The main determinant for its demand will be economic
growth, since it is mostly used for freight by the industry sector. Thus, SENER [2010e] estimates that
diesel demand for such subsector will grow at an annual rate of 3.5%; reaching 19.4 thousand barrels of oil equivalent per day (kboe/d)(40.22 PJ) in 2025.
Maritime transport will grow its demand for diesel at an annual rate of 2.53%; reaching 19.1 kboe/d (44.38 PJ) in 2025. This demand is driven by the recovery of the national and global economy,
particularly international commerce, influencing imports/exports via maritime. Moreover, there is a
projected infrastructure development for the Manzanillo port, with a capacity of two million containers per year; and a multimodal project at Bahía Colonet with a railway connected the United States. There is
also another project for the Veracruz port in order to increase its capacity [SENER, 2010e].
Aerial transport will increase its demand for jet fuel at an annual rate of 3.0%; reaching 85.8 kboe/d (199.49 PJ) in 2025. Such demand is driven by the enlargement of 31 existing airports and the
construction of tree new airports (as stipulated at the National Infrastructure Plan 2007-2012) in order to
increase air freight and tourism flights [SENER, 2010e].
6.2.1.3 Subtotal
The results of extrapolating the 2025 estimated values into the year 2050 are shown in table 6.3; while the
growth comparison from such period is shown at figure 6.1.
Fuel 2010 2013 2016 2019 2022 2025 CAGR¹
Total 23,550 26,916 31,904 37,531 43,634 50,069 5.16%
Gasoline 22,370 25,591 30,418 35,812 41,673 47,858 5.20%
Diesel 991 1,171 1,374 1,612 1,853 2,104 5.15%
LP Gas 186 151 106 100 100 100 -4.07%
CNG² 3 4 5 6 7 7 6.32%
¹ Compound Annual Growth Rate ² Compressed Natural Gas
Source: modified from SENER [2010e, p. 153]
Table 6.1 - Auto-transportation vehicle fleet by fuel type (thousand vehicles)
Fuel 2010 2013 2016 2019 2022 2025 CAGR¹
Gasoline 1530.29 1695.49 1899.01 2102.60 2247.94 2378.26 2.98%
Diesel 646.05 705.01 781.02 859.00 932.78 1023.33 3.11%
LP Gas 35.05 27.41 24.34 23.25 23.09 22.85 -2.81%
Natural gas 0.60 0.72 0.88 1.12 1.30 1.29 5.26%
¹ Compound Annual Growth Rate
Source: own estimation based on information from SENER [2010a; 2010e]
Table 6.2 - Fuel demand by auto-transportation (PJ)
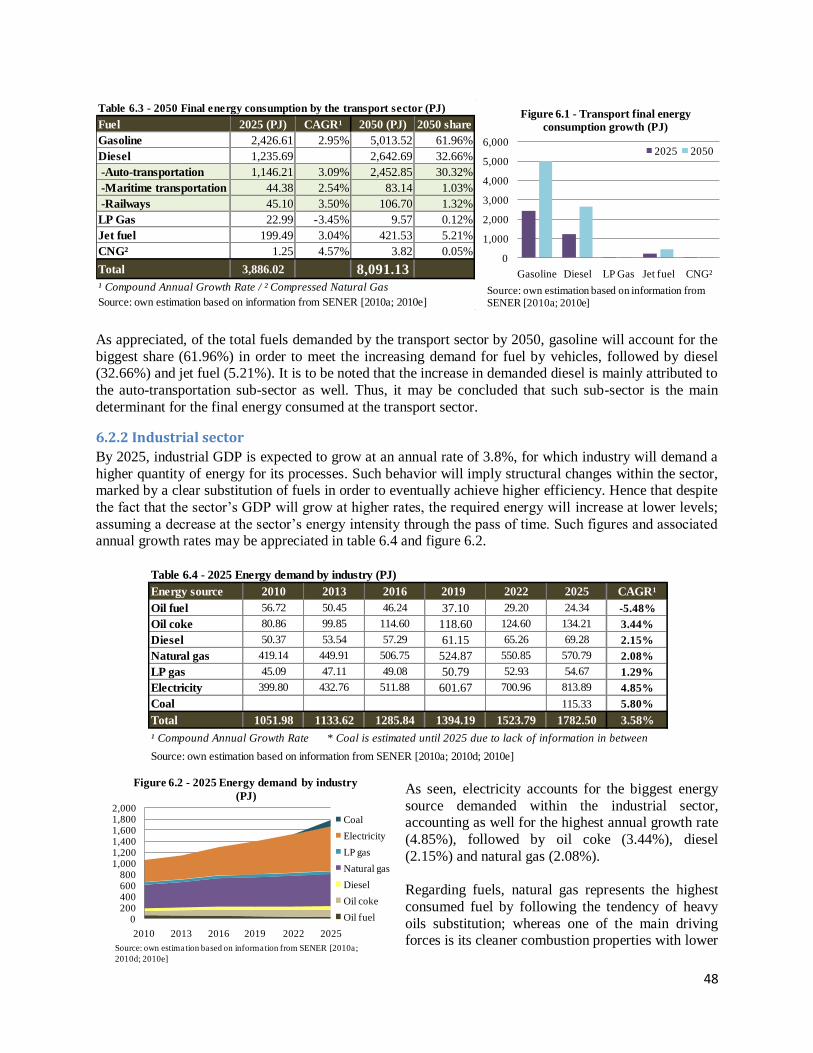
48
Table 6.3 - 2050 Final energy consumption by the transport sector (PJ)
Fuel 2025 (PJ) CAGR¹ 2050 (PJ) 2050 share
Gasoline 2,426.61 2.95% 5,013.52 61.96%
Diesel 1,235.69 2,642.69 32.66%
-Auto-transportation 1,146.21 3.09% 2,452.85 30.32%
-Maritime transportation 44.38 2.54% 83.14 1.03%
-Railways 45.10 3.50% 106.70 1.32%
LP Gas 22.99 -3.45% 9.57 0.12%
Jet fuel 199.49 3.04% 421.53 5.21%
CNG² 1.25 4.57% 3.82 0.05%
Total 3,886.02 8,091.13
¹ Compound Annual Growth Rate / ² Compressed Natural Gas
Source: own estimation based on information from SENER [2010a; 2010e]
0
1,000
2,000
3,000
4,000
5,000
6,000
Gasoline Diesel LP Gas Jet fuel CNG²
Figure 6.1 - Transport final energy
consumption growth (PJ)
2025 2050
Source: own estimation based on information from SENER [2010a; 2010e]
As appreciated, of the total fuels demanded by the transport sector by 2050, gasoline will account for the
biggest share (61.96%) in order to meet the increasing demand for fuel by vehicles, followed by diesel (32.66%) and jet fuel (5.21%). It is to be noted that the increase in demanded diesel is mainly attributed to
the auto-transportation sub-sector as well. Thus, it may be concluded that such sub-sector is the main
determinant for the final energy consumed at the transport sector.
6.2.2 Industrial sector
By 2025, industrial GDP is expected to grow at an annual rate of 3.8%, for which industry will demand a
higher quantity of energy for its processes. Such behavior will imply structural changes within the sector, marked by a clear substitution of fuels in order to eventually achieve higher efficiency. Hence that despite
the fact that the sector‘s GDP will grow at higher rates, the required energy will increase at lower levels;
assuming a decrease at the sector‘s energy intensity through the pass of time. Such figures and associated annual growth rates may be appreciated in table 6.4 and figure 6.2.
As seen, electricity accounts for the biggest energy
source demanded within the industrial sector, accounting as well for the highest annual growth rate
(4.85%), followed by oil coke (3.44%), diesel
(2.15%) and natural gas (2.08%).
Regarding fuels, natural gas represents the highest
consumed fuel by following the tendency of heavy
oils substitution; whereas one of the main driving forces is its cleaner combustion properties with lower
Energy source 2010 2013 2016 2019 2022 2025 CAGR¹
Oil fuel 56.72 50.45 46.24 37.10 29.20 24.34 -5.48%
Oil coke 80.86 99.85 114.60 118.60 124.60 134.21 3.44%
Diesel 50.37 53.54 57.29 61.15 65.26 69.28 2.15%
Natural gas 419.14 449.91 506.75 524.87 550.85 570.79 2.08%
LP gas 45.09 47.11 49.08 50.79 52.93 54.67 1.29%
Electricity 399.80 432.76 511.88 601.67 700.96 813.89 4.85%
Coal 115.33 5.80%
Total 1051.98 1133.62 1285.84 1394.19 1523.79 1782.50 3.58%
Source: own estimation based on information from SENER [2010a; 2010d; 2010e]
Table 6.4 - 2025 Energy demand by industry (PJ)
¹ Compound Annual Growth Rate * Coal is estimated until 2025 due to lack of information in between
0200400600800
1,0001,2001,4001,6001,8002,000
2010 2013 2016 2019 2022 2025
Figure 6.2 - 2025 Energy demand by industry
(PJ)
Coal
Electricity
LP gas
Natural gas
Diesel
Oil coke
Oil fuel
Source: own estimation based on information from SENER [2010a;
2010d; 2010e]
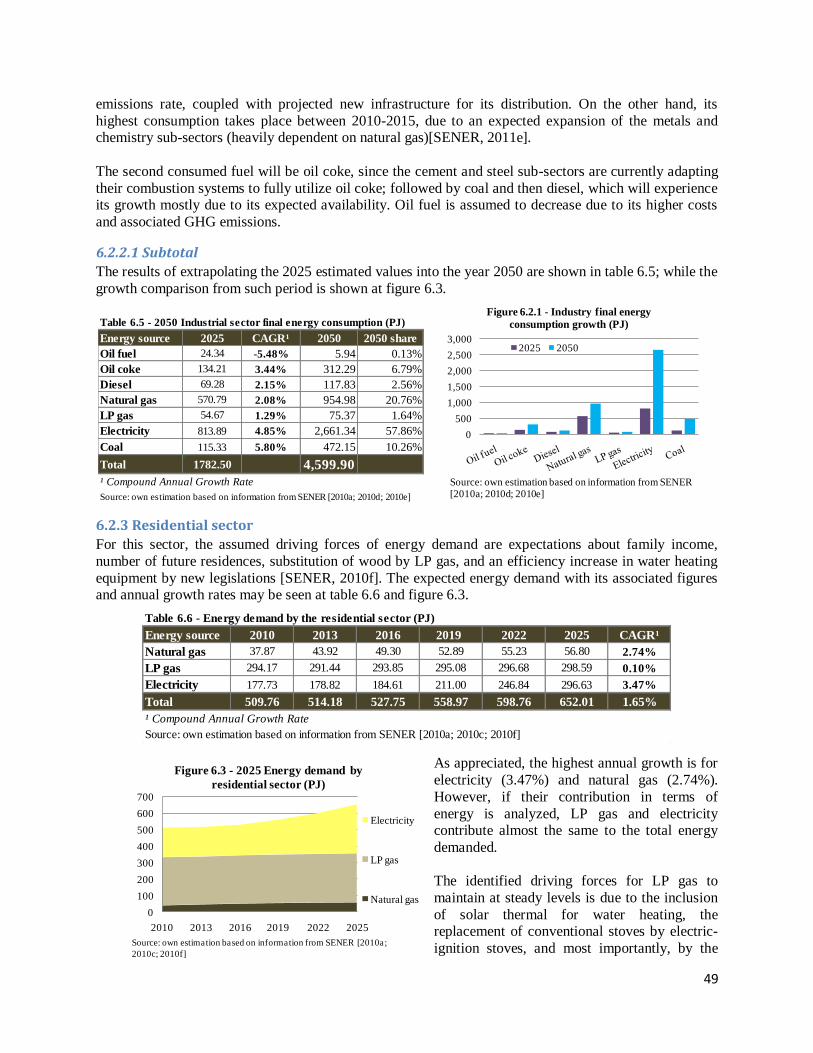
49
emissions rate, coupled with projected new infrastructure for its distribution. On the other hand, its
highest consumption takes place between 2010-2015, due to an expected expansion of the metals and chemistry sub-sectors (heavily dependent on natural gas)[SENER, 2011e].
The second consumed fuel will be oil coke, since the cement and steel sub-sectors are currently adapting
their combustion systems to fully utilize oil coke; followed by coal and then diesel, which will experience its growth mostly due to its expected availability. Oil fuel is assumed to decrease due to its higher costs
and associated GHG emissions.
6.2.2.1 Subtotal
The results of extrapolating the 2025 estimated values into the year 2050 are shown in table 6.5; while the
growth comparison from such period is shown at figure 6.3.
6.2.3 Residential sector
For this sector, the assumed driving forces of energy demand are expectations about family income,
number of future residences, substitution of wood by LP gas, and an efficiency increase in water heating
equipment by new legislations [SENER, 2010f]. The expected energy demand with its associated figures and annual growth rates may be seen at table 6.6 and figure 6.3.
As appreciated, the highest annual growth is for
electricity (3.47%) and natural gas (2.74%).
However, if their contribution in terms of
energy is analyzed, LP gas and electricity contribute almost the same to the total energy
demanded.
The identified driving forces for LP gas to
maintain at steady levels is due to the inclusion
of solar thermal for water heating, the replacement of conventional stoves by electric-
ignition stoves, and most importantly, by the
Table 6.5 - 2050 Industrial sector final energy consumption (PJ)
Energy source 2025 CAGR¹ 2050 2050 share
Oil fuel 24.34 -5.48% 5.94 0.13%
Oil coke 134.21 3.44% 312.29 6.79%
Diesel 69.28 2.15% 117.83 2.56%
Natural gas 570.79 2.08% 954.98 20.76%
LP gas 54.67 1.29% 75.37 1.64%
Electricity 813.89 4.85% 2,661.34 57.86%
Coal 115.33 5.80% 472.15 10.26%
Total 1782.50 4,599.90
¹ Compound Annual Growth Rate
Source: own estimation based on information from SENER [2010a; 2010d; 2010e]
0
100
200
300
400
500
600
700
2010 2013 2016 2019 2022 2025
Figure 6.3 - 2025 Energy demand by
residential sector (PJ)
Electricity
LP gas
Natural gas
Source: own estimation based on information from SENER [2010a;
2010c; 2010f]
Table 6.6 - Energy demand by the residential sector (PJ)
Energy source 2010 2013 2016 2019 2022 2025 CAGR¹
Natural gas 37.87 43.92 49.30 52.89 55.23 56.80 2.74%
LP gas 294.17 291.44 293.85 295.08 296.68 298.59 0.10%
Electricity 177.73 178.82 184.61 211.00 246.84 296.63 3.47%
Total 509.76 514.18 527.75 558.97 598.76 652.01 1.65%
¹ Compound Annual Growth Rate
Source: own estimation based on information from SENER [2010a; 2010c; 2010f]
0
500
1,000
1,500
2,000
2,500
3,000
Figure 6.2.1 - Industry final energy
consumption growth (PJ)
2025 2050
Source: own estimation based on information from SENER [2010a; 2010d; 2010e]

50
efficiency evolution of conventional heaters [SENER, 2010f]. Although natural gas is the smaller energy
contributor, its demand growth lies at new urban developments with a potential market for consumption, new pipeline infrastructure for its distribution, and by agreements made with construction agencies in
order to have access to their future developments [SENER, 2010c].
6.2.3.1 Subtotal
The results of extrapolating the 2025 estimated values into the year 2050 are shown in table 6.7; while the
growth comparison from such period is shown at figure 6.4.
6.2.4 Service sector
For this sector, the assumed driving forces are basically the same as for the residential sector, particularly
in the use of natural gas and LP gas. The expected energy demand with its associated figures and annual
growth rates may be seen at table 6.8 and figure 6.4.
As appreciated, the major source of energy demanded by annual growth is electricity
(5.57%), followed by natural gas (0.89%);
whereas LP gas and diesel will experience a decrease. For natural gas, its demand is mainly
driven by the availability of infrastructure
guarantying its constant supply at urban areas.
On the other hand, despite LP gas contributes
higher levels of energy than natural gas; it will
contribute lesser through the pass of time. Its use is mainly attributed to specific applications within
restaurants, hotels, hospitals, kitchens and
laundries; whereas it is assumed that a better administration at the business economy will decrease its use due to the associated economic benefits [SENER, 2010f].
Table 6.8 - 2025 Energy demand by service sector (PJ)
Energy source 2010 2013 2016 2019 2022 2025 CAGR¹
Natural gas 10.90 11.58 12.11 12.44 12.47 12.45 0.89%
LP gas 63.14 61.18 59.27 57.47 55.92 54.66 -0.96%
Electricity 75.97 89.53 105.57 124.78 147.82 175.75 5.75%
Diesel* 3.31 3.26 3.20 3.15 3.10 3.04 -0.57%
Total 153.32 165.55 180.16 197.84 219.31 245.91 3.20%
* Diesel demand was calculated by the CAGR from the period 1999-2009, due to lack of available information
¹ Compound Annual Growth Rate
Source: own estimation based on information from SENER [2010a; 2010c; 2010d; 2010f; 2011a]
Table 6.7 - 2050 Energy demand by the residential sector (PJ)
Energy source 2025 CAGR¹ 2050 2050 share
Natural gas 56.80 2.74% 111.62 10.02%
LP gas 298.59 0.10% 306.11 27.47%
Electricity 296.63 3.47% 696.57 62.51%
Total 652.01 1114.30
¹ Compound Annual Growth Rate
Source: own estimation based on information from SENER [2010a; 2010c; 2010f]
0
200
400
600
800
Natural gas LP gas Electricity
Figure 6.4 - Residential sector final energy
consumption growth (PJ)
2025 2050
Source: own estimation based on information from SENER [2010a; 2010c; 2010f]
0
50
100
150
200
250
300
2010 2013 2016 2019 2022 2025
Figure 6.5 - 2025 Energy demand by industry
(PJ)
Diesel
Electricity
LP gas
Natural gas
Source: own estimation based on information from SENER [2010a;
2010c; 2010d; 2010f; 2011a]

51
6.2.4.1 Subtotal
The results of extrapolating the 2025 estimated values into the year 2050 are shown in table 6.9; while the growth comparison from such period is shown at figure 6.5.
As appreciated, the majority of the energy consumed within the service sector will come from electricity
(92.08%). If only fuels are considered, the largest source will be LP gas, despite its declining rate over the
studied period; followed by natural gas which will keep on growing and diesel, maintaining at steady levels.
6.2.5 Agricultural sector
The expected energy demand with its associated figures and annual growth rates may be seen at table 6.10 and figure 6.7.
The higher demand for energy and growth rate will be contributed by diesel, representing most
of the energy used within the sector. The second
energy source will be electricity, which is used
for water pumping in order to irrigate crop fields. Despite the limited contribution by LP
gas, this fuel represents an important energy
source at places where other fuels face introduction barriers such as transportation and
distribution infrastructure.
LP gas use is destined to heating activities in
order to dry seeds and other crops.
Table 6.10 - 2025 Energy demand by agricultural sector (PJ)
Energy source 2010 2013 2016 2019 2022 2025 CAGR¹
LP Gas 5.88 6.19 6.50 6.79 7.30 7.73 1.84%
Electricity 33.07 34.76 36.93 39.45 42.76 46.55 2.31%
Diesel* 111.11 121.70 133.31 146.02 159.94 175.19 3.08%
Total 150.06 162.66 176.74 192.26 209.99 229.47 2.87%
* Diesel demand was calculated by the CAGR from the period 1999-2009, due to lack of available information
¹ Compound Annual Growth Rate
Source: own estimation based on information from SENER [2010a; 2010d; 2010f; 2011a]
Table 6.9 - 2050 Service sector final energy consumption (PJ)
Energy source 2025 CAGR¹ 2050 2050 share
Natural gas 12.45 0.89% 15.54 2.01%
LP gas 54.66 -0.96% 42.99 5.57%
Electricity 175.75 5.75% 711.16 92.08%
Diesel 3.04 -0.57% 2.64 0.34%
Total 245.91 772.33
¹ Compound Annual Growth Rate
Source: own estimation based on information from
SENER [2010a; 2010c; 2010d; 2010f; 2011a]
0
50
100
150
200
250
2010 2013 2016 2019 2022 2025
Figure 6.7 - 2025 Energy demand by
agriculture (PJ)
Diesel
Electricity
LP Gas
Source: own estimation based on information from SENER [2010a;
2010d; 2010f; 2011a]
0
200
400
600
800
Natural gas LP gas Electricity Diesel
Figure 6.6 - Service sector final energy
consumption growth (PJ)
2025 2050
Source: own estimation based on information from SENER [2010a; 2010c; 2010d; 2010f; 2011a]
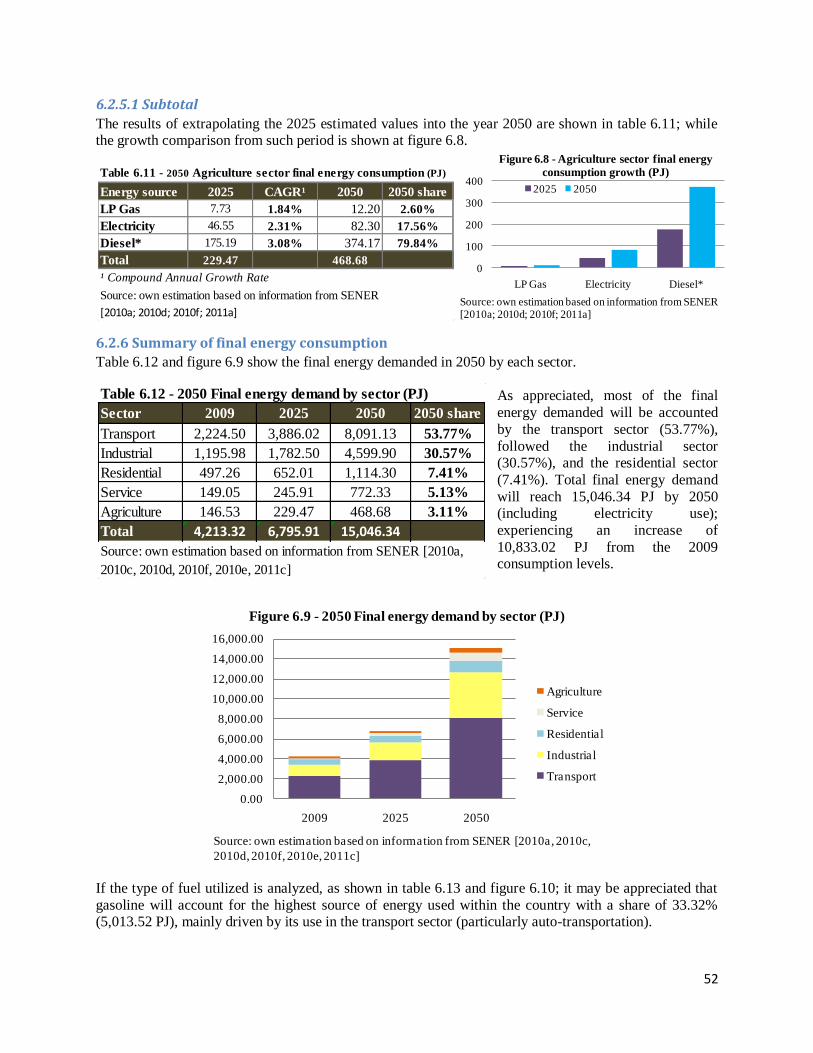
52
6.2.5.1 Subtotal
The results of extrapolating the 2025 estimated values into the year 2050 are shown in table 6.11; while the growth comparison from such period is shown at figure 6.8.
6.2.6 Summary of final energy consumption
Table 6.12 and figure 6.9 show the final energy demanded in 2050 by each sector.
As appreciated, most of the final
energy demanded will be accounted
by the transport sector (53.77%),
followed the industrial sector (30.57%), and the residential sector
(7.41%). Total final energy demand
will reach 15,046.34 PJ by 2050 (including electricity use);
experiencing an increase of
10,833.02 PJ from the 2009 consumption levels.
If the type of fuel utilized is analyzed, as shown in table 6.13 and figure 6.10; it may be appreciated that
gasoline will account for the highest source of energy used within the country with a share of 33.32% (5,013.52 PJ), mainly driven by its use in the transport sector (particularly auto-transportation).
0.00
2,000.00
4,000.00
6,000.00
8,000.00
10,000.00
12,000.00
14,000.00
16,000.00
2009 2025 2050
Figure 6.9 - 2050 Final energy demand by sector (PJ)
Agriculture
Service
Residential
Industrial
Transport
Source: own estimation based on information from SENER [2010a, 2010c,
2010d, 2010f, 2010e, 2011c]
0
100
200
300
400
LP Gas Electricity Diesel*
Figure 6.8 - Agriculture sector final energy
consumption growth (PJ)
2025 2050
Source: own estimation based on information from SENER [2010a; 2010d; 2010f; 2011a]
Table 6.11 - 2050 Agriculture sector final energy consumption (PJ)
Energy source 2025 CAGR¹ 2050 2050 share
LP Gas 7.73 1.84% 12.20 2.60%
Electricity 46.55 2.31% 82.30 17.56%
Diesel* 175.19 3.08% 374.17 79.84%
Total 229.47 468.68
¹ Compound Annual Growth Rate
Source: own estimation based on information from SENER
[2010a; 2010d; 2010f; 2011a]
Table 6.12 - 2050 Final energy demand by sector (PJ)
Sector 2009 2025 2050 2050 share
Transport 2,224.50 3,886.02 8,091.13 53.77%
Industrial 1,195.98 1,782.50 4,599.90 30.57%
Residential 497.26 652.01 1,114.30 7.41%
Service 149.05 245.91 772.33 5.13%
Agriculture 146.53 229.47 468.68 3.11%
Total 4,213.32 6,795.91 15,046.34
Source: own estimation based on information from SENER [2010a,
2010c, 2010d, 2010f, 2010e, 2011c]

53
Electricity will be the second largest
source of energy consumed, accounting for a share of 27.59% (3,137.33 PJ);
mostly driven by its demand in the
industrial sector.
Diesel will account for a share of 20.85%
(3,137.33 PJ); mainly driven by the
transport sector as well, particularly from auto-transportation. Natural gas use will
follow diesel with a share of 7.22%
(1,085.96 PJ); mostly driven by its use in the industrial sector. The use of coal
(3.14%) is attributed to the industrial
sector alone; while the majority of
consumed LP gas (2.97%) may be attributed to the residential and service sectors.
6.3 Energy demand by transformation sectors
6.3.1 Electricity sector
Electricity installed capacity is expected to rise from 51,686 MW in 2009 to 78,248 MW by 2025. Of such capacity, combined cycle will account for 40.53%, hydropower 19.06%, new generation
technologies (NGT)4 8.82%, combined cycled with improved efficiency 8.58%, thermal power plant
6.54%, and coal-fired plants 4.23%; while other technologies will contribute smaller quantities [SENER,
2010d]. However, if the expected contribution from each technology towards gross electricity generation by 2025 is analyzed, their contribution will change, as seen in figure 6.11.
4 Coal-fired and combined cycle plants with carbon capture and storage, nuclear and wind power.
0
2,000
4,000
6,000
8,000
10,000
12,000
14,000
16,000
2009 2025 2050
Figure 6.10 - 2050 Final energy demand by
energy source (PJ)
Gasoline
Electricity
Diesel
Natural gas
Coal
LP gas
Jet fuel
Oil coke
Oil fuel
Source: own estimation based on information from SENER [2010a,
2010c, 2010d, 2010f, 2010e, 2011c]
Table 6.13 - 2050 Final energy demand by energy source (PJ)
Energy source 2009 2025 2050 2050 share
Oil fuel 88.84 24.34 5.94 0.04%
Oil coke 129.44 134.21 312.29 2.08%
Jet fuel 109.87 199.49 421.53 2.80%
LP gas 434.25 438.65 446.24 2.97%
Coal 46.74 115.33 472.15 3.14%
Natural gas 516.97 641.28 1,085.96 7.22%
Diesel 730.48 1,483.19 3,137.33 20.85%
Electricity 657.07 1,332.81 4,151.37 27.59%
Gasoline 1,498.76 2,426.61 5,013.52 33.32%
Total 4,212.43 6,795.91 15,046.34
Source: own estimation based on information from SENER [2010a,
2010c, 2010d, 2010f, 2010e, 2011c]

54
The demand for fossil fuels for electricity
generation is expected to reach 3,515.3 PJ by 2025, based on the technologies utilized. For
this study, it is assumed that such fuels will
continue to be used for by 2050 based on their
annual growth from 2010-2025; due to the new configuration of the technologies deployed at
the electric sector. It is assumed as well that the
participation of such technologies for electricity generation will be the same for the
year 2050 as it was in the year 2025. Thus, if
energy final demand grew at an annual rate of 4.65% from the period 2025-2050, it is
assumed that electricity generation must grow
at the same rate in order to meet final demand.
In this sense, gross electricity generation will reach 4,649.60 PJ by 2050. Table 6.14 and
figure 6.12 shows the evolution of fuels demanded by the electric sector.
As appreciated, the use of natural gas will increase with an annual growth of 3.82%, representing the
major fuel used for electricity generation. It is
followed by coal, with an annual growth of 4.91%. Despite the increased use of oil coke (2.56%
annual growth), it has a limited overall
contribution. On the other hand, fuel oil and diesel
will be less consumed by the new configuration of the electric system.
The increase for natural gas demand is mainly driven by the expansion of combined cycle power
plants, which use natural gas as fuel; while the
decrease in fuel oil and diesel is the result from substituting conventional thermal power plants by combined cycle power plants. However, due to the high uncertainty of future natural gas prices,
diversification of used fuels becomes more important and coal technologies emerge as a solution. The
expectation of the total used fuels is based on the probable offer and associated costs of such energy
sources, coupled with environmental restrictions. It is to be noted that in order to meet the increased demand for natural gas and coal, an important share of such energy sources will be imported.
Table 6.14 - 2025 Fuel demand for electricity generation
Energy source 2010 2013 2016 2019 2022 2025 CAGR¹
Fuel oil 450.82 339.13 317.58 273.83 191.06 144.82 -7.29%
Natural gas 1,384.61 1,408.97 1,582.50 1,921.57 2,278.49 2,428.45 3.82%
Diesel 15.24 5.52 6.26 7.23 8.22 8.67 -3.69%
Coal 448.02 518.30 537.11 535.72 609.76 919.22 4.91%
Oil coke 0.00 9.65 14.14 14.10 14.10 14.10 2.56%
TOTAL 2,298.7 2,281.6 2,457.6 2,752.4 3,101.6 3,515.3
¹ Compound Annual Growth Rate
Source: own estimation based on information from SENER [2010d]
Hydropower
10%
Combined
cycle
47%
Combined
cycle IE*
11%
Wind
2%
Thermoelectric
(conventional)
2%
Geothermal
2%
NGT*
11% Nuclear
3%
Coal-fired
11%
Others
1%
Figure 6.11 - 2025 Gross energy generation by
technology (1,492.57 PJ)
Source: modified from SENER [2010d, p.163]
Others: Turbogas and internal combustion
NGT: New generation technologies / IE: Improved efficiency
0
500
1,000
1,500
2,000
2,500
3,000
3,500
4,000
2010 2013 2016 2019 2022 2025
Figure 6.12 - 2025 fuel demand for electricity
generation (PJ)
Oil coke
Coal
Diesel
Natural gas
Fuel oil
Source: own estimation based on information from SENER [2010d]

55
Table 6.15 - 2050 Fuel demand for electricity generation
Energy source 2025 CAGR¹ 2050 2050 share
Fuel oil 144.82 -7.29% 21.82 0.23%
Natural gas 2,428.45 3.82% 6,194.41 66.67%
Diesel 8.67 -3.69% 3.38 0.04%
Coal 919.22 4.91% 3,045.28 32.78%
Oil coke 14.10 2.56% 26.51 0.29%
TOTAL 3,515.3 9,291.4
¹ Compound Annual Growth Rate
Source: own estimation based on information from SENER [2010d]
0
1,000
2,000
3,000
4,000
5,000
6,000
7,000
Fuel oil Natural gas
Diesel Coal Oil coke
Figure 6.13 - Electricity sector fuel
consumption growth (PJ)
2025 2050
Source: own estimation based on information from SENER [2010d]
6.3.1.1 Subtotal
The results of extrapolating the 2025 estimated values into the year 2050 are shown in table 6.15; while the growth comparison from such period is shown at figure 6.13.
In order to account and allocate the amount of energy and consequent GHG emissions that are consumed and emitted by the electric sector and final sectors (transport, industry, residential, service and
agricultural); it is assumed that since the expected electricity production by 2050 will be 4,649.60 PJ, out
of 9,291.4 PJ of fuels needed to produce such energy, the electricity sector will consume 4,641.8 PJ during transformation losses. On the other hand, since the final sectors are expected to consume 4,151.37
PJ out of 4,649.60 PJ produced; the difference (498.23 PJ) will be considered as the electric sector own
consumption and distribution losses. This
may be appreciated at table 6.16. It is to be noted that other sources of energy that
contribute as well to electricity production
(such as nuclear, wind and hydro), are excluded in the demanded energy for
transformation due to lack of available data
and since such sources are considered as
carbon free (or in a very limited share), and do not contribute to GHG emissions, which is
the focus of this study.
6.3.2 Oil and gas sector
In order to meet the increasing
demand for fuels, oil and gas production is expected to
increase despite the current
declining of Mexican proven
reserves. For this, a project portfolio composed by a total
of 80 projects is expected to
take place between 2010-2025, in the following
categories: exploration and
exploitation (5), exploration
(22), exploitation (28), and infrastructure and support
(25).
Estimations for the development of such projects
Table 6.16 - 2050 Electric sector energy own consumption (PJ)
Energy use 2025 2050
Transformation consumption 2,022.68 4,641.80
Fuels demanded 3,515.25 9,291.40
Electricity production -1,492.57 -4,649.60
Own consumption 159.76 498.23
Electricity production 1,492.57 4,649.60
Electricity final consumption -1,332.81 -4,151.37
Total 2,182.44 5,140.03
Source: own estimation based on information from SENER [2010d]

56
are based under the associated
inversion of each project economic values at 2010. Thus,
future production is selected
according to their economic
revenue, considering costs associated to inputs, building of
new infrastructure and dwell
drilling. The fulfilling of such projections doe depend on: 1)
success in exploratory activity,
subject to a high uncertainty degree; and 2) availability of
adequate financial and technical
resources. Some important
assumptions are: a) exploration will take place both inshore and
onshore; and b) offshore production at deep waters will begin in 2014 for gas and 2017 for oil.
Thus, oil production will grow at an annual rate of 3% (2010-2017) since it is until 2012 when the
majority of the exploratory projects will start maturing, as seen in figure 6.14; whereas after that, it will
incur in lower growth levels, growing at an annual rate of 0.6% (2017-2025). If the whole period is considered, oil production will increase at an annual rate of 1.7% (2010-2025); to finally be in the order
of 3,315 mbod as of 2025.
National oil consumption is derived from what goes into exports, and what is sent to the national refinery system (NRS). Since the purpose of this study is to quantify GHG emissions from the Mexican energy
consumption, focus will be placed on the crude oil that goes into refineries to produce secondary fuels,
being these the ones consumed by the electric and final economic sectors.
Thus, the NRS capacity will be expanded by the reconfiguration of an existing refinery plant during 2011
and a new added capacity to another refinery plant by 2015. Hence that the NRS demand will grow from
1,255 kbo/d (2,918 PJ) in 2010, to 1,652 kbo/d (3,838.6 PJ) as of 2025. Throughout such configuration, the NRS is looking at increasing the refinery technical capacity for heavy oils (figure 6.15). In order to
avoid double-counting of the energy demanded by this sector, only the crude oil lost at transformation
from refineries will be accounted, as well as the sector energy needs for the operation of its activities.
6.3.2.1 Transformation at refineries
Table 6.17 shows the total energy lost during transformation of crude oil into fuels. Despite the fact that
the annual growth rate for the period 2010-2025 suggest a final increase for lost energy by the year 2050; it is assumed that such losses will remain at the levels of 2025 (356.14 PJ), since such energy is a function
of the NRS capacity. Thus, due to the fact that no projects to expand the NRS capacity are previewed to
by the government in the following years, it is assumed that the NRS capacity will remain the same; and consequently, the energy lost during transformation of crude.
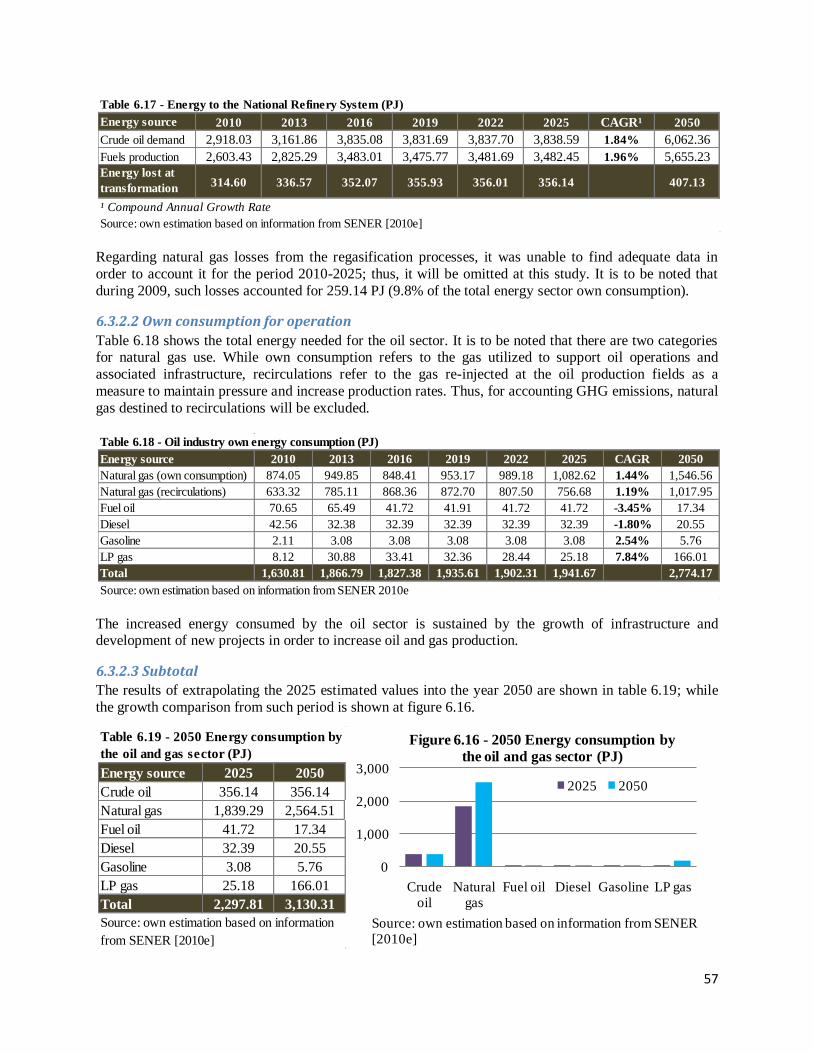
57
Regarding natural gas losses from the regasification processes, it was unable to find adequate data in
order to account it for the period 2010-2025; thus, it will be omitted at this study. It is to be noted that
during 2009, such losses accounted for 259.14 PJ (9.8% of the total energy sector own consumption).
6.3.2.2 Own consumption for operation
Table 6.18 shows the total energy needed for the oil sector. It is to be noted that there are two categories for natural gas use. While own consumption refers to the gas utilized to support oil operations and
associated infrastructure, recirculations refer to the gas re-injected at the oil production fields as a
measure to maintain pressure and increase production rates. Thus, for accounting GHG emissions, natural
gas destined to recirculations will be excluded.
The increased energy consumed by the oil sector is sustained by the growth of infrastructure and development of new projects in order to increase oil and gas production.
6.3.2.3 Subtotal
The results of extrapolating the 2025 estimated values into the year 2050 are shown in table 6.19; while
the growth comparison from such period is shown at figure 6.16.
Table 6.17 - Energy to the National Refinery System (PJ)
Energy source 2010 2013 2016 2019 2022 2025 CAGR¹ 2050
Crude oil demand 2,918.03 3,161.86 3,835.08 3,831.69 3,837.70 3,838.59 1.84% 6,062.36
Fuels production 2,603.43 2,825.29 3,483.01 3,475.77 3,481.69 3,482.45 1.96% 5,655.23
Energy lost at
transformation314.60 336.57 352.07 355.93 356.01 356.14 407.13
¹ Compound Annual Growth Rate
Source: own estimation based on information from SENER [2010e]
Table 6.18 - Oil industry own energy consumption (PJ)
Energy source 2010 2013 2016 2019 2022 2025 CAGR 2050
Natural gas (own consumption) 874.05 949.85 848.41 953.17 989.18 1,082.62 1.44% 1,546.56
Natural gas (recirculations) 633.32 785.11 868.36 872.70 807.50 756.68 1.19% 1,017.95
Fuel oil 70.65 65.49 41.72 41.91 41.72 41.72 -3.45% 17.34
Diesel 42.56 32.38 32.39 32.39 32.39 32.39 -1.80% 20.55
Gasoline 2.11 3.08 3.08 3.08 3.08 3.08 2.54% 5.76
LP gas 8.12 30.88 33.41 32.36 28.44 25.18 7.84% 166.01
Total 1,630.81 1,866.79 1,827.38 1,935.61 1,902.31 1,941.67 2,774.17
Source: own estimation based on information from SENER 2010e
0
1,000
2,000
3,000
Crude oil
Natural gas
Fuel oil Diesel Gasoline LP gas
Figure 6.16 - 2050 Energy consumption by
the oil and gas sector (PJ)
2025 2050
Source: own estimation based on information from SENER [2010e]
Energy source 2025 2050
Crude oil 356.14 356.14
Natural gas 1,839.29 2,564.51
Fuel oil 41.72 17.34
Diesel 32.39 20.55
Gasoline 3.08 5.76
LP gas 25.18 166.01
Total 2,297.81 3,130.31
Table 6.19 - 2050 Energy consumption by
the oil and gas sector (PJ)
Source: own estimation based on information
from SENER [2010e]

58
6.3.3 Summary of energy industries energy consumption
Table 6.20 shows the results of the required energy for the energy industries, which includes energy lost during transformation plants and energy required for their own operation.
6.4 GHG emissions The associated GHG emissions both from energy final consumption and energy industries are calculated
according to the 2006 IPCC Guidelines for National Greenhouse Gas Inventories, Volume 2 (Energy) [IPCC, 2006]. For a detailed description of the GHG emissions derived from each sector, refer to annex
6b. GHG included in this study compromise CO2, CH4 and N2O; which will be accounted in terms of
CO2eq according to their global warming potential (for a detailed description of the conversion method,
refer to Forster and others [2007]). Fugitive emissions are excluded in this study due to lack of available information.
In order to avoid double counting from GHG emissions derived by electricity production and final electricity consumption; it was first calculated the total GHG emissions from the fuels consumed
(9,291.40 PJ) by the electric sector in order to produce electricity; followed by calculating the amount of
GHG emissions that implies the use of one PJ, so to be able to allocate associated GHG emissions to each sector by the quantity of electric energy consumed. This was done since there are different combusted
fuels during electricity generation, whereas the combustion of each fuel emits different quantities of GHG
according to their properties. Thus, it is assumed that one PJ of electric energy is equal to 0.069074146
million tones (Mt) of CO2eq. Refer to annex 6b for a detailed description.
As appreciated in table 6.21 and figure 6.17, total GHG
emissions by 2050 will be in the order of 1,555.48 MtCO2eq. The largest contributor will be the transport
sector, accounting for 586.71 MtCO2eq (37.69%); mainly
driven by the gasoline required for auto-transportation.
The second largest contributor will be the electricity
generation sector, accounting for 355.04 MtCO2eq
(22.81%); mainly driven by the use of natural gas and coal for transformation. Despite the fact that the energy
contributed by coal is half the energy contributed by
natural gas, its contribution to CO2 emissions are almost equal due to the high carbon content of coal.
Followed by the electricity sector, the industrial sector will account for 326.96 MtCO2eq (21.01%),
mostly determined by its increasing use of electric energy at the end of the studied period. The oil and gas
Table 6.20 - 2050 Energy industry energy own consumption (PJ)
Energy use 2025 2050
Electric sector 2,182.44 5,140.03
Transformation consumption 2,022.68 4,641.80
Own consumption 159.76 498.23
Oil and gas 2,297.81 3,130.31
Total 4,480.25 8,270.35
Source: own estimation based on information from SENER [2010d]
Sector Mt CO2 eq Share
Industrial 326.96 21.01%
Transport 586.71 37.69%
Residential 73.76 4.74%
Services 52.91 3.40%
Agricultural 34.34 2.21%
Electricity generation 355.04 22.81%
Oil and gas sector 126.75 8.14%
Total 1,556.48
Source: own estimation
Table 6.21 - 2050 GHG emissions from the
energy sector (MtCO
₂
eq)

59
sector will contribute with 126.75 MtCO2eq (8.14%)
due to the crude oil burnt during refinery of fuels, and the fuels needed to operate the oil and gas sector
infrastructure.
The residential and services sectors will contribute together with 126.67 MtCO2eq (7.8%), driven in their
majority for their increased use of electric energy, since
they both share similar energy consumption characteristics.
The agricultural sector will be the smaller contributor, accounting for 34.34 MtCO2eq (2.21%), mostly due to
its increased use of diesel as an energy source.
As previously stated at section 2.1 of this study; if México is willing to contribute in climate change
mitigation, it has to decrease its GHG emissions by 85-50% from its 2000 levels. This implies that if an
85% reduction is chosen, its GHG emissions must be in the order of 58.1 MtCO2eq by 2050, while if a 50% reduction is chosen, its GHG emissions must be in the order of 193.66 MtCO2eq. For a detailed
description of this analogy, refer to sections 1.2 and 2.1.
The baseline scenario for future GHG emissions from the energy sector suggests that despite the efforts to
reduce energy consumption and GHG mitigation through governmental supporting policies, México is not
on track to achieve the required levels to avoid a temperature rise. In fact, it is far away from reaching
such levels.
Hence the necessity of picturing a future normative scenario in order to draw pathways to achieve it from
the present situation, instead of extrapolating current development trends that would not meet at the end-point the desired future state, as previously explained at chapter 3. Such scenario will be developed at the
following chapter.
Industrial
21%
Transport
38%
Residential
5%
Services
3%
Agricultural
2%
Electricity
generation
23%
Oil and gas
sector
8%
Figure 6.17- 2050 GHG emissions from the energy
sector (1,556.48 MtCO₂eq)
Source: own estimation

60
7. 2050: Backcasting scenario (vision)
This chapters starts by setting a background of the necessity for the development of a normative scenario
(7.1), followed by the normative characteristics which comprise the targets to be reached (7.2), so to
describe images of the future that fulfill such targets.
7.1 Background
The scenario proposed at the previous chapter was built for the purpose of picturing the most probable outcome if current trends continue to develop throughout time. This chapter on the other hand, presents a
normative future scenario with a vision towards sustainability. Thus, the desirable future state or image of
the future is expressed in terms of targets or specific metrics to be reached by the end of the studied period; so to be used as a departing point to identify the conditions that must be met along the way to
fulfill the vision.
The purpose of this exercise is then to stimulate discussion and reasoning from a different perspective regarding long term issues that could emerge between energy and sustainable development. Given the
illustrative purpose of this future scenario, coupled with the limited availability of time and resources; no
quantitative modelling will be developed. Instead, it will be developed in a qualitative manner, as previously explained at chapter 4, based under the four over-arching sustainability principles of the
Natural Step methodology:
1. Nature‘s functions and diversity are not systematically subject to increasing concentrations of substances extracted from Earth‘s crust;
2. Nature‘s functions and diversity are not systematically subject to increasing concentrations of
substances produced by society;
3. Nature‘s functions and diversity are not systematically impoverished by over-harvesting or other forms of ecosystem manipulation, and;
4. Resources are used fairly and efficiently in order to meet basic human needs worldwide.
7.2 Normative characteristics
As previously explained at chapter 2, the envisioned future scenario for the Mexican energy sector is one
that contributes to the international effort needed to mitigate climate change, while assuring a secure and accessible energy supply to everybody; so to enhance sustainability. Hence that the normative
characteristics of such scenario encompass two broad categories: 1) the mitigation of GHG by the energy
sector, and 2) a secure energy supply available to the Mexican population.
Within such two broad categories, specific characteristics must be set in order to express the normative
targets to be met by the desirable future
state.
7.2.1 GHG mitigation
In order to mitigate climate change, GHG emissions from the energy sector must be
reduced between 85-50% from the year
2000 levels by 2050, as previously explained at section 1.2. This means that
the Mexican energy sector must have as a
limit a maximum range of 58.1 MtCO2eq to 193.66 MtCO2eq emissions, depending
on the mitigation target chosen, as shown
387.33
1,556.48
193.00 58.10
0200400600800
10001200140016001800
2000 2050 BAU 2050 (50% reduction)
2050 (85% reduction)
Figure 7.1 - GHG expected emissions
(MtCO₂eq)
Source: own estimation
61
in figure 7.1. For this, the whole energy sector is included (energy production and energy consumption) in
order to identify possible reconfigurations that all together could bring GHG emissions to the required levels.
7.2.2 Energy security
Access to energy is strongly related to social and economic development, as previously explained at
sections 1.1 and 1.3. However, energy access is not possible if its supply is not a secure one. What is
inferred as a secure energy supply is one that meets the required energy inputs to meet energy final demands.
In the case of México, this arises as an important issue by two key aspects:
It is dependent on foreign energy sources, both in the form of gas as primary energy, and in the
form of gasoline as a secondary energy source. Moreover, as analyzed in the previous chapter, México is planning to rely upon coal for future energy production; whereas it will be needed to
be imported.
It is dependent on energy sources that eventually will be depleted on a global basis (oil and gas)
and possibly more shortly at the national level; as analyzed in the development of proven reserves at chapter 5. Moreover, this could represent a barrier for future development since most
of the Mexican energy infrastructure is built for such energy sources.
Thus, in order to enhance energy supply security, México must stop heavily relying on fossil fuels to meet its final energy needs. In this sense the imports of energy resources could stop, avoiding a possible
interruption for the national energy needs from either political or economic restrictions of such resources.
On the other hand, if renewable energy sources dominate the energy sector, México will never run out of energy resources to meet its final energy needs.
Since this is an abstract and complex target to be reached, this scenario will consider the diversification of other energy sources and technologies into the energy sector. Is to be noted that once targets have been
defined, there is still a vast array of scenarios combination that may attain such targets. This study will be
limited to provide images of the future that could attain the identified targets; whereas the specific
combination of such images is left to audience to decide on that, based on possible knowledge and driving forces that go beyond the scope of this study.
7.3 Description of the envisioned scenario
In this section, the departing point is to meet the final energy needs forecasted by the previous chapter
under the restrictions set by the normative characteristics of this scenario. Thus, tree main categories to
achieve the targets are identified: 1. Transport sector
2. Electricity generation
3. End-use consumption patterns
7.3.1 Transport sector
The transportation sector emerges as a key determinant due to the fact that it is the sector that is expected to consume the highest amount of energy and consequently emit the highest amount of GHG. On the
other hand, it is a sector that demands the import of energy sources. Thus, in order to reach the target of
this scenario, two aspects are to be considered: 1) decrease transport fuel demand, 2) other sources of fuel
rather than gasoline and diesel.
In order to decrease the auto-transportation fleet, which consequently could lower energy demand; the
public transportation system must be improved. Currently there is a lack of an adequate public transportation system at every major city of the country, except for México City which uses a metro

62
system. The public transport in all the other urban areas is constituted mainly by a bus system that people
tend to avoid due to its inefficiency in terms of spent time and quality, consequently enhancing a higher use of vehicles for transportation and an increased fuel use. On the other hand, if an adequate public
transport service is implemented, the ultimate goal of such sector will be more accessible to all the
population, which is to displace end users from one point to another, due to the lower price of the service
rather than the price of buying a vehicle and consequent associated costs. Alternatively, this effort could be reinforced by the introduction of carpooling
5 schemes into the major urban areas.
On the other hand, auto-transportation fuel conversion efficiency must be improved. The International Network for Sustainable Energy [2010] suggests that by 2050 total efficiency could be in the order of 6
times higher than today‘s average transport efficiency. This could be achieved by fuel cell systems instead
of combustion fuel systems, and an equipment applied to vehicles to recover the energy lost during breaking.
Regarding the use of other fuels rather than gasoline and diesel, SENER and others [2006] suggest that in
the long-run, 10% of all gasoline in México could be replaced by ethanol and 5% of diesel could be replaced by biodiesel from 2012 onwards, considering México‘s potential for producing biofuels from
land based crops without compromising food production. Moreover, biomass production from algae for
biofuels would need to be considered, since México has a big potential for algae plantation due to its large coastlines and climate characteristics.
Algae processing presents multiple fuel alternatives, such as biodiesel, ethanol, jet fuel, biocrude, among others [Oilgae, 2010]; furthermore, it represents a feedstock for biofuels that does not compete with food
production, since it can be grown at non-arable land using salt water. Regarding algae potential, it has at
least 30 times more energy outcome than land-based crops presently utilized for biofuels production
Another positive impact attributed to algae is its atmospheric carbon recycling properties; while algae comprise less than 2% of global carbon, it absorbs and fix up to 50% of atmospheric CO2 concentrations
(30-50 billion tones per year) [Biotechnology Industry Organization, 201?]. Thus, this represents an
opportunity to make productive use of CO2 derived from power plants and other sources to mitigate GHG emissions; since the water used to cultivate algae must be CO2 enriched [U.S. Department of Energy,
2007].
The experienced progress through the last couple of decades in the general field of biotechnology and agrotechnology suggests that much can be done in this field [IEA, 2003]; As of June 2010, over 200
universities worldwide were researching biofuels production from algae [Oilgae, 2010].
Thus, the image of the future for the transport sector is both a sector that demands less energy for
mobilization and its energy needs are replaced by other energy sources rather than gasoline and diesel. In
this sense, México could lower its GHG final emissions and secure the future energy needs of such service.
7.3.2 Electricity generation
The electric energy comprises the most important identified opportunity in this scenario to achieve the
envisioned goal. This is sustained by the fact that as economy grows, so does electricity consumption;
whereas the associated GHG emissions from its production are distributed both during transformation and
throughout final electricity consumption. The previous chapter suggests that electricity consumption by end-users to meet their energy needs could account for 18.42% of total GHG emissions, while its
generation could account for 22.81% of total emissions; which together would sum up 41.23% of total
expected GHG emissions by the energy sector.
5 sharing of car journey so that more than one person travels in a car

63
Furthermore, the majority of energy resources used for electricity generation are derived from fossil energy sources; whereas natural gas and coal are expected to be the major contributors. This means that in
order to meet such demand, a share of these sources would need to be imported; which consequently
dangers future energy supply security.
For this scenario, electricity final consumption must be lowered where possible; while its generation must
be achieved by other sources of energy, such as renewables, since México has potential resources. These
include: 1) hydropower, 2) geothermal, 3) solar, and 4) wind. Nuclear power is excluded from this scenario due to the highly potential negative impacts towards human health and environment integrity if
managed inadequately. Biomass is assumed to be destined for biofuels production in order to meet the
transport sector energy needs.
Of such potential energy sources for electricity generation, solar power arises as the most important one.
As explained at chapter 5, solar insolation at México is among the best throughout the world, averaging at
5 kWh/day/m2, with some specific areas reaching 6 kWh/day/m
2. Current PV technologies for
transforming solar energy towards electricity varies among an efficiency of 24% at laboratory test
conditions and about 20% for the best silicon commercially available PV modules [Krothapalli, 2010].
Regarding solar-thermal generating electricity technologies, which gather solar radiation to produce temperatures high enough to drive steam turbines to produce electric power; the overall (power plant
system) conversion efficiency of about 35% is feasible with intelligent management of waste heat. Thus,
the share of solar technologies in the energy matrix for electricity generation will be highly dependent on the future technology innovation trends. However, just to picture a possibility, assuming a solar
technology with an 40% efficiency (which probably will be higher by the end of the studied period), it
could cover approximately 50% (2,076 PJ) of the expected final electricity demand from the previous
chapter if an area of about 790 km2 (0.04% of the total national land area) is deployed.
Regarding hydropower, it is estimated that the potential within the country currently exploited is at 21.8%
(11,383 MW) from its total potential (53,000 MW) for large hydropower projects. Regarding small hydropower projects, which are claimed to be more environmental friendly than large projects, the
estimated potential lies at 3,250 MW. By increasing the installed capacity of hydropower to its full
potential, such energy resource could contribute with an important share to electricity generation. As for
geothermal energy, despite that México has good resources and is an exporter of such technology, its estimated potential lies between 1,395 MW and 8,000 MW [SENER, 2009; GEA, 199?]; whereas it
currently has an installed capacity of 965 MW. Thus, in this scenario it is assumed that emphasis towards
renewable energy sources must be focused at other sources, due to its limited future electricity generation potential in comparison to solar and hydro.
For wind power, the estimated potential is of 71 GW considering sites with a capacity factor above 20% [Global Wind Energy Council, 2010; Rosas, 2010]. If a capacity factor of 25% is assumed, electricity
generation from wind power could reach approximately 559.764 PJ at its maximum potential,
representing 13.5% of the total final energy consumption expected from the previous chapter.
On the other hand, fossil fuels would still need to be utilized for electricity generation, but at a much
lower rate. For them, co-generation systems must be implemented in order to improve their overall
conversion efficiency. Regarding the GHG emitted by such fuels, these could be treated by Carbon Capture and Storage (CCS) systems at the power plants; which may reduce their CO2 emissions by 80 to
90% [IPCC, 2005].
Thus, the image of the future for the electric sector is one of a sector that utilizes renewable energy
resources as a first option, exploited at their fully potential without compromising negative environmental

64
and societal impacts. For this, México must start deploying state of the art technology in terms of energy
conversion technologies in order to improve efficiency and be able to maintain a reserved capacity for future energy demands. Moreover, since electricity generation is a function of electricity demand, the
following section pictures the need for its decrease.
7.3.3 End-use consumption patterns
Decreasing the growth of energy consumption within end-use sectors is a key aspect in mitigating GHG
emissions. This may be achievable by energy efficiency measures implemented at each sector. Apart from the transport sector which is treated independently due to its high importance, the industrial sector is
expected in the previous chapter to represent the second highest contributor of GHG emissions with a
share of 21.01%. While half of its energy needs are met by electricity, the other half is supplied mostly by
natural gas, oil coke and coal. Moreover, in spite the fact that large industry within México is among the among the least carbon and energy intensives industries worldwide; a large proportion of the industrial
sector is composed by medium and small enterprises with a high energy intensity due to their use of older
equipment. Within the industrial sector, motor systems represent 70% of its total electricity consumption, steam systems account for 40% of its fuel consumption, and ovens account for the remaining fuel and
electricity consumption. [International Bank for Reconstruction and Development (IBRD) and The World
Bank (TWB), 2009].
According to the IEA [2007], if international industrial best practices are adopted, energy savings may
account for 20% in motor systems, 10% in steam systems, and 15% in ovens. Moreover, the estimated
potential for co-generation at the industrial sector in México is about 6,800 MW [IBRD and TWB, 2009]. On the other hand, the industrial sector is to create industrial symbiosis networks in order to decrease
energy needs, by recycling energy flows through the creation of closed systems were possible.
Energy consumption within the residential sector is expected to account for 7.4% of the total final energy
consumption. Of such, electricity accounts for about 60% of its energy needs, while LP gas and natural
gas account for the remaining consumption. Such consumption is mainly driven by a lack of regulation
regarding electric appliances such as air conditioning, refrigerators, lighting and washing machines. Thus, this scenario supposes that within the residential sector, these appliances must comply with a regulation
regarding energy efficiency minimum requirements. The same is to be applied for the construction of new
houses, where it must be mandatory to meet a certain building code that could lower electricity consumption, such as thermal insulation and the use of solar thermal technologies for water heating.
Regarding the services sector, its energy requirements are mostly driven by electricity consumption for
lighting [IBRD and TWB, 2009]; thus, requiring energy-efficient bulbs could diminish electricity use within the sector. Another important driver is the use gas for hot water, which could be replaced by solar
thermal as in the residential sector.
7.3.3 Other considerations
The oil and gas sector is to maintain itself as it is expected by the previous chapter. The main assumption
of this future image is that México heavily relies upon the incomes generated by oil exports. Thus, it is assumed that the same amount of energy is to be needed by the oil sector infrastructure and exploration
projects if its declining oil production is to be increased again. This will allow on the other hand to
increase Mexican oil and gas proven reserves and maintain a steady production for a longer period, since an important quantity of these energy sources previously destined for national energy consumption will be
replaced by other resources.

65
8. Discussion
This thesis develops two future scenarios for the possible development of the energy sector within
México in order to achieve sustainability. Despite the fact that sustainability encompasses too many dimensions within the possible lines of development, in this study is assumed as a state where society‘s
actions do not compromise the needs of future generations. To be more specific, it focuses on energy
consumption as way to achieve it.
Climate change and its possible effects arise as an alarming issue doe to the negative impacts it may bring
on tomorrow‘s society. Although what is considered as dangerous depends on the perception of
associated risks, it is clear that if current environmental patterns are modified, it physical implications would be catastrophic to global society since it would endanger most of the natural resources from which
humanity is dependent for survival. In this sense, the Earth‘s environmental system is subject to change
its patterns if global temperature increases. Moreover, it has been concluded that an increase in global temperature is already taken place mostly driven by higher GHG concentrations at the atmosphere, as a
result of human activities throughout the last years. Of such activities, energy use is considered to be the
major contributor to such increase. On the other hand, energy has also been perceived as a key element in society‘s development by enhancing quality of life.
Thus, a question may arise whether if energy use is bad or good to society‘s development; but the answer
does not derive from such question. The real question lies on whether we are using energy in a bad or good manner. Obviously energy use has brought huge benefits to society development and may
consequently enhance sustainable development if managed adequately; but history teaches us that it has
not been the case in the last years. Society has been using fossil non-renewable resources as a source of energy, exploiting them at a higher rate than their regeneration capacity. Furthermore, it is the inadequate
use of these resources the cause for global temperature to be increasing; whereas it will continue to keep
rising even more if current trends continue to be developed in the future. Moreover, energy use is not equally distributed throughout the world. While the higher energy consumers are the ones that retain the
benefits from its use, global society equally absorbs the associated impacts.
In this sense, energy use arises as a key aspect to enhance sustainable development, which must be addressed globally, since its impacts go beyond physical or political boundaries. For these reasons, the
future energy sector in México is a theme that must be carefully planned if sustainability is to be
achieved. Current trends in the Mexican energy sector suggest that the country is not on path to achieve it. Most of its energy needs are met by the use of fossil resources. So in an effort to contribute to these
objectives, the ultimate goal of this thesis is to explore future alternative development paths on how to
attain them.
The use of future scenarios presents an opportunity to address such issues, by picturing future states in
order to stimulate thinking and discussion about where we may end up or where we want to end up. For
this, two future scenarios were created. One that compromises how the future is most likely to unfold under current development trends; and one that sets normative characteristics to be met at the end-point.
The most likely future to unfold, called Business As Usual (BAU), was developed mostly from a qualitatively manner, dragging information from official publications in order to arrange it in a manner
that could be understood and used for the purpose of this study. Although the use of a mathematical
66
model in order to predict future trends arises as a useful tool for scenario development; it was not the case
of this study due to limited time and resources. Thus, general assumptions had to be made in order to carry on the study and be able to picture how the Mexican energy sector is more likely to unfold in the
coming years. Of course, this was based on my perception of the system and the quantity of information
that the time of the study allowed me to review. Aware of this, the BAU scenario may ultimately unfold
in a different manner, since there are a set of driving forces that go beyond the scope and possibilities of this study. However, I feel that the purpose is met; which is to describe a probable development path and
its associated implications based on present information.
In this sense, the reader is forced to analyze and think about such development from a different
perspective, based on previous experiences and knowledge; bringing possible solutions or avoiding
probable future events that could ultimately enhance sustainability.
On the other hand, a normative scenario was developed, starting from a desired future state in order to
picture the possibility of attaining what is considered as a sustainable energy sector in this study:
mitigating GHG emissions in order to contribute to climate change mitigation, whilst making energy available to everybody by a secure energy supply. Although the development of this scenario requires
working backwards from such desired future state; this study only comprises a set of possible
recommendations on how to achieve it, being mostly qualitatively. Nevertheless, it is recommended to develop it under a quantitative model in order to have clear goals and targets about what is to be achieved
and how this target could be met throughout the studied period.
Again, the purpose of this study was not to make an exact description of what is required to achieve the
goals and the exact pathways on how to reach them. It is rather meant to be as a guiding framework and a
starting point for the interested audience to further develop it more deeply. In this sense, I chose a
combination of backcasting methodologies, mostly qualitatively, to develop the normative scenario due to time and resources availability. However, it is recommended from my personal point of view the
involvement of stakeholders throughout the entire process.
It is to be noted that this study excludes economic aspects; which may be considered either as a grave
impediment or as a key cluster to reach the desired future state. Since economic development is highly
correlated to social development and consequently sustainable development, it is recommended the use of
these driving forces in the scenario building process.
On the other hand, I consider as possible solutions the wider use of renewable energy sources, mainly by
the fact that such sources may be exploited at an unlimited rate, free of a possible interruption by external driving forces such as political or economic pressure. Instead of being a traded good governed by market
forces, as it is the case of oil and gas, energy sources should be available to everybody. In this sense, the
only current impediment for them to be deployed is technology innovation; which I believe it can be transcended if efforts are focused towards it. Moreover, these energy sources do not contribute to climate
change, since they do not emit, or emit in a very limited share, GHG.
Another set of possible solutions is a more efficient use of energy. While the ultimate goal of energy use is to enhance quality life standard, it is nowadays perceived as a marketed commodity rather than a mean
to achieve a necessity. Thus, by focusing on the primary necessities by society, energy could be replaced
or used in a different manner as long as this necessity is met; as it is the case of public transportation instead or private transportation. As long as the end user meets its mobility needs, there is no necessity to
own a private vehicle that will ultimately serve the same demand.
Ultimately, the studied period was set to the year 2050 since it gives enough room to break current trends
and allow radical changes to be introduced.

67
9. Conclusions
9.1 Future scenarios
Future scenarios have proven to be an effective manner to take insight into what the future may bring and how may we prepare to it. Moreover, normative scenarios are adequate for sustainability issues, since
their departing point is a set of norms to be achieved when current development trends suggest that such
desired future state is not attainable, as it is the case in most sustainable development issues.
While there are many typology of normative or backcasting scenario methodologies, participatory
backcasting emerges as the most fructiferous due to the knowledge and experience contributed by
different perspectives within the same area. Furthermore, sustainable development compromises to meet the needs of everybody and by including everybody‘s opinion, a common target and key driving forces
may be more effectively identified. On the other hand, participatory backcasting embraces higher order
learning among the involved participants and facilitates network creation among key players for future
action.
9.2 The energy sector and México
México is not on course to achieve a sustainable path in regards of its energy use. Although the proposed solutions in this study may be out of reach by economic factors, it is to be noted that sooner or later the
inadequate use of energy within the country could represent a barrier for development. For this, it is
recommended that in spite of the perceived difficulty and possible barrier in the short term to achieve the envisioned scenario, México would benefit from such actions in the long term.
Cases and experiences in other countries have demonstrated that this is possible. The future energy in México is a choice and not a destiny. Nevertheless, it is a sector which needs to be carefully planned with
time in advance due to the required infrastructure needed to operate it. Hence that efforts to achieve it a
desire future state must start as of today.

68
10. References
Anderson, K., 2001. Reconciling the electricity industry with sustainable development: Backcasting — A
strategic alternative. Futures, 33, pp. 607-623.
Åkerman, J. and Höjer, M., 2006. How much transport can the climate stand? Sweden on a sustainable
path in 2050. Energy Policy, 34, pp. 1944-1957.
Bailis, R., Ezzati, M., and Kammen, D.M., 2005. Mortality and Greenhouse Gas Impacts of Biomass and
Petroleum Energy Futures in Africa. Science, 308(5728), pp. 98-103.
Banister, D., Dreborg, K., Hedberg, L., Hunhammar, S., Steen, P. and Åkerman, J., 2000. Transport Policy Scenarios for the EU: 2020 Images of the Future. Innovation, 13(1), pp. 27-45.
Barbour, I., Brooks, H. and Lakoff, S. A., 1982. Energy and American Values. New York: Praeger Publishers.
Barker T., I. Bashmakov, L. Bernstein, J. E. Bogner, P. R. Bosch, R. Dave, O. R. Davidson, B. S. Fisher, S. Gupta, K. Halsnæs, G.J. Heij, S. Kahn Ribeiro, S. Kobayashi, M. D. Levine, D. L. Martino, O.
Masera, B. Metz, L. A. Meyer, G.-J. Nabuurs, A. Najam, N. Nakicenovic, H. -H. Rogner, J. Roy, J.
Sathaye, R. Schock, P. Shukla, R. E. H. Sims, P. Smith, D. A. Tirpak, D. Urge-Vorsatz, D. Zhou, 2007:
Technical Summary. In: Climate Change 2007: Mitigation. Contribution of Working Group III to the Fourth Assessment Report of the Intergovernmental Panel on Climate Change [B. Metz, O. R. Davidson,
P. R. Bosch, R. Dave, L. A. Meyer (eds)], Cambridge University Press, Cambridge, United Kingdom and
New York, NY, USA.
Bartiaux, F. and Van Ypersele, J. P., 1993: The role of population growth in global warming. In:
Proceedings of the International Population Conference (ISBN 2-87108-030-5). International Union for the Scientific Study of Population, Liège, Belgium, 4, pp. 33–54.
Biotechnology Industry Organization, 200?. Biofuels – The Potential of Algae. [Online] Available at:
http://bio.org/ind/algae/Biofuels_Potential.pdf [Accessed 10 June 2011].
Birkle, P, 2007. Development of Geothermal Energy in México and its Energetic Potential for the Future. Environmental Science. Part III, pp. 343-363.
Bożyk, P., 2006. Globalization and the Transformation of Foreign Economic Policy. England: Ashgate
Publishing Limited.
BP, 2010. BP Statistical Review of World Energy June 2010. [Online] Available at:
http://www.bp.com/liveassets/bp_internet/globalbp/globalbp_uk_english/reports_and_publications/statistical_energy_review_2008/STAGING/local_assets/2010_downloads/coal_section_2010.pdf [Accessed 12 June 2011].
British Chamber of Commerce, 2010. Mexico Energy Report – July 2010. [Online] Available at:
http://www.alexandriamx.net/demos/camaraBritanica/ckeditorArchivos/files/mexico%20energy%20repor
t%20july%202010(1).pdf [Accessed May 15 2011]

69
Burns, S., 2010. Mexico Facing Oil Imports to Tackle Rising Gasoline Consumption. Metal Miner, [Online] 24 August 2010. Available at: http://agmetalminer.com/2010/08/24/mexico-facing-oil-imports-
to-tackle-rising-gasoline-consumption/. [Accessed March 30 2010].
Börjeson, L.,Höjer, M., Dreborg, K.H., Ekvall, T., and Finnveden, G., 2005. Towards a user's guide to scenarios - a report on scenario types and scenario techniques. (ISSN 1652-5442) Sweden:
Environmental strategies research – fms, Department of Urban studies, Royal Institute of Technology.
Central Intelligence Agency (CIA), 2011. The World Factbook. [Online] (Updated 5 May 2011)
Available at: https://www.cia.gov/library/publications/the-world-factbook/rankorder/2119rank.html.
[Accessed 6 May 2011].
Clements, M. and Hendry, D., 1998. Forecasting economic time series. Cambridge: Cambridge
University Press.
Comisión Intersecretarial de Cambio Climático (CICC). 2009. Programa Especial de Cambio Climático
2009 – 2012. (DOF 28/08/2009) México: Comisión Intersecretarial de Cambio Climático.
Consejo Nacional de Población (CONAPO). 2006. Proyecciones de la Población de México 2005 – 2050.
México: CONAPO
Cornish, E., 1977. The study of the Future: An Introduction to the Art and Science of Understanding and
Shaping of Tomorrow‘s World. Washington: Transaction Publishers.
Davis, G., 1998. Creating Scenarios for Your Company‘s Future. In: Shell International Ltd., The 1998 Conference on Corporate Environmental, Health, and Safety Excellence. New York City, 28 April 1998,
Shell International Ltd.: New York.
Denman, K.L., G. Brasseur, A. Chidthaisong, P. Ciais, P.M. Cox, R.E. Dickinson, D. Hauglustaine, C.
Heinze, E. Holland, D. Jacob, U. Lohmann, S Ramachandran, P.L. da Silva Dias, S.C. Wofsy and X.
Zhang, 2007: Couplings Between Changes in the Climate System and Biogeochemistry. In: Climate
Change 2007: The Physical Science Basis. Contribution of Working Group I to the Fourth Assessment Report of the Intergovernmental Panel on Climate Change [Solomon, S., D. Qin, M. Manning, Z. Chen,
M. Marquis, K.B. Averyt, M.Tignor and H.L. Miller (eds.)]. Cambridge University Press, Cambridge,
United Kingdom and New York, NY, USA.
Dreborg, K.H., 1996. Essence of Backcasting. Futures, 28(9), pp.813-828.
Dreborg, K.H., Hunhammar, S., Kemp-Benedict, E. and Raskin, P., 1999. Scenarios for the Baltic Sea
region: a vision of sustainability. International Journal of Sustainable Development and World Ecology,
6, pp. 34-44.
Earth Systems Research Laboratory, 2011. Trends in Atmospheric Carbon Dioxide. [Online] (Updated
May 2011) Available at: http://www.esrl.noaa.gov/gmd/ccgg/trends/#mlo_full [Accessed 7 June 2011].
Falkenmark, M., 1998. Dilemma when entering 21st century: rapid change but lack of sense of urgency.
Water Policy, 1(4), pp. 421-436.

70
Fisher, B.S., N. Nakicenovic, K. Alfsen, J. Corfee Morlot, F. de la Chesnaye, J.-Ch. Hourcade, K. Jiang,
M. Kainuma, E. La Rovere, A. Matysek, A. Rana, K. Riahi, R. Richels, S. Rose, D. van Vuuren, R. Warren, 2007: Issues related to mitigation in the long term context, In Climate Change 2007: Mitigation.
Contribution of Working Group III to the Fourth Assessment Report of the Inter-governmental Panel on
Climate Change [B. Metz, O.R. Davidson, P.R. Bosch, R. Dave, L.A. Meyer (eds)], Cambridge
University Press, Cambridge, United Kingdom and New York, NY, USA.
Food and Agriculture Organization of the United Nations (FAO), 2008. A Review of the Current State of
Bioenergy Development in G8 +5 Countries. [Online] Rome: FAO. Available at: http://www.globalbioenergy.org/fileadmin/user_upload/gbep/docs/BIOENERGY_INFO/0805_GBEP_Re
port.pdf.
[Accessed 1 June 2011].
Forster, P., V. Ramaswamy, P. Artaxo, T. Berntsen, R. Betts, D.W. Fahey, J. Haywood, J. Lean, D.C.
Lowe, G. Myhre, J. Nganga, R. Prinn, G. Raga, M. Schulz and R. Van Dorland, 2007: Changes in
Atmospheric Constituents and in Radiative Forcing. In: Climate Change 2007: The Physical Science Basis. Contribution of Working Group I to the Fourth Assessment Report of the Intergovernmental Panel
on Climate Change [Solomon, S., D. Qin, M. Manning, Z. Chen, M. Marquis, K.B. Averyt, M.Tignor and
H.L. Miller (eds.)]. Cambridge University Press, Cambridge, United Kingdom and New York, NY, USA.
Fujino, J., Hibino, G., Ehara, T., Matsuoka, Y., Masui, T. and Kainuma, M., 2008. Back-casting analysis
for 70% emission reduction in Japan by 2050. Climate Policy, 8, pp. S108-S124.
Geothermal Energy Association (GEA), 199?. La Geotermia: Energía Confiable y Limpia par alas
Américas. [Online] Washington: Geothermal Energy Association. Available at: http://www.bio-
nica.info/biblioteca/GEA-Geotermia.pdf [Accessed 19 May 2011].
Geurs, K. and van Wee, B., 2004. Backcasting as a Tool for Sustainable Transport Policy Making: the Environmentally Sustainable Transport Study in the Netherlands. European Journal of Transport and
Infrastructure Research, 4(1), pp. 47-69.
Giampietro, M. and Pimentel, D., 1993. The Tightening Conflict: Population, Energy Use and the Ecology of Agriculture. [Online] Teaneck, U.S.A.: Negative Population Gwoth (NPG). Available at:
http://www.npg.org/forum_series/TheTighteningConflict.pdf. [Accessed March 25 2011].
Giurco, D., Cohen, B., Langham, E. and Warnken, M., 2011. Backcasting Energy Futures using Industrial
Ecology.Technological Forecasting and Social Change, 78(5), pp. 797-818.
Global Wind Energy Council (GWEC), 2010. Mexico. [Online] Available at:
http://www.gwec.net/index.php?id=119. [Accessed 17 May 2011].
Godet, M., 1979. The Crises in Forecasting and the Emergence of the "Prospective" Approach: With Case Studies in Energy and Air Transport. New York: Pergamon.
Godet, M., 2000. The Art of Scenarios and Strategic Planning: Tools and Pitfalls. Technological Forecasting and Social Change, 65, pp. 3-22.
Goldemberg, J., Johansson, T.B., Reddy, A.K.N., and Williams, R.H. 1988. Energy for a Sustainable World. New York, U.S.A.: John Wiley and Sons Inc.

71
Green Tech Media, 2010. Sunny México: An Energy Opportunity. [Online] (Updated 7 July 2010) Available at: http://www.greentechmedia.com/articles/read/sunny-mexico-an-energy-opportunity/
[Accessed 18 May 2011].
Haberl, H., 2006. The Global Socioeconomic Energetic Metabolism as a Sustainability Problem. Energy, 31, pp. 87-99.
Hall, C.,Tharakan, P., Hallock, J., Cleveland, C., and Jefferson, J., 2003. Hydrocarbons and the Evolution of Human Culture. Nature, 426, pp. 318-322.
Holmberg, J., 1998. Backcasting: A Natural Step in Operationalising Sustainable Development. Greener Management International, 23(Autumn), pp. 30-51.
Holmberg, J. and Robèrt, K-H., 2000. Backcasting from Non-overlapping Sustainability Principles – a
framework for strategic planning. International Journal of Sustainable Development and World Ecology, 7, pp. 291-308.
Höjer, M., 1998. Transport telematics in urban systems: a backcasting Delphi study. Transportation Research D, 3(6), pp. 445-463.
Höjer, M., 2000. What is the point of IT? Backcasting Urban Transport and Land Use Futures. Ph.D. Stockholm, Sweden: Royal Institute of Technology.
Höjer, M. and Mattsson, L.G., 2000. Determinism and Backcasting in Future Studies. Futures, 32, pp.
613-634.
Höjer, M., Gullberg, A. and Pettersson, R., 2011. Backcasting images of the future city—Time and space
for sustainable development in Stockholm. Technological Forecasting and Social Change, 78(5), pp. 819-834.
Ibarrarán, M.E., Boyd, R., and Molina, M.J., 2006. Hacia el Futuro: Energy, Economics, and the
Environment in 21st Century Mexico. New York, U.S.A.: Springer-Verlag New York Inc.
Instituto Nacional de Estadística y Geografía (INEGI). 2011. Anuario Estadístico de los Estados Unidos
Mexicanos 2010. (ISSN 0188-86920) México: Instituto Nacional de Estadística y Geografía.
Intergovernmental Panel on Climate Change (IPCC), 2005. IPCC Special Report on Carbon Dioxide
Capture and Storage. Prepared by Working Group III of the Intergovernmental Panel on Climate Change [Metz, B., O. Davidson, H. C. de Coninck, M. Loos, and L. A. Meyer (eds.)]. Cambridge University
Press, Cambridge, United Kingdom and New York, NY, USA, 442 pp.
Intergovernmental Panel on Climate Change (IPCC), 2006. 2006 IPCC Guidelines for National Greenhouse Gas Inventories – Volume 2 – Energy. [Online] IPCC. Available at: http://www.ipcc-
nggip.iges.or.jp/public/2006gl/vol2.html
[Accessed 8 June 2011].
Intergovernmental Panel on Climate Change (IPCC), 2011. Assessments Reports [Online] (Updated 2010)
Available at: http://www.ipcc.ch/publications_and_data/publications_and_data_reports.shtml [Accessed 15 May 2011].

72
International Atomic Energy Agency (IAEA). 2005. Comparative Assessment of Energy Options and
Strategies in México until 2025. (IAEA-TECDOC-1469) Austria: IAEA.
International Bank for Reconstruction and Development (IBRD) and The World Bank (TWB), 2009. Low
Carbon Development for México. Washington DC: The World Bank.
Instituto de Investigaciones Eléctricas (IIE), 2008. La energía geotérmica: una opción tecnológica y
económicamente madura. [Online] Available at: http://www.iie.org.mx/boletin032008/tendencias.pdf
[Accessed 29 May 2011].
International Energy Agency (IEA). 2003. Energy to 2050: Scenarios for a Sustainable Future. (ISBN
92-64-01904-9 2003) Paris, France: IEA.
International Energy Agency (IEA). 2006. World Energy Outlook 2006. (ISBN: 92-64-10989-7) Paris,
France: IEA.
International Energy Agency (IEA). 2007. Tracking Industrial Energy Efficiency and CO2 Emissions.
(ISBN: 978-92-64-03016-9) Paris, France: IEA.
International Energy Agency (IEA). 2010a. World Energy Outlook 2010. (ISBN: 978-92-64-08624-1)
Paris, France: IEA.
International Energy Agency (IEA). 2010b. CO2 Emissions from Fuel Combustion Highlights – 2010
Edition. Paris, France: IEA.
International Energy Agency (IEA). 2010c. Photovoltaic Power System Programme – Annual Report 2010. [Online] Switzerland. Available at: http://www.iea-
pvps.org/fileadmin/dam/public/report/annual/ar_2010.pdf [Accessed 27 May 2011]. Johnston, D., Lowe, R. and Bell, M., 2005. An exploration of the technical feasibility of achieving CO2
emission reductions in excess of 60% within the UK housing stock by the year 2050. Energy Policy, 33,
pp. 1643–1659.
Kok, K., Van Vliet, M., Dubel, A., Sendzimir, J. and Bärlund, I., 2011. Combining participative
backcasting and explorative scenario development: experiences from the SCENES project. Technological
Forecasting and Social Change, 78(5), pp. 835-851.
Krothapalli, A., 2010. Solar Energy: An Introduction. [Renewable Energy Technologies class
presentation] September 2010. Stockholm: Royal Institute of Technology.
Lovins A., 1976. Energy strategy: the road not taken? Foreign Affairs
Nielsen, S.K. and Karlsson, K., 2007. Energy Scenarios: a review of methods, uses and suggestions for improvement. International Journal of Global Energy Issues, 27(3), pp. 302-322.
Oilgae, 2010. Sample Content of the Oilgae Report Academic Edition. [Online] Available at: http://www.oilgae.com/ref/downloads/Oilgae_Academic_Edition_Preview.pdf
[Accessed 10 June 2011].

73
Organization for Co-operation and Development (OECD). 2004. Uranium 2003: Resources, Production
and Demand. Joint Report by the OECD Nuclear Energy Agency and the International Atomic Energy Agency. (NEA No. 5291) Paris, France: OECD.
Owens, S. and Driffill, L., 2008. How to Change Attitudes and Behaviours in the Context of Energy.
Energy Policy, 36(12), pp.4412-4418.
Peet J., 1992. Energy and the ecological economics of sustainability. Covello, U.S.A.: Island Press.
PEMEX, 2004. Las Reservas de los Hidrocarburos de México – Evaluación al 1 de Enero del 2004.
México: PEMEX
PEMEX, 2010. Las Reservas de los Hidrocarburos de México – Evaluación al 1 de Enero del 2010.
México: PEMEX
Quist, J., 2007. Backcasting for a Sustainable Future – The impact after ten years. Ph.D. Delft, Netherlands: Delft University of Technology.
Quist, J. and Vergragt, P., 2006. Past and future of backcasting: The shift to stakeholder participation and a proposal for a methodological framework. Futures, 38, pp. 1027-1045.
Quist, J., Thissen, W. and Vergragt, P., 2011. The impact and spin-off of participatory backcasting: From vision to niche. Technological Forecasting and Social Change, 78(5), pp. 883-897.
Raskin, P., Electris, C. and Rosen, R., 2010. The Century Ahead: Searching for Sustainability.
Sustainability, 2, pp. 2626-2651.
Robinson, J.B., 1982. Energy Backcasting: A proposed method of policy analysis. Energy Policy,
December 1982, pp. 337-344.
Robinson, J.B., 1990. Futures Under Glass – a recipe for people who hate to predict. Futures, October,
pp. 820-842.
Rogner, H.-H., D. Zhou, R. Bradley. P. Crabbé, O. Edenhofer, B.Hare (Australia), L. Kuijpers, M.
Yamaguchi, 2007: Introduction. In Climate Change 2007: Mitigation. Contribution of Working Group III
to the Fourth Assessment Report of the Intergovernmental Panel on Climate Change [B. Metz, O.R. Davidson, P.R. Bosch, R. Dave, L.A. Meyer (eds)], Cambridge University Press, Cambridge, United
Kingdom and New York, NY, USA.
Rosas, T., 2010. FHC da Atlas de Recursos Renovables. El Economista, [internet] 7 December 2010.
Available at: http://eleconomista.com.mx/sociedad/2010/12/07/fch-da-atlas-recursos-renovables.
[Accessed 23 May 2011].
Rosen, M.A., 2002. Energy efficiency and sustainable development. International Journal of Global
Energy Issues, 17 (1/2), pp. 23-34.
Rosen, M.A., 2009. Energy Sustainability: A Pragmatic Approach and Illustrations. Sustainability, 1,
pp.55-80.
Royal Commission on Environmental Pollution (RCEP). 2000. Energy : The Changing Climate, (Cmnd.
4749) London: The Stationary Office.

74
Santoyo-Castelazo, E., Gujba, H., and Azapagic, A., 2011. Life Cycle Assessment of Electricity Generation in Mexico. Energy, 36, pp.1488-1499.
Schneider, S.H., S. Semenov, A. Patwardhan, I. Burton, C.H.D. Magadza, M. Oppenheimer, A.B. Pittock,
A. Rahman, J.B. Smith, A. Suarez and F. Yamin, 2007: Assessing key vulnerabilities and the risk from climate change. Climate Change 2007: Impacts, Adaptation and Vulnerability. Contribution of Working
Group II to the Fourth Assessment Report of the Intergovernmental Panel on Climate Change,
M.L. Parry, O.F. Canziani, J.P. Palutikof, P.J. van der Linden and C.E. Hanson, Eds., Cambridge University Press, Cambridge, UK, 779-810.
Schwartz, P., 1991. The Art of the Long View. New York, U.S.A.: Doubleday Currency.
Secretaría de Energía (SENER). 2007. Programa Sectorial de Energía 2007-2012. México: SENER.
Secretaria de Energía (SENER). 2009a. Programa Especial para el Aprovechamiento de Energías Renovables. México: SENER 2009.
Secretaria de Energía (SENER). 2009b. Programa para la Introducción de los Bioenergéticos. México: SENER 2009.
Secretaría de Energía (SENER). 2010a. Balance Nacional de Energía 2009. México: SENER.
Secretaría de Energía (SENER). 2010b. Estrategia Nacional de Energía 2009-2024. México: SENER.
Secretaría de Energía (SENER). 2010c. Prospectiva de Mercado de Gas Natural 2010 – 2025. México: SENER.
Secretaría de Energía (SENER). 2010d. Prospectiva de Sector Eléctrico 2010 – 2025. México: SENER.
Secretaría de Energía (SENER). 2010e. Prospectiva de Petrolíferos 2010 – 2025. México: SENER.
Secretaría de Energía (SENER). 2010f. Prospectiva del Mercado de Gas Licuado de Petróleo 2010 – 2025. México: SENER.
Secretaría de Energía (SENER), 2011a. Sistema de Información Energética. [Online] Available at: http://sie.energia.gob.mx/sie/bdiController
[Accessed 17 May 2011].
Secretaría de Energía (SENER). 2011b. Estrategia Nacional de Energía 2010-2025. México: SENER.
Secretaría de Energía (SENER). 2011c. Prospectiva de Mercado del Petróleo Crudo 2010 – 2025.
México: SENER.
Secretaría de Energía (SENER). 2011d. Estrategia Nacional para la Transición Energética y el
AprovechamientoSustentable de la Energía. México: SENER.
Secretaría de Energía (SENER), Inter-American Development Bank (IABD) and Deutsche Gesellschaft
für Technische Zusammenarbeit (GTZ). 2006. Potenciales y Viabilidad del Uso de Bioetanol y Biodiesel para el Transporte en México. México: SENER.

75
Secretaria de Energia (SENER) and Deutsche Gesellschaft fur Technische Zusammenarbeit (GTZ). 2009.
Energías Renovables para el Desarrollo Sustentable en México 2009. México: SENER.
Smil, V., 2004. World History and Energy. Encyclopedia of Energy, C. Cleveland, ed., Vol. 6, Elsevier,
Amsterdam, pp. 549-561.
Solomon, S., D. Qin, M. Manning, R.B. Alley, T. Berntsen, N.L. Bindoff, Z. Chen, A. Chidthaisong, J.M.
Gregory, G.C. Hegerl, M. Heimann, B. Hewitson, B.J. Hoskins, F. Joos, J. Jouzel, V. Kattsov, U.
Lohmann, T. Matsuno, M. Molina, N. Nicholls, J. Overpeck, G. Raga, V. Ramaswamy, J. Ren, M. Rusticucci, R. Somerville, T.F. Stocker, P. Whetton, R.A. Wood and D. Wratt, 2007: Technical
Summary. In: Climate Change 2007: The Physical Science Basis. Contribution of Working Group I to the
Fourth Assessment Report of the Intergovernmental Panel on Climate Change [Solomon, S., D. Qin, M. Manning, Z. Chen, M. Marquis, K.B. Averyt, M. Tignor and H.L. Miller (eds.)]. Cambridge University
Press, Cambridge, United Kingdom and New York, NY, USA.
Stern, N., 2006. The Economics of Climate Change: The Stern Review. UK: Cambridge University Press
Suwa, K., 2009. Soft Energy Paths in Japan: A Backcasting Approach to Energy Planning, Climate
Policy, 9, pp.185-206.
Svenfelt, A., Engström, R. and Svane, O., 2011. Decreasing energy use in buildings by 50% by 2050—a
backcasting study using stakeholder groups. Technological Forecasting and Social Change, 78(5), pp. 785-796.
The Encyclopedia of Earth, 2011. Energy profile of Mexico. [Online] (Updated 10 September 2010)
Available at: http://www.eoearth.org/article/Energy_profile_of_Mexico#gen17 [Accessed 25 May 2011].
The Franklin Institute, 2006. History of Energy. [Online] (Updated 25 April 2006) Available at:
http://www.fi.edu/learn/case-files/energy.html. [Accessed 2 May 2011].
The International Network for Sustainable Energy, 2010. A Global Vision for 2050. [Online] (Updated
2010) Available at: http://www.inforse.org/europe/VisionWorld.htm [Accessed 10 June 2011]
The Natural Step (TNS), 2011. The Natural Step. [Online] (Updated May 2011). Available at: http://www.naturalstep.org/
[Accessed 13 May 2011].
The World Bank, 2011. World Development Indicators. [Online] (Updated April 2011) Available at:
http://data.worldbank.org/indicator
[Accessed 18 May 2011].
U.S. Departmen of Energy, 2007. Algal Biofuels. [Online] Available at:
http://www1.eere.energy.gov/biomass/pdfs/algalbiofuels.pdf
[Accessed 15 June 2011].
U.S. Energy Information Administration (EIA). 2010a. International Energy Outlook 2010. (DOE/EIA-
0484) Washington, D.C.: U.S. Energy Information Administration.

76
U.S. Energy Information Administration (EIA), 2010b. Mexico Country Analysis Brief. [Online]
(Updated June 2010) Available at: http://www.eia.gov/countries/cab.cfm?fips=MX. [Accessed 24 April 2011].
U.S. Energy Information Administration (EIA), 2011. International Energy Statistics. [Online] (Updated
30 June 2010) Available at: http://www.eia.gov/cfapps/ipdbproject/IEDIndex3.cfm#. [Accesed 25 April 2011].
Vergragt, p. and Quist, J., 2011. Backcasting for Sustainability: Introduction to the Special Issue. Technological Forecasting and Social Change, 78(5), pp. 747-755.
Wallace, R., 2009. Coal in Mexico. [Online] Available at: http://www.economia.unam.mx/publicaciones/econinforma/pdfs/359/brucelish.pdf
[Accessed 26 May 2011].
World Commission on Environment and Development (WCED). 1987. Our common future. Oxford: Oxford University Press.
World Nuclear Association, 2011. Nuclear Power in Mexico. [Online] (Updated February 2011) Available at: http://www.world-nuclear.org/info/inf106.html.
[Accessed 1 June 2011].
Zvolinschi, A., Kjelstrup, S., Bolland, O., and van der Kooi, H. J., 2007. Exergy Sustainability Indicators
as a Tool in Industrial Ecology. Journal of Industrial Ecology, 11, pp.85-98.

77
11. Annexes
Annex 6a
Energy source Conversion factor Unit
Crude oil 0.000006381 PJ/b
Condensates 0.000004944 PJ/b
Natural gas 4.0128E-08 PJ/m³
Coal 0.0000282 PJ/t
Oil coke 0.000032617 PJ/t
Gas LP 0.000004248 PJ/b
Gasoline and naphtha 0.000005182 PJ/b
Diesel 0.000005692 PJ/b
Oil fuel 0.000006538 PJ/b
Dry gas 0.000033913 PJ/b
Coal coke 0.000026521 PJ/t
Wood 0.000014486 PJ/t
Sugar cane bagasse 0.000007055 PJ/t
Wood 0.000003287 PJ/g
Electricity 0.0036 PJ/GWh
Energy sources conversion factors
Source: SENER [2010a, p.99]
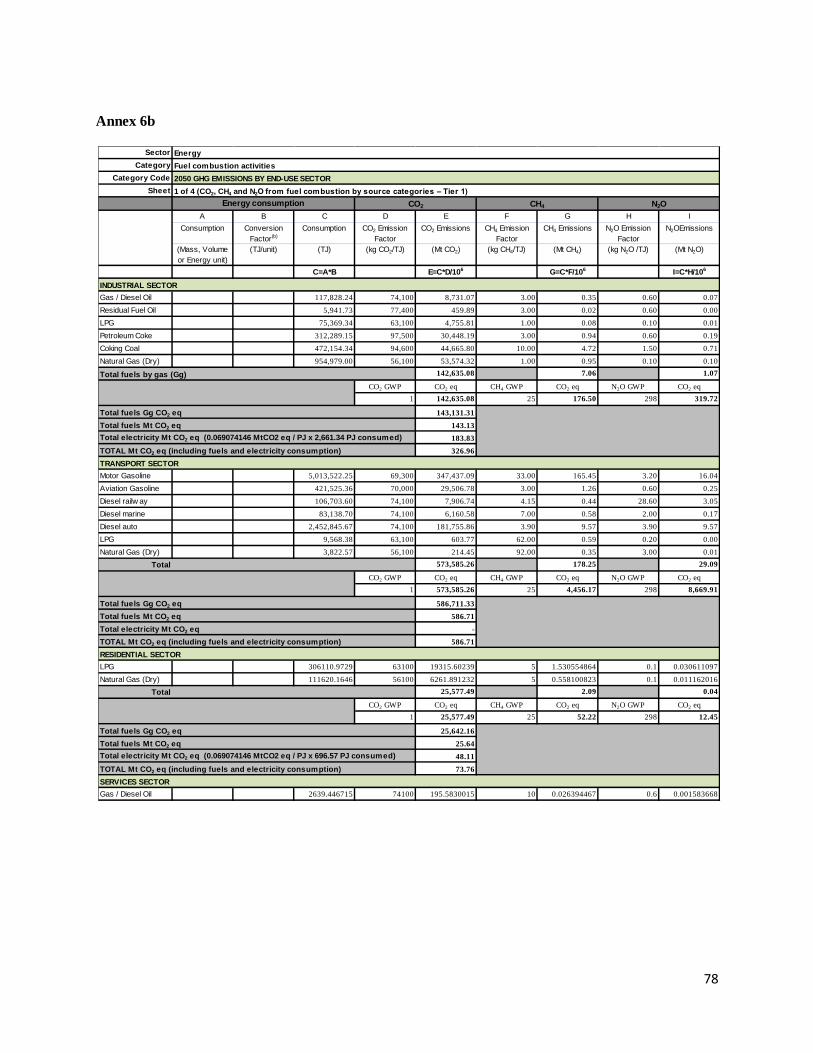
78
Annex 6b
Sector
Category
Category Code
Sheet
A B C D E F G H I
Consumption Conversion
Factor(b)
Consumption CO2 Emission
Factor
CO2 Emissions CH4 Emission
Factor
CH4 Emissions N2O Emission
Factor
N2OEmissions
(Mass, Volume
or Energy unit)
(TJ/unit) (TJ) (kg CO2/TJ) (Mt CO2) (kg CH4/TJ) (Mt CH4) (kg N2O /TJ) (Mt N2O)
C=A*B E=C*D/106 G=C*F/106 I=C*H/106
Gas / Diesel Oil 117,828.24 74,100 8,731.07 3.00 0.35 0.60 0.07
Residual Fuel Oil 5,941.73 77,400 459.89 3.00 0.02 0.60 0.00
LPG 75,369.34 63,100 4,755.81 1.00 0.08 0.10 0.01
Petroleum Coke 312,289.15 97,500 30,448.19 3.00 0.94 0.60 0.19
Coking Coal 472,154.34 94,600 44,665.80 10.00 4.72 1.50 0.71
Natural Gas (Dry) 954,979.00 56,100 53,574.32 1.00 0.95 0.10 0.10
142,635.08 7.06 1.07
CO2 GWP CO2 eq CH4 GWP CO2 eq N2O GWP CO2 eq
1 142,635.08 25 176.50 298 319.72
143,131.31
143.13
183.83
326.96
Motor Gasoline 5,013,522.25 69,300 347,437.09 33.00 165.45 3.20 16.04
Aviation Gasoline 421,525.36 70,000 29,506.78 3.00 1.26 0.60 0.25
Diesel railw ay 106,703.60 74,100 7,906.74 4.15 0.44 28.60 3.05
Diesel marine 83,138.70 74,100 6,160.58 7.00 0.58 2.00 0.17
Diesel auto 2,452,845.67 74,100 181,755.86 3.90 9.57 3.90 9.57
LPG 9,568.38 63,100 603.77 62.00 0.59 0.20 0.00
Natural Gas (Dry) 3,822.57 56,100 214.45 92.00 0.35 3.00 0.01
Total 573,585.26 178.25 29.09
CO2 GWP CO2 eq CH4 GWP CO2 eq N2O GWP CO2 eq
1 573,585.26 25 4,456.17 298 8,669.91
586,711.33
586.71
-
586.71
LPG 306110.9729 63100 19315.60239 5 1.530554864 0.1 0.030611097
Natural Gas (Dry) 111620.1646 56100 6261.891232 5 0.558100823 0.1 0.011162016
Total 25,577.49 2.09 0.04
CO2 GWP CO2 eq CH4 GWP CO2 eq N2O GWP CO2 eq
1 25,577.49 25 52.22 298 12.45
25,642.16
25.64
48.11
73.76
Gas / Diesel Oil 2639.446715 74100 195.5830015 10 0.026394467 0.6 0.001583668
INDUSTRIAL SECTOR
Total fuels by gas (Gg)
Total fuels Gg CO2 eq
Total fuels Mt CO2 eq
Total electricity Mt CO2 eq (0.069074146 MtCO2 eq / PJ x 2,661.34 PJ consumed)
TOTAL Mt CO2 eq (including fuels and electricity consumption)
Total fuels Gg CO2 eq
Energy
Fuel combustion activities
2050 GHG EMISSIONS BY END-USE SECTOR
1 of 4 (CO2, CH4 and N2O from fuel combustion by source categories – Tier 1)
Energy consumption CO2 CH4 N2O
TRANSPORT SECTOR
RESIDENTIAL SECTOR
SERVICES SECTOR
Total fuels Mt CO2 eq
Total fuels Mt CO2 eq
Total electricity Mt CO2 eq
TOTAL Mt CO2 eq (including fuels and electricity consumption)
Total fuels Gg CO2 eq
Total electricity Mt CO2 eq (0.069074146 MtCO2 eq / PJ x 696.57 PJ consumed)
TOTAL Mt CO2 eq (including fuels and electricity consumption)

79
Annex 6b
Se
cto
r
Cate
go
ry
Cate
go
ry C
od
e
Sh
ee
t
AB
CD
EF
GH
I
Consum
ptio
nC
onvers
ion
Facto
r(b)
Consum
ptio
nC
O2 E
mis
sio
n
Facto
r
CO
2 E
mis
sio
ns
CH
4 E
mis
sio
n
Facto
r
CH
4 E
mis
sio
ns
N2O
Em
issio
n
Facto
r
N2O
Em
issio
ns
(Mass, V
olu
me
or
Energ
y u
nit)
(TJ/
unit)
(TJ)
(kg C
O2/T
J)(G
g C
O2)
(kg C
H4/T
J)(G
g C
H4)
(kg N
2O
/TJ)
(Gg N
2O
)
C=A
*BE=C
*D/1
06
G=C
*F/1
06
I=C
*H/1
06
Gas / D
iesel O
il3
,38
2.0
97
4,1
00
25
0.6
13
0.0
10
.60
.00
Resid
ual F
uel O
il2
1,8
19
.65
77
,40
01
,68
8.8
43
0.0
70
.60
.01
Petr
ole
um
Coke
26
,51
1.4
99
7,5
00
2,5
84
.87
30
.08
0.6
0.0
2
Coki
ng C
oal
3,0
45
,27
6.2
59
4,6
00
28
8,0
83
.13
13
.05
1.5
4.5
7
Natu
ral G
as (
Dry
)6
,19
4,4
12
.07
56
,10
03
47
,50
6.5
20
.31
.86
0.1
0.6
2
64
0,1
13
.97
5.0
65
.22
CO
2 G
WP
CO
2 e
qC
H4 G
WP
CO
2 e
qN
2O
GW
PC
O2 e
q
1640,1
13.9
725
126.4
7298
1,5
55.0
8
64
1,7
95
.52
64
1.8
0
0.0
69
07
41
46
11
35
5.0
43
Cru
de O
il3
56
,14
0.0
07
3,3
00
26
,10
5.0
63
.00
1.0
70
.60
0.2
1
Moto
r G
asolin
e5
,76
1.0
66
9,3
00
39
9.2
43
.00
0.0
20
.60
0.0
0
Gas / D
iesel O
il2
0,5
51
.48
74
,10
01
,52
2.8
63
.00
0.0
60
.60
0.0
1
Resid
ual F
uel O
il1
7,3
44
.30
74
,40
01
,29
0.4
23
.00
0.0
50
.60
0.0
1
LPG
16
6,0
07
.55
63
,10
01
0,4
75
.08
0.3
00
.05
0.1
00
.02
Natu
ral G
as (
Dry
)1
,54
6,5
63
.38
56
,10
08
6,7
62
.21
1.0
01
.55
0.1
00
.15
12
6,5
54
.87
2.8
00
.41
CO
2 G
WP
CO
2 e
qC
H4 G
WP
CO
2 e
qN
2O
GW
PC
O2 e
q
1126,5
54.8
725
69.8
9298
122.5
2
12
6,7
47
.28
12
6.7
5
48
1.7
9
En
erg
y
Fu
el co
mb
us
tio
n a
cti
vit
ies
2050 G
HG
EM
ISS
ION
S B
Y E
NER
GY
IN
DU
ST
RIE
S
1 o
f 4 (
CO
2, C
H4 a
nd
N2O
fro
m f
ue
l co
mb
us
tio
n b
y s
ou
rce
cate
go
rie
s –
Tie
r 1)
En
erg
y c
on
su
mp
tio
nC
O2
CH
4N
2O
EL
EC
TR
IC S
EC
TO
R
To
tal b
y g
as
(G
g)
(th
is t
ota
l re
pre
se
nts
th
e 9
,291.4
0 P
J o
f to
tal e
ne
rgy c
on
su
me
d)
To
tal G
g C
O2 e
q (9
,291.4
0 P
J o
f to
tal e
ne
rgy c
on
su
me
d)
To
tal M
t C
O2 e
q (9
,291.4
0 P
J o
f to
tal e
ne
rgy c
on
su
me
d)
Mt
CO
2 e
q / P
J o
f e
lectr
ic e
ne
rgy c
on
su
me
d
To
tal M
t C
O2 e
q (5
,140.0
3 P
J o
f e
ne
rgy c
on
su
me
d b
y t
he
ele
ctr
ic s
ecto
r)
OIL
AN
D G
AS
SEC
TO
R
To
tal G
g C
O2 e
q
To
tal M
t C
O2 e
q
TO
TA
L E
NER
GY
IN
DU
ST
RIE
S
To
tal M
t C
O2 e
q
To
tal b
y g
as
(G
g)