C: Flow Process Chart This chart uses circles for operations, arrows for transports, squares for...
43
c: Flow Process Chart This chart uses circles for operations, arrows for transports, squares for inspections, triangles for storage, and the letter D for delays. Vertical lines connect these symbols in the sequence they are
-
Upload
roderick-underwood -
Category
Documents
-
view
231 -
download
1
Transcript of C: Flow Process Chart This chart uses circles for operations, arrows for transports, squares for...
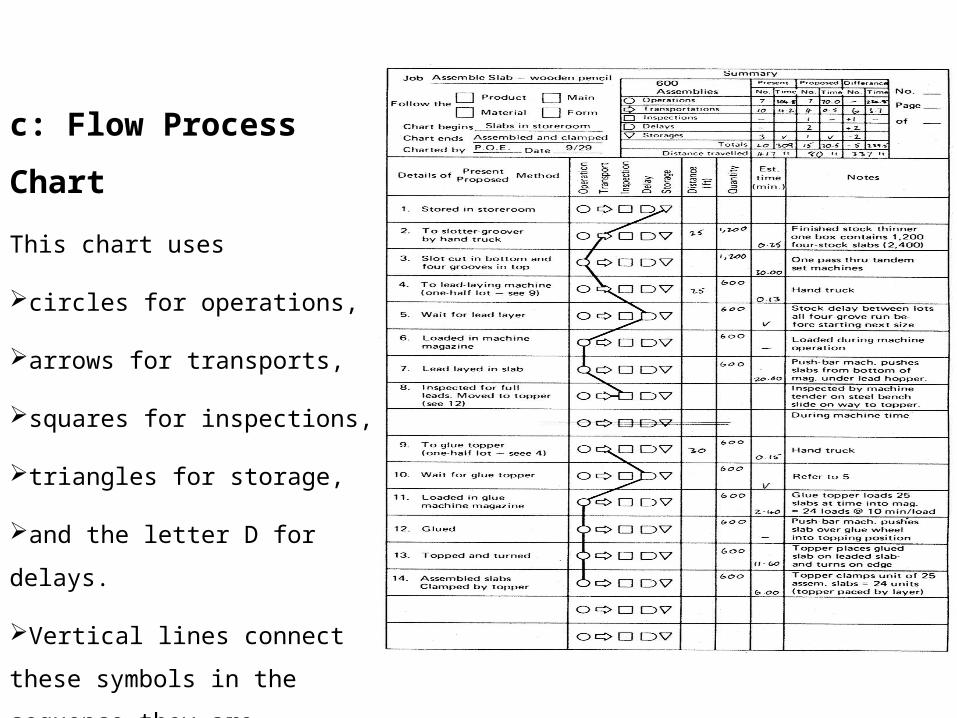
c: Flow Process Chart
This chart uses
circles for operations,
arrows for transports,
squares for inspections,
triangles for storage,
and the letter D for delays.
Vertical lines connect these
symbols in the sequence they are
performed.
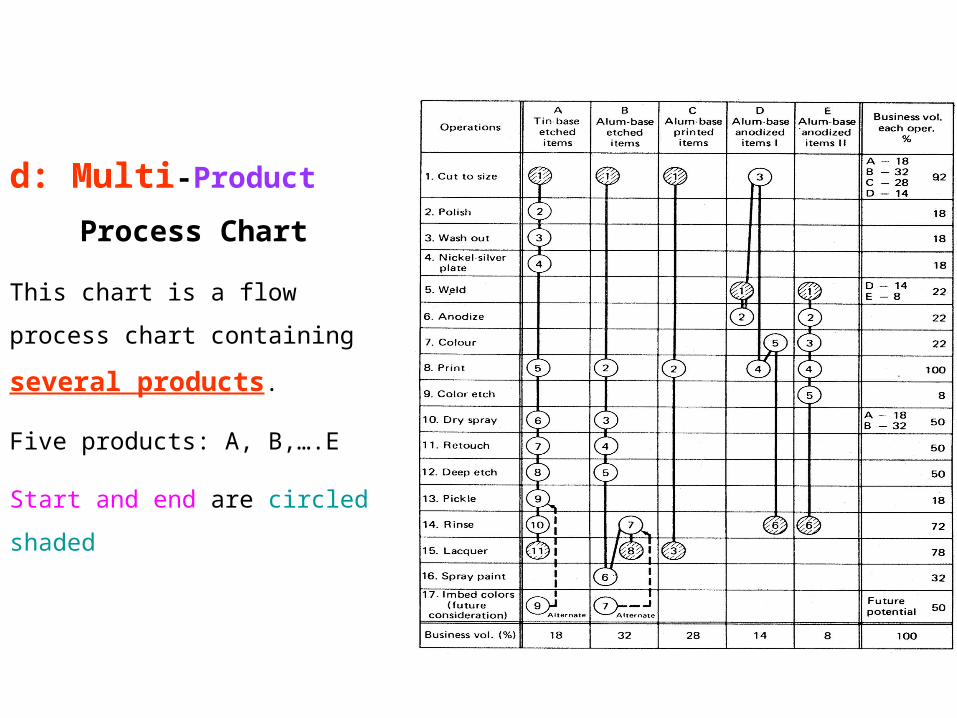
d: Multi-Product
Process Chart
This chart is a flow process chart
containing several products.
Five products: A, B,….E
Start and end are circled shaded
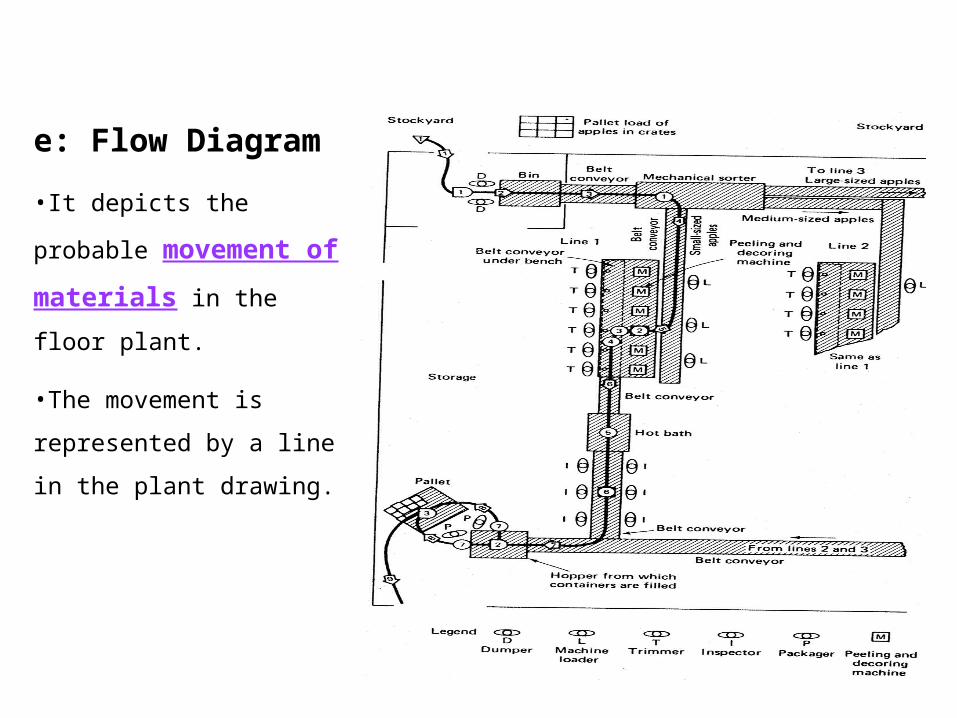
e: Flow Diagram
•It depicts the probable
movement of materials in
the floor plant.
•The movement is
represented by a line in the
plant drawing.
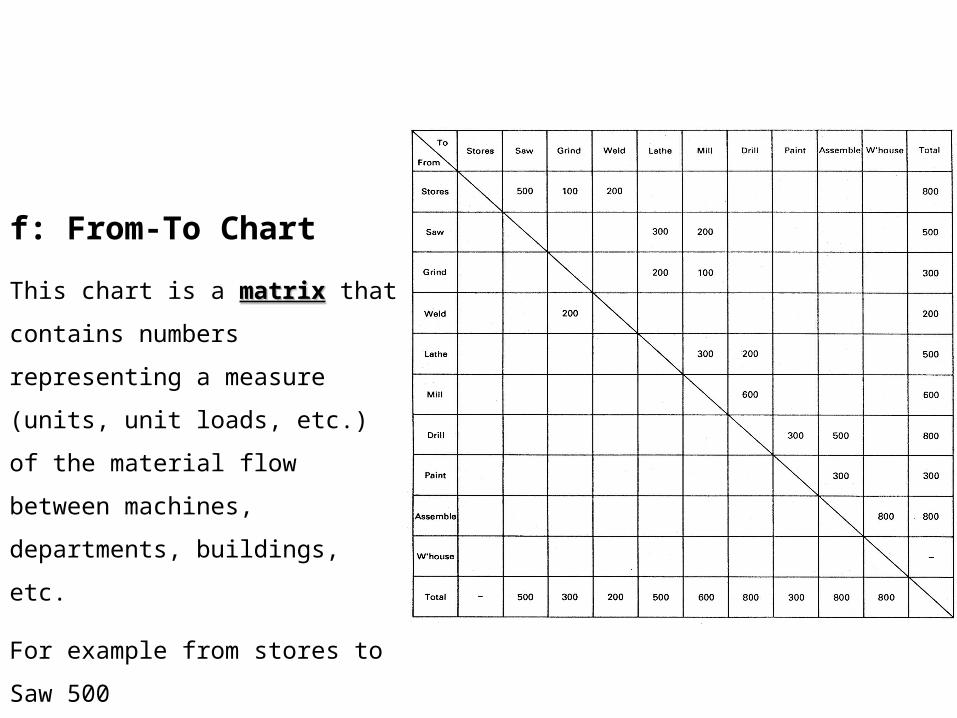
f: From-To Chart
This chart is a matrixmatrix that contains
numbers representing a measure
(units, unit loads, etc.) of the
material flow between machines,
departments, buildings, etc.
For example from stores to Saw 500

3: Flow Patterns• Three types of pattern flow1. Flow within workstation2. Flow within departments3. Flow between departments
• Motion studies and ergonomics considerations are important in establishing flow within workstations.
• Ergonomics is an applied science concerned with designing and arranging things people use so that the people and things interact most efficiently and safely -- called also biotechnology, human engineering, human factors
For example: Flow within a workstation should be simultaneous Symmetrical Natural Rhythmical Habitual
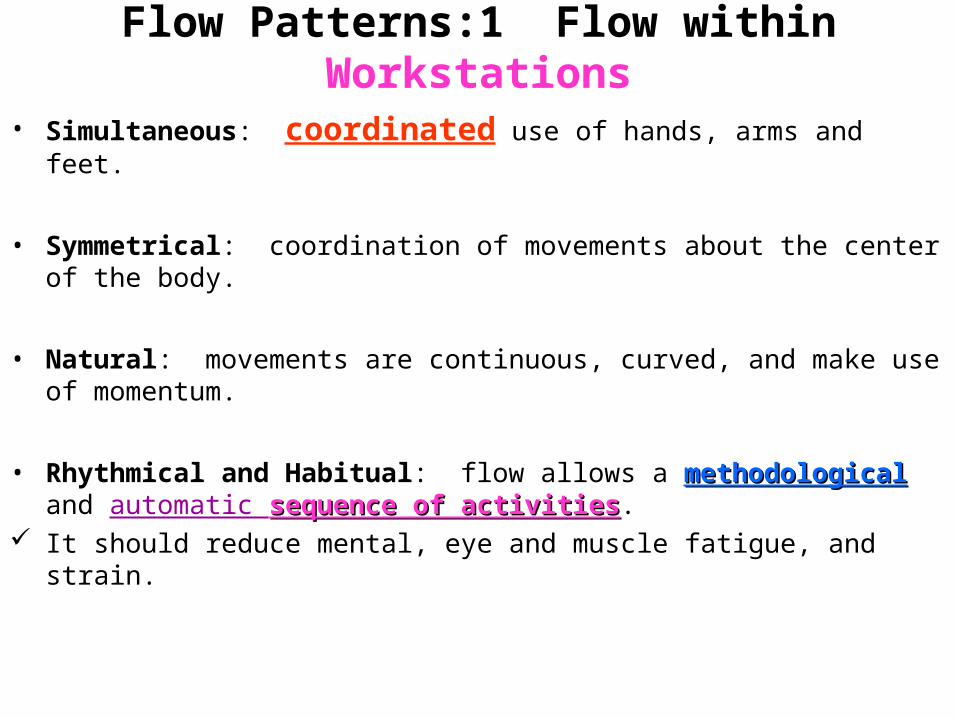
Flow Patterns:1 Flow within Workstations
• Simultaneous: coordinated use of hands, arms and feet.
• Symmetrical: coordination of movements about the center of the body.
• Natural: movements are continuous, curved, and make use of momentum.
• Rhythmical and Habitual: flow allows a methodologicalmethodological and automatic sequence of activitiessequence of activities.
It should reduce mental, eye and muscle fatigue, and strain.
Flow Patterns:1 Flow within workstations• Simultaneous flow implies the coordinated use of hands, arms, and feet.
• Hands, arms, and feet should begin and end their motions together and should not be idle at the same instant except during rest periods.
• Symmetrical flow results from coordination of movements about the center of the body.
• The left and right hands and arms should be working in coordination.
• Natural flow patterns are the basis for rhythmic habitual flow patterns.
• Natural movements are continuous, curved, and make use of momentum.
• Rhythmical and habitual flow implies a methodical, automatic sequence of activity.
• Rhythmical and habitual flow patterns also allow for reduced mental, eye, and muscle fatigue, and strain.
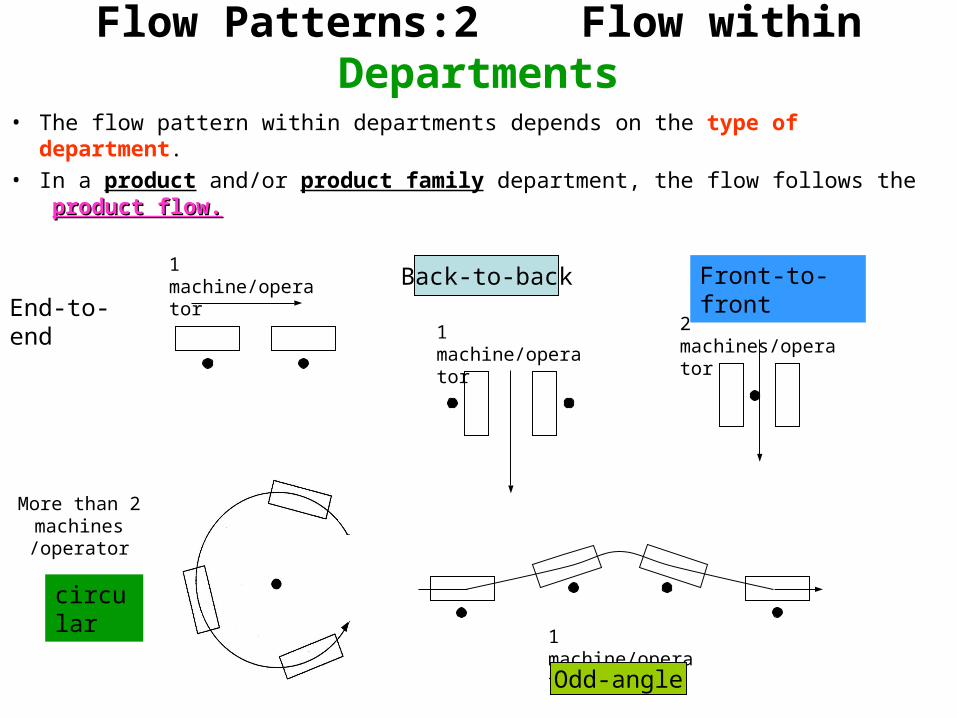
Flow Patterns:2 Flow within Departments
• The flow pattern within departments depends on the type of department.• In a product and/or product family department, the flow follows the
product flow.product flow.
1 machine/operator
End-to-end1 machine/operator
Back-to-back
2 machines/operator
Front-to-front
More than 2 machines /operator
circular
1 machine/operator
Odd-angle
Flow Pat.: 2 Flow within Departments (cont.)
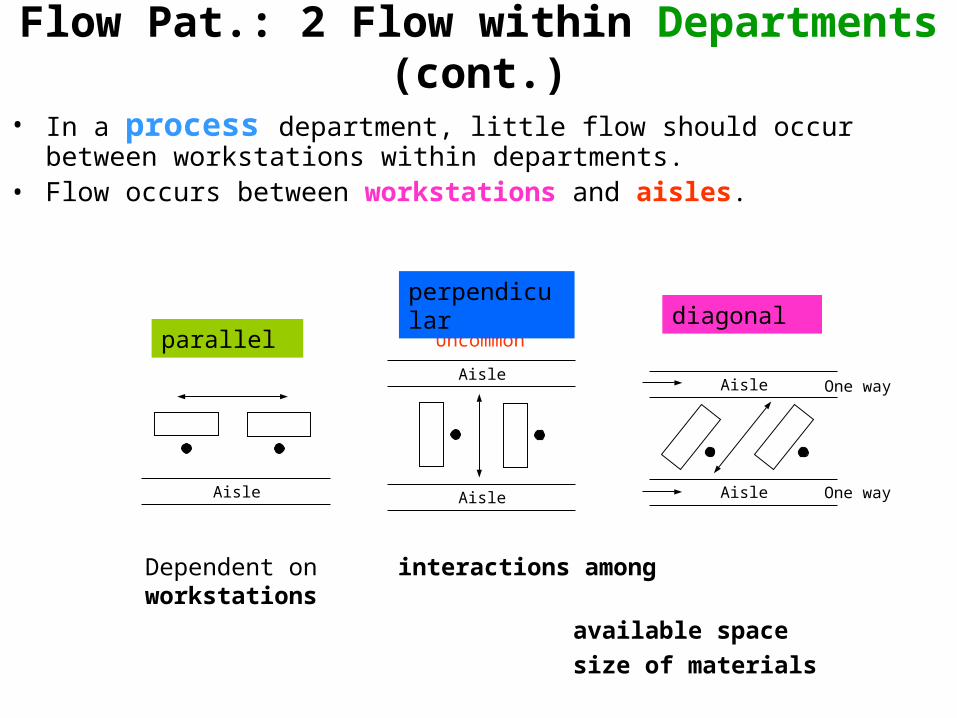
• In a process department, little flow should occur between workstations within departments.
• Flow occurs between workstations and aisles.
Aisle
Aisle
Aisle
Aisle
Aisle
Dependent on interactions among workstations
available space
size of materials
Uncommon
One way
One way
parallel
perpendiculardiagonal
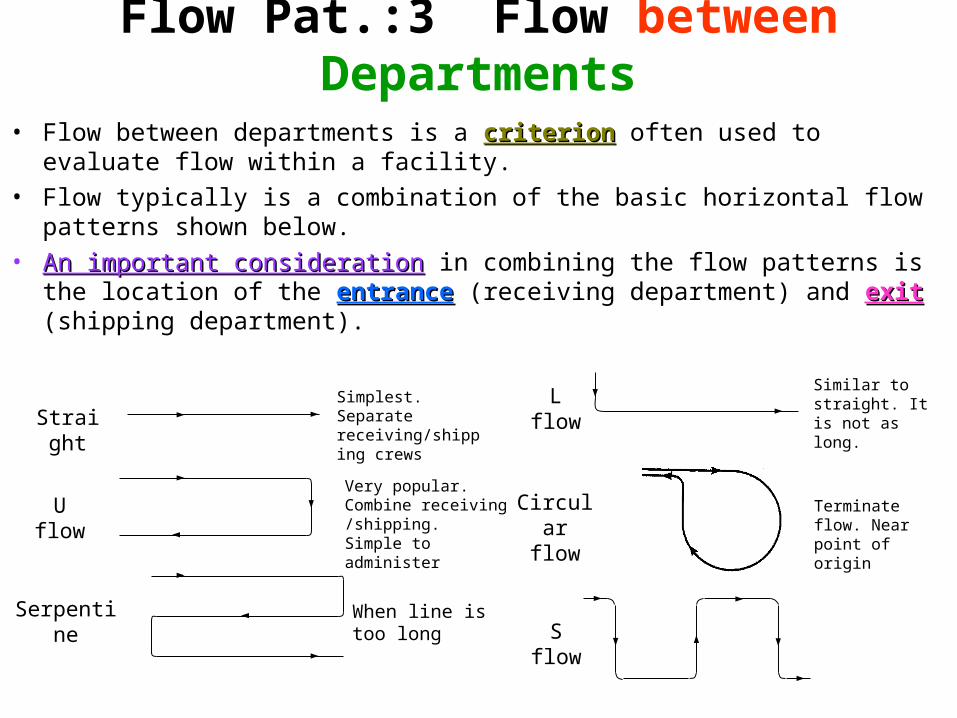
Flow Pat.:3 Flow between Departments
• Flow between departments is a criterioncriterion often used to evaluate flow within a facility.
• Flow typically is a combination of the basic horizontal flow patterns shown below.
• An important considerationAn important consideration in combining the flow patterns is the location of the entranceentrance (receiving department) and exit exit (shipping department).
Straight
U flow
Serpentine
L flow
S flow
Circularflow
Simplest. Separate receiving/shipping crews
Very popular. Combine receiving /shipping. Simple to administer
When line is too long
Similar to straight. It is not as long.
Terminate flow. Near point of origin

Flow within a facility considering the locations of entranceentrance and exitexit
At the same location
On adjacent sides
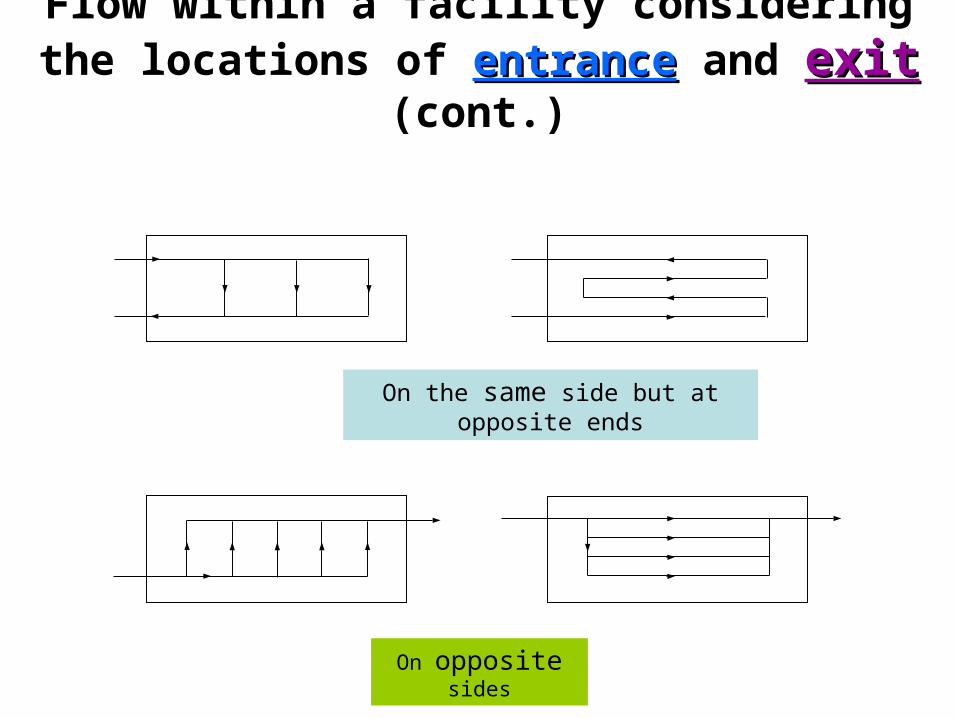
Flow within a facility considering the locations of entranceentrance and exit exit (cont.)
On the same side but at opposite ends
On opposite sides
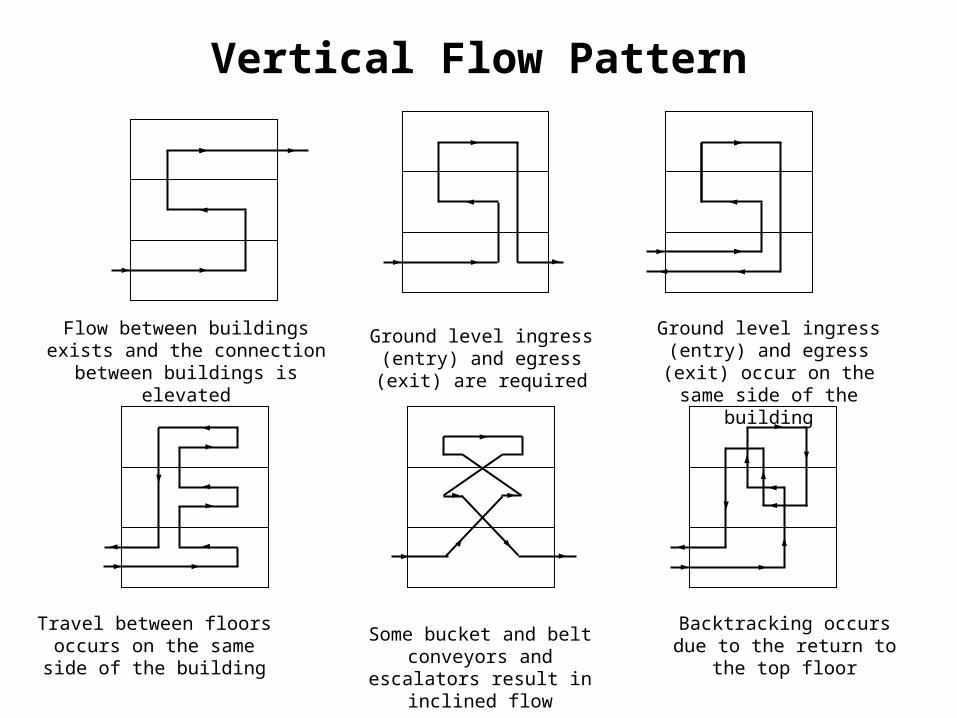
Vertical Flow Pattern
Flow between buildings exists and the connection between buildings is
elevated
Ground level ingress (entry) and egress (exit) are required
Ground level ingress (entry) and egress (exit) occur on the
same side of the building
Travel between floors occurs on the same side of the building
Some bucket and belt conveyors and escalators result
in inclined flow
Backtracking occurs due to the return to the top floor
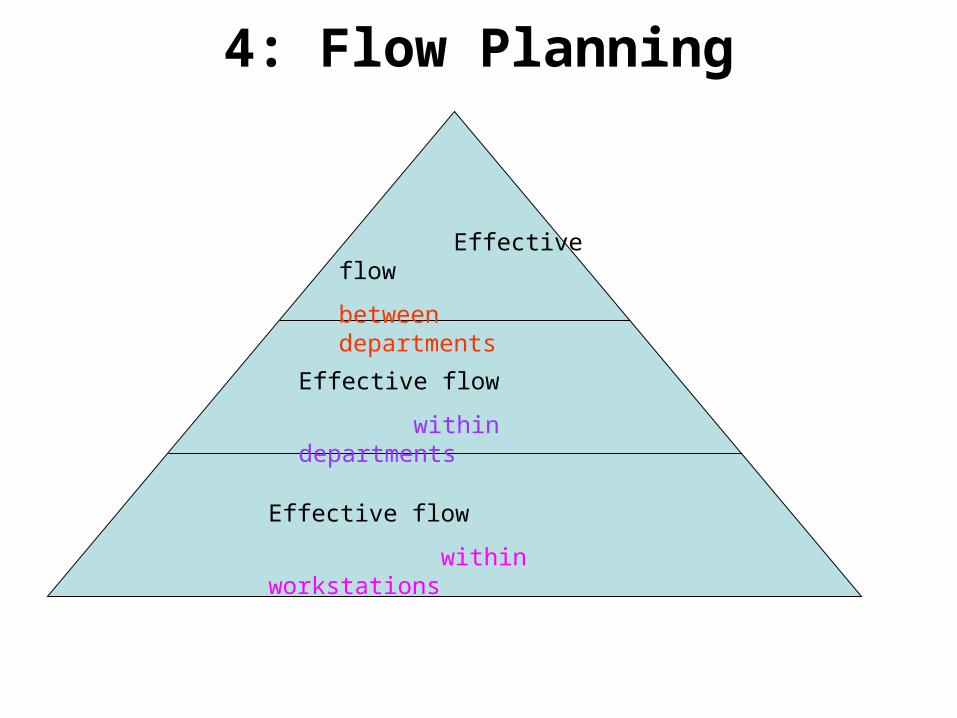
Effective flow
within workstations
Effective flow
within departments
Effective flow
between departments
4: Flow Planning
4: Flow Planning
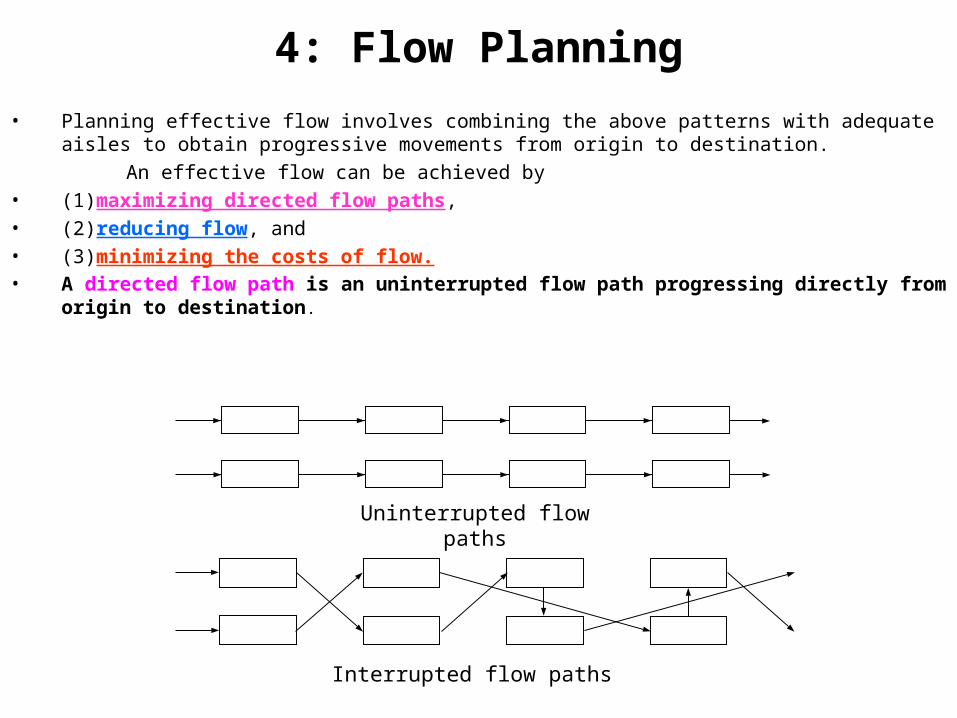
• Planning effective flow involves combining the above patterns with adequate aisles to obtain progressive movements from origin to destination.
An effective flow can be achieved by • (1)maximizing directed flow paths, • (2)reducing flow, and • (3)minimizing the costs of flow.• A directed flow path is an uninterrupted flow path progressing directly from origin
to destination.
Uninterrupted flow paths
Interrupted flow paths
4: Flow Planning (cont.)
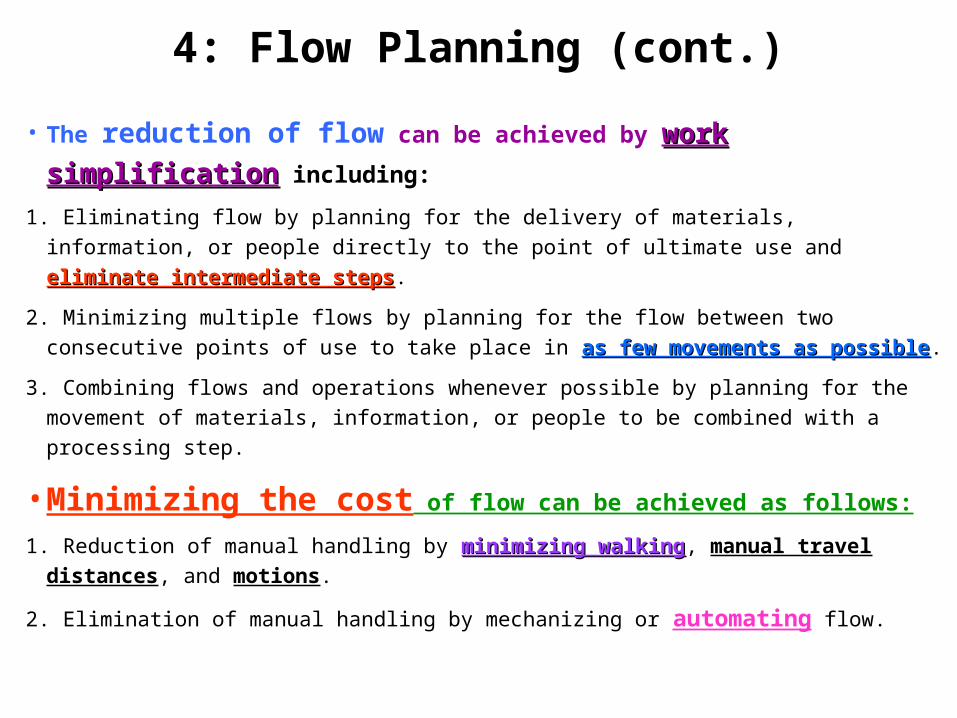
• The reduction of flow can be achieved by work simplificationwork simplification
including:
1. Eliminating flow by planning for the delivery of materials, information, or people
directly to the point of ultimate use and eliminate intermediate stepseliminate intermediate steps.
2. Minimizing multiple flows by planning for the flow between two consecutive points of
use to take place in as few movements as possibleas few movements as possible.
3. Combining flows and operations whenever possible by planning for the movement of
materials, information, or people to be combined with a processing step.
• Minimizing the cost of flow can be achieved as follows:
1. Reduction of manual handling by minimizing walkingminimizing walking, manual travel distances,
and motions.
2. Elimination of manual handling by mechanizing or automating flow.
5: Measuring Flow
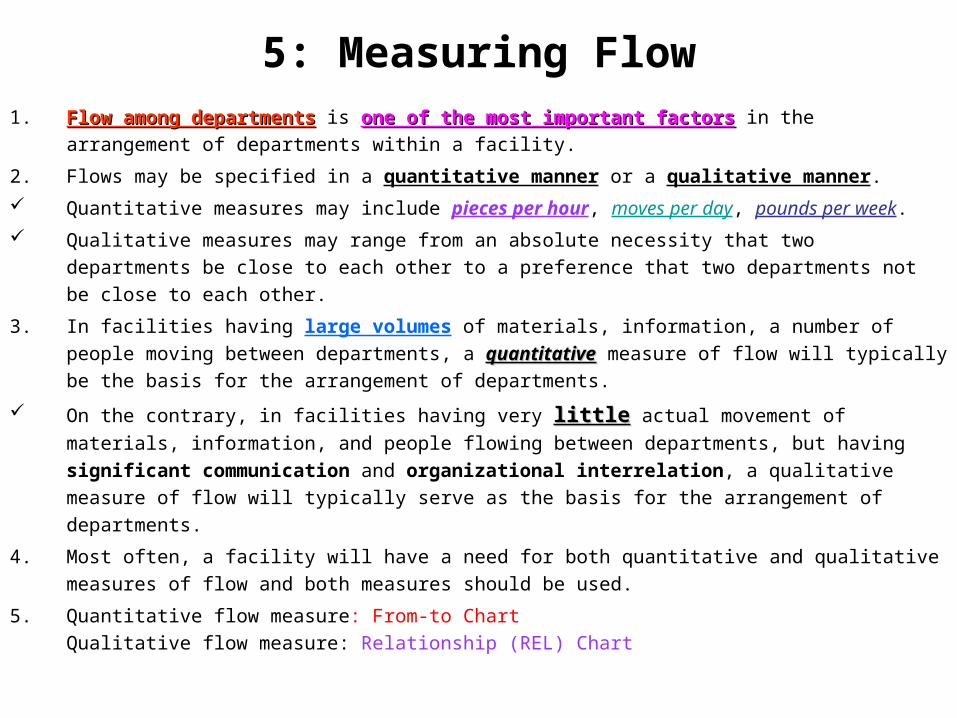
1. Flow among departmentsFlow among departments is one of the most important factorsone of the most important factors in the arrangement of
departments within a facility.
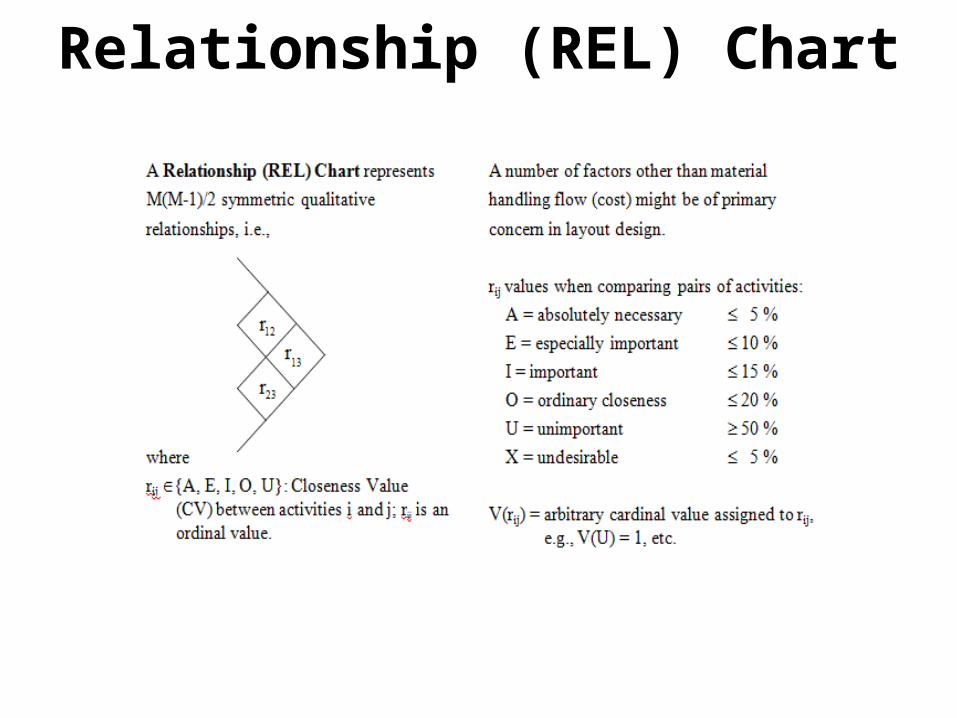
2. Flows may be specified in a quantitative manner or a qualitative manner.
Quantitative measures may include pieces per hour, moves per day, pounds per week.
Qualitative measures may range from an absolute necessity that two departments be close
to each other to a preference that two departments not be close to each other.
3. In facilities having large volumes of materials, information, a number of people moving
between departments, a quantitativequantitative measure of flow will typically be the basis for the
arrangement of departments.
On the contrary, in facilities having very littlelittle actual movement of materials, information, and
people flowing between departments, but having significant communication and
organizational interrelation, a qualitative measure of flow will typically serve as the basis
for the arrangement of departments.
4. Most often, a facility will have a need for both quantitative and qualitative measures of flow
and both measures should be used.
5. Quantitative flow measure: From-to Chart
Qualitative flow measure: Relationship (REL) Chart

Quantitative Flow Measurement
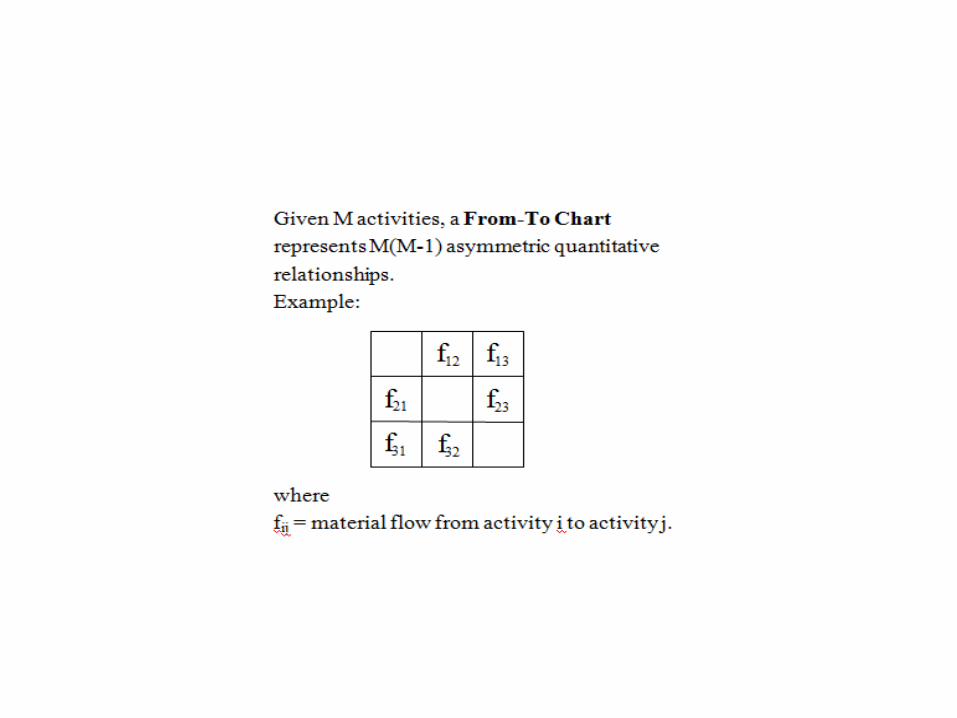
• A From-to Chart is constructed as follows:
1. List all departmentsList all departments down the rowrow and across the column column following the overall flow
pattern.
2. Establish a measure of flow for the facility that accurately indicates equivalent flow volumes.
If the items moved are equivalent with respect to ease of movement, the number of trips
may be recorded in the from-to chart.
If the items moved vary vary in size, weight, value, risk of damage, shape, and so on, then
equivalent items may be established so that the quantities recorded in the from-to chart
represent the proper relationships among the volumes of movement.
3. Based on the flow paths for the items to be moved and the established measure of flow,
record the flow volumes in the from-to chart.
• Lacks symmetry: because there is no definite reason for the flows from stores to
milling to be the same as the flows from milling to stores.
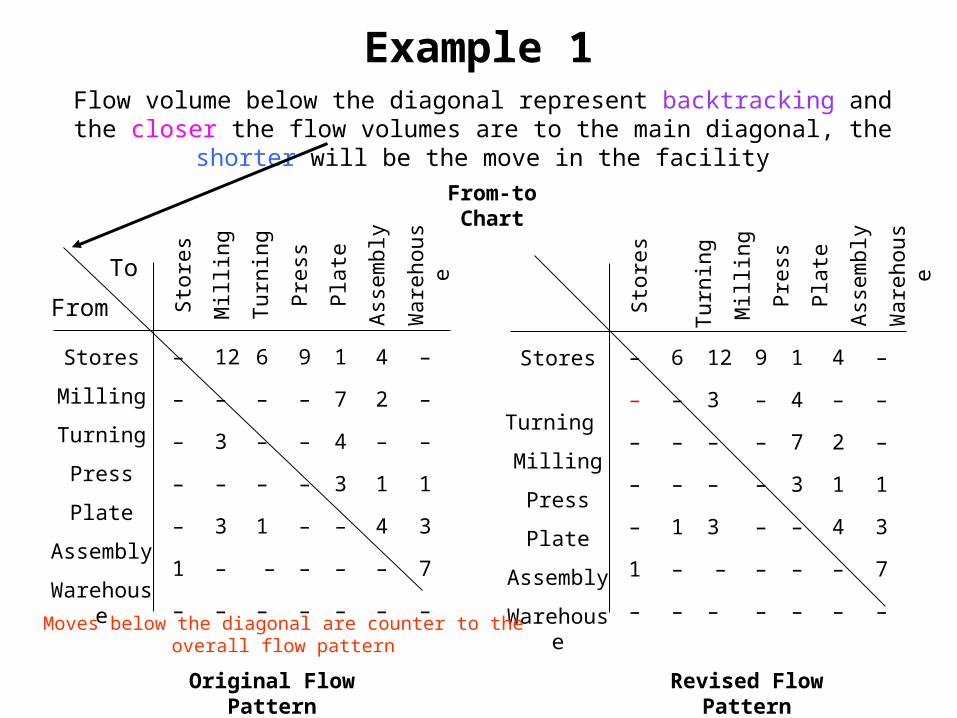
Example 1
Stores
Turning
Milling
Press
Plate
Assembly
Warehouse
– 6 12 9 1 4 –
– – 3 – 4 – –
– – – – 7 2 –
– – – – 3 1 1
– 1 3 – – 4 3
1 – – – – – 7
– – – – – – –S
tore
s
T
urni
ng
Mil
ling
Pre
ss
Pla
te
Ass
embl
y
War
ehou
se
Stores
Milling
Turning
Press
Plate
Assembly
Warehouse
– 12 6 9 1 4 –
– – – – 7 2 –
– 3 – – 4 – –
– – – – 3 1 1
– 3 1 – – 4 3
1 – – – – – 7
– – – – – – –
Sto
res
Mil
ling
Tur
ning
Pre
ss
Pla
te
Ass
embl
y
War
ehou
se
From-to Chart
Original Flow Pattern Revised Flow Pattern
From
To
Flow volume below the diagonal represent backtracking and the closer the flow volumes are to the main diagonal, the shorter will be the move in the facility
Moves below the diagonal are counter to the overall flow pattern
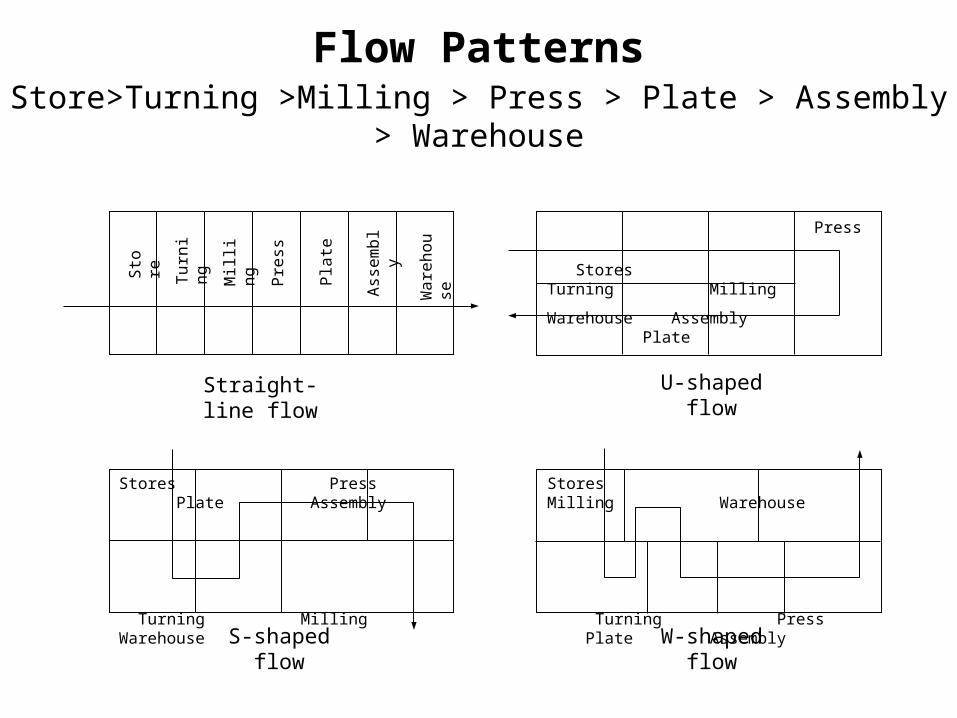
Flow Patterns
Sto
re
Tur
ning
Mil
ling
Pre
ss
Pla
te
Ass
embl
y
War
ehou
se
Stores Turning Milling
Warehouse Assembly Plate
Press
Stores Press Plate Assembly
Turning Milling Warehouse
Stores Milling Warehouse
Turning Press Plate Assembly
Straight-line flow U-shaped flow
W-shaped flowS-shaped flow
Store>Turning >Milling > Press > Plate > Assembly > Warehouse
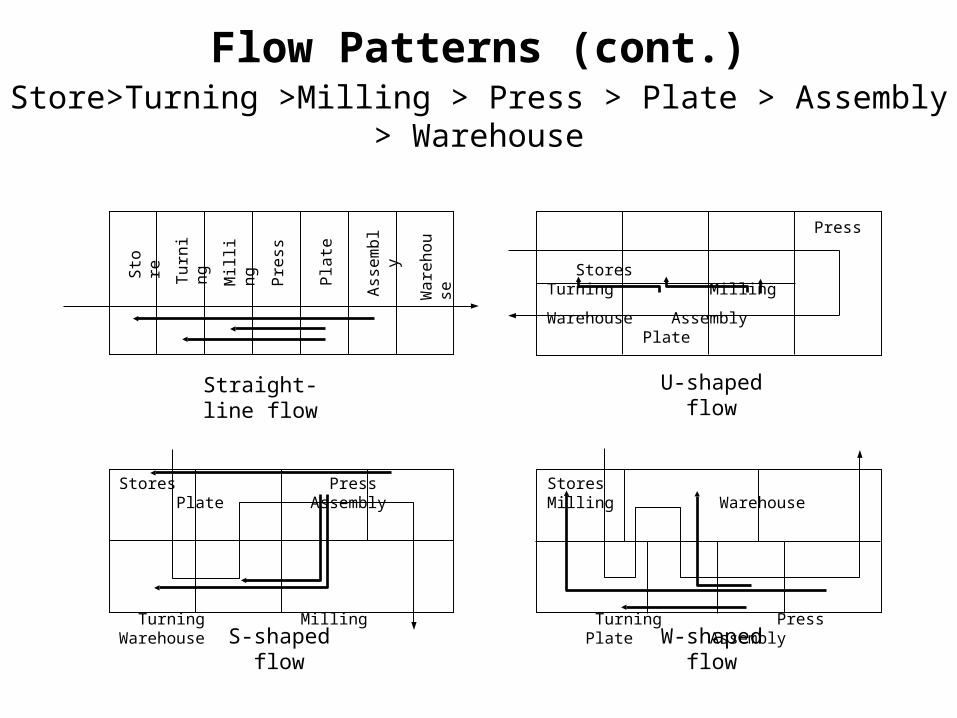
Flow Patterns (cont.)
Sto
re
Tur
ning
Mil
ling
Pre
ss
Pla
te
Ass
embl
y
War
ehou
se
Stores Turning Milling
Warehouse Assembly Plate
Press
Stores Press Plate Assembly
Turning Milling Warehouse
Stores Milling Warehouse
Turning Press Plate Assembly
Straight-line flow U-shaped flow
W-shaped flowS-shaped flow
Store>Turning >Milling > Press > Plate > Assembly > Warehouse
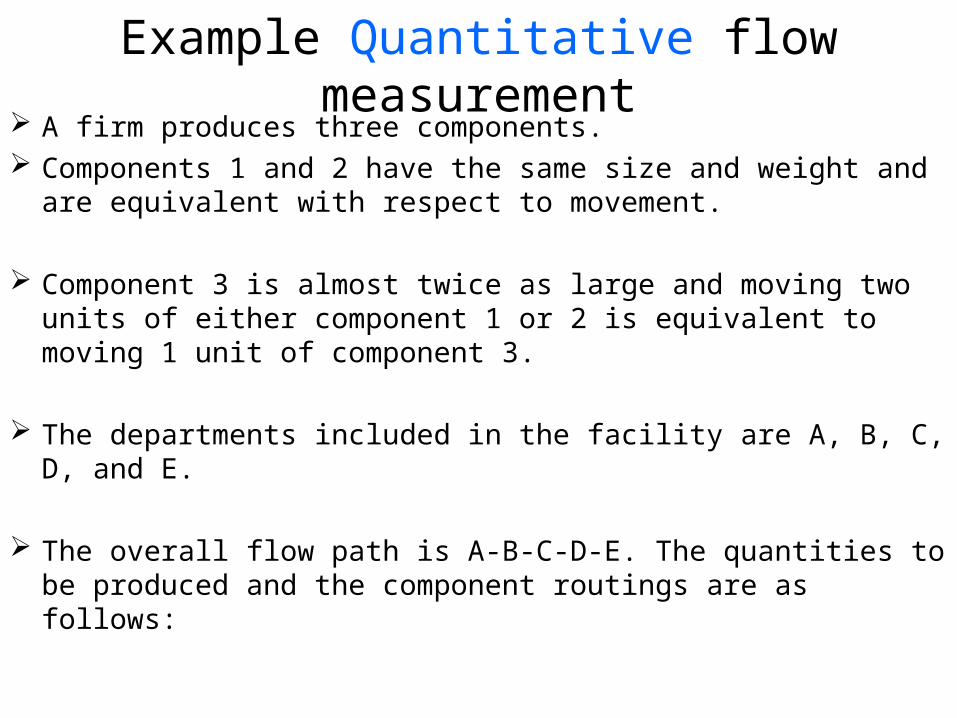
Example Quantitative flow measurement A firm produces three components. Components 1 and 2 have the same size and weight and are
equivalent with respect to movement.
Component 3 is almost twice as large and moving two units of either component 1 or 2 is equivalent to moving 1 unit of component 3.
The departments included in the facility are A, B, C, D, and E.
The overall flow path is A-B-C-D-E. The quantities to be produced and the component routings are as follows:
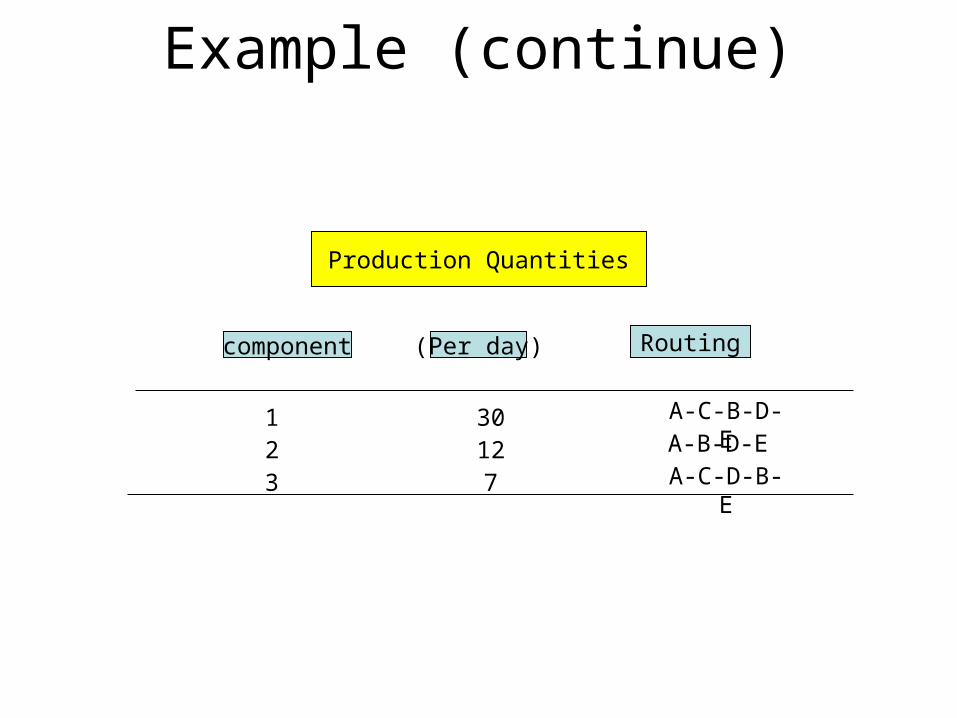
Production Quantities
component (Per day) Routing
123
30127
A-C-B-D-EA-B-D-EA-C-D-B-E
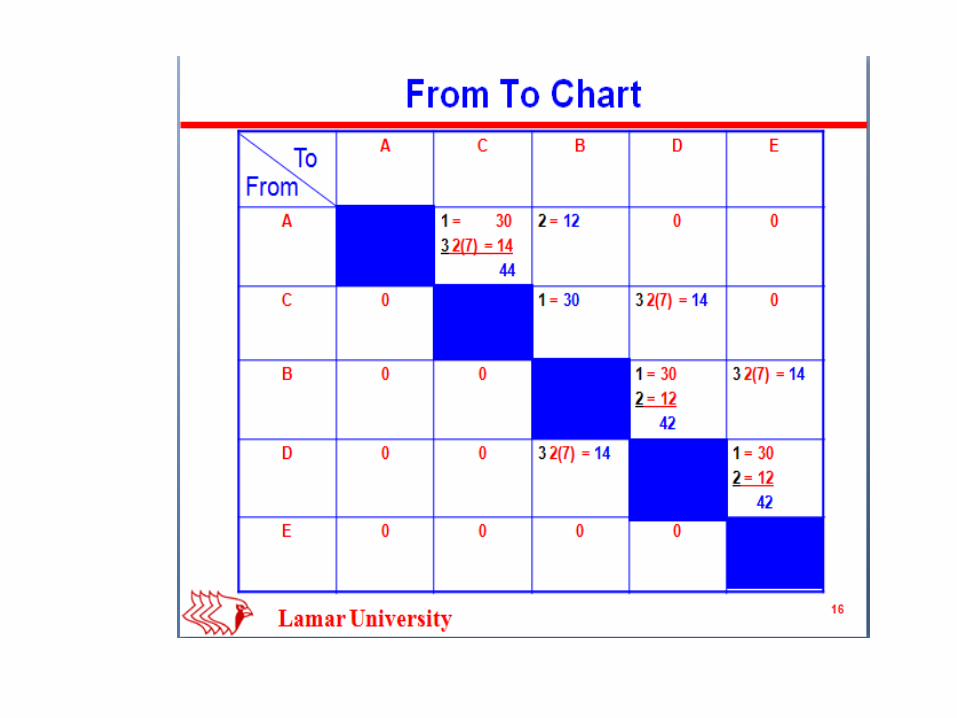
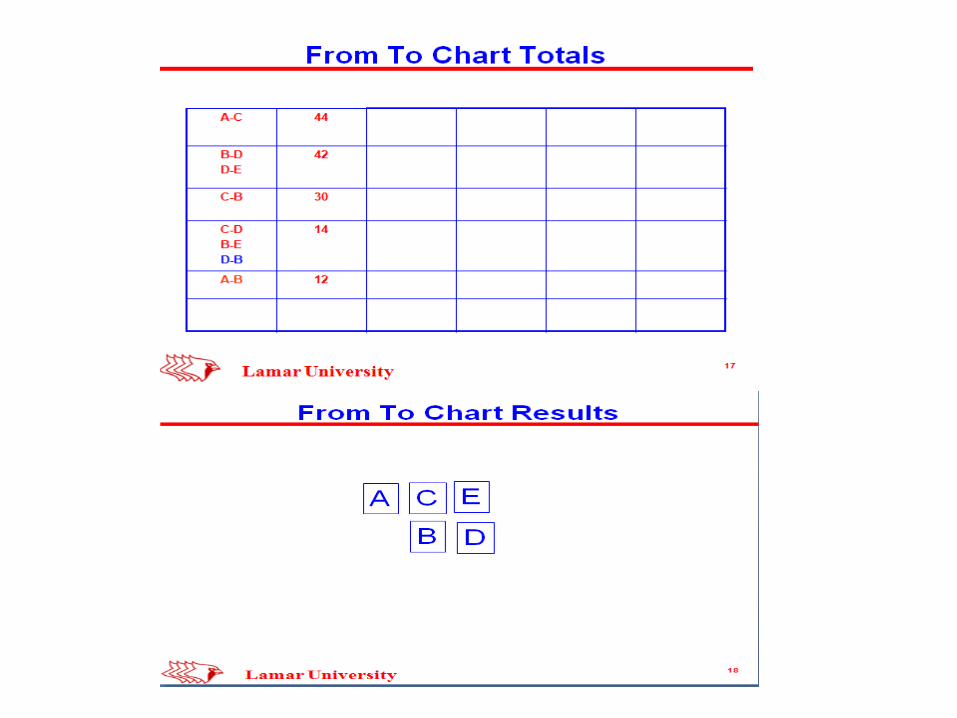
Example (continue)
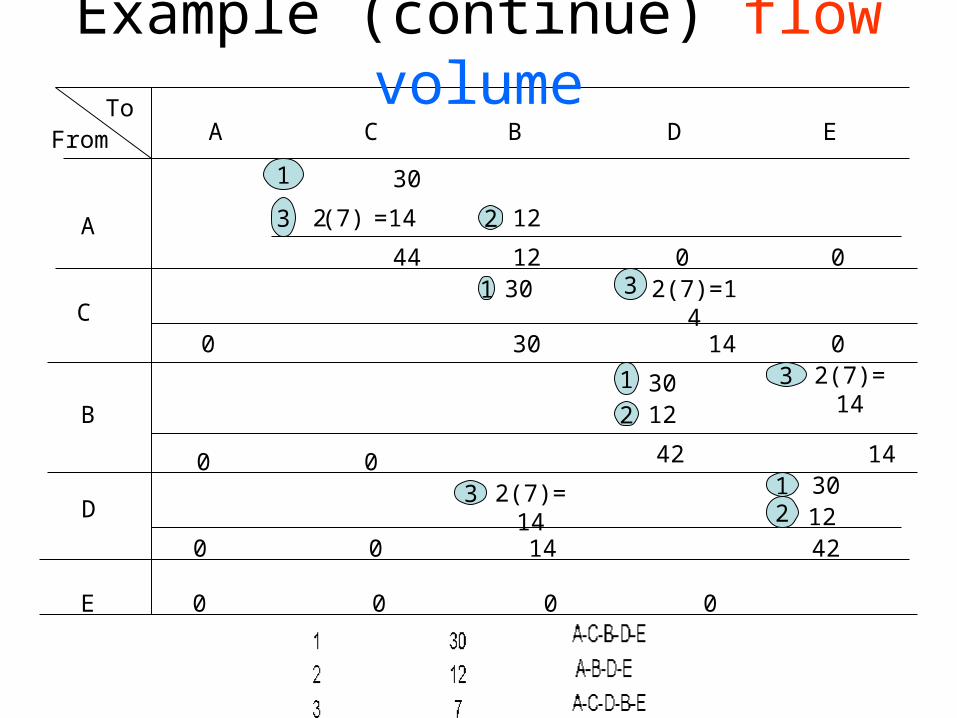
FromTo
A
C
B
D
E
A C B D E
1
3 2(7)
30
=14
44
122
121 30
30
3 2(7)=14
14
0 0
0 0
0 0
1 302 12
42
3 2(7)=14
14
0 0
2(7)=143
14
1 302 12
42
0 0 0 0
Example (continue) flow volume
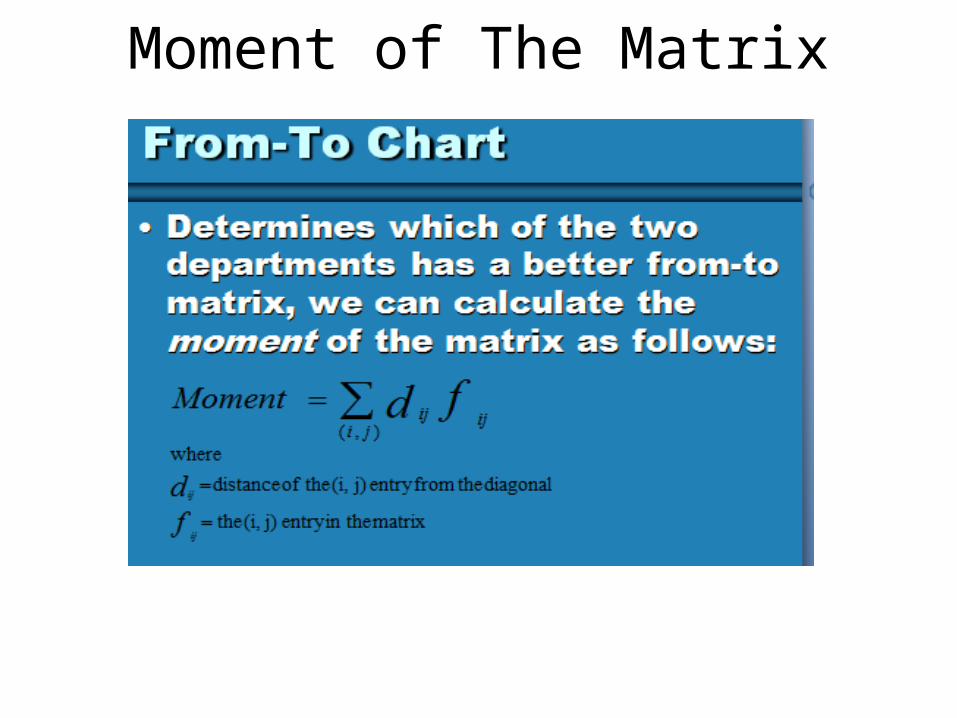
Moment of The Matrix
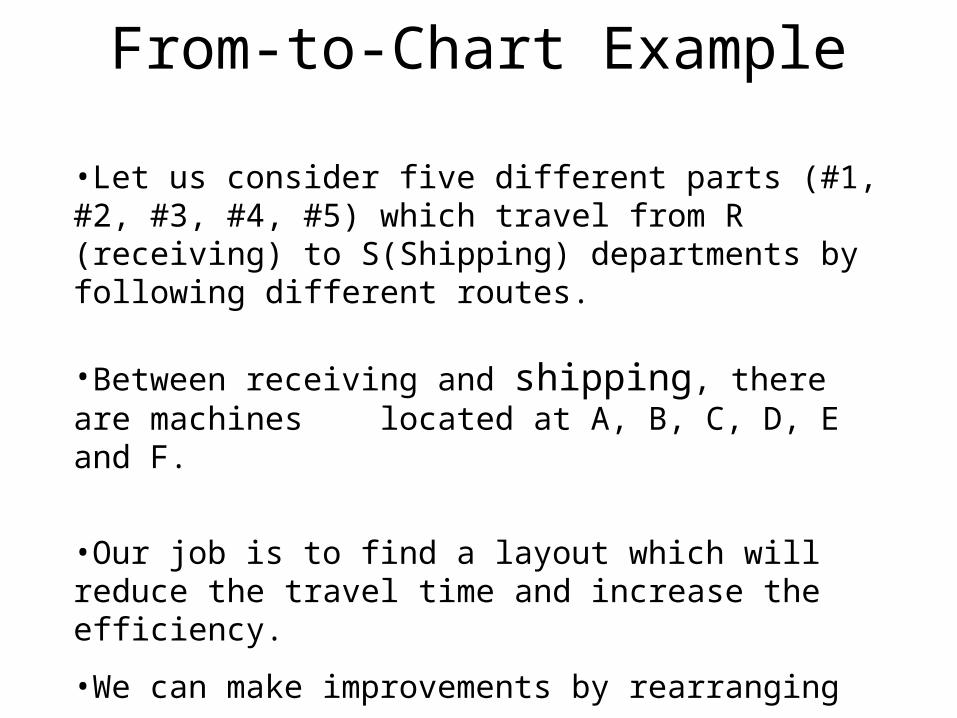
•Let us consider five different parts (#1, #2, #3, #4, #5) which travel from R (receiving) to S(Shipping) departments by following different routes.
•Between receiving and shipping, there are machines located at A, B, C, D, E and F.
•Our job is to find a layout which will reduce the travel time and increase the efficiency.
•We can make improvements by rearranging the flow.
From-to-Chart Example
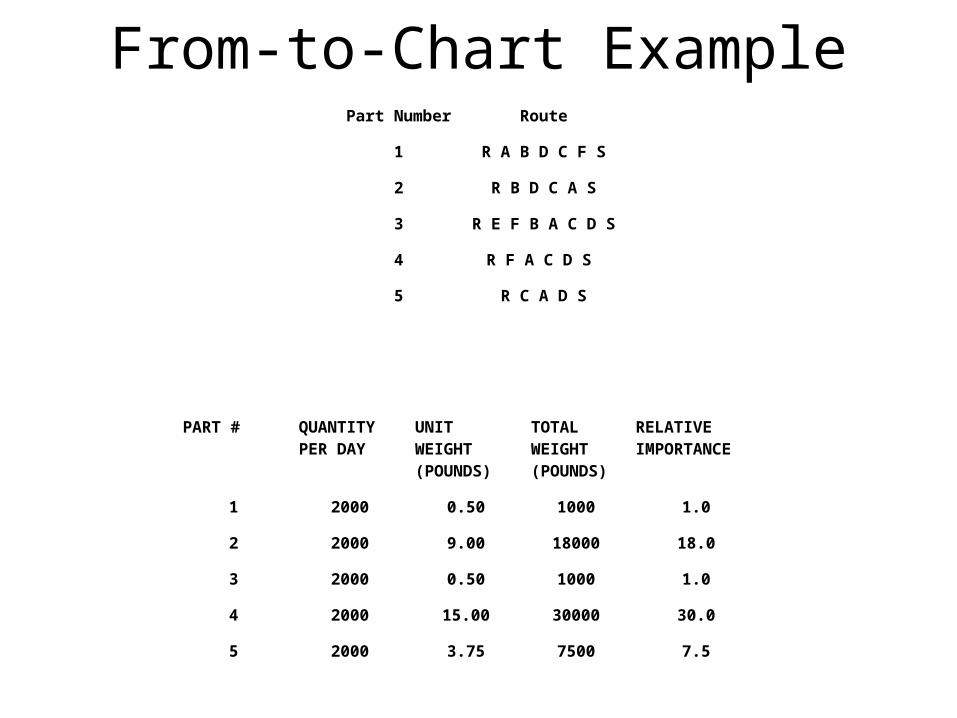
Part Number Route
1 R A B D C F S
2 R B D C A S
3 R E F B A C D S
4 R F A C D S
5 R C A D S
PART # QUANTITY PER DAY
UNIT WEIGHT (POUNDS)
TOTAL WEIGHT (POUNDS)
RELATIVE IMPORTANCE
1 2000 0.50 1000 1.0
2 2000 9.00 18000 18.0
3 2000 0.50 1000 1.0
4 2000 15.00 30000 30.0
5 2000 3.75 7500 7.5
From-to-Chart Example
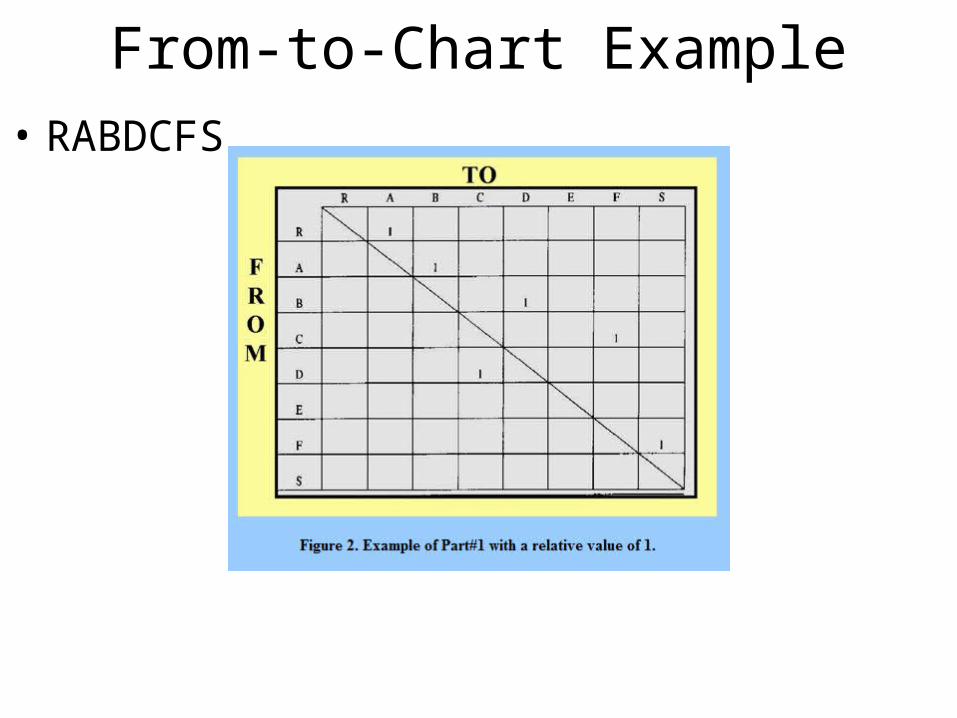
From-to-Chart Example• RABDCFS

R A B C D E F S TOTAL
R X 1 18 7.5 1 30 57.5
A X 1 1+30 7.5 18 57.5
B 1 X 1+18 20
C 18+7.5 X 1+30 1 57.5
D 1+18 X 1+30+7.5 57.5
E X 1 1
F 30 1 X 1 32
S X 283
From-to-Chart Example
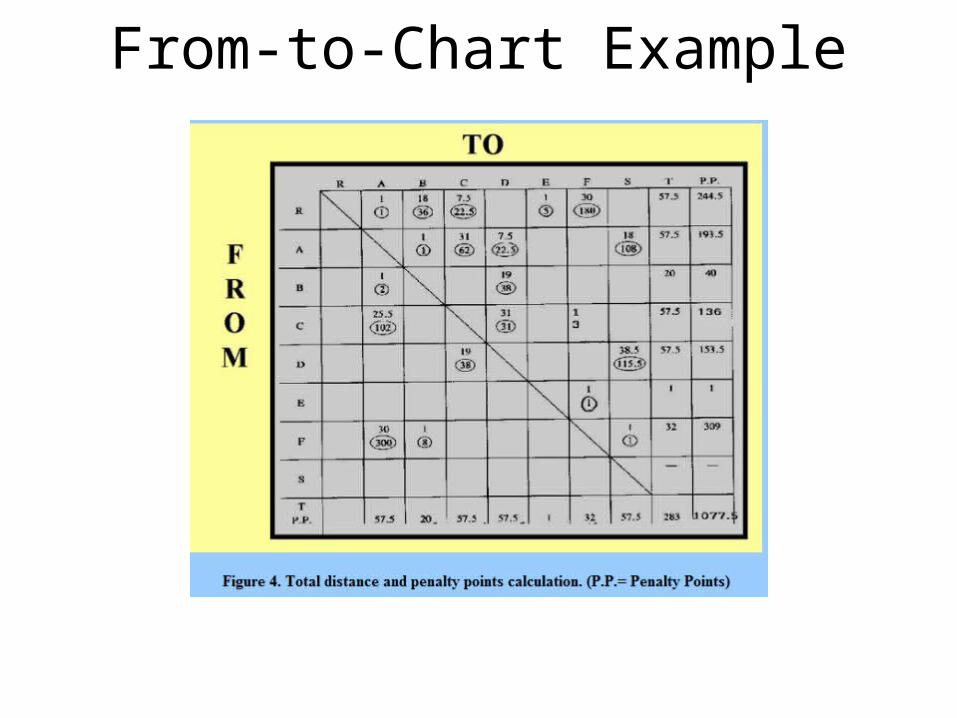
From-to-Chart Example
From-to-Chart Example• To evaluate this alternative, penalty points are assigned
to each move depending upon how far the move is away from the present location.
• For example, the move R to A is right next door, so we multiply that weight time 1 (one block).
• R to B is two blocks away, so we multiply the 18 in that block times two, three blocks away times three, and so on.
• The circled numbers are the penalty points. Below and to the left of the diagonal line indicates backtracking, so the penalty points are doubled.
• The efficiency of the layout -- R A B C D E F S -- is :• Efficiency = 283 / 1077.5 = 26 %
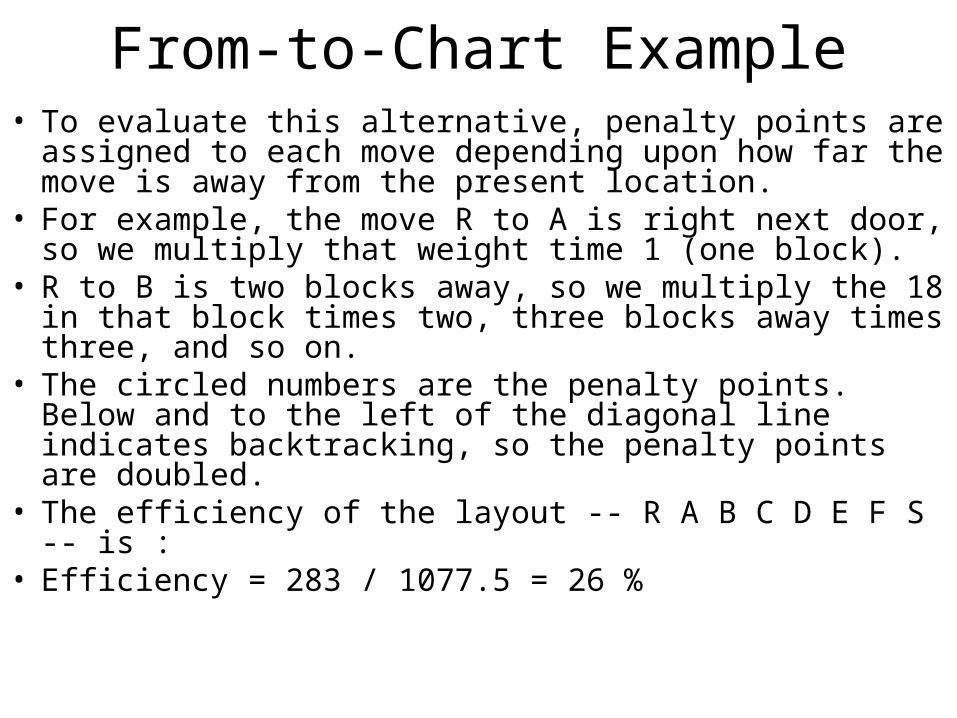
From-to-Chart Example• Now look for clues for improvement. • The highest penalty points are the best clues.• For example, form F to A has a penalty point of 300. • This means that F should be closer to R. • A new layout change of sequence will change both the
vertical and horizontal sequence. • An improved layout (REFBACDS) will give an
efficiency of:• Efficiency = 283 / 548 = 51.6 %• Draw the new layout
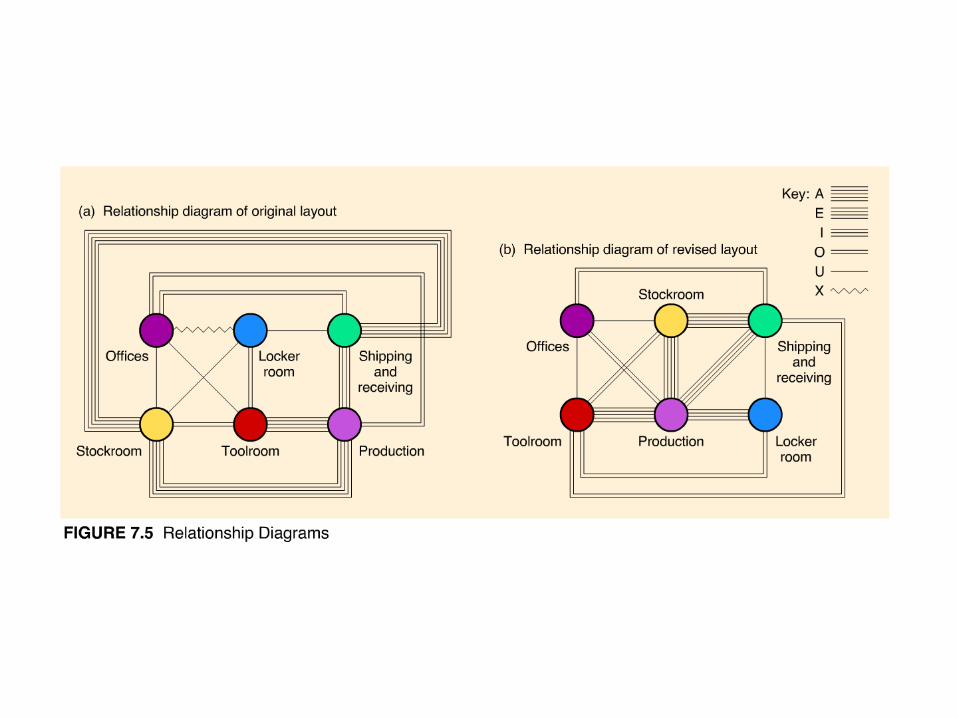
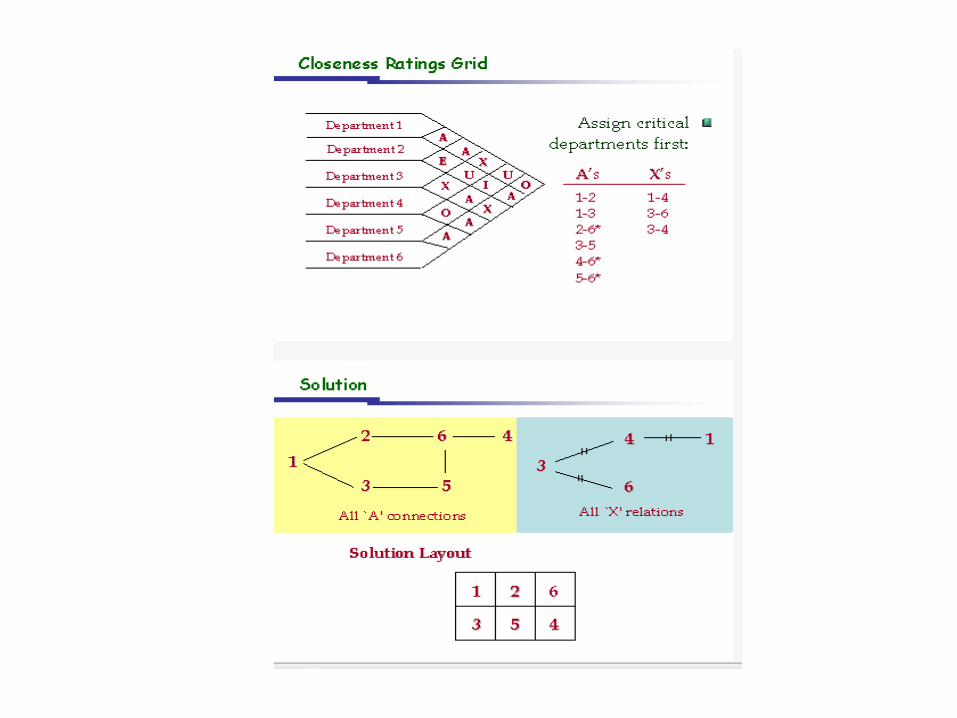
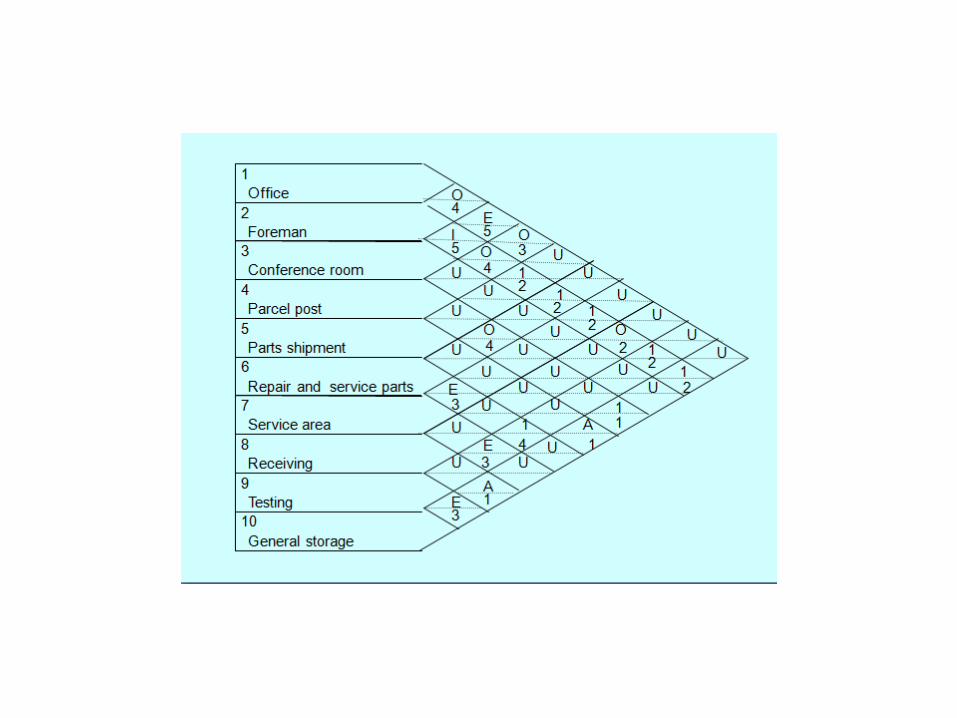
Relationship (REL) Chart
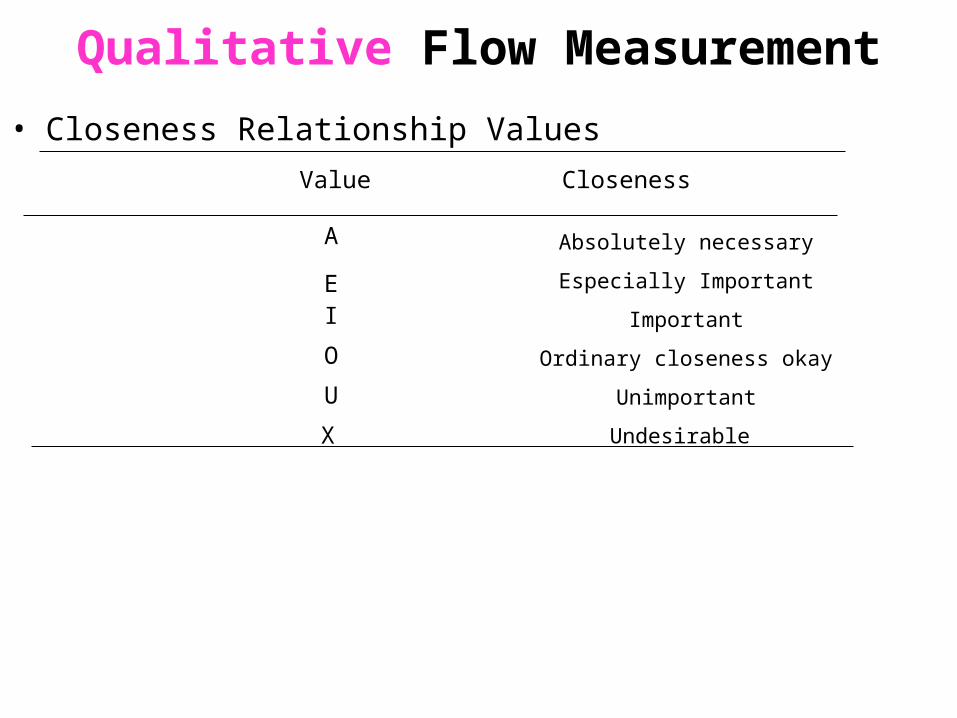
Qualitative Flow Measurement
• Closeness Relationship Values
Value Closeness
A
EI
O
U
X
Absolutely necessary
Especially Important
Important
Ordinary closeness okay
Unimportant
Undesirable
Qualitative Flow Measurement
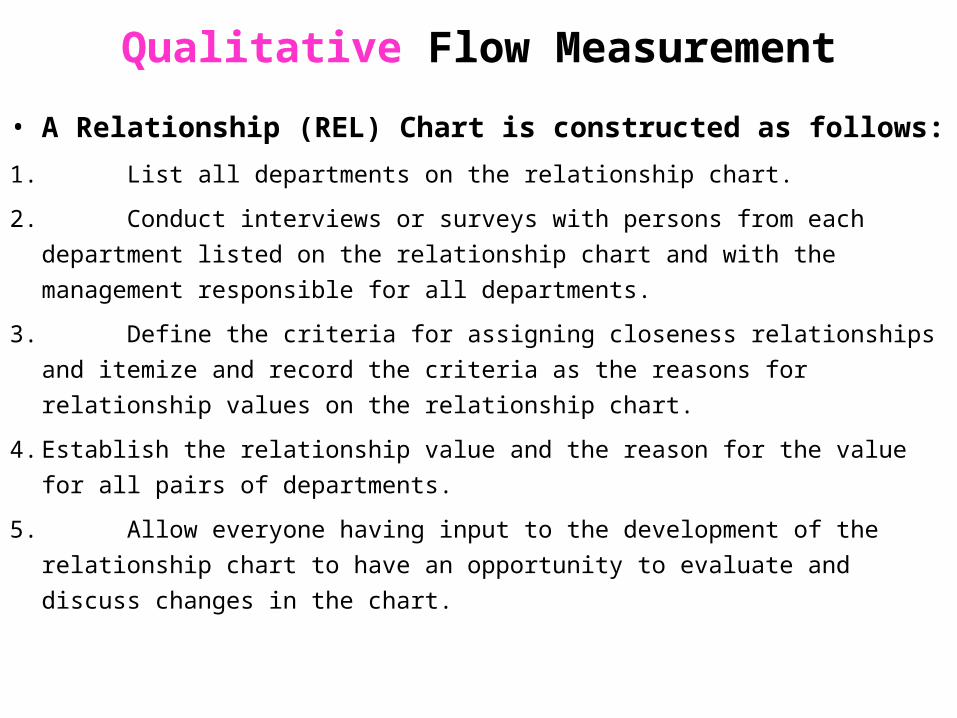
• A Relationship (REL) Chart is constructed as follows:
1. List all departments on the relationship chart.
2. Conduct interviews or surveys with persons from each department listed on
the relationship chart and with the management responsible for all
departments.
3. Define the criteria for assigning closeness relationships and itemize and
record the criteria as the reasons for relationship values on the relationship
chart.
4. Establish the relationship value and the reason for the value for all pairs of
departments.
5. Allow everyone having input to the development of the relationship chart to
have an opportunity to evaluate and discuss changes in the chart.
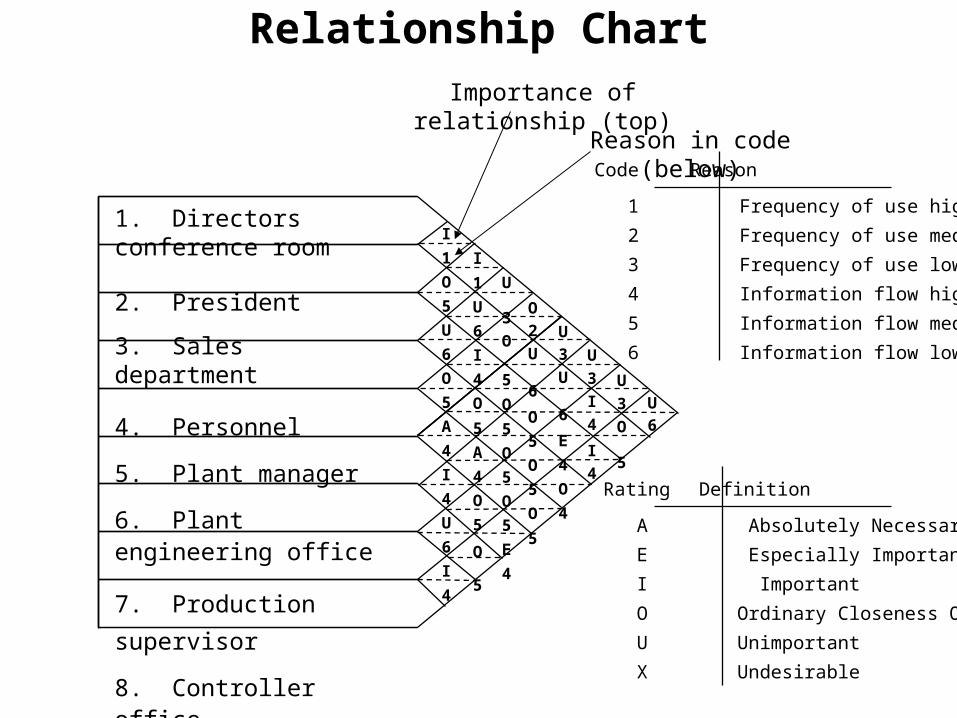
Relationship Chart
Code Reason
1 Frequency of use high
2 Frequency of use medium
3 Frequency of use low
4 Information flow high
5 Information flow medium
6 Information flow low
Rating Definition
A Absolutely Necessary
E Especially Important
I Important
O Ordinary Closeness OK
U Unimportant
X Undesirable
1. Directors conference room
2. President
3. Sales department
4. Personnel
5. Plant manager
6. Plant engineering office
7. Production supervisor
8. Controller office
9. Purchasing department
I
1
O
5
U
6
O
5
A
4
I
4
U
6
I
4
I
1
U
6
I
4
O
5
A
4
O
5
O
5
U
3
O
5
O
5
O
5
O
5
E
4
O
2
U
6
O
5
O
5
O
5
U
3
U
6
E
4
O
4
U
3
I
4
I
4
U
3
O
5
U
6
Importance of relationship (top)
Reason in code (below)
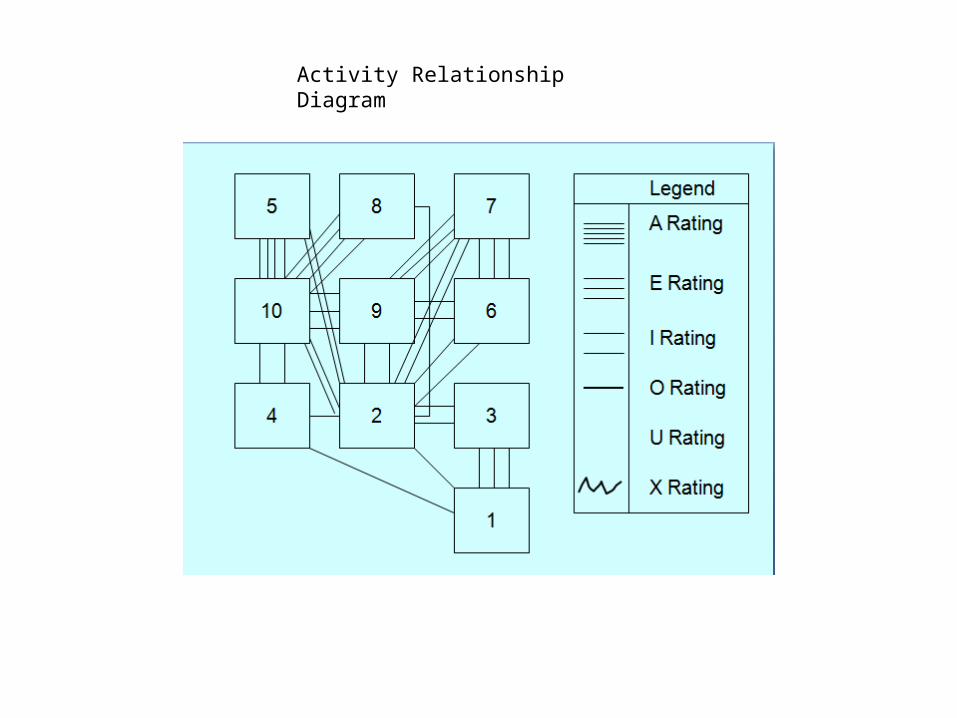
Activity Relationship Diagram