Building a Neighborhood-Specific Gazetteer for a Digital ...
21
See discussions, stats, and author profiles for this publication at: https://www.researchgate.net/publication/249731031 Building a Neighborhood-Specific Gazetteer for a Digital Archive Article · January 2002 CITATIONS 5 READS 18 3 authors, including: Christine S. Lam University of Southern California 7 PUBLICATIONS 86 CITATIONS SEE PROFILE John P Wilson University of Southern California 148 PUBLICATIONS 2,710 CITATIONS SEE PROFILE All in-text references underlined in blue are linked to publications on ResearchGate, letting you access and read them immediately. Available from: John P Wilson Retrieved on: 26 May 2016
Transcript of Building a Neighborhood-Specific Gazetteer for a Digital ...

Seediscussions,stats,andauthorprofilesforthispublicationat:https://www.researchgate.net/publication/249731031
BuildingaNeighborhood-SpecificGazetteerforaDigitalArchive
Article·January2002
CITATIONS
5
READS
18
3authors,including:
ChristineS.Lam
UniversityofSouthernCalifornia
7PUBLICATIONS86CITATIONS
SEEPROFILE
JohnPWilson
UniversityofSouthernCalifornia
148PUBLICATIONS2,710CITATIONS
SEEPROFILE
Allin-textreferencesunderlinedinbluearelinkedtopublicationsonResearchGate,
lettingyouaccessandreadthemimmediately.
Availablefrom:JohnPWilson
Retrievedon:26May2016

Building a Neighborhood-Specific Gazetteer for a Digital Archive
Christine S. Lam and John P. Wilson Department of Geography
University of Southern California Los Angeles, CA 90089-0255
and
Deborah A. Holmes-Wong
Information Service Division University of Southern California
Los Angeles, CA 90089-0251
Abstract. This paper presents the strategy used to build a gazetteer for the Los Angeles Digital Archive. The archive contains more than 250,000 objects in numerous formats, and a gazetteer is needed to (1) facilitate the specification of geographic footprints in the Dublin Core metadata records and (2) support the search for and retrieval of selected objects based on location, time, format and/ or keyword. The search and retrieval interface utilizes ArcIMS 4.0, and the neighborhood shapes specified in the gazetteer were generated from published map labels in ArcInfo 7.2.1. The gazetteer and advanced search capabilities are integral components of USC’s Next Generation Library Initiative.
1. Introduction
A group of scholars and librarians at the University of Southern California have been
working on a digital archive to represent, find, evaluate, and retrieve primary research materials
(i.e. objects) about the Los Angeles Region for the past six years. When completed, the Los
Angeles Digital Archive will constitute a substantial digital archive of primary research materials
about what today is the Los Angeles Metropolitan Area. The system aims to integrate radically
different information types rapidly through place, time, format, and keyword indexing. The
individual objects that currently comprise the archive have been catalogued using Qualified
Dublin Core for the metadata records (see http://dublincore.org/documents/2000/07/11/dcmes-
2
qualifiers for additional information about Dublin Core Qualifiers). The system is implemented
in Oracle 9i to take advantage of its XML capabilities.
The power of the Los Angeles Digital Archive (LADA) can be traced to the metadata that are
used to support searches based on place, time, format, and keyword. Place here refers to the
geographic footprint (e.g. the area covered by an aerial photograph). Time refers to the temporal
footprint (e.g. the date on which a building was photographed). The format refers to the method
used to represent individual items. The eight DCM1 types – collection, dataset, event, image,
interactive resource, service, software, sound and text – and an additional type for geospatial
materials are currently supported (see http://dublincore.org/documents/2000/07/11/dcmi-type-
vocabulary for additional information about the DCM1 Type Vocabulary). All items are part of
larger collections (e.g. strip maps are part of the Automobile Club of Southern California
collection) and can be retrieved by collection name as well.
The vision for LADA was first laid out and implemented as a part of the "ISLA-Information
System Los Angeles" prototype that was developed by Philip Ethington, Li Hunt, and colleagues
at USC (see Hunt and Ethington (1997) for details). ISLA was conceived as a web-based,
distributed system that would allow separate institutions to contribute to a regional meta-
collection without surrendering their digital assets. This concept would allow individual
institutions to ingest content on their own servers and to set access parameters for the global user
community. Library patrons would have perceived a single collection that in reality would have
been composed of several separately held databases integrated through ISLA and they would
have been able to access (i.e. download) a given object only to the extent that the owner of that
collection was willing to make such objects available given this design.

3
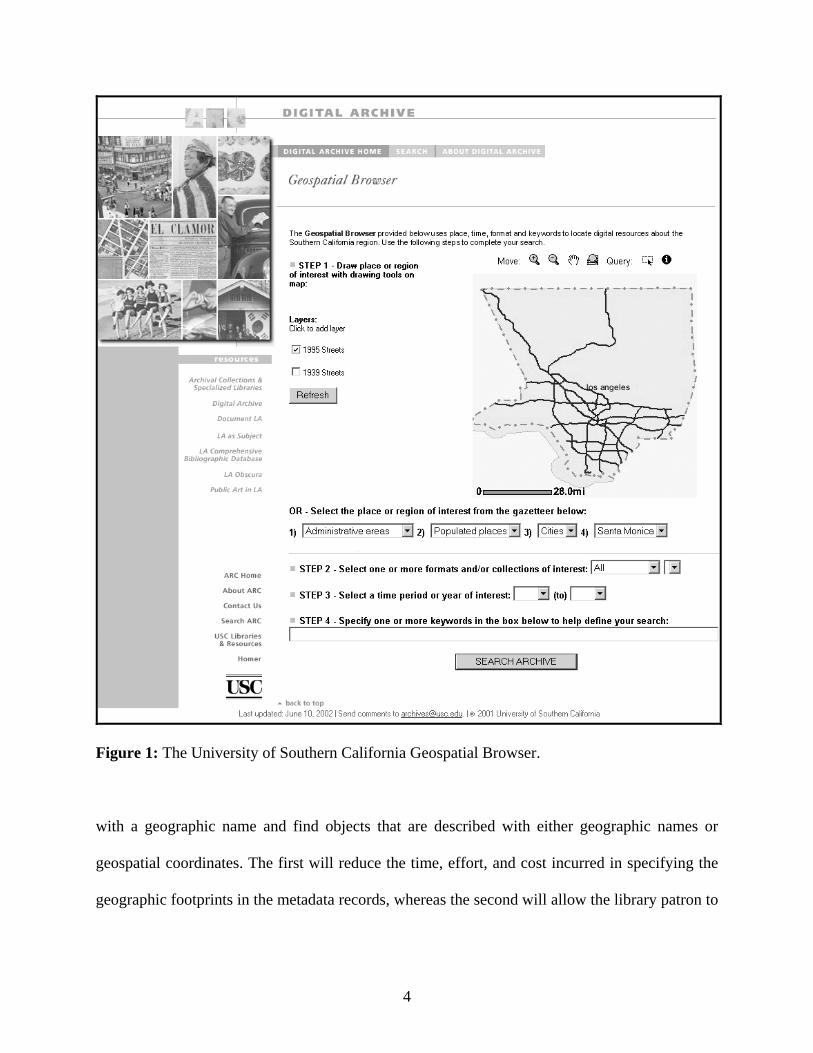
The system now under construction implements this vision and will provide scholars and
students immediate access to a large number and variety of primary materials focused on
Southern California. The new system has an ArcIMS-based client interface and a backend
supported by ArcSDE, Oracle 9i, and XML. The browser will offer the library patron a web-
based query form with an interactive map that can be used to delineate the places or locations of
interest and a series of pull down menus that can be used to specify the time periods, formats,
collections, and keywords of interest (Figure 1). The system will also incorporate a gazetteer or
list of geographic names that can be used in place of and/ or with the interactive map display to
specify places of interest. Several frames will also be provided for the display of the search
results. The first of these frames will provide a brief description of the selected items and a
thumbnail image of the object if it was saved as an image file or geospatial dataset. From there,
the user will be able to click on the metadata summary to obtain the Dublin Core metadata
description for the selected objects or they can pick the selected objects and download copies of
them to their personal computers or workspaces. For objects like census information that are
stored as geospatial datasets, the library patron will be able to construct and download one or
more thematic maps that they construct on the fly as well as the geospatial data sets themselves.
This paper focuses on the development of the gazetteer service and a gazetteer database for
the Los Angeles Region. The service and accompanying database will provide a bridge between
the vernacular place names and other terms that we use to talk about this region and other parts
of the world and the formal spatial referencing systems that are used by computers (Goodchild
1999). This linkage serves two purposes: (1) it will allow archivists and other data providers to
specify geographic names instead of geospatial coordinates for the geographic footprints that are
saved as a part of the Dublin Core metadata records; and (2) it will allow library patrons to start
4
Figure 1: The University of Southern California Geospatial Browser.
with a geographic name and find objects that are described with either geographic names or
geospatial coordinates. The first will reduce the time, effort, and cost incurred in specifying the
geographic footprints in the metadata records, whereas the second will allow the library patron to

5
send a query to the gazetteer database to obtain the geographic location which can then be used
as a spatial query to find the relevant objects and/ or metadata records.
The remainder of the paper is divided into four sections. The next section describes some of
the challenges and problems encountered in building these gazetteer components, and the results
of some recent work that may offer a way forward. The third section describes the methods and
data sources used to add neighborhood names and shapes to our Los Angeles gazetteer and the
fourth section describes some of the strengths and shortcomings of the resulting gazetteer items
that were produced. The final section offers some conclusions and ideas for future work.
2. Previous Work
The Alexandria Digital Library at the University of California-Santa Barbara, launched in 1994,
developed several components that have been important in the conceptualization and building of
distributed and geographically referenced digital map and image libraries (see
http://www.alexandria.ucsb.edu for additional details).
The initial version of the ADL gazetteer was constructed by extracting the name, location,
and type of selected entries from two online gazetteers maintained by the U.S. federal
government covering the United States and its territories (the U.S. Geological Survey’s
Geographic Names Information System; see http://www-nmd.usgs.gov/www/gnis for further
details) and the remainder of the world (the National Imagery and Mapping Agency’s GeoNames
Server; see http://www.nima.mil/gns/html for further details) (Hill and Zheng 1999). These
sources contain over 6 million names but their use demonstrates a high level, top-down approach
and means that the library patron was not likely to find gazetteer entries for small regions and
counties due to the scope of the sources. However, the initial experience of building this
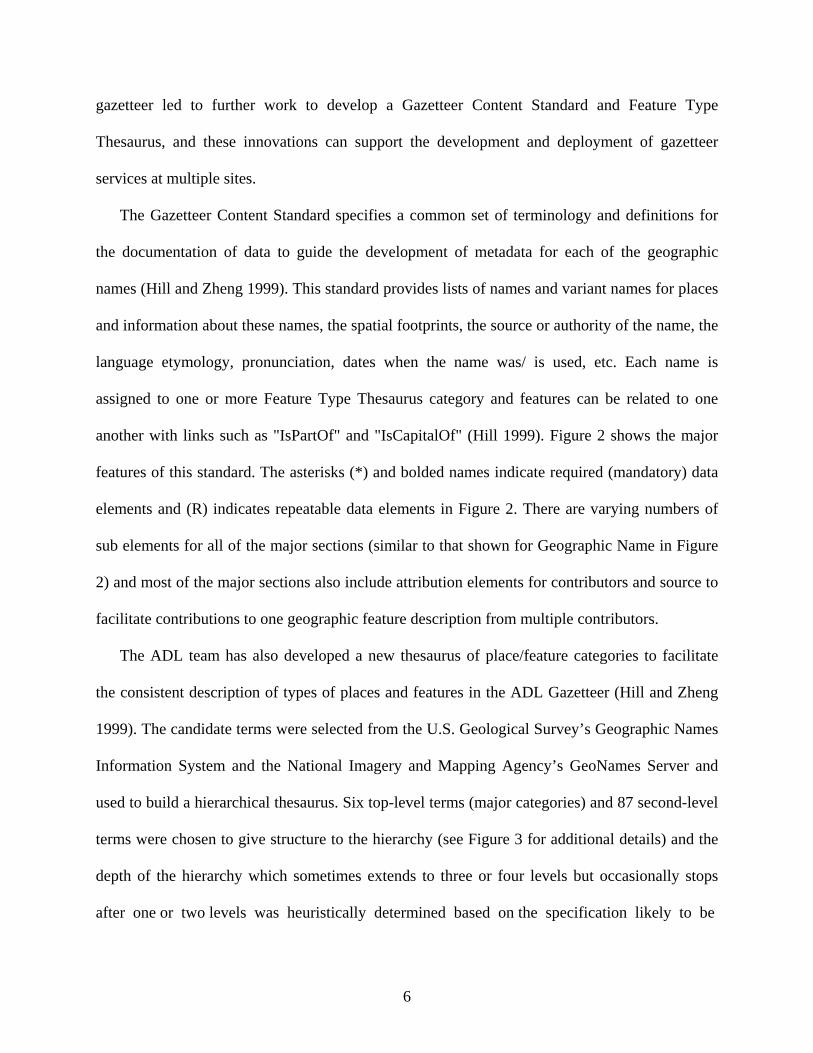
6
gazetteer led to further work to develop a Gazetteer Content Standard and Feature Type
Thesaurus, and these innovations can support the development and deployment of gazetteer
services at multiple sites.
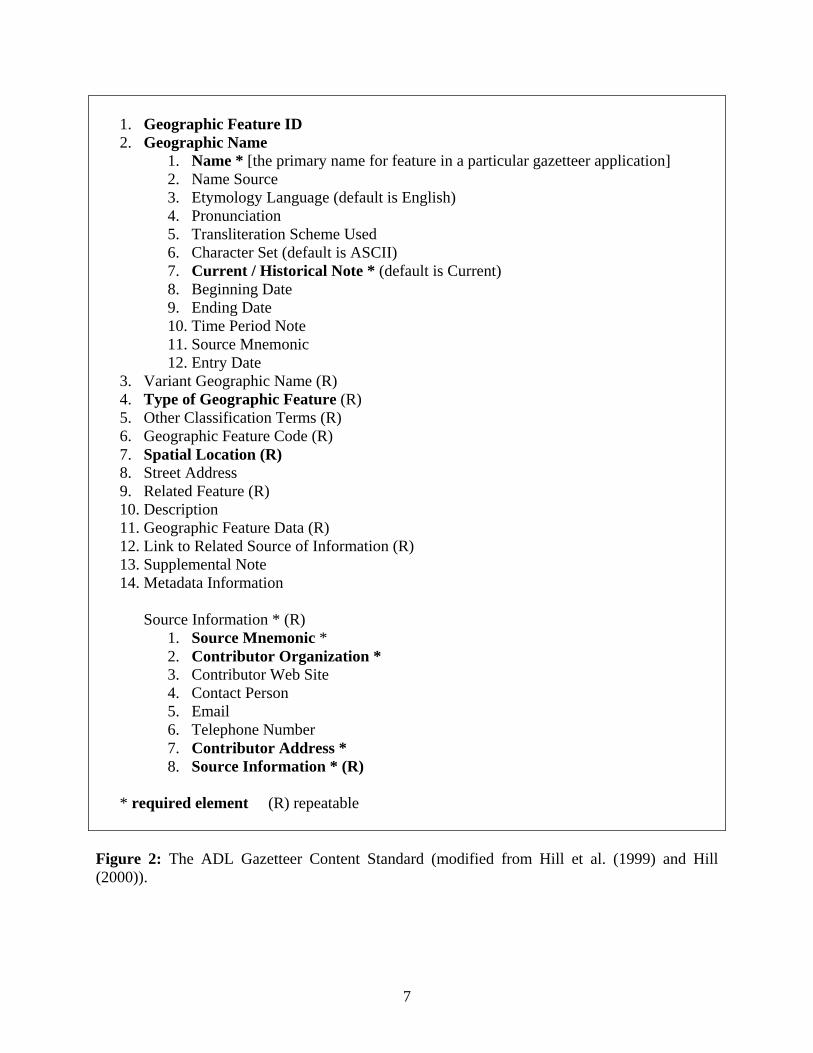
The Gazetteer Content Standard specifies a common set of terminology and definitions for
the documentation of data to guide the development of metadata for each of the geographic
names (Hill and Zheng 1999). This standard provides lists of names and variant names for places
and information about these names, the spatial footprints, the source or authority of the name, the
language etymology, pronunciation, dates when the name was/ is used, etc. Each name is
assigned to one or more Feature Type Thesaurus category and features can be related to one
another with links such as "IsPartOf" and "IsCapitalOf" (Hill 1999). Figure 2 shows the major
features of this standard. The asterisks (*) and bolded names indicate required (mandatory) data
elements and (R) indicates repeatable data elements in Figure 2. There are varying numbers of
sub elements for all of the major sections (similar to that shown for Geographic Name in Figure
2) and most of the major sections also include attribution elements for contributors and source to
facilitate contributions to one geographic feature description from multiple contributors.
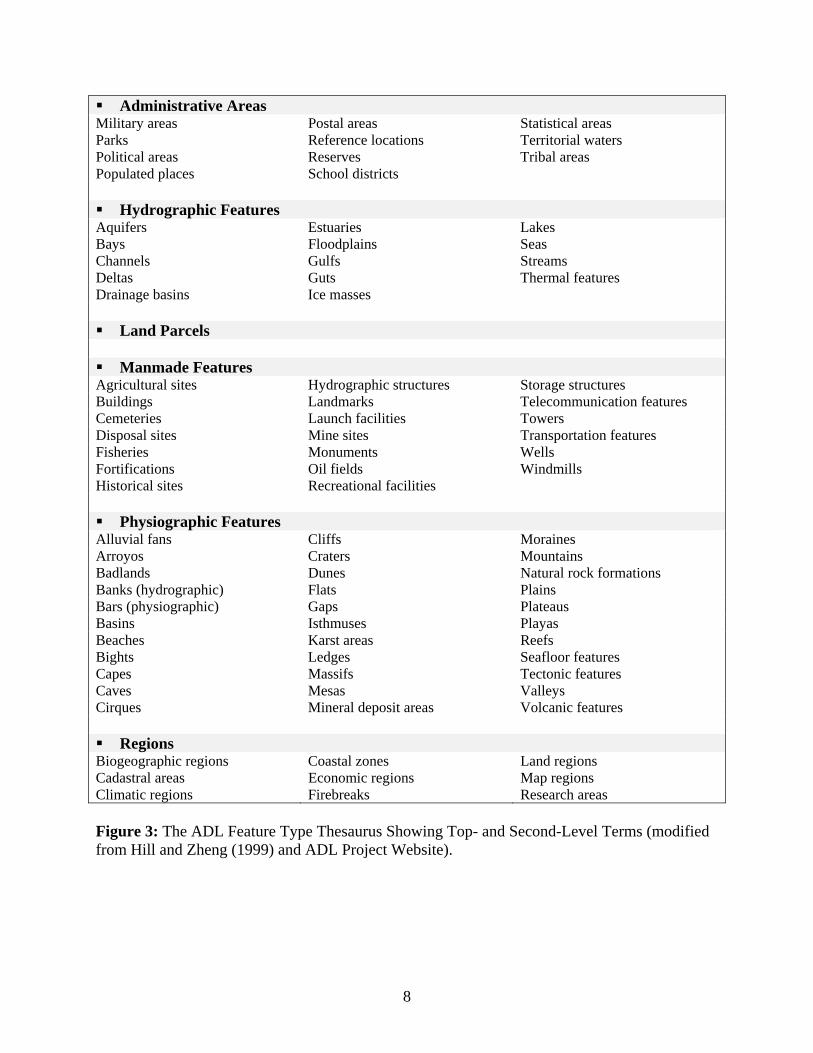
The ADL team has also developed a new thesaurus of place/feature categories to facilitate
the consistent description of types of places and features in the ADL Gazetteer (Hill and Zheng
1999). The candidate terms were selected from the U.S. Geological Survey’s Geographic Names
Information System and the National Imagery and Mapping Agency’s GeoNames Server and
used to build a hierarchical thesaurus. Six top-level terms (major categories) and 87 second-level
terms were chosen to give structure to the hierarchy (see Figure 3 for additional details) and the
depth of the hierarchy which sometimes extends to three or four levels but occasionally stops
after one or two levels was heuristically determined based on the specification likely to be
7
1. Geographic Feature ID 2. Geographic Name
1. Name * [the primary name for feature in a particular gazetteer application] 2. Name Source 3. Etymology Language (default is English) 4. Pronunciation 5. Transliteration Scheme Used 6. Character Set (default is ASCII) 7. Current / Historical Note * (default is Current) 8. Beginning Date 9. Ending Date 10. Time Period Note 11. Source Mnemonic 12. Entry Date
3. Variant Geographic Name (R) 4. Type of Geographic Feature (R) 5. Other Classification Terms (R) 6. Geographic Feature Code (R) 7. Spatial Location (R) 8. Street Address 9. Related Feature (R) 10. Description 11. Geographic Feature Data (R) 12. Link to Related Source of Information (R) 13. Supplemental Note 14. Metadata Information
Source Information * (R)
1. Source Mnemonic * 2. Contributor Organization * 3. Contributor Web Site 4. Contact Person 5. Email 6. Telephone Number 7. Contributor Address * 8. Source Information * (R)
* required element (R) repeatable
Figure 2: The ADL Gazetteer Content Standard (modified from Hill et al. (1999) and Hill (2000)).
8
Administrative Areas Military areas Postal areas Statistical areas Parks Reference locations Territorial waters Political areas Reserves Tribal areas Populated places School districts Hydrographic Features
Aquifers Estuaries Lakes Bays Floodplains Seas Channels Gulfs Streams Deltas Guts Thermal features Drainage basins Ice masses Land Parcels
Manmade Features
Agricultural sites Hydrographic structures Storage structures Buildings Landmarks Telecommunication features Cemeteries Launch facilities Towers Disposal sites Mine sites Transportation features Fisheries Monuments Wells Fortifications Oil fields Windmills Historical sites Recreational facilities Physiographic Features
Alluvial fans Cliffs Moraines Arroyos Craters Mountains Badlands Dunes Natural rock formations Banks (hydrographic) Flats Plains Bars (physiographic) Gaps Plateaus Basins Isthmuses Playas Beaches Karst areas Reefs Bights Ledges Seafloor features Capes Massifs Tectonic features Caves Mesas Valleys Cirques Mineral deposit areas Volcanic features Regions
Biogeographic regions Coastal zones Land regions Cadastral areas Economic regions Map regions Climatic regions Firebreaks Research areas
Figure 3: The ADL Feature Type Thesaurus Showing Top- and Second-Level Terms (modified from Hill and Zheng (1999) and ADL Project Website).

9
needed by ADL. The Feature Type Thesaurus, which includes broad term/narrow term
relationships, synonymous terms, and related terms, is an evolving document that can be
modified by adding additional term variants and making changes to the structure and preferred
terms as necessary (Hill and Zheng 1999). The current version of this thesaurus has close to a 5:1
ratio of lead-in vocabulary to preferred terms (209 preferred terms and 978 lead-in terms) and it
bridges the various typing terminologies incorporated in six online gazetteers (see Hill (2000) for
additional details).
The need to specify spatial footprints for the geographic names is perhaps the most expensive
and difficult task in building gazetteers for specific regions or places. The pre-ADL gazetteers
and gazetteer-like services often represented the spatial footprints as points, whereas digital
libraries require spatial footprints that specify the spatial extent as polygons and/or bounding
rectangles and not just as point locations to facilitate search and retrieval of generated content
(Harpring 1997a,b; U.S. Geological Survey 1998). Two characteristics contribute to the
difficulty of this task. The first is the fact that many natural and man-made features have fuzzy or
indeterminate boundaries – see Burrough and Frank (1996) for an extended discussion of this
phenomenon. This problem is often compounded by a second one – the tendency for the
geographic footprint representing the location of a named place or feature to take on multiple
representations depending on the type of representation method used (points, bounding box, line,
polygon, grid cell, etc.), source, resolution (scale, level of generalization, etc.), and time period
(given that the extents of some features will change over time).
Hill (2000) also noted these problems and pointed to the multitude of sources and
technologies (i.e. existing gazetteers, GIS datasets, research publications, GPS measurements,
etc.) that might be used to find and/ or generate spatial footprints. The challenge is two-fold:

10
there is a need to select one or more appropriate footprints for each specific place and there
needs to be a way to record multiple representations with specific entries in the Gazetteer
Content Standard (realizing that the character and extents of many places in southern California
have changed tremendously during the past 200 years). Fortunately, the second need was
anticipated and an effective solution is incorporated in the design of the ADL Gazetteer Content
Standard (see Figures 2 and 4 for details).
7. Spatial Location (R)
2. Detailed Spatial Geometry Representation (R) [set of points; dependent on system capabilities and requirements; can represent set of non-contiguous areas]
1. Detailed Spatial Geometry Representation* {point, bounding box, linear, complex object}
2. Number of Points* 3. Points Order* 4. (Longitude, Latitude)* 5. Current/Historical Note* (default is Current) 6. Beginning Date 7. Ending Date 8. Time Period Note 9. Measurement Date, Beginning Date 10. Measurement Date, Ending Date 11. Method of Measurement 12. Accuracy of Measurement 13. Source Mnemonic 14. Entry Date
* required element (R) repeatable
Figure 4: Specification of location in ADL Gazetteer Content Standard (from Hill (2000)).
Turning to the first need, Hill (2000) advocated using a "satisficing" criterion to select spatial
footprints for digital gazetteers. Modeled after the law of diminishing returns as expressed by

11
Simon (1979), this approach means that we do not seek out optimal solutions (i.e. the most
precise and detailed footprints) because the costs are too high and we instead focus on solutions
that are satisfactory given the cost. Hill (2000) used two examples – the choice of bounding
boxes over detailed polygons and the level of detail (i.e. number of vertices) used to describe the
polygon boundary in the latter case – to illustrate this approach. However, the ramifications
extend further than both of these examples and include the choice of representation method
(point, bounding box, linear, complex object, etc.) and the sources and/ or methods used to
generate the spatial footprints.
Alani et al. (2001), for example, recently proposed the Dynamic Spatial Approximation
Method (DSAM) for estimating spatial footprints from the locations of point sites that lie inside
or outside some region of interest. The DSAM is based on Voronoi diagrams in which the
polygons represent the space closest to the associated point relative to all other points. This
method can be used to infer spatial relations between regions in the absence of digitized
boundaries: the resulting approximations provide measures of areal extent and can be used to
evaluate spatial relationships such as distance, direction, and spatial adjacency. The Thiessen
polygons that are identified with DSAM might also be used to facilitate the search for and
retrieval of geocoded objects in a digital library, although we found that the results from using
this approach were very sensitive to geographic variations in the character and density of the
build environment from our work in Los Angeles County.
3. Methods and Data Sources Many authors have described the historical evolution of Los Angeles’ social landscape and
highlighted its demographic transition from a small frontier town to a metropolis and world city

12
(e.g. Hise 1997, Fulton 2001). The metropolitan area now spills over the borders of Los Angeles
County into neighboring Ventura, San Bernardino, Riverside, and Orange Counties and the built-
up areas in many of the individual cities have coalesced to form one large contiguous urban area.
Several books and articles describe the emergent spatial patterns that have produced a series of
very distinctive neighborhoods and identified the historical processes that led to their production
(e.g. Allen and Turner 1997, Modarres 1998). These neighborhoods are important in people’s
everyday lives and for navigating our way around this large metropolitan area, and there are
processes now underway to use them to mobilize community participation in planning and
decision-making (e.g. Talen 1999).
Given these developments, we chose cities and neighborhoods as the basic feature types for
building a Los Angeles County gazetteer. Cities are straightforward because their inception dates
are well known and their boundaries are captured in numerous GIS datasets. The fuzzy and
impressive nature of neighborhoods, in contrast, causes many difficulties and pointed to the need
to find a creative "satisficing" solution for this feature type. The new method described below
incorporated three tasks – building a point theme in ArcView 3.2, measuring the proximity
between adjacent pairs of points, and generating circular shaped footprints (i.e. polygons) in
ArcInfo 7.2.1 for specific neighborhoods. The data sources and GIS operations invoked for these
tasks are described in the subsections that follow.
3.1. Building the Point Theme
A point theme was constructed in ArcView 3.2 using the neighborhoods listed in the 2001 Los
Angeles County Street Guide and Directory (Thomas Bros 2001). These popular books, which
are updated annually, show city boundaries, freeways, streets, and other major landmarks. The

13
labels identifying the 88 cities and 218 neighborhoods recorded in the 2001 Los Angeles County
Street Guide and Directory are printed in blue and a larger font size is used to distinguish city
from neighborhood labels. In addition, some neighborhoods appear more than once because their
names are printed on more than one page.
Street and highway layers acquired from Geographic Data Technology, Inc. were added to a
new view and used along with the "heads-up" digitizing tools in ArcView 3.2 to add point
features to the neighborhood point theme. The neighborhood labels in the Thomas Guide were
treated as neighborhood centroids and used to guide the locations of the point features. Mean x, y
coordinates were calculated by hand and used for neighborhoods with two or more labels in the
2001 Los Angeles County Street Guide and Directory.
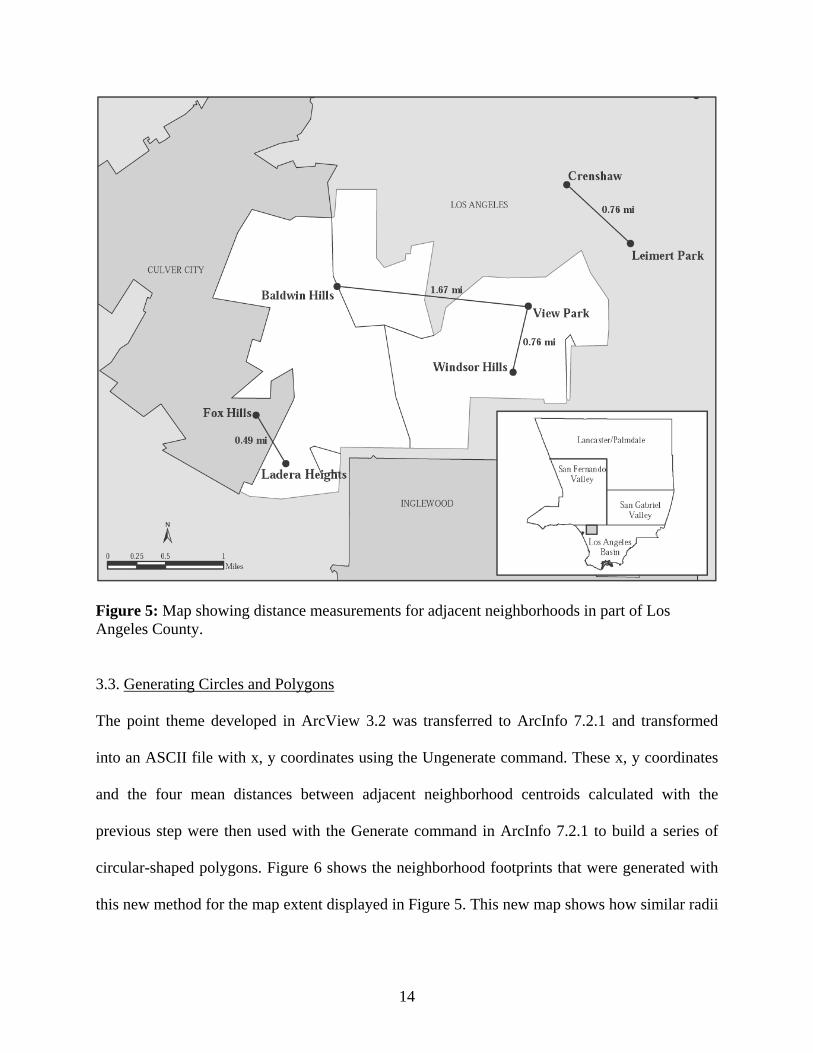
3.2. Proximity Measurements
The distances between each of the digitized points and the closest neighboring points were
measured next with the distance measurement tool in ArcView 3.2. The distances between these
points varied substantially (Figure 5), although they were generally shorter in densely populated
areas and larger in the northern half of the county. Los Angeles County was therefore divided
into four regions – Lancaster/Palmdale, the San Fernando Valley, San Gabriel Valley, and the
Los Angeles Basin – and mean distances between adjacent pairs of neighborhoods were
calculated and used to build circular polygons in each of these regions (Figure 5).
14
Figure 5: Map showing distance measurements for adjacent neighborhoods in part of Los Angeles County.
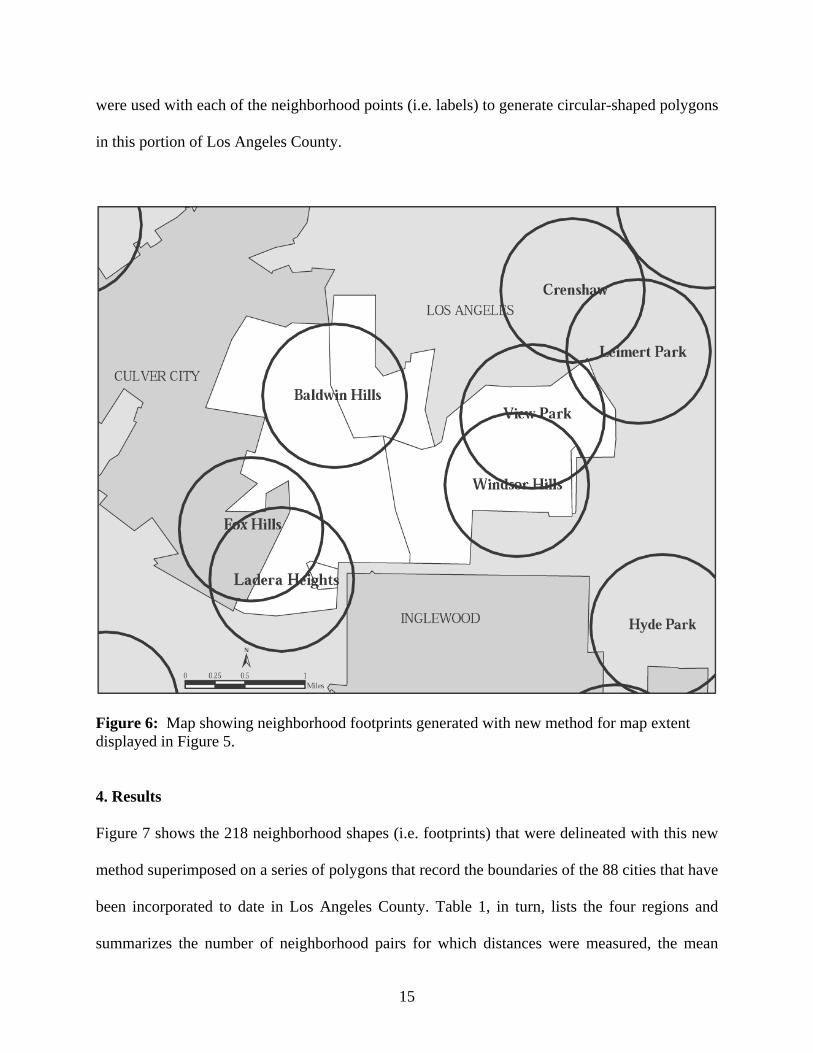
3.3. Generating Circles and Polygons The point theme developed in ArcView 3.2 was transferred to ArcInfo 7.2.1 and transformed
into an ASCII file with x, y coordinates using the Ungenerate command. These x, y coordinates
and the four mean distances between adjacent neighborhood centroids calculated with the
previous step were then used with the Generate command in ArcInfo 7.2.1 to build a series of
circular-shaped polygons. Figure 6 shows the neighborhood footprints that were generated with
this new method for the map extent displayed in Figure 5. This new map shows how similar radii
15
were used with each of the neighborhood points (i.e. labels) to generate circular-shaped polygons
in this portion of Los Angeles County.
Figure 6: Map showing neighborhood footprints generated with new method for map extent displayed in Figure 5.
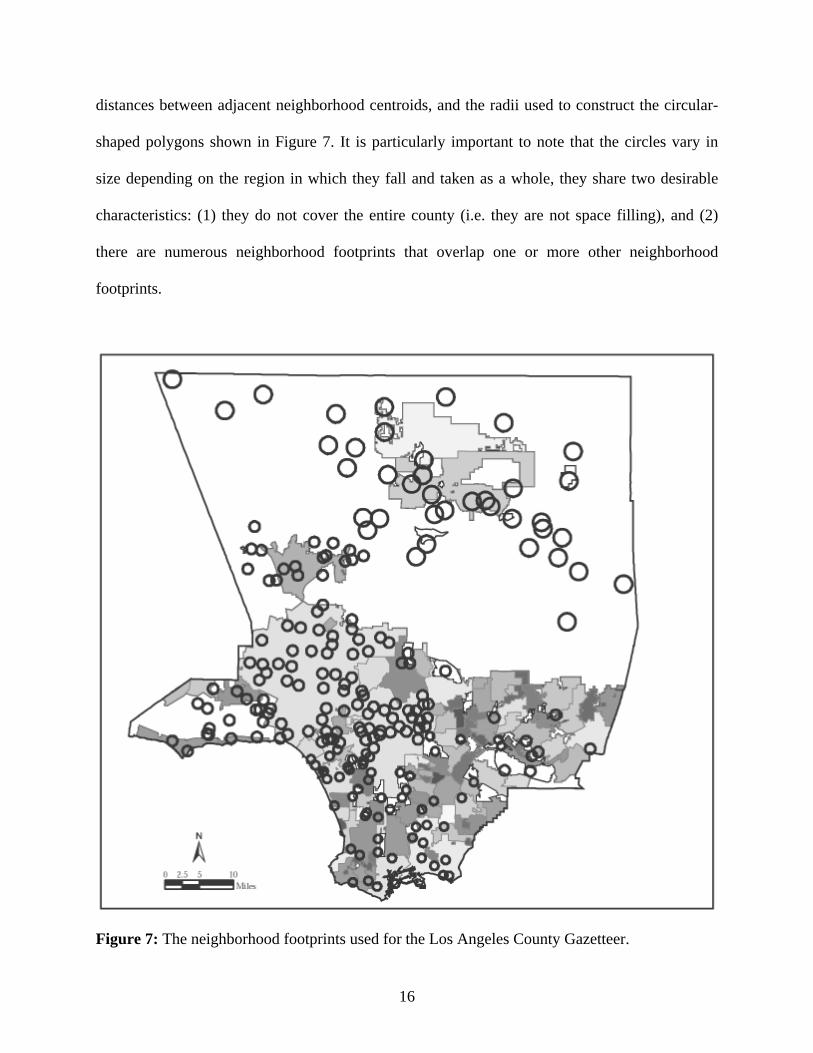
4. Results Figure 7 shows the 218 neighborhood shapes (i.e. footprints) that were delineated with this new
method superimposed on a series of polygons that record the boundaries of the 88 cities that have
been incorporated to date in Los Angeles County. Table 1, in turn, lists the four regions and
summarizes the number of neighborhood pairs for which distances were measured, the mean
16
distances between adjacent neighborhood centroids, and the radii used to construct the circular-
shaped polygons shown in Figure 7. It is particularly important to note that the circles vary in
size depending on the region in which they fall and taken as a whole, they share two desirable
characteristics: (1) they do not cover the entire county (i.e. they are not space filling), and (2)
there are numerous neighborhood footprints that overlap one or more other neighborhood
footprints.
Figure 7: The neighborhood footprints used for the Los Angeles County Gazetteer.

17
Table 1: Final distance measurements used to generate neighborhood footprints.
Regions (as shown in Figure 5)
Number of neighborhood pair
measurements
Mean distance between adjacent
pairs (miles)
Radius used to construct circles
(miles) Lancaster/Palmdale 14 1.24 1.25 San Fernando Valley 76 0.76 0.75 San Bernardino Valley 8 0.77 0.75 Los Angeles Basin 48 0.62 0.60
The first characteristic noted above (i.e. that the neighborhood shapes do not cover the entire
county) is desirable because there are many unpopulated areas in the northern half of the county
and in the Santa Monica and San Gabriel Mountains. Hence, there is no reason to extend the
neighborhood boundaries to fill the entire land area in these parts of the county (as would happen
with the Thiessen polygons constructed with the method of Alani et al. (2001) for example). In
addition, the reliance on the mean distances recorded in Table 1 to construct the circular-shaped
polygons shown in Figure 7 meant that there was no need to delineate the built-up area(s)
throughout the county – which would constitute another difficult, time-consuming, and
expensive task that would need to be repeated at regular intervals to capture the changes in urban
boundaries throughout the county.
The second characteristic noted above (i.e. the overlapping neighborhood footprints) is also
desirable because the boundaries are inherently fuzzy and there are numerous societal actors and
trends that will tend to keep them imprecise. Real estate agents and residents living next to more
affluent neighborhoods and/ or areas that are perceived to be more desirable and/or affluent may
want to extend the boundaries of these adjacent neighborhoods to include their properties for
example. Figure 6, for example, shows six areas of the county that might be assigned to two or
more neighborhoods at different times with the method described in this paper. Fox Hills spills
over into Ladera Heights (and vice versa), Windsor Hills spills over into View Park (and vice
18
versa), View Park spills over into Crenshaw and/ or Leimert Park and vice versa in this portion
of Los Angeles County for example. The white areas in Figures 5 and 6 show unincorporated
parts of the county that are completely surrounded by one or more cities. Overall, there are 86
instances where some part of the county is assigned to two or more neighborhoods in Figure 7.
5. Conclusions
The new method presented in this paper used the distances between pairs of nearest
neighborhoods to generate circular-shaped neighborhood footprints for inclusion in a Los
Angeles Gazetteer. The results show that this method produces neighborhood shapes with
several desirable characteristics given the imprecision inherent in neighborhood characteristics
and boundaries. In addition, this new method is cheap, reproducible, and extendable. The
circular-shaped footprints recorded in Figure 7 were generated using simple GIS tools and a
published street map guide as input. The method is reproducible given that others could utilize
this same method with the same data sources and generate the same results. The method is
extendable in the sense that others could use it with equivalent data to generate neighborhood
shapes in other metropolitan areas (e.g. Houston, Texas).
Some further refinements of this method may be needed to specify how these shapes have
changed over time. Thomas Guides for Los Angeles County have been published for over 75
years and they may be able to be used with the current method to develop neighborhood
footprints for earlier years as well. However, some additional knowledge of the extent of the
built-up area may be needed to help delimit the neighborhood shapes in these earlier years and
this would increase both the cost and complexity of using these types of methods to build local
gazetteers like the Los Angeles County Gazetteer envisaged here.

19
6. References
Alani H, Jones C B, and Tudhope D (2001) Voronoi-based region approximation for geographical information retrieval with gazetteers. International Journal of Geographical Information Science 15: 287-306 Allen J P and Turner E (1997) The Ethnic Quilt: Population Diversity in Southern California. Northridge, CA: The Center for Geographical Studies, California State University Burrough P A and Frank A U (1996) Geographic Objects with Indeterminate Boundaries. London, Taylor and Francis Fulton W (2001) The Reluctant Metropolis. Baltimore, MD: The John Hopkins University Press Goodchild M F (1999) The future of the gazetteer. WWW document, http://www. alexandria.ucsb.edu/~lhill/DGIE_website/perspectives/brandt.htm Harpring P (1997a) The limits of the world: Theoretical and practical issues in the construction of the Getty Thesaurus of Geographic Names. In Proceedings of the Fourth International Conference on Hypermedia and Interactivity in Museums (ICHIM ’97), Archives and Museum Informatics, Le Louvre, Paris: 237-251 Harpring P (1997b) Proper words in proper places: The thesaurus of geographic names. MDA Information 2: 5-12 Hill L L (1999) Gazetteer and collection-level metadata developments. In Kaser R T and Kaser V C (ed.) Metadiversity: The Grand Challenge for Biodiversity Information Management through Metadata. Reston, VA: U.S. Geological Survey, Biological Resources Division: 141-145 Hill L L and Zheng Q (1999) Indirect geospatial referencing through place names in the digital library: Alexandria Digital Library experience with developing and implementing gazetteers. In Proceedings of the Sixty-second Annual Meeting of the American Society for Information Science, 31 October-4 November 1999, Washington, D.C.: 57-69 Hill L L, Frew J, and Zheng Q (1999) Geographic names: The implementation of a gazetteer in a georeferenced digital library. WWW document, http://www.dlib.org/dlib/january99/hill/ 01hill.html Hill L L (2000) Core elements of digital gazetteers: Placenames, categories, and footprints. In Borbinha J and Baker T (ed.) Research and Advanced Technology for Digital Libraries. Berlin, Springer: 280-290 Hise G (1997) Magnetic Los Angeles: Planning the Twentieth Century Metropolis. Baltimore, MD: The John Hopkins University Press

20
Hunt L and Ethington P E (1997) The utility of spatial and temporal organization in digital library construction. Journal of Academic Librarianship 23: 475-483 Modarres A (1998) Putting Los Angeles in its place. Cities 15: 135-147 Simon H (1979) Rational decision making in business organizations. American Economic Review 69: 493-513 Talen, E (1999) Sense of community and neighborhood form: An assessment of the social doctrine of New Urbanism. Urban Studies 36: 1361-1379 Thomas Bros (2001) The Los Angeles County Street Guide and Directory. Irvine, CA: Thomas Bros Maps United States Geological Survey (1998) Geographic Names Information Systems (GNIS). WWW document, http://mapping.usgs.gov/www/gnis