BOSS/BAO/RSD - Data Repository: Martin Whitemwhite.berkeley.edu/Talks/IAP14_BOSS_BAO_RSD.pdf ·...
42
BOSS/BAO/RSD Martin White University of California, Berkeley Lawrence Berkeley National Laboratory
Transcript of BOSS/BAO/RSD - Data Repository: Martin Whitemwhite.berkeley.edu/Talks/IAP14_BOSS_BAO_RSD.pdf ·...

BOSS/BAO/RSD
Martin White University of California, Berkeley
Lawrence Berkeley National Laboratory

Redshi' Survey
Non-‐Gaussianity?
What is the expansion rate history of the Universe?
How does structure form within this background?
Other non-‐cosmology science e.g. galaxy formaEon & evoluEon
BAO
Redshi'-‐Space
Understanding AcceleraEon & tesEng GR.
Information from galaxy z-surveys
BOSS
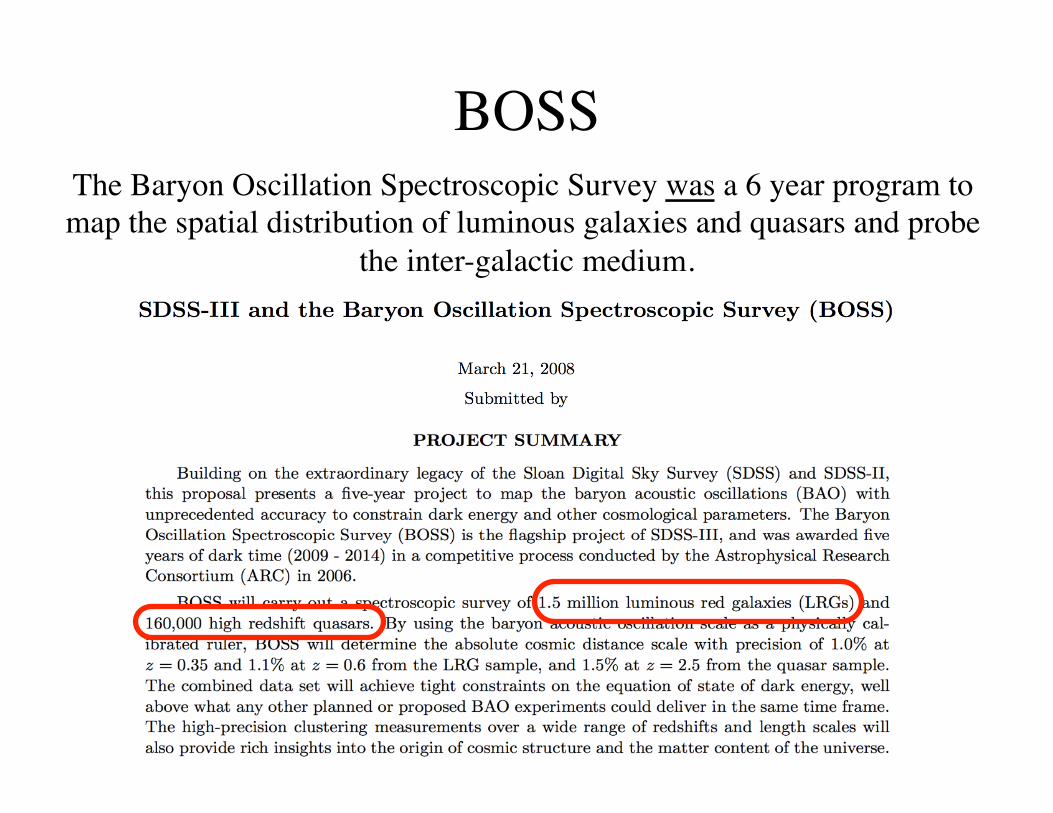
BOSSThe Baryon Oscillation Spectroscopic Survey was a 6 year program to map the spatial distribution of luminous galaxies and quasars and probe
the inter-galactic medium.
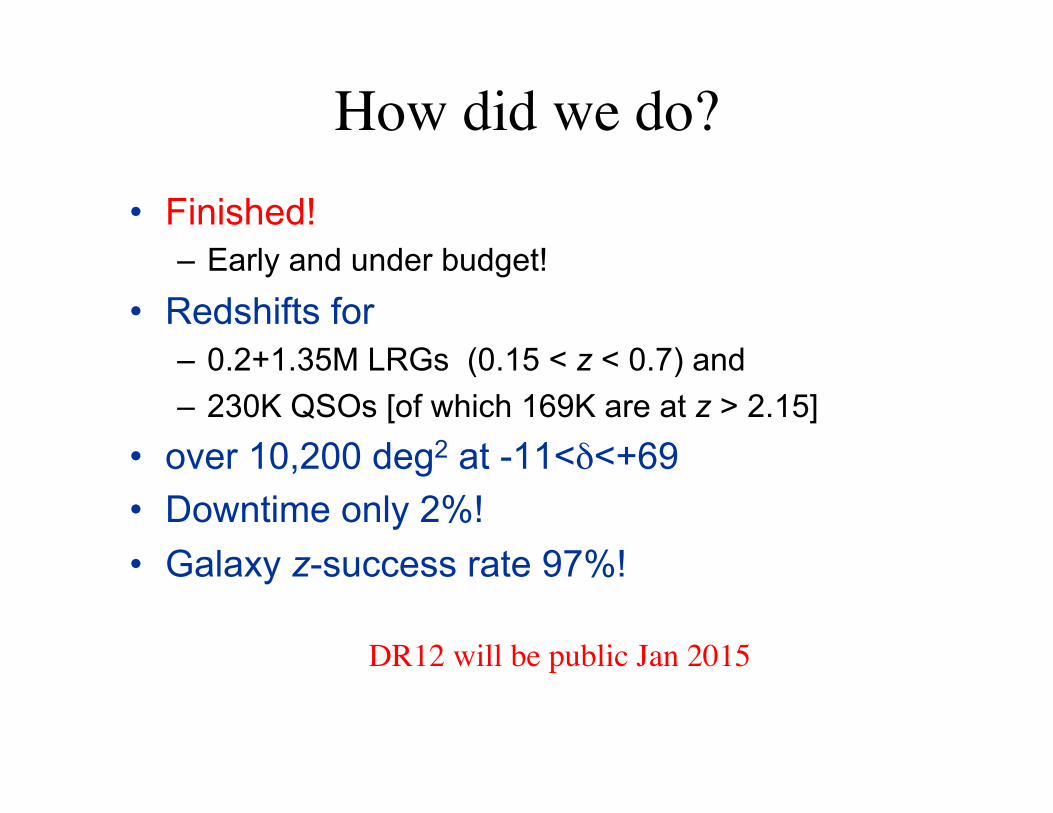
How did we do?• Finished!
– Early and under budget!
• Redshifts for – 0.2+1.35M LRGs (0.15 < z < 0.7) and – 230K QSOs [of which 169K are at z > 2.15]
• over 10,200 deg2 at -11<δ<+69 • Downtime only 2%! • Galaxy z-success rate 97%!
DR12 will be public Jan 2015
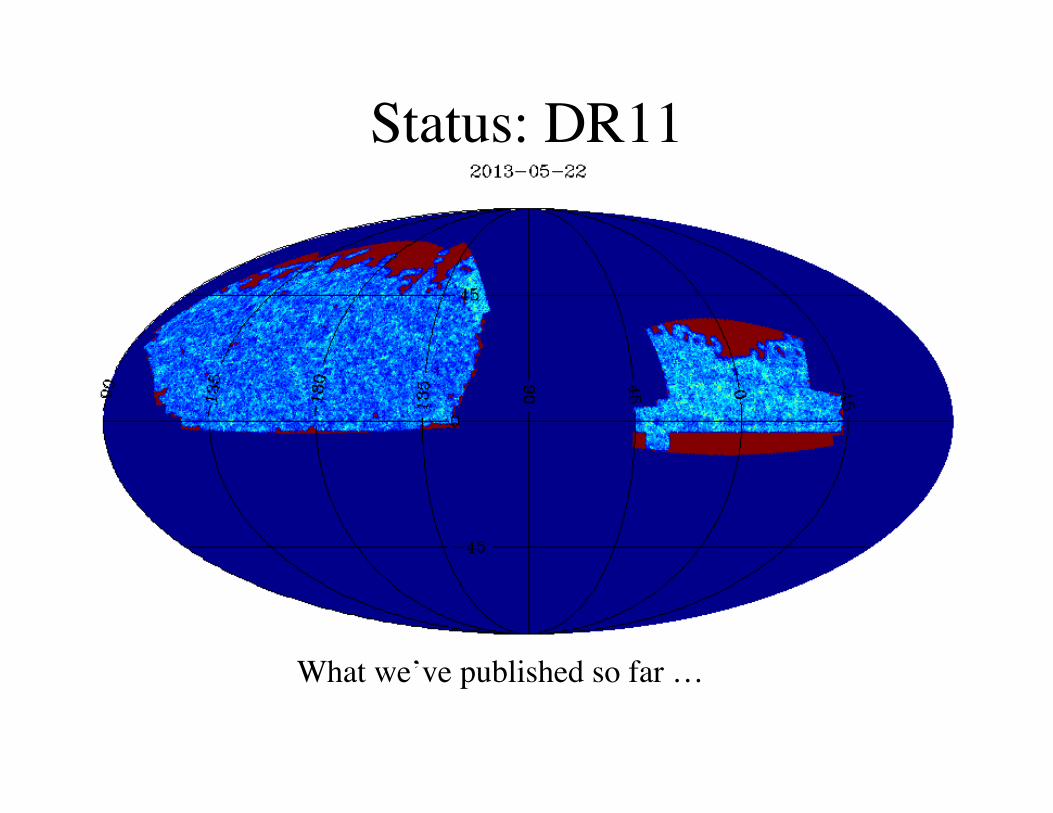
Status: DR11
What we’ve published so far …

DR12
Redshifts for 1.55M LRGs (0.15<z<0.7) and 230K QSOs [of which 169K are at z>2.15] over 10,200 deg2 at -11<δ<+69.

Redshift distribution: Galaxies
1e-04
2e-04
3e-04
4e-04
5e-04
6e-04
7e-04
0.2 0.3 0.4 0.5 0.6 0.7 0.8
Num
ber D
ensit
y (h
3 /Mpc
3 )
Redshift
DR11 LOWZDR11 CMASS
DR7

Redshift distribution: Quasars

Baryon Acoustic Oscillations
Look for a “feature/bump” in the correlation function or a series of “wiggles/oscillations” in the power spectrum. To first approximation, comoving BAO wavelength is determined by the comoving sound horizon at recombination (~110Mpc/h)
Feature in the clustering can be used as a standard ruler to map the expansion history.

Isotropic signal seen very strongly!
DR11 enabled an 8σ detection of the BAO peak at z=0.57, giving a 1% distance!

Aside on “reconstruction”���(Eisenstein++07)
(Pad
man
abha
n++2
012)
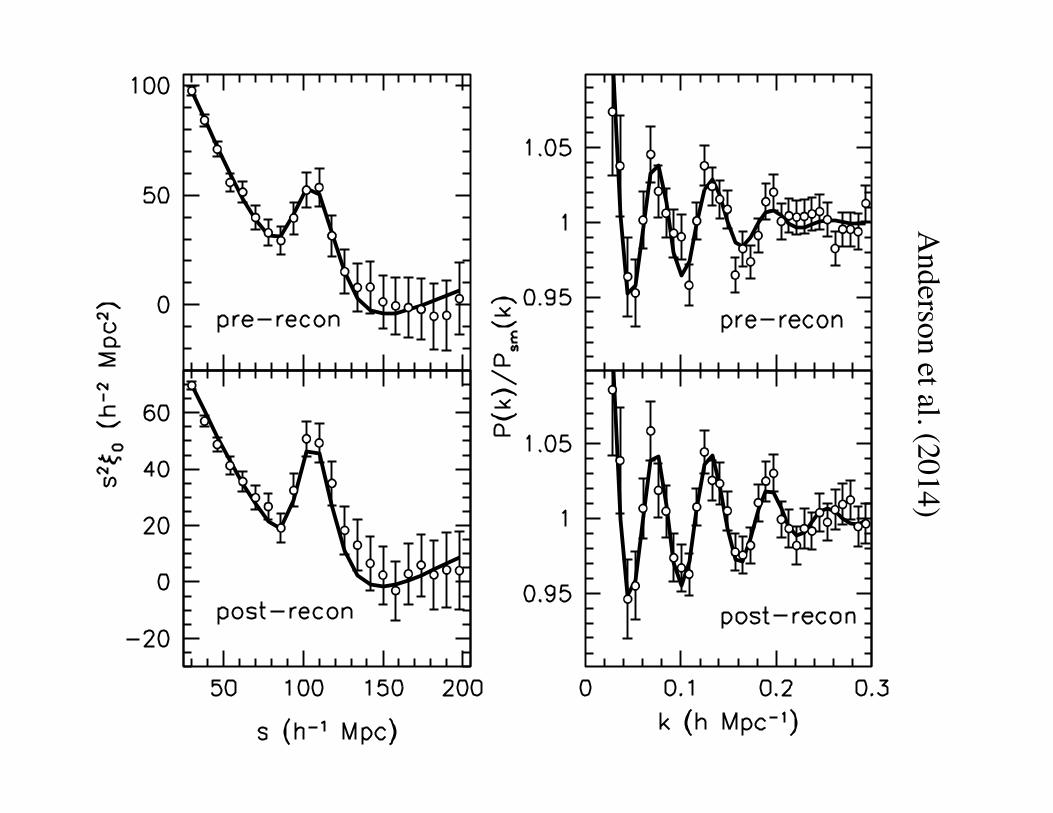
Anderson et al. (2014)

Reconstruction improves precision

Now have a BAO Hubble diagram!
0.1 1.00.2 0.5 2.0z
10
20
30
D(z
)/r d
pz
DM(z)/rdp
z
DV (z)/rdp
z
DH(z)/rdp
z
6dFGS
MGS
SDSS � II
WiggleZ
LOWZ
CMASS
Ly↵ auto
Ly↵ cross
Aubourg++14

Inverse distance ladderAubourg++14 The combination
of BAO and SNe now tightly constrain the low-z distance scale to be very close to ΛCDM. Calibrated “inverse distance ladder”. Good agreement with Planck H0.
H0 = (67.3± 1.1)
✓147.49Mpc
rd
◆km s�1Mpc�1
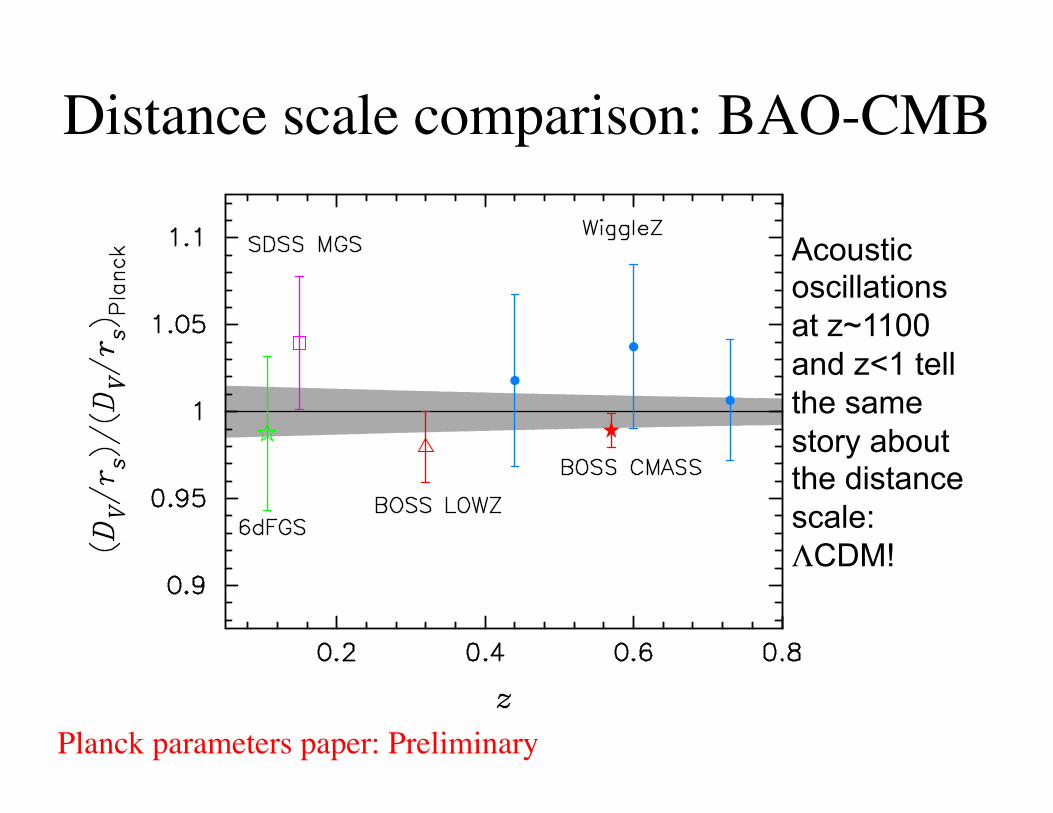
Distance scale comparison: BAO-CMB
Acoustic oscillations at z~1100 and z<1 tell the same story about the distance scale: ΛCDM!
Planck parameters paper: Preliminary

Future analysis improvements
• For the DR12 data we will include several analysis improvements.
• In addition to our distance measures to z~0.3 and z~0.5 we intend to make a “uniform sample” by inverse bias weighting the galaxies…this allows us to measure multiple distances.
• We will include LOWZ galaxies which were mis-targeted and not used in the earlier analyses.
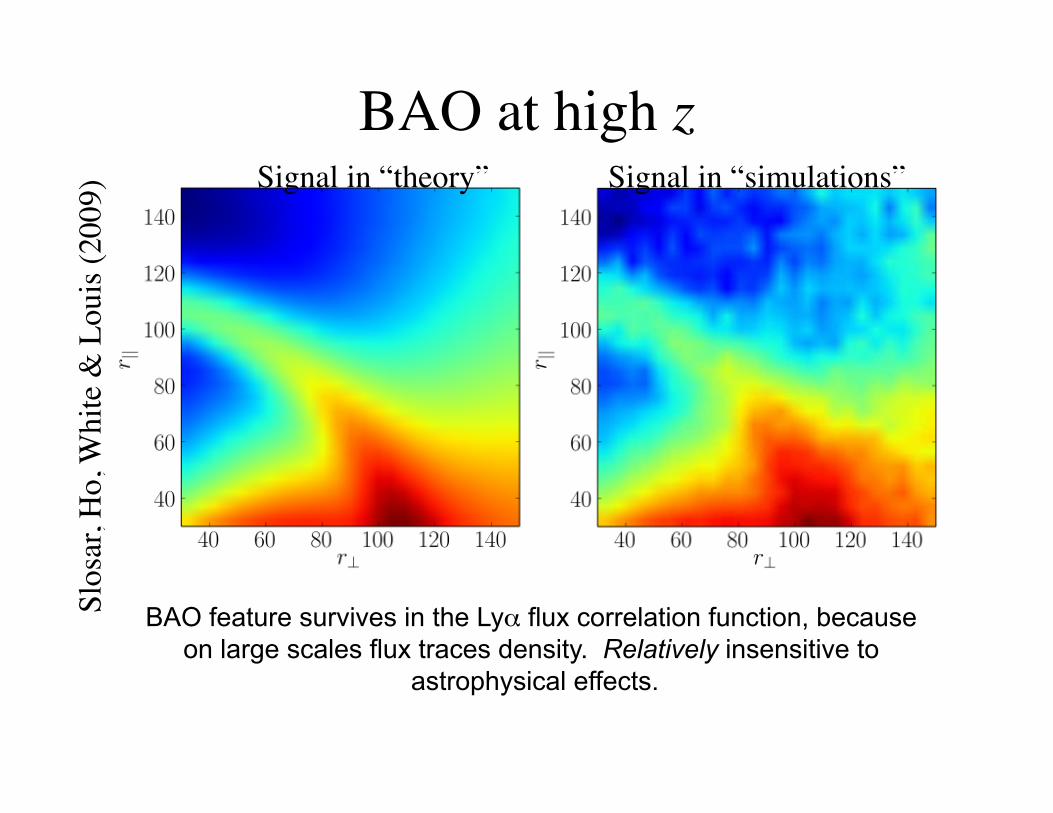
BAO at high zSignal in “theory”
Slos
ar, H
o, W
hite
& L
ouis
(200
9)
BAO feature survives in the Lyα flux correlation function, because on large scales flux traces density. Relatively insensitive to
astrophysical effects.
Signal in “simulations”

Ability to measure PF(k) or ξF(r)?• Have an “effective volume” for a quasar survey,
just like FKP derived for galaxies. – Feldman, Kaiser & Peacock (1994; ApJ 426, 23)
• Derivation is similar, but for Lyα shot-noise is in plane of sky and is modulated by line-of-sight power (McDonald & Eisenstein 2007, McQuinn & White 2011).
Ve↵,gal = Vgal
✓P (k)
P (k) + n̄�13D
◆2
Ve↵,Ly↵ = AL
✓PF (k)
PF (k) + n̄�1
e↵
Plos
◆2
n̄e↵
⌘ 1A
NX
n=1
⌫n , ⌫n ⌘P
los
Plos
+ PN,n
BOSS is the 1st 3D Lyα forest survey!

Recent developments in BAO: Ly-α forest
• First detected in BOSS DR9 [Busca et al., Slosar et al.]
• Detected in DR11 in Ly-α auto-correlation (5σ)
• Delubac et al. [1401.1801]
• (Shown at right)
• and QSO/Ly-α cross-correlation (4.5σ)
• Font-Ribera et al. [1311.1767]
• The combination of auto- and cross-correlations is very helpful given systematics and RSD …
0.8 < μ < 1Along line of sight
0.5 < μ < 0.8
0.0 < μ < 0.5Across line of sight.

Tension with ΛCDM?A
ubourg++14

Cause unknown …• The cause of this tension is unknown. • Alternatives to ΛCDM tend to not provide a
better fit to the Gal+Lyα data than ΛCDM. – Require non-monotonic evolution in H(z).
• The Lyα analysis is less well-developed than the galaxy analysis. – But hard to find a particular systematic that causes
the problem. – It might be a statistical fluke …
• Will have to wait for further distance measurements at high z …
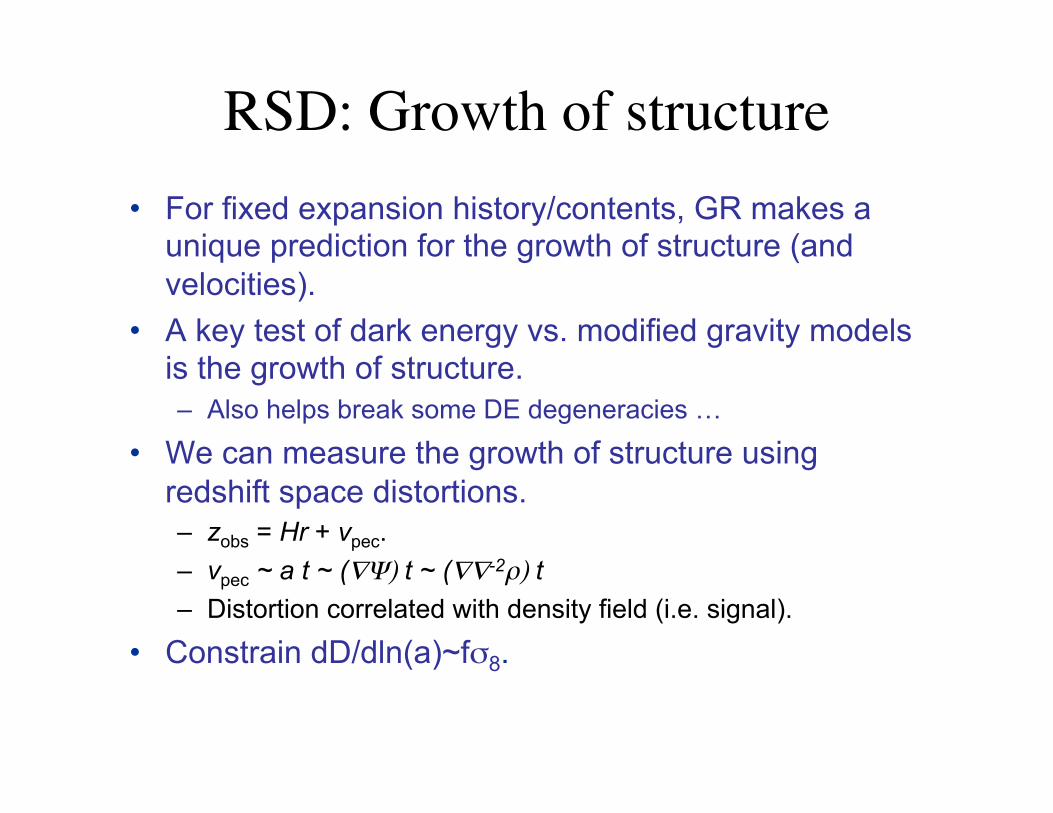
RSD: Growth of structure• For fixed expansion history/contents, GR makes a
unique prediction for the growth of structure (and velocities).
• A key test of dark energy vs. modified gravity models is the growth of structure. – Also helps break some DE degeneracies …
• We can measure the growth of structure using redshift space distortions. – zobs = Hr + vpec. – vpec ~ a t ~ (∇Ψ) t ~ (∇∇-2ρ) t – Distortion correlated with density field (i.e. signal).
• Constrain dD/dln(a)~fσ8.

Two regimesThe distortions depend on non-linear density and velocity fields, which are correlated.
Velocities enhance power on large scales and suppress power on small scales.
The transition from enhancement to suppression occurs on “interesting” scales.
Coherent/supercluster infall
Random (thermal) motion
(fingers-of-god)

Linear theory is not very accurate
z~0.5
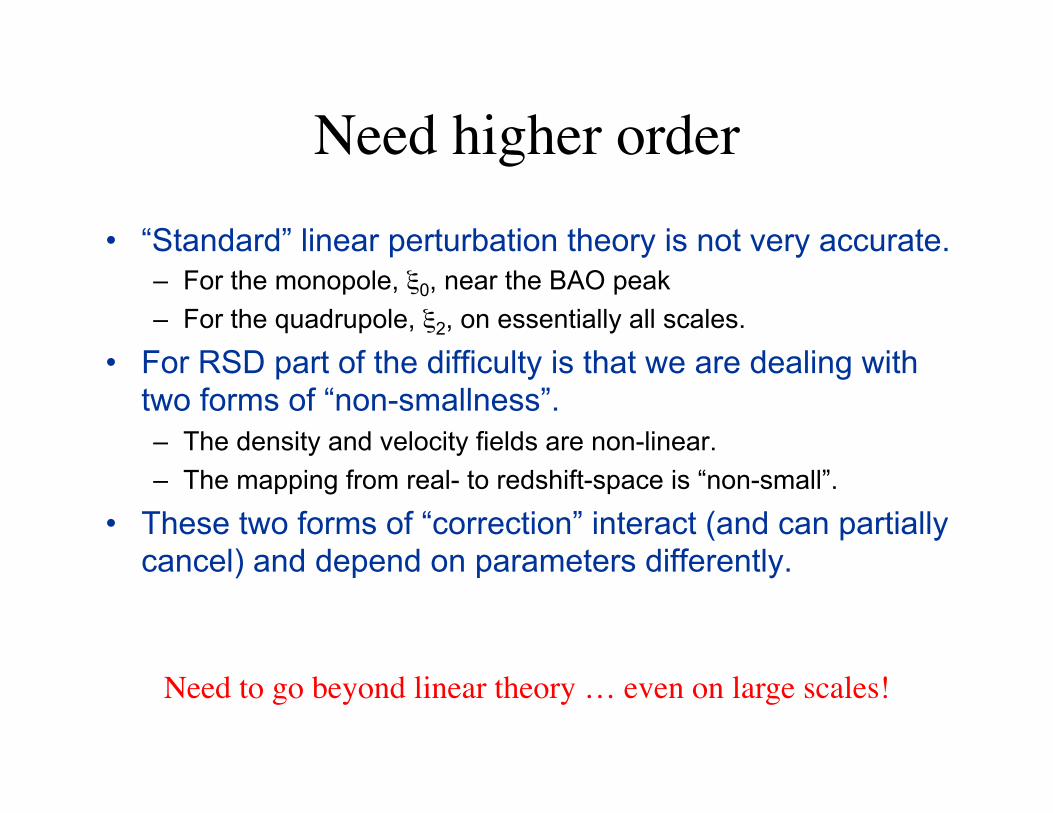
Need higher order• “Standard” linear perturbation theory is not very accurate.
– For the monopole, ξ0, near the BAO peak – For the quadrupole, ξ2, on essentially all scales.
• For RSD part of the difficulty is that we are dealing with two forms of “non-smallness”. – The density and velocity fields are non-linear. – The mapping from real- to redshift-space is “non-small”.
• These two forms of “correction” interact (and can partially cancel) and depend on parameters differently.
Need to go beyond linear theory … even on large scales!

Growth-geometry degeneracyAnisotropies induced by changes in the growth rate can be mistaken for
anisotropies induced by having the wrong model to convert θ, z to R, Z (A-P).
This partial “degeneracy” can be broken with a long enough lever arm in scale. But this means we want to fit over a wide range of scales (incl. BAO scale).
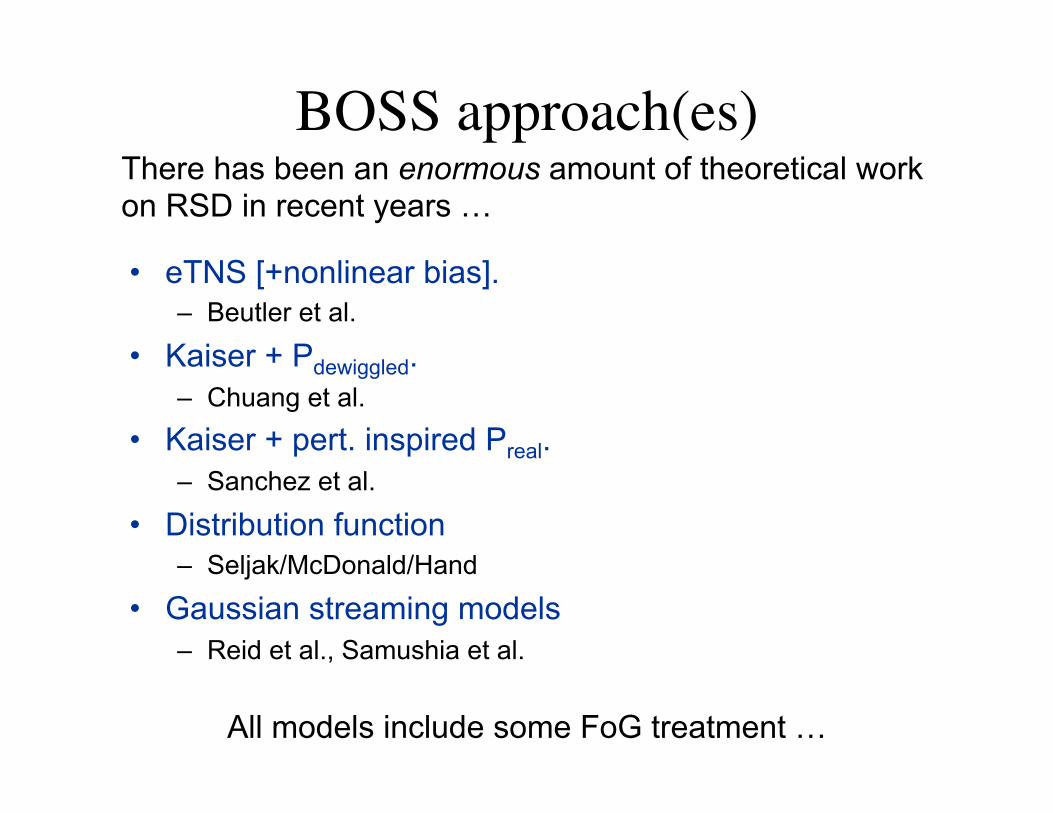
BOSS approach(es)
• eTNS [+nonlinear bias]. – Beutler et al.
• Kaiser + Pdewiggled. – Chuang et al.
• Kaiser + pert. inspired Preal. – Sanchez et al.
• Distribution function – Seljak/McDonald/Hand
• Gaussian streaming models – Reid et al., Samushia et al.
All models include some FoG treatment …
There has been an enormous amount of theoretical work on RSD in recent years …

FoG a large effect!
FoG already a 10% effect by s~25Mpc/h [k~0.15].

Gaussian streaming model• Over the past several years we have developed
formalism for fitting the configuration-space, 2-point statistics of biased tracers in redshift-space.
• Based on “streaming” model and perturbation theory, plus a simple 1-parameter model for FoG. – Reid & White (2012), Reid et al. (2012), Wang et al. (2014), White
(2014), White et al. (2014), ...
Approximate P as a Gaussian with moments set by Eulerian or Lagrangian perturbation theory. Use PT for ξ(r).
v
y
Z
R
1 + ⇠(R,Z) =Z
dy [1 + ⇠(r)]P (v = Z � y, r)
r

Parameters to fit to anisotropic clustering
• Linear P(k) – Known well from Planck, or can marginalize.
• bσ8 [unknown galaxy bias] • fσ8 [pec. vel. field norm./growth rate] • αpara ,αperp [geometric params: DA, H] • σFoG [fingers-of-god]
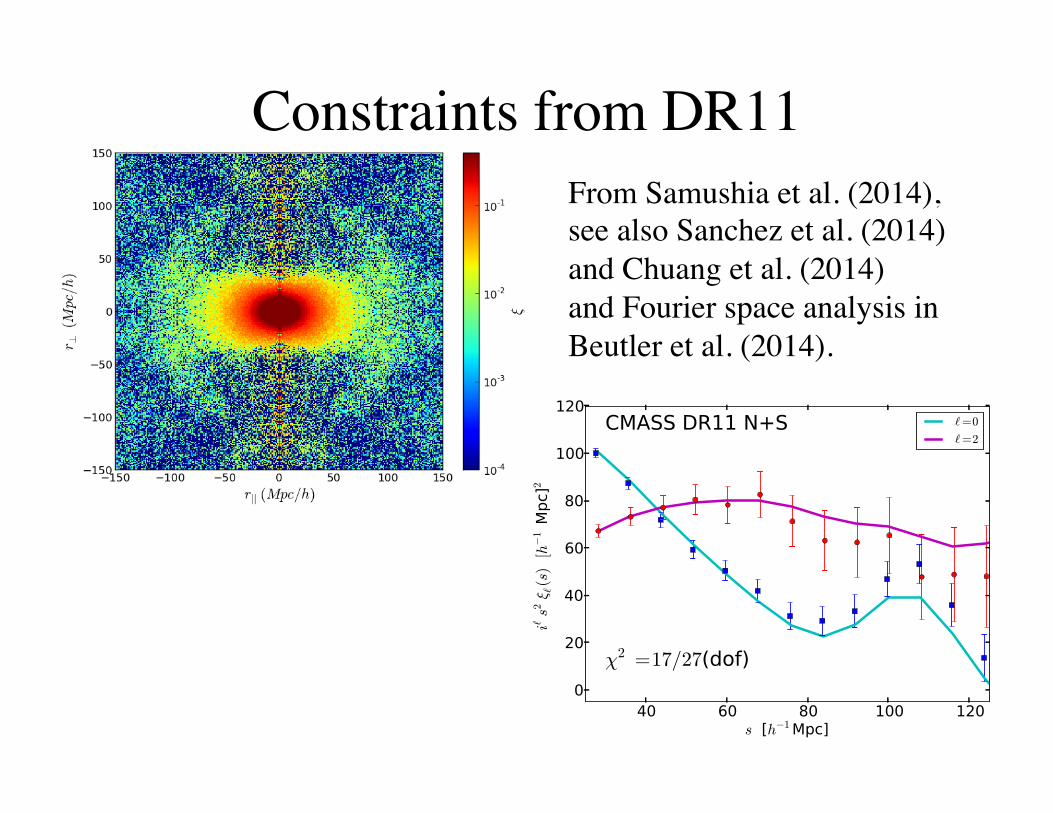
Constraints from DR11From Samushia et al. (2014),see also Sanchez et al. (2014)and Chuang et al. (2014)and Fourier space analysis inBeutler et al. (2014).
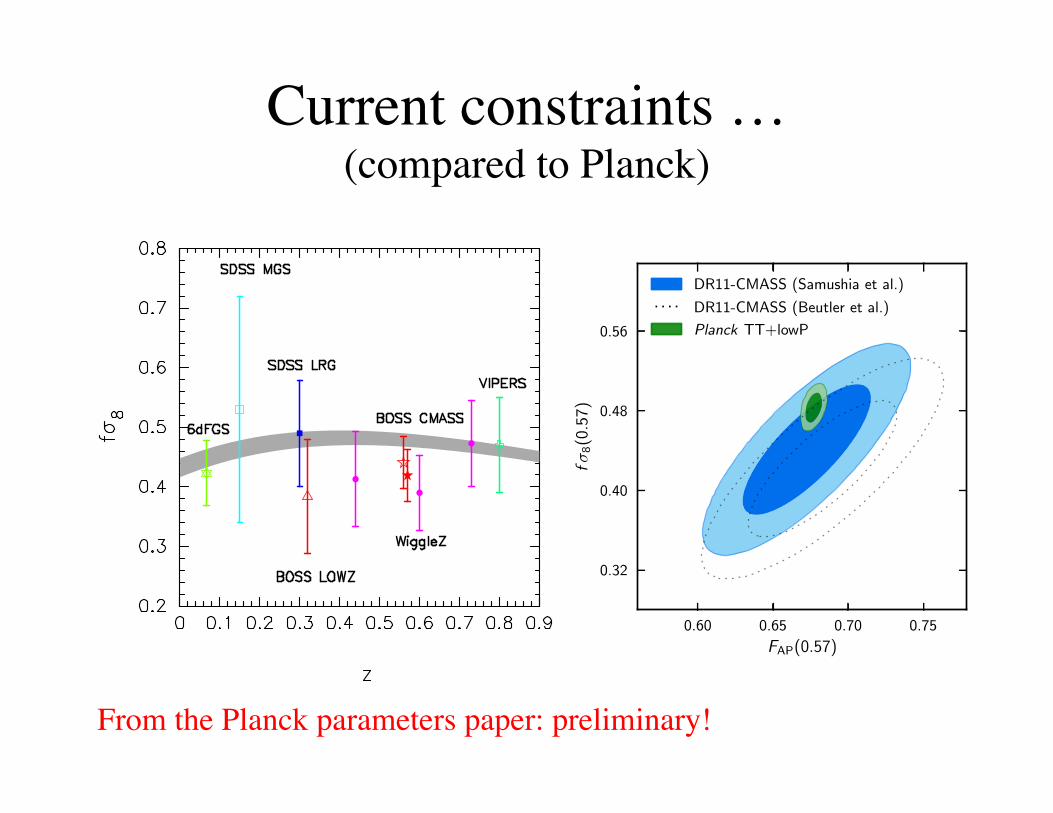
Current constraints …���(compared to Planck)
0.60 0.65 0.70 0.75
FAP(0.57)
0.32
0.40
0.48
0.56
f�8(0
.57)
DR11-CMASS (Samushia et al.)
DR11-CMASS (Beutler et al.)
Planck TT+lowP
…..&and&redshi[&space&distor5ons.......&
preliminary&
From the Planck parameters paper: preliminary!
Upcoming BOSS RSD analyses …
• We will be publishing several RSD analyses of DR12. – Fourier and configuration space. – Straight to cosmological parameters or fσ8, FAP, …
• We are planning to combine BAO+RSD, including reconstructed BAO constraints.
We are nearly finished a blind mock “challenge” with the goal of a consensus wrap-up paper …

A test unblinded:���Lagrangian streaming model���
(average of 26 BOSS volumes with 1σ and 2σ bands)

Test on CMASS-like mocks ���(average of 26 BOSS volumes)

What about small scales?���(Reid et al. 2014)
There’s lots of information on small scales, if we can find a way to use it! How much better could we do?

Using a simulation-based model���(and a new statistic)
Use both projected correlation function (wp, “real space”) and multipoles of ξ(s,µ) to constrain model.
Model is a good fit to the data!

Constraints improve a lot���(worth spending time to get the systematics under control!)
Reid++14
(2013)

Life after BOSS• SDSS-III has finished … SDSS-IV has started
– SDSS-III finished up with “SEQUELS”, looking at LRGs, ELGs and QSOs.
– eBOSS: probing 0.6<z<2 with LRGs, ELGs & QSOs over 7,500; 1,500; 7,500 deg2 respectively.
• Prime Focus Spectrograph (PFS) • Dark Energy Spectroscopic Instrument (DESI) • Euclid • WFIRST-AFTA • Spherex • etc. • 21cm observations …
Coming “soon”: DESI
• Broad redshift range: 0.5<z<1.6 and 2.2<z<3.5
• Sky area 14,000-18,000 deg2: 20-35M redshifts!
• Medium resolution spectroscopy (R~3000-5000) from blue to NIR with 4,000 fibers.
• BOSS made two O(1%) distance measurements
• DESI will make 35 O(1%) BAO distance measurements!
• And measure/constrain running (σα~0.002), fNL~5, Σmν~0.017eV, Neff~0.06, …
• Plus all of the other science that one can do with redshift surveys!
http://desi.lbl.gov/

The End


![[standard] Baryonic Acoustic Oscillations (BAO), Redshift ... · [standard] Baryonic Acoustic Oscillations (BAO), Redshift Space Distortions (RSD), and some (renewed) ideas... Carlo](https://static.fdocuments.us/doc/165x107/5f0c7c127e708231d435a2a6/standard-baryonic-acoustic-oscillations-bao-redshift-standard-baryonic.jpg)