VisiMix RSD Background -...
42
VisiMix VisiMix - - RSD RSD
Transcript of VisiMix RSD Background -...
VisiMix VisiMix -- RSDRSD

DefinitionDefinition
The revolutionary new VisiMix RSD – Rotor Stator Disperser software is the first product of its kind that provides support for mixing devices for
media subjected to high sheer stress
• Based on 3 years dedicated research in a lab with dedicated equipment
• Works with all types of media – both high and
low viscosity liquids, Newtonian and Non-Newtonian.
With VisiMix mixing simulation software, you can —
• Eliminate expensive
outsourcing • Eliminate unreliable manual
calculations
• Eliminate costly trials
DefinitionDefinition
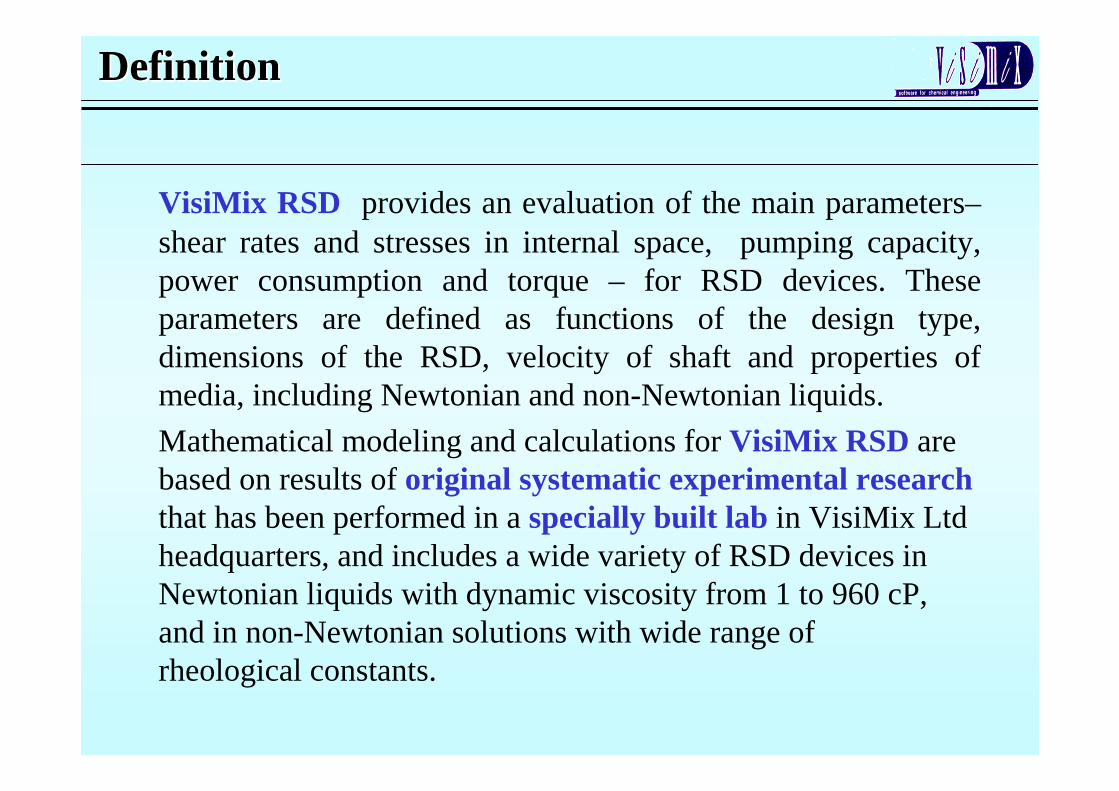
VisiMix RSD provides an evaluation of the main parameters–shear rates and stresses in internal space, pumping capacity, power consumption and torque – for RSD devices. These parameters are defined as functions of the design type, dimensions of the RSD, velocity of shaft and properties of media, including Newtonian and non-Newtonian liquids.
Mathematical modeling and calculations for VisiMix RSD are based on results of original systematic experimental researchthat has been performed in a specially built lab in VisiMix Ltd headquarters, and includes a wide variety of RSD devices in Newtonian liquids with dynamic viscosity from 1 to 960 cP, and in non-Newtonian solutions with wide range of rheological constants.
Physical explanationPhysical explanation
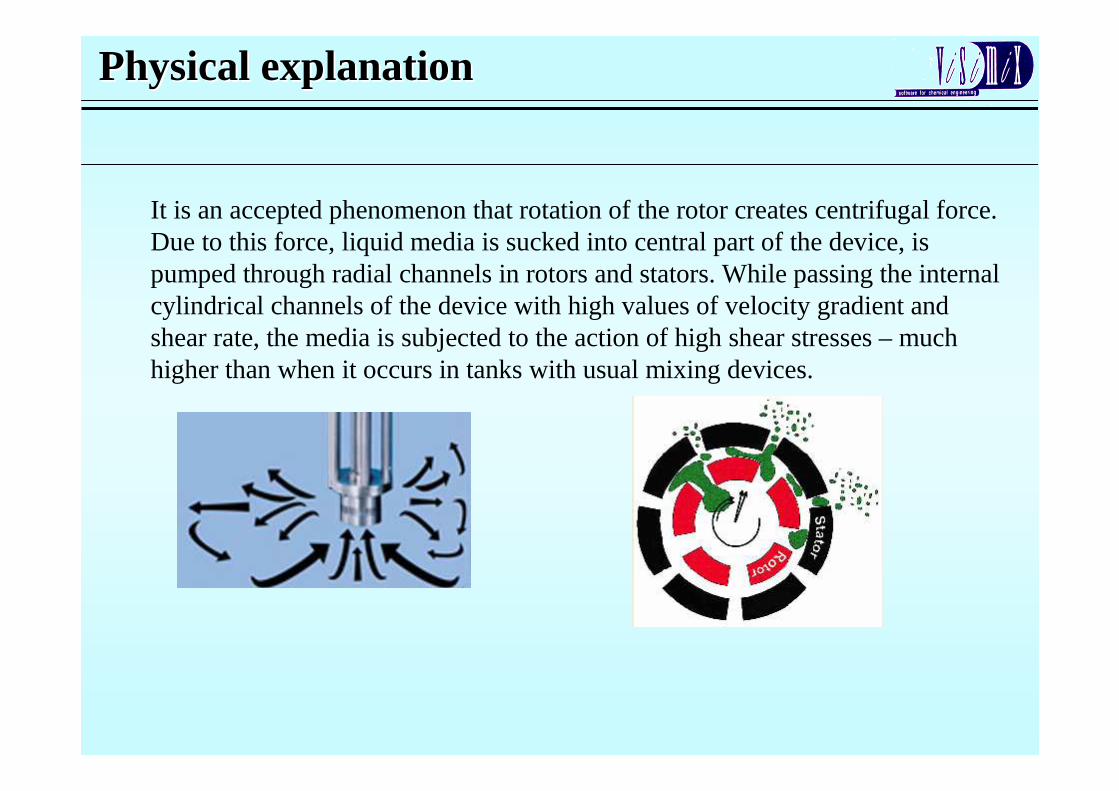
It is an accepted phenomenon that rotation of the rotor creates centrifugal force. Due to this force, liquid media is sucked into central part of the device, is pumped through radial channels in rotors and stators. While passing the internal cylindrical channels of the device with high values of velocity gradient andshear rate, the media is subjected to the action of high shear stresses – much higher than when it occurs in tanks with usual mixing devices.
VisiMix calculationsVisiMix calculations
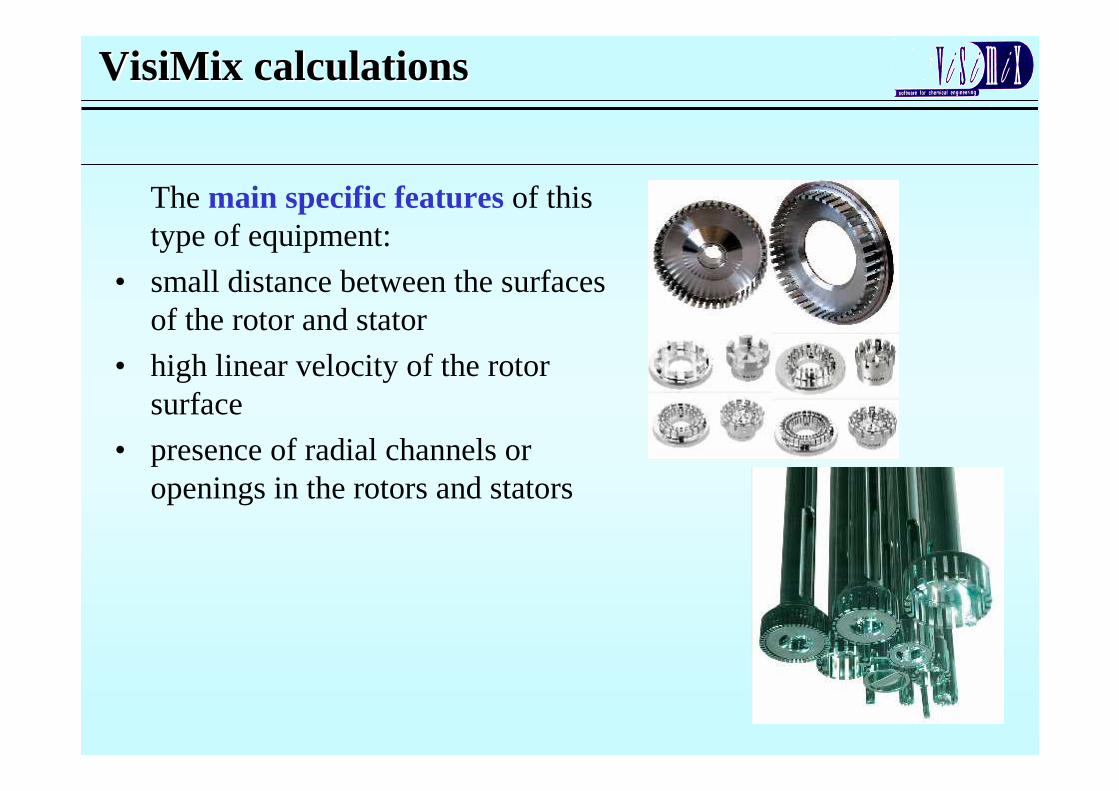
The main specific featuresof this type of equipment:
• small distance between the surfaces of the rotor and stator
• high linear velocity of the rotor surface
• presence of radial channels or openings in the rotors and stators
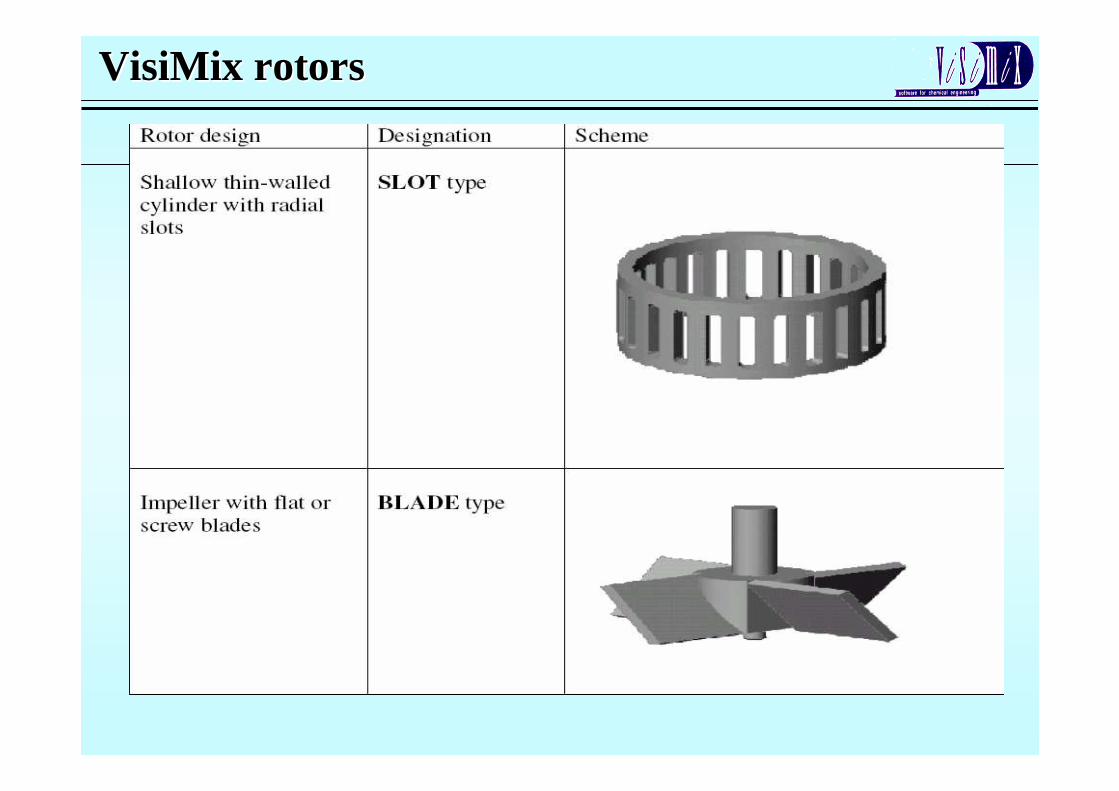
VisiMix rotorsVisiMix rotors
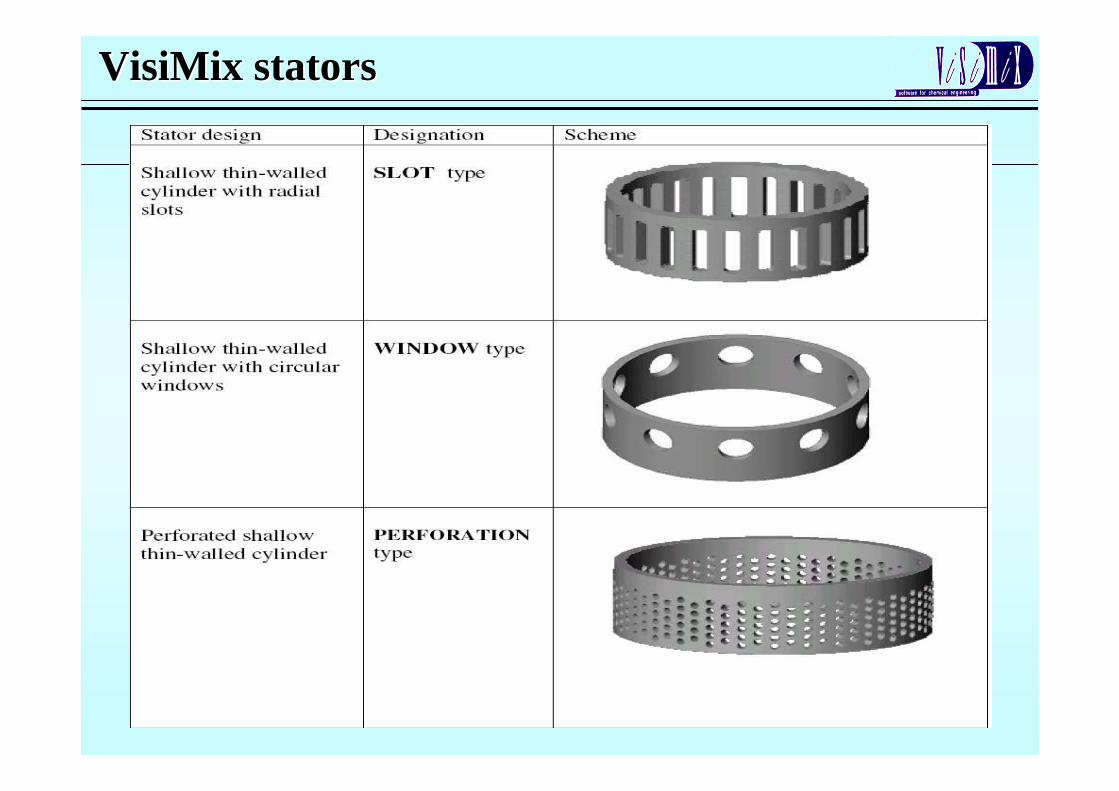
VisiMix statorsVisiMix stators
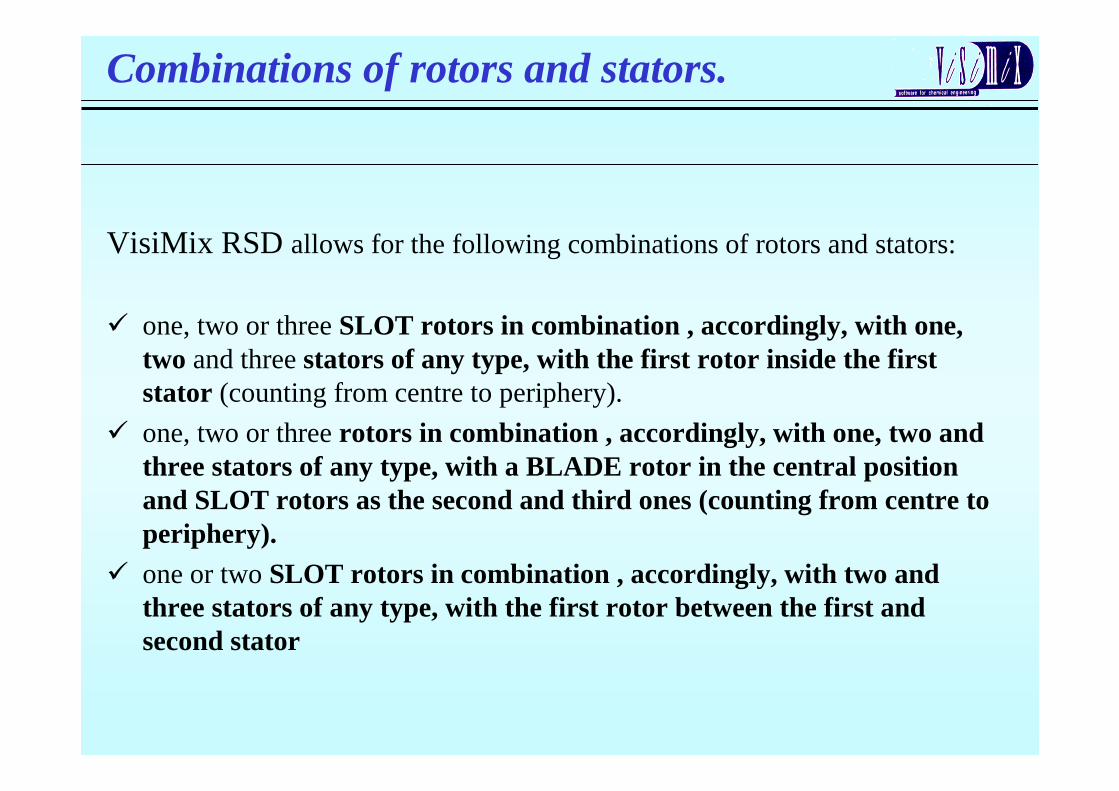
Combinations of rotors and stators.
VisiMix RSD allows for the following combinations of rotors and stators:
� one, two or three SLOT rotors in combination , accordingly, with one, two and three stators of any type, with the first rotor inside the first stator (counting from centre to periphery).
� one, two or three rotors in combination , accordingly, with one, two and three stators of any type, with a BLADE rotor in the central position and SLOT rotors as the second and third ones (counting from centre to periphery).
� one or two SLOT rotors in combination , accordingly, with two and three stators of any type, with the first rotor between the first and second stator
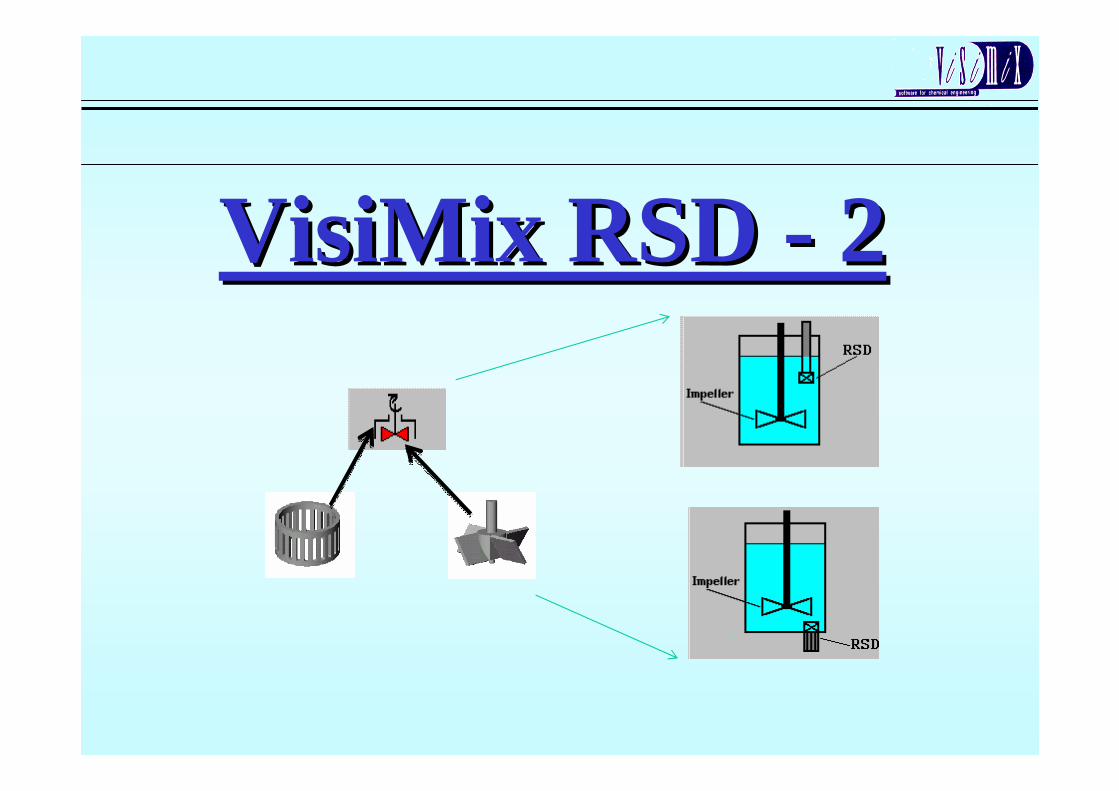
VisiMix RSD VisiMix RSD -- 22
New FeatureNew Feature
• Once we calculate the local shear characteristics of the RSD, we will be interested in evaluating the homogenization process in the whole tank.
• The composition and micro-scale homogeneity of small samples of product must be the same in all points of the batch volume.
• Theoretically, this requirement can be satisfied if all (100%) of the media passes the high shear zones at least once.
• Practically, due to the stochastic nature of the mixing process in the tank, the media will always contain some un-treated fraction, and this fraction will decrease with the increase of the process duration.
New FeatureNew Feature
• With VisiMix RDS – 2 we can simulate:
– The homogenization timeas a function of degree of completeness of high shear treatment (from 95 % to 99.9%)
– The un-treated fraction of media as a function of process time
• These parameters can be simulated for different locations of the RSD within the tank, thus making it possible to work with RSD-2, in conjunction with VisiMix Turbulent and Laminar Software
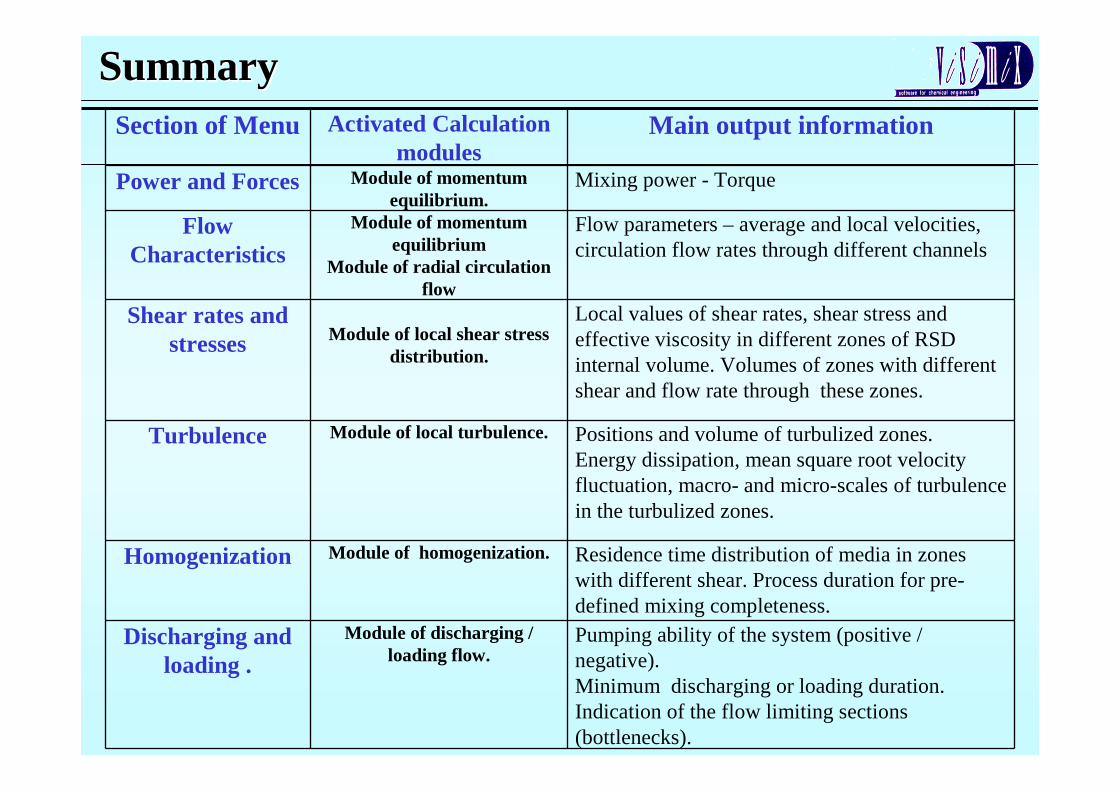
SummarySummarySection of Menu Activated Calculation
modulesMain output information
Power and Forces Module of momentum equilibrium.
Mixing power - Torque
Flow Characteristics
Module of momentum equilibrium
Module of radial circulation flow
Flow parameters – average and local velocities, circulation flow rates through different channels
Shear rates and stresses Module of local shear stress
distribution.
Local values of shear rates, shear stress and effective viscosity in different zones of RSD internal volume. Volumes of zones with different shear and flow rate through these zones.
Turbulence Module of local turbulence. Positions and volume of turbulized zones.Energy dissipation, mean square root velocity fluctuation, macro- and micro-scales of turbulence in the turbulized zones.
Homogenization Module of homogenization. Residence time distribution of media in zones with different shear. Process duration for pre-defined mixing completeness.
Discharging and loading .
Module of discharging / loading flow.
Pumping ability of the system (positive / negative).Minimum discharging or loading duration.Indication of the flow limiting sections (bottlenecks).
Develop of Power and Flow Capacity of Rotor/Stator DevicesDevelop of Power and Flow Capacity of Rotor/Stator Devices
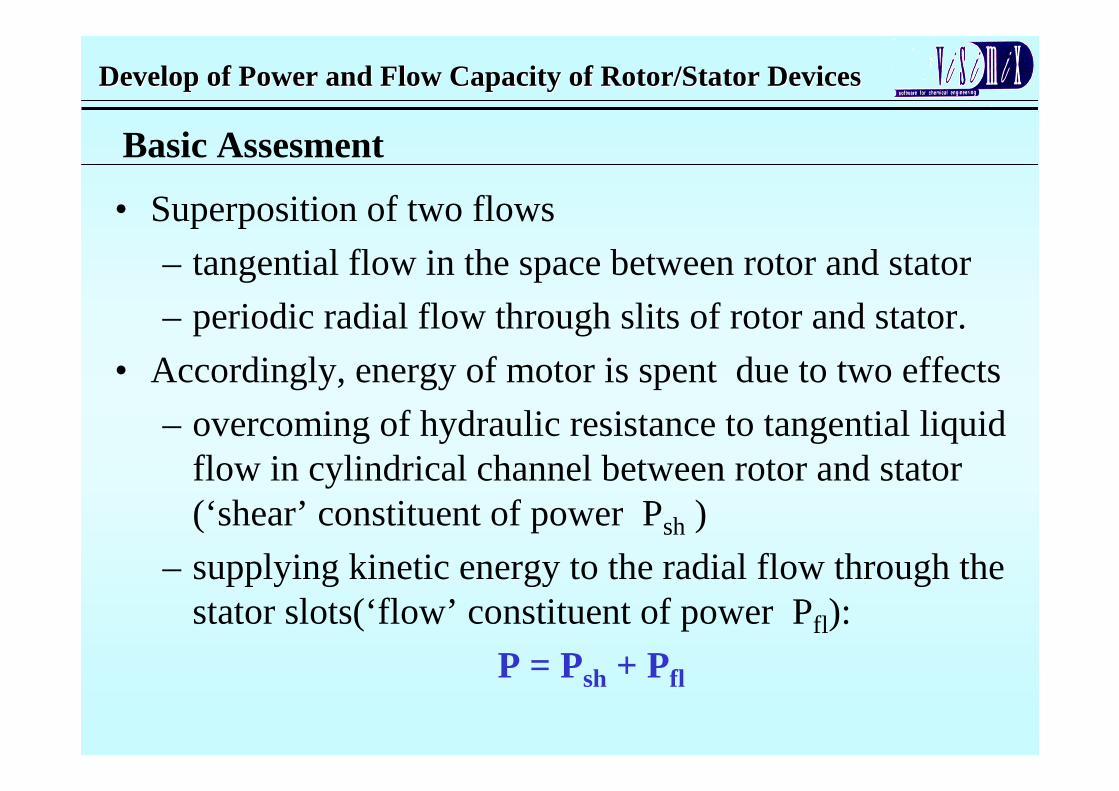
• Superposition of two flows
– tangential flow in the space between rotor and stator
– periodic radial flow through slits of rotor and stator.
• Accordingly, energy of motor is spent due to two effects
– overcoming of hydraulic resistance to tangential liquid flow in cylindrical channel between rotor and stator (‘shear’ constituent of power Psh )
– supplying kinetic energy to the radial flow through the stator slots(‘flow’ constituent of power Pfl):
P = Psh + Pfl
Basic Assesment
Develop of Power and Flow Capacity of Rotor/Stator DevicesDevelop of Power and Flow Capacity of Rotor/Stator Devices
For central SLOT type rotor inside the SLOT type statorFor central SLOT type rotor inside the SLOT type stator
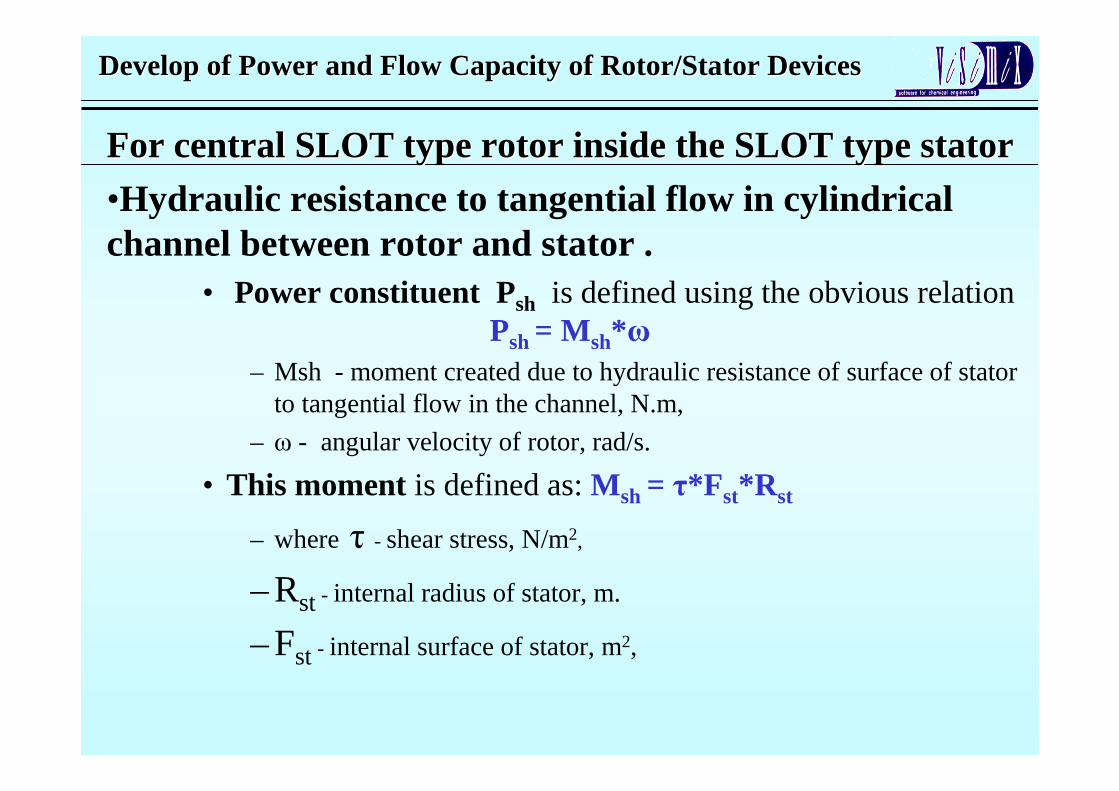
•Hydraulic resistance to tangential flow in cylindrical channel between rotor and stator .
• Power constituent Psh is defined using the obvious relation Psh = Msh*ω
– Msh - moment created due to hydraulic resistance of surface of statorto tangential flow in the channel, N.m,
– ω - angular velocity of rotor, rad/s.
• This moment is defined as: M sh= τ*F st*R st
– whereτ - shear stress, N/m2,
– Rst - internal radius of stator, m.
– Fst - internal surface of stator, m2,
Develop of Power and Flow Capacity of Rotor/Stator DevicesDevelop of Power and Flow Capacity of Rotor/Stator Devices
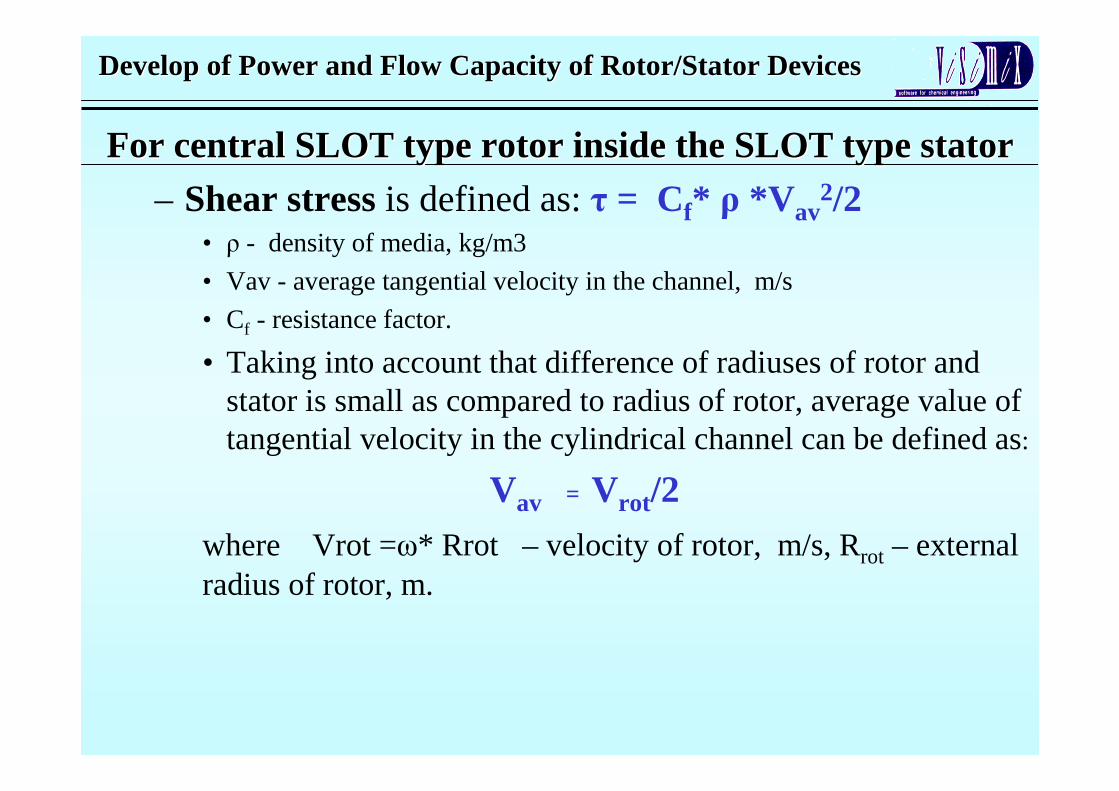
For central SLOT type rotor inside the SLOT type statorFor central SLOT type rotor inside the SLOT type stator
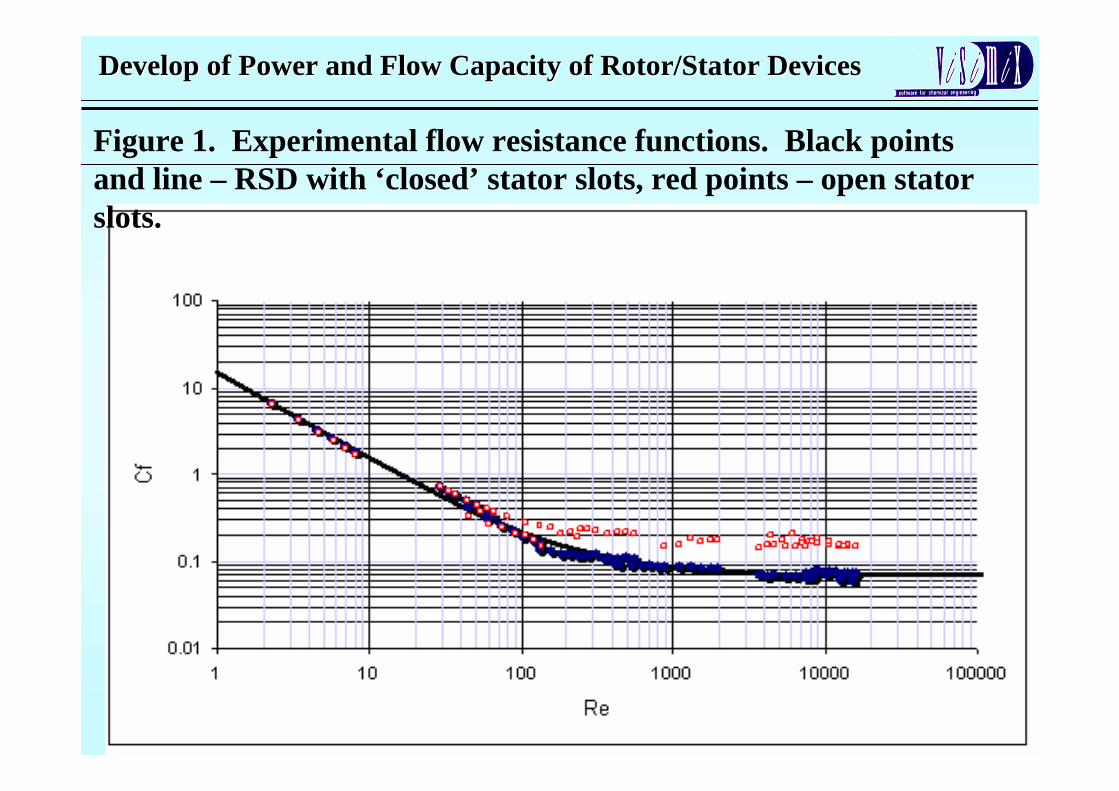
– Shear stress is defined as: τ = Cf* ρ *V av2/2
• ρ - density of media, kg/m3
• Vav - average tangential velocity in the channel, m/s
• Cf - resistance factor.
• Taking into account that difference of radiuses of rotor and stator is small as compared to radius of rotor, average value oftangential velocity in the cylindrical channel can be defined as:
Vav = Vrot/2
where Vrot =ω* Rrot – velocity of rotor, m/s, Rrot – external radius of rotor, m.
Develop of Power and Flow Capacity of Rotor/Stator DevicesDevelop of Power and Flow Capacity of Rotor/Stator Devices
For central SLOT type rotor inside the SLOT type statorFor central SLOT type rotor inside the SLOT type stator
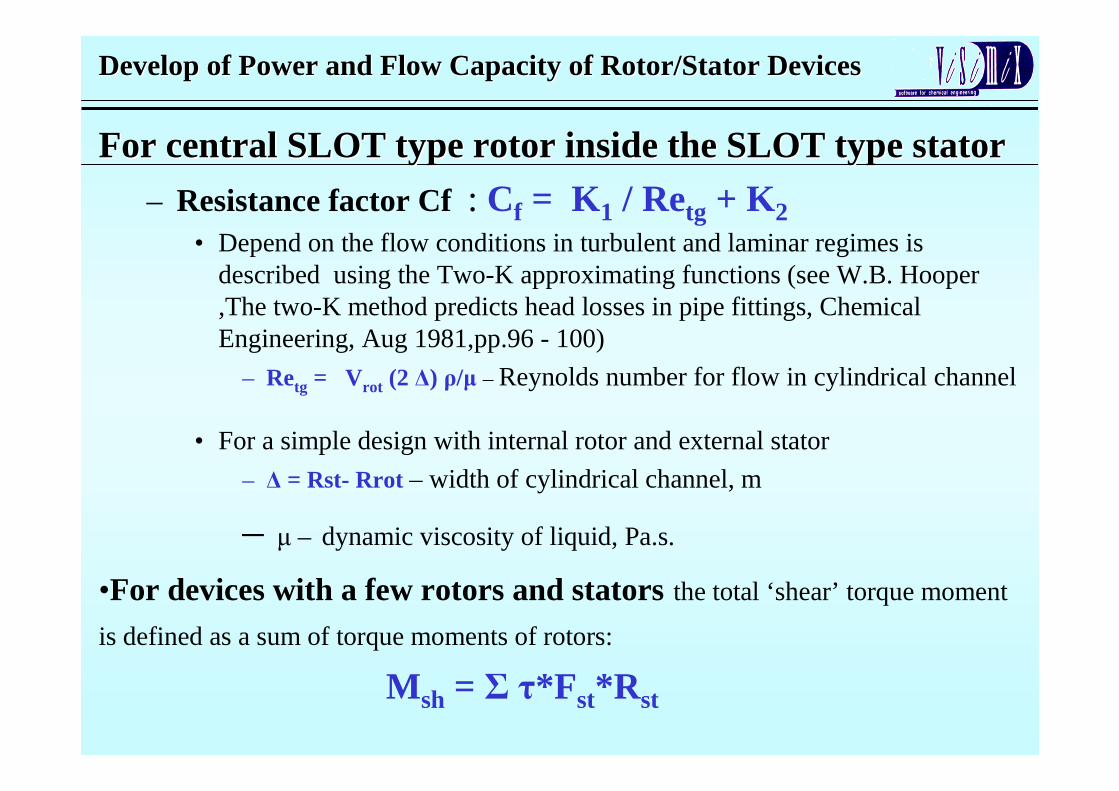
– Resistance factor Cf : Cf = K1 / Retg + K2• Depend on the flow conditions in turbulent and laminar regimes is
described using the Two-K approximating functions (see W.B. Hooper ,The two-K method predicts head losses in pipe fittings, Chemical Engineering, Aug 1981,pp.96 - 100)
– Retg = Vrot (2 ∆) ρ/µ – Reynolds number for flow in cylindrical channel
• For a simple design with internal rotor and external stator
– ∆ = Rst- Rrot – width of cylindrical channel, m
– µ – dynamic viscosity of liquid, Pa.s.
•For devices with a few rotors and statorsthe total ‘shear’ torque moment
is defined as a sum of torque moments of rotors:
M sh = Σ τ*F st*R st
Develop of Power and Flow Capacity of Rotor/Stator DevicesDevelop of Power and Flow Capacity of Rotor/Stator Devices
• Parameters K1 and K2 are dependent on geometry of rotors and stators.
• Calculation of K1 and K2 for different RSD devices is based on experimental correlations connecting these values with main characteristics of rotors and stators, including number and sizes of slots and dimensions of cylindrical channels.
• These experimental correlations have been developed using results of measurements of torque moments of RSD rotors at conditions excluding radial flow. Absence of radial flow was ensured by covering of external cylindrical surface of stators (tests with ‘closed’ stator).
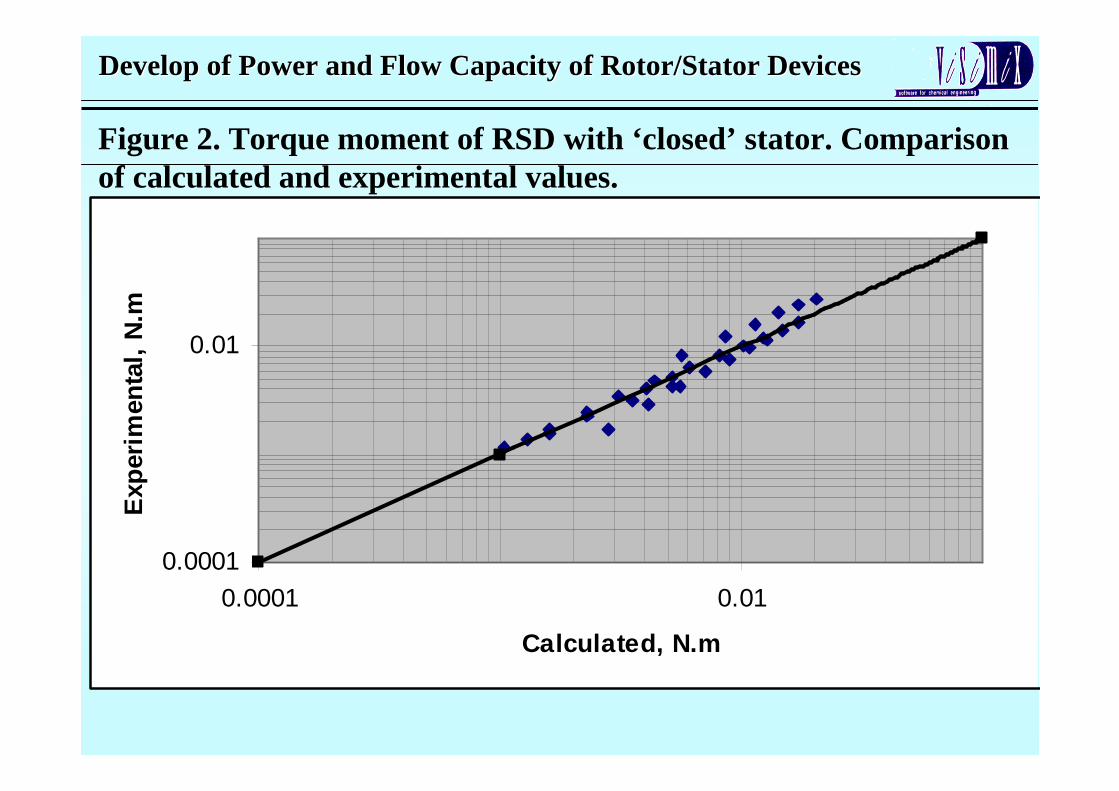
• Measurements were performed with more then 30 combinations of rotor / stator dimensions. Ten Newtonian experimental liquids – water, glycerol and water - glycerol solutions with viscosity 1 – 960 cP were used.
Develop of Power and Flow Capacity of Rotor/Stator DevicesDevelop of Power and Flow Capacity of Rotor/Stator Devices
Figure 1. Experimental flow resistance functions. Black pointsand line – RSD with ‘closed’ stator slots, red points – open stator slots.
Develop of Power and Flow Capacity of Rotor/Stator DevicesDevelop of Power and Flow Capacity of Rotor/Stator Devices
0.0001
0.01
0.0001 0.01
Calculated, N.m
Exp
erim
enta
l, N
.mFigure 2. Torque moment of RSD with ‘closed’ stator. Comparison of calculated and experimental values.
Develop of Power and Flow Capacity of Rotor/Stator DevicesDevelop of Power and Flow Capacity of Rotor/Stator Devices
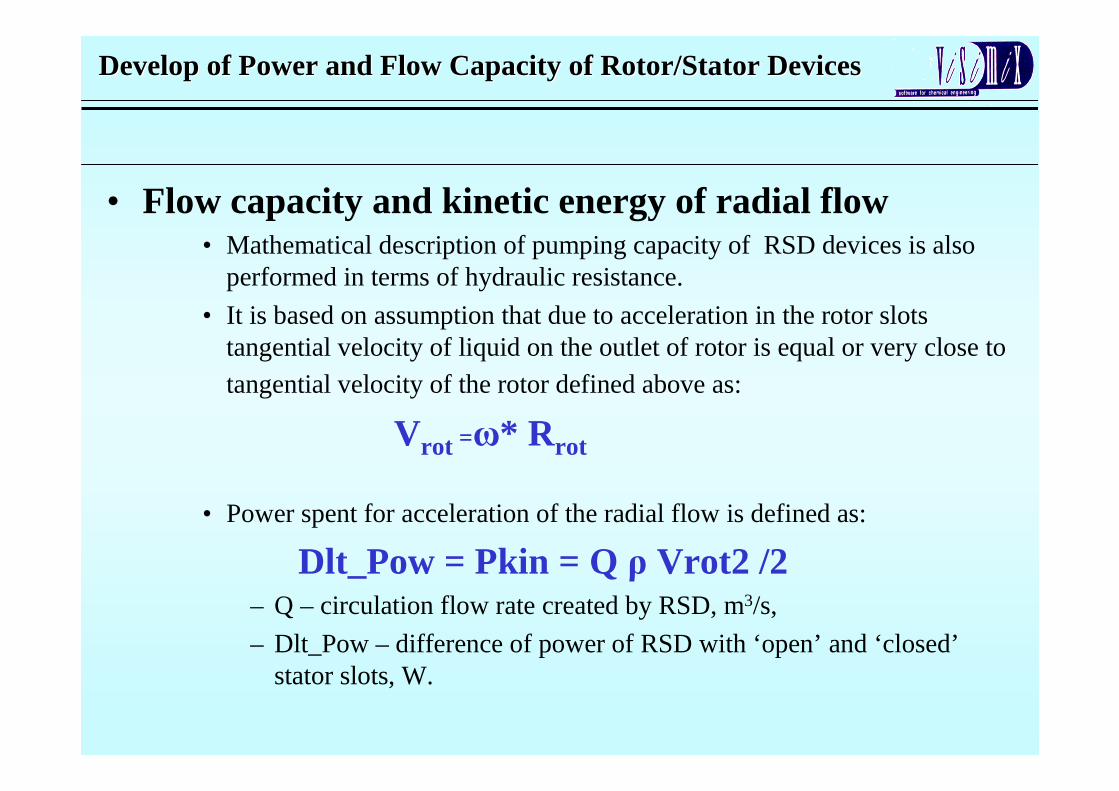
• Flow capacity and kinetic energy of radial flow• Mathematical description of pumping capacity of RSD devices is also
performed in terms of hydraulic resistance.
• It is based on assumption that due to acceleration in the rotor slots tangential velocity of liquid on the outlet of rotor is equal or very close to tangential velocity of the rotor defined above as:
Vrot =ω* R rot
• Power spent for acceleration of the radial flow is defined as:
Dlt_Pow = Pkin = Q ρ Vrot2 /2– Q – circulation flow rate created by RSD, m3/s,
– Dlt_Pow – difference of power of RSD with ‘open’ and ‘closed’stator slots, W.
Develop of Power and Flow Capacity of Rotor/Stator DevicesDevelop of Power and Flow Capacity of Rotor/Stator Devices
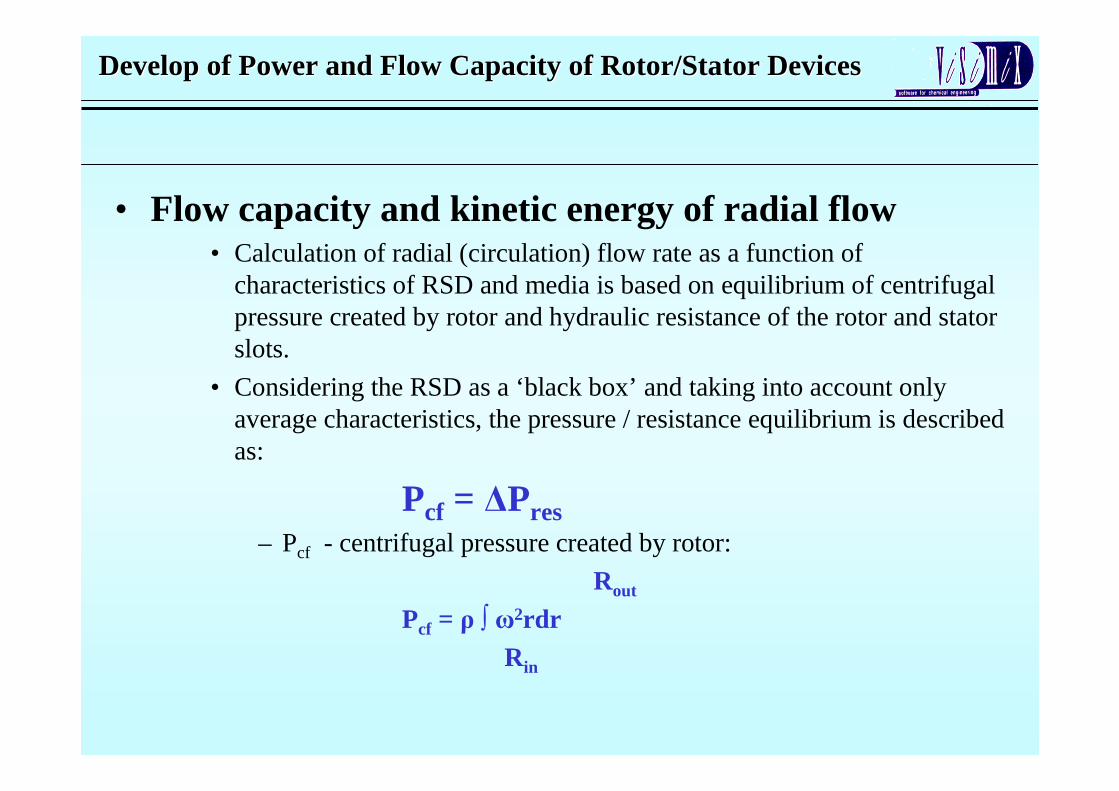
• Flow capacity and kinetic energy of radial flow• Calculation of radial (circulation) flow rate as a function of
characteristics of RSD and media is based on equilibrium of centrifugal pressure created by rotor and hydraulic resistance of the rotor and stator slots.
• Considering the RSD as a ‘black box’ and taking into account only average characteristics, the pressure / resistance equilibrium is described as:
Pcf = ∆Pres – Pcf - centrifugal pressure created by rotor:
Rout
Pcf = ρ ∫ ω2rdr Rin
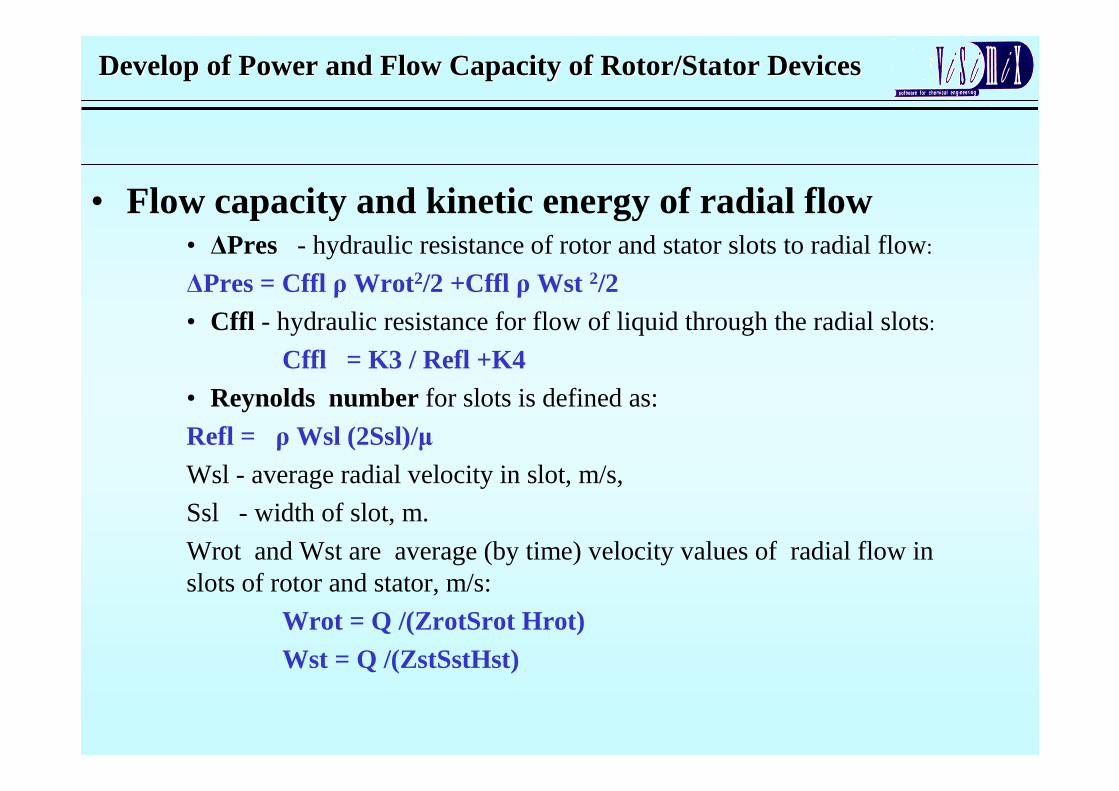
• Flow capacity and kinetic energy of radial flow• ∆Pres - hydraulic resistance of rotor and stator slots to radial flow:
∆Pres = Cffl ρWrot 2/2 +Cffl ρWst 2/2 • Cffl - hydraulic resistance for flow of liquid through the radial slots:
Cffl = K3 / Refl +K4• Reynolds number for slots is defined as:
Refl = ρWsl (2Ssl)/µWsl - average radial velocity in slot, m/s,
Ssl - width of slot, m.
Wrot and Wst are average (by time) velocity values of radial flow in slots of rotor and stator, m/s:
Wrot = Q /(ZrotSrot Hrot) Wst = Q /(ZstSstHst)
Develop of Power and Flow Capacity of Rotor/Stator DevicesDevelop of Power and Flow Capacity of Rotor/Stator Devices
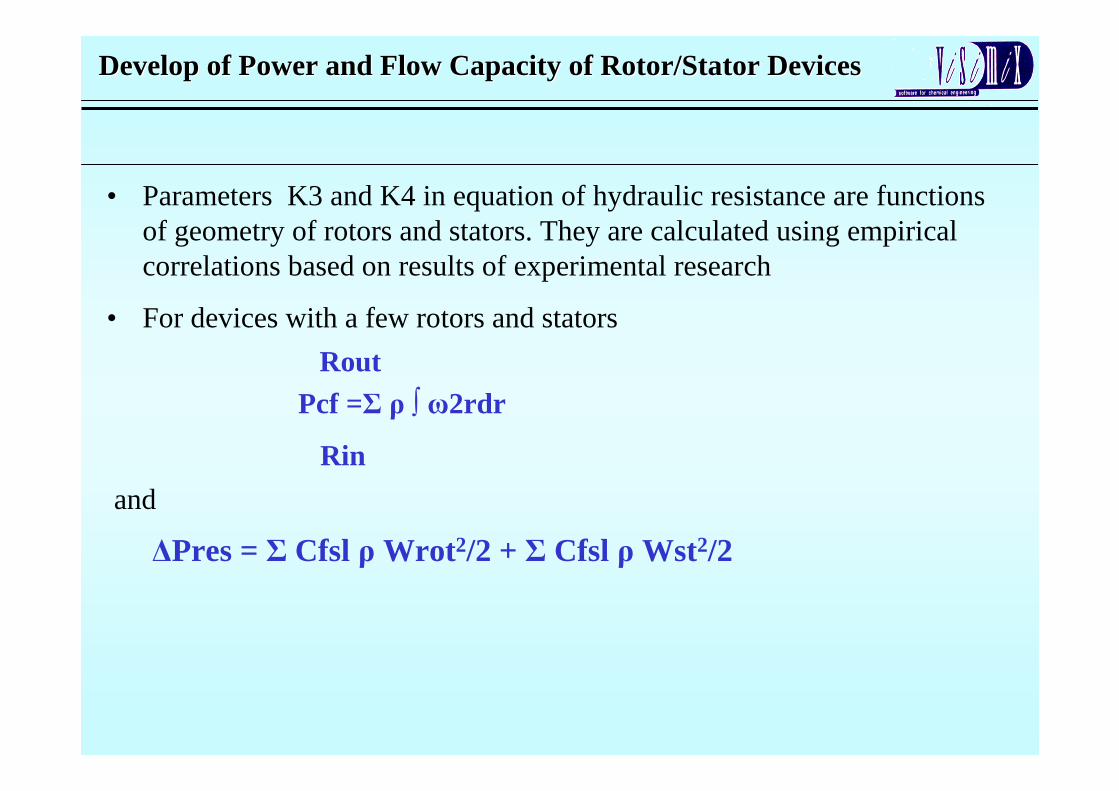
• Parameters K3 and K4 in equation of hydraulic resistance are functions of geometry of rotors and stators. They are calculated using empirical correlations based on results of experimental research
• For devices with a few rotors and stators
RoutPcf =Σ ρ ∫ ω2rdr
Rin
and
∆Pres = Σ Cfsl ρWrot 2/2 + Σ Cfsl ρWst2/2
Develop of Power and Flow Capacity of Rotor/Stator DevicesDevelop of Power and Flow Capacity of Rotor/Stator Devices
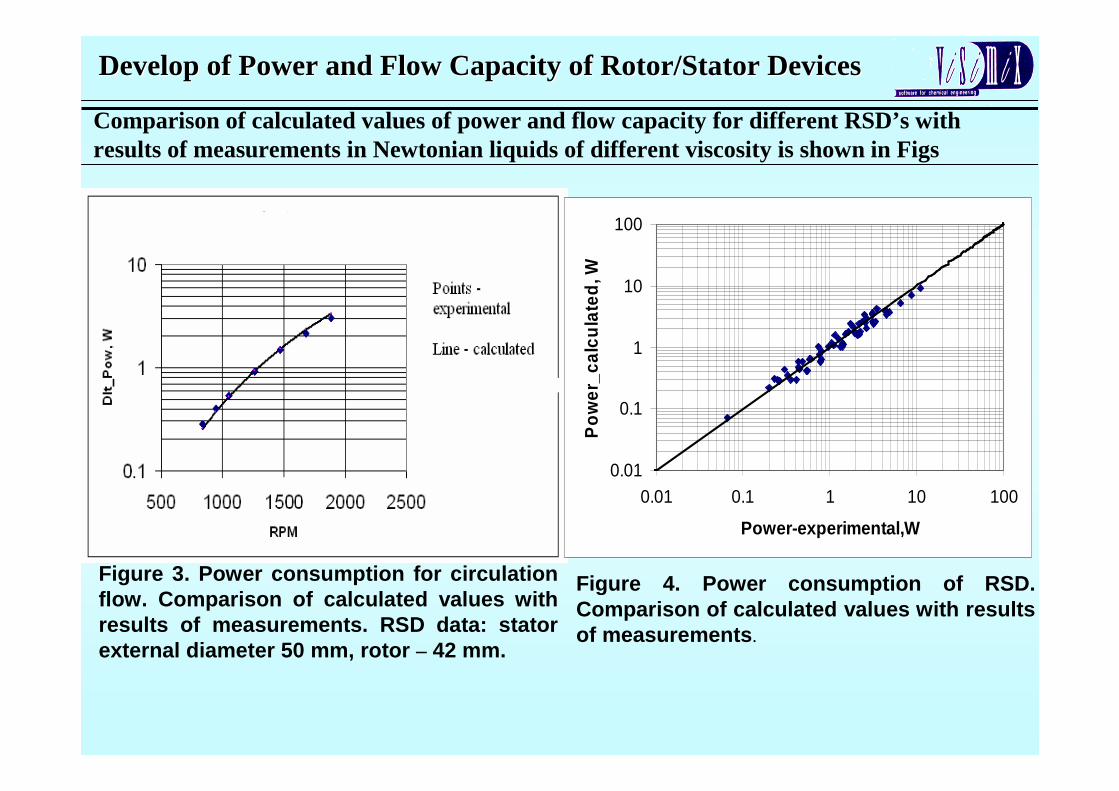
Comparison of calculated values of power and flow capacity for different RSD’s with results of measurements in Newtonian liquids of different viscosity is shown in Figs
Develop of Power and Flow Capacity of Rotor/Stator DevicesDevelop of Power and Flow Capacity of Rotor/Stator Devices
Figure 3. Power consumption for circulation flow. Comparison of calculated values with results of measurements. RSD data: stator external diameter 50 mm, rotor – 42 mm.
0.01
0.1
1
10
100
0.01 0.1 1 10 100
Power-experimental,W
Po
wer
_cal
cula
ted
, WFigure 4. Power consumption of RSD. Comparison of calculated values with results of measurements.
Develop of Power and Flow Capacity of Rotor/Stator DevicesDevelop of Power and Flow Capacity of Rotor/Stator Devices
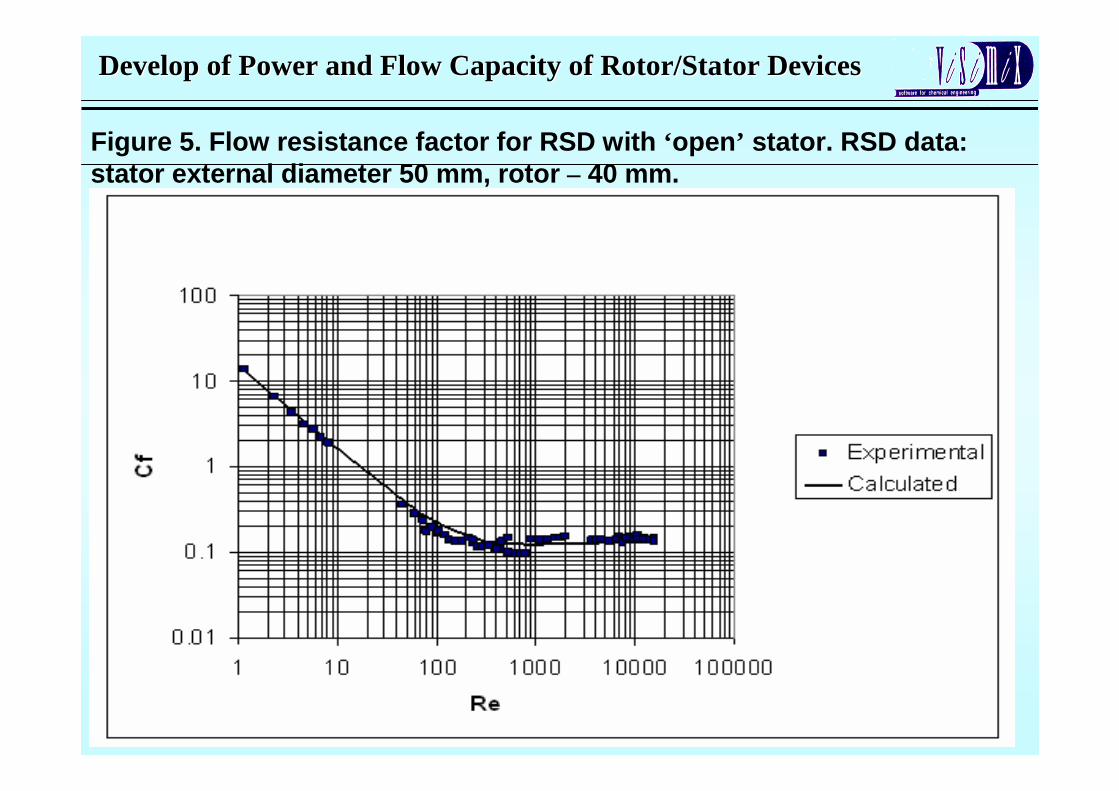
Figure 5. Flow resistance factor for RSD with ‘open’ stator. RSD data: stator external diameter 50 mm, rotor – 40 mm.
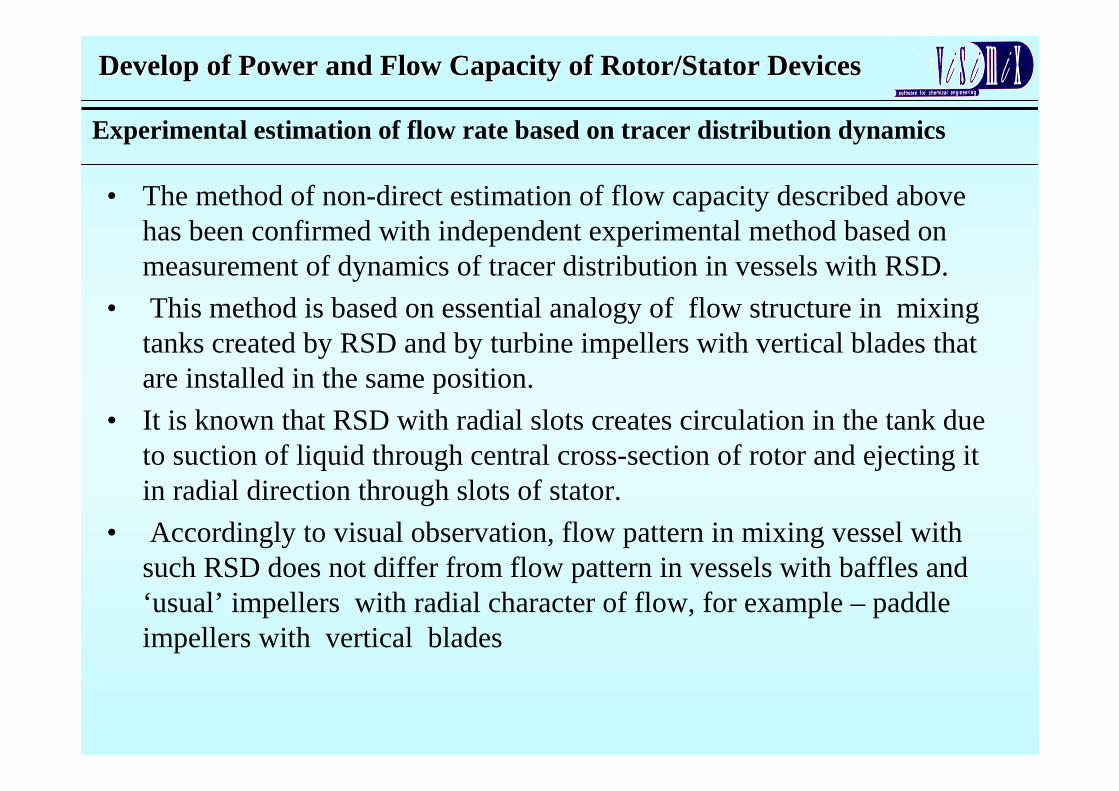
• The method of non-direct estimation of flow capacity described above has been confirmed with independent experimental method based onmeasurement of dynamics of tracer distribution in vessels with RSD.
• This method is based on essential analogy of flow structure in mixing tanks created by RSD and by turbine impellers with vertical blades that are installed in the same position.
• It is known that RSD with radial slots creates circulation in the tank due to suction of liquid through central cross-section of rotor and ejecting it in radial direction through slots of stator.
• Accordingly to visual observation, flow pattern in mixing vessel with such RSD does not differ from flow pattern in vessels with baffles and ‘usual’ impellers with radial character of flow, for example – paddle impellers with vertical blades
Develop of Power and Flow Capacity of Rotor/Stator DevicesDevelop of Power and Flow Capacity of Rotor/Stator Devices
Experimental estimation of flow rate based on tracer distribution dynamics
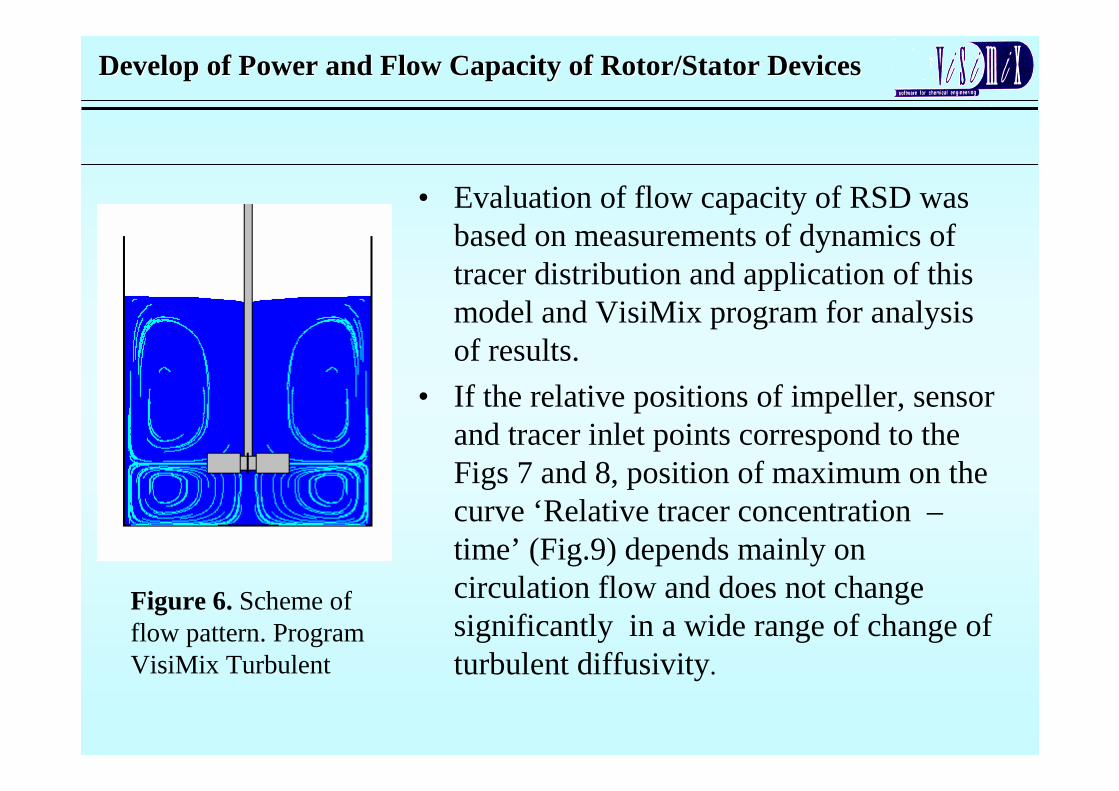
• Evaluation of flow capacity of RSD was based on measurements of dynamics of tracer distribution and application of this model and VisiMix program for analysis of results.
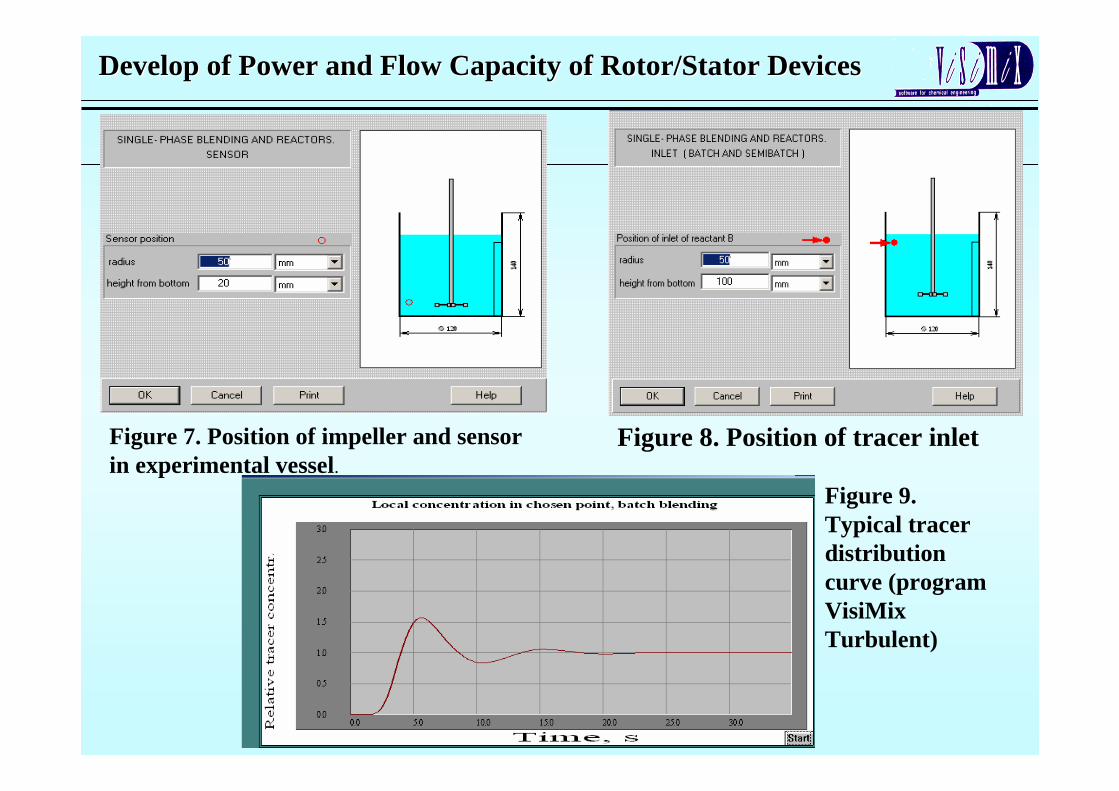
• If the relative positions of impeller, sensor and tracer inlet points correspond to the Figs 7 and 8, position of maximum on the curve ‘Relative tracer concentration –time’ (Fig.9) depends mainly on circulation flow and does not change significantly in a wide range of change of turbulent diffusivity.
Develop of Power and Flow Capacity of Rotor/Stator DevicesDevelop of Power and Flow Capacity of Rotor/Stator Devices
Figure 6. Scheme of flow pattern. Program VisiMix Turbulent
Develop of Power and Flow Capacity of Rotor/Stator DevicesDevelop of Power and Flow Capacity of Rotor/Stator Devices
Figure 7. Position of impeller and sensor in experimental vessel.
Figure 8. Position of tracer inlet
Figure 9. Typical tracer distribution curve (program VisiMix Turbulent)
Develop of Power and Flow Capacity of Rotor/Stator DevicesDevelop of Power and Flow Capacity of Rotor/Stator Devices
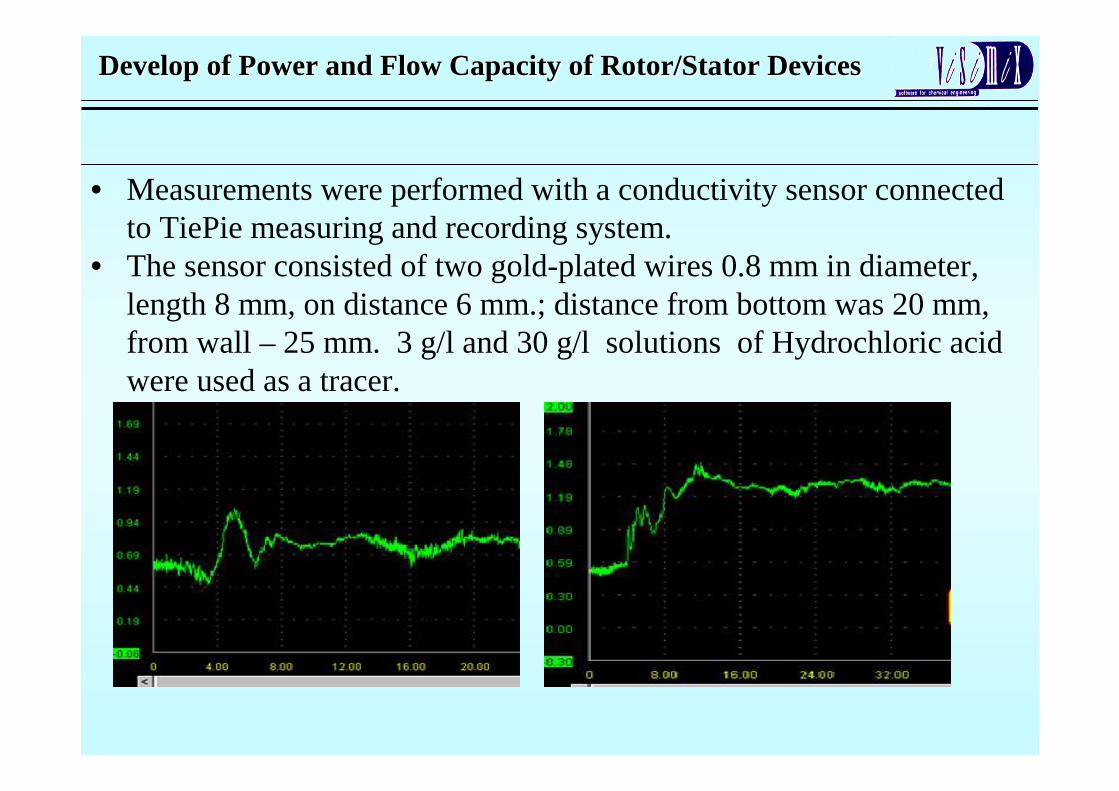
• Measurements were performed with a conductivity sensor connectedto TiePie measuring and recording system.
• The sensor consisted of two gold-plated wires 0.8 mm in diameter, length 8 mm, on distance 6 mm.; distance from bottom was 20 mm, from wall – 25 mm. 3 g/l and 30 g/l solutions of Hydrochloric acid were used as a tracer.
• Time periods from injection moment to moment of maximum concentration value were measured in 6 -9 parallel tests.
• Experimental flow rate values were defined using comparison of the measured average values with results of VisiMix calculations.
• Applicability and exactitude of the method were confirmed additionally with control tests.
• For this purpose same measurements were performed with a 2-blade paddle agitator of 40 mm diameter.
Develop of Power and Flow Capacity of Rotor/Stator DevicesDevelop of Power and Flow Capacity of Rotor/Stator Devices
Develop of Power and Flow Capacity of Rotor/Stator DevicesDevelop of Power and Flow Capacity of Rotor/Stator Devices
0
2
4
6
8
10
12
14
0 20 40 60 80 100 120 140 160
RPM
Cir
cula
tio
n f
low
rat
e, l
/min
0
2
4
6
8
10
12
0 500 1000 1500 2000
RPM
Exp
erim
enta
l fl
ow
rat
e, l
/min
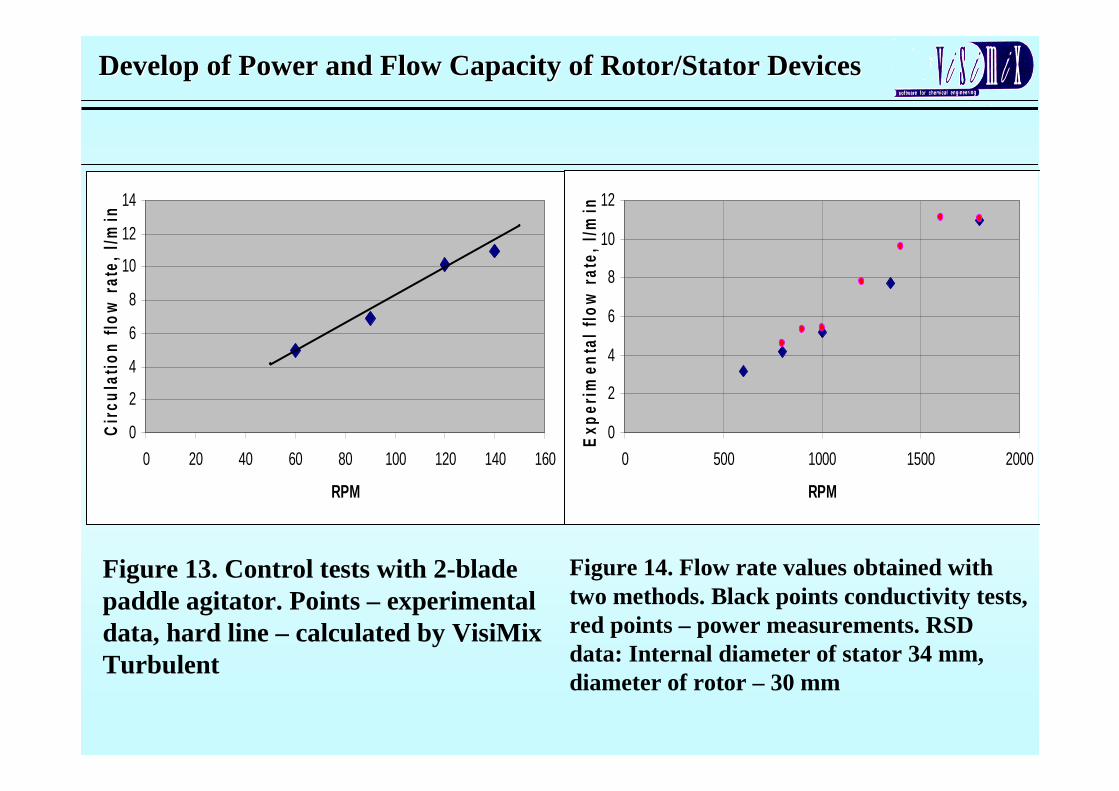
Figure 13. Control tests with 2-blade paddle agitator. Points – experimental data, hard line – calculated by VisiMix Turbulent
Figure 14. Flow rate values obtained with two methods. Black points conductivity tests, red points – power measurements. RSD data: Internal diameter of stator 34 mm, diameter of rotor – 30 mm
• Power and flow capacity of RSD in non-Newtonian liquids.– The method of calculation of power for RSD in non-Newtonian liquid is
based on the connection between ‘effective’ viscosity and hydraulic resistance to tangential flow in the channels of RSD device (A Method for Calculation of Effective Viscosity and Mixing Power in Non-Newtonian Media.” by L.N.Braginsky. Annual Meeting of AIChE, Dallas, 1999).
– The effective viscosity of non-Newtonian liquid at given flow conditions is understood as viscosity of such Newtonian liquid that shows in these conditions the same flow resistance.
Develop of Power and Flow Capacity of Rotor/Stator DevicesDevelop of Power and Flow Capacity of Rotor/Stator Devices
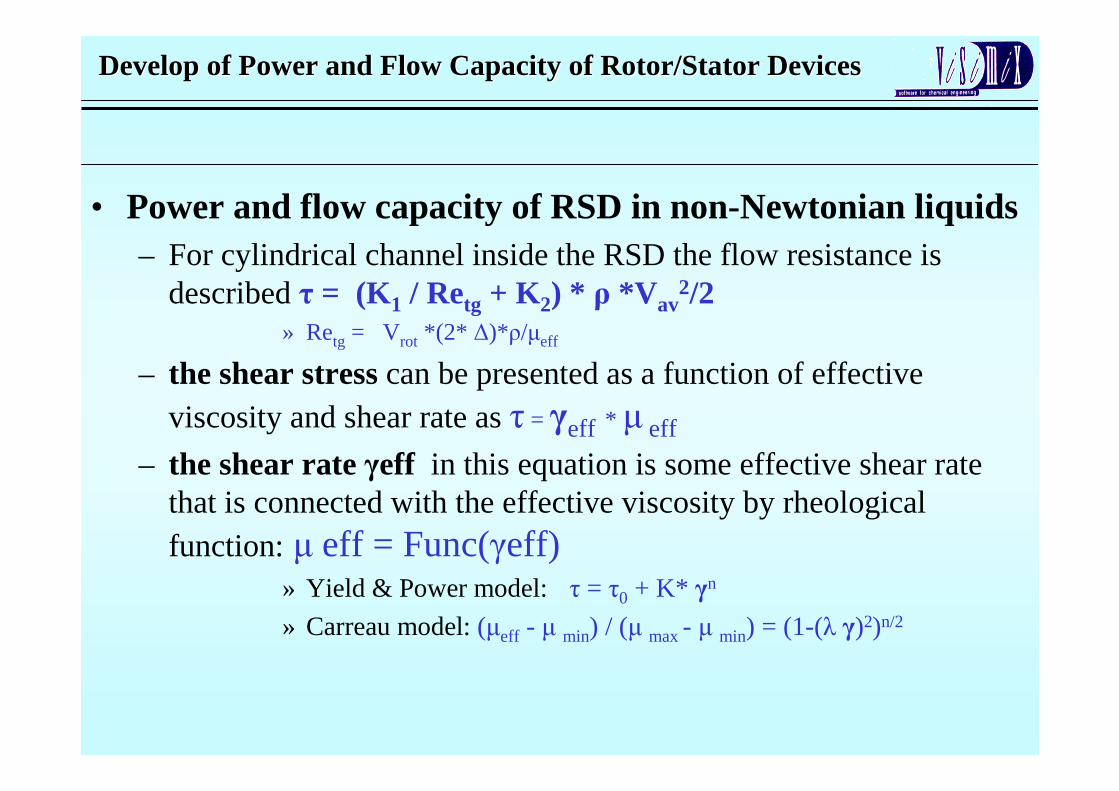
• Power and flow capacity of RSD in non-Newtonian liquids– For cylindrical channel inside the RSD the flow resistance is
described τ = (K1 / Retg + K2) * ρ *V av2/2
» Retg = Vrot *(2* ∆)*ρ/µeff
– the shear stress can be presented as a function of effective viscosity and shear rate as τ = γeff * µ eff
– the shear rate γeff in this equation is some effective shear rate that is connected with the effective viscosity by rheological function:µ eff = Func(γeff)
» Yield & Power model: τ = τ0 + K* γn
» Carreau model: (µeff - µ min) / (µ max - µ min) = (1-(λ γ)2)n/2
Develop of Power and Flow Capacity of Rotor/Stator DevicesDevelop of Power and Flow Capacity of Rotor/Stator Devices
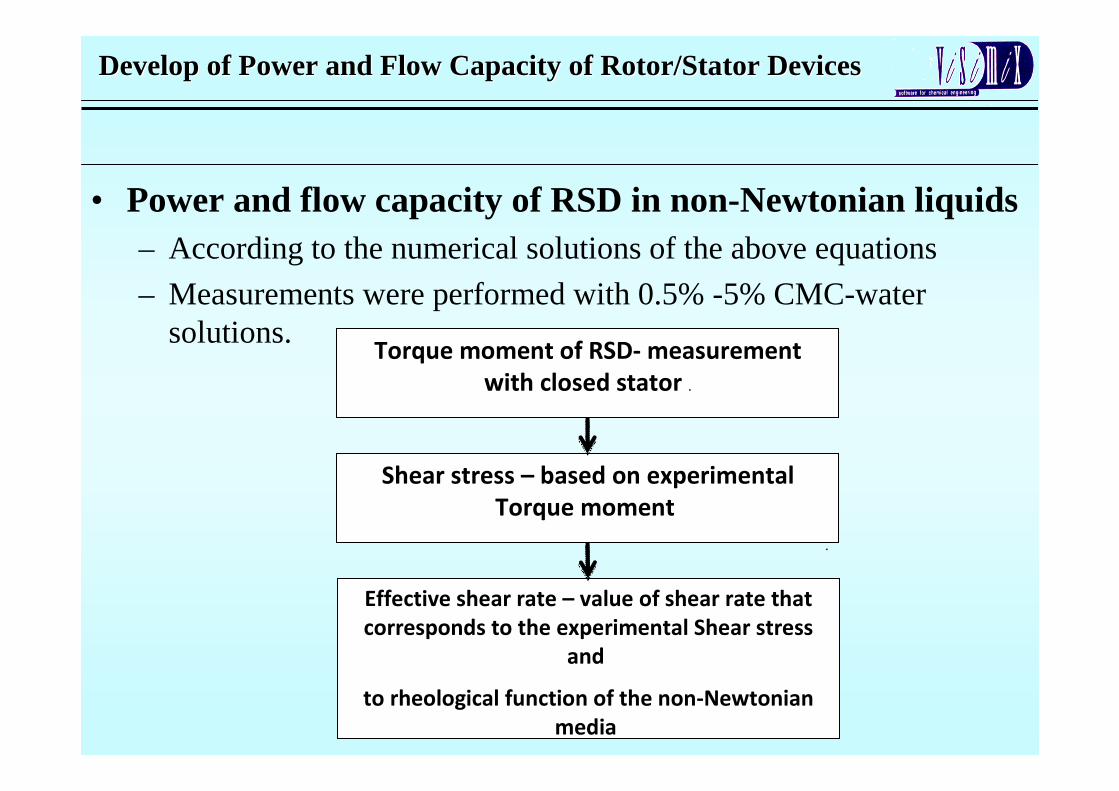
• Power and flow capacity of RSD in non-Newtonian liquids– According to the numerical solutions of the above equations
– Measurements were performed with 0.5% -5% CMC-water solutions.
Develop of Power and Flow Capacity of Rotor/Stator DevicesDevelop of Power and Flow Capacity of Rotor/Stator Devices
Torque moment of RSD- measurement
with closed stator .
Shear stress – based on experimental
Torque moment
.
Effective shear rate – value of shear rate that
corresponds to the experimental Shear stress
and
to rheological function of the non-Newtonian
media
Develop of Power and Flow Capacity of Rotor/Stator DevicesDevelop of Power and Flow Capacity of Rotor/Stator Devices
0500
10001500
20002500
30003500
40004500
0 500 1000 1500 2000
RPM
Sh
ear
Rat
e, 1
/s
Series1
Series2
0.1
1
10
0.1 1 10
Power-experimental, W
Po
wer
-cal
cula
ted
, W
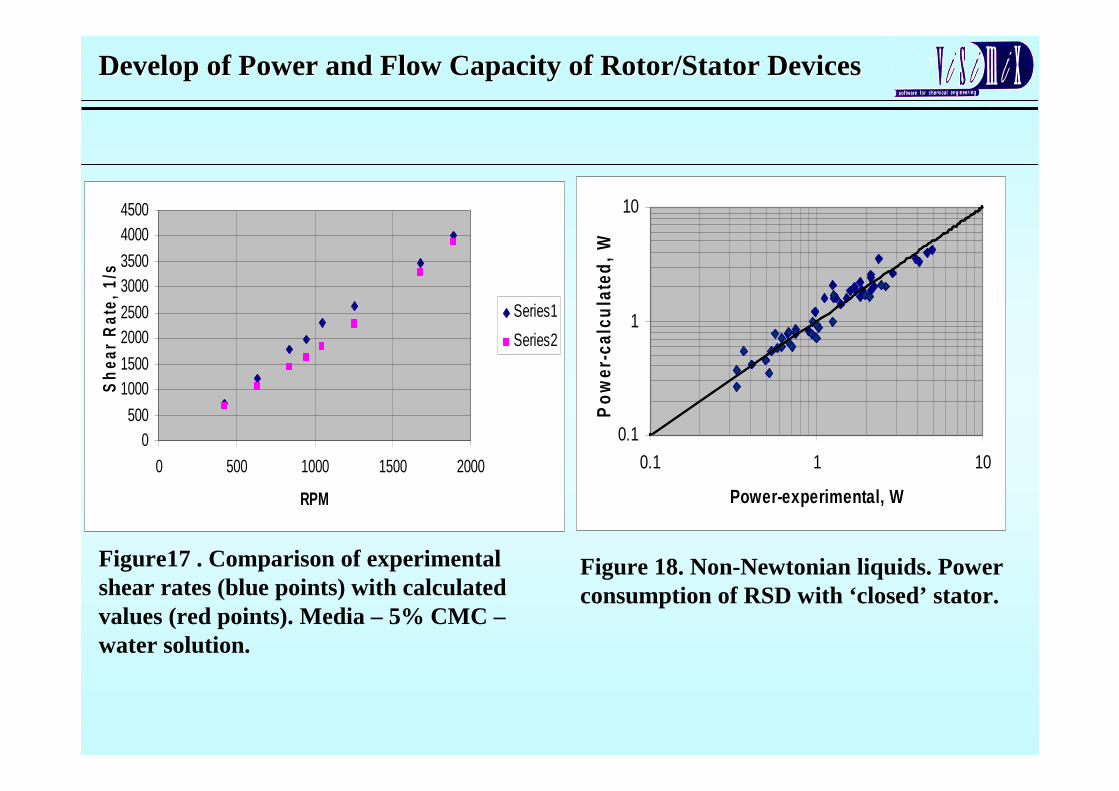
Figure17 . Comparison of experimental shear rates (blue points) with calculated values (red points). Media – 5% CMC –water solution.
Figure 18. Non-Newtonian liquids. Power consumption of RSD with ‘closed’ stator.
• Power and flow capacity of RSD in non-Newtonian liquids
• These average parameters are assumed to be connected it specific power in the RSD channels:
γaver= √ ( ε*ρ/µaver)
• Values µaver defined with the above equation are used for calculation of flow capacity and the corresponding constituent of power consumption of RSD in non-Newtonian liquids .
Develop of Power and Flow Capacity of Rotor/Stator DevicesDevelop of Power and Flow Capacity of Rotor/Stator Devices
Example 1Example 1
Scaling-up of shampoo manufacturing.
Problem:
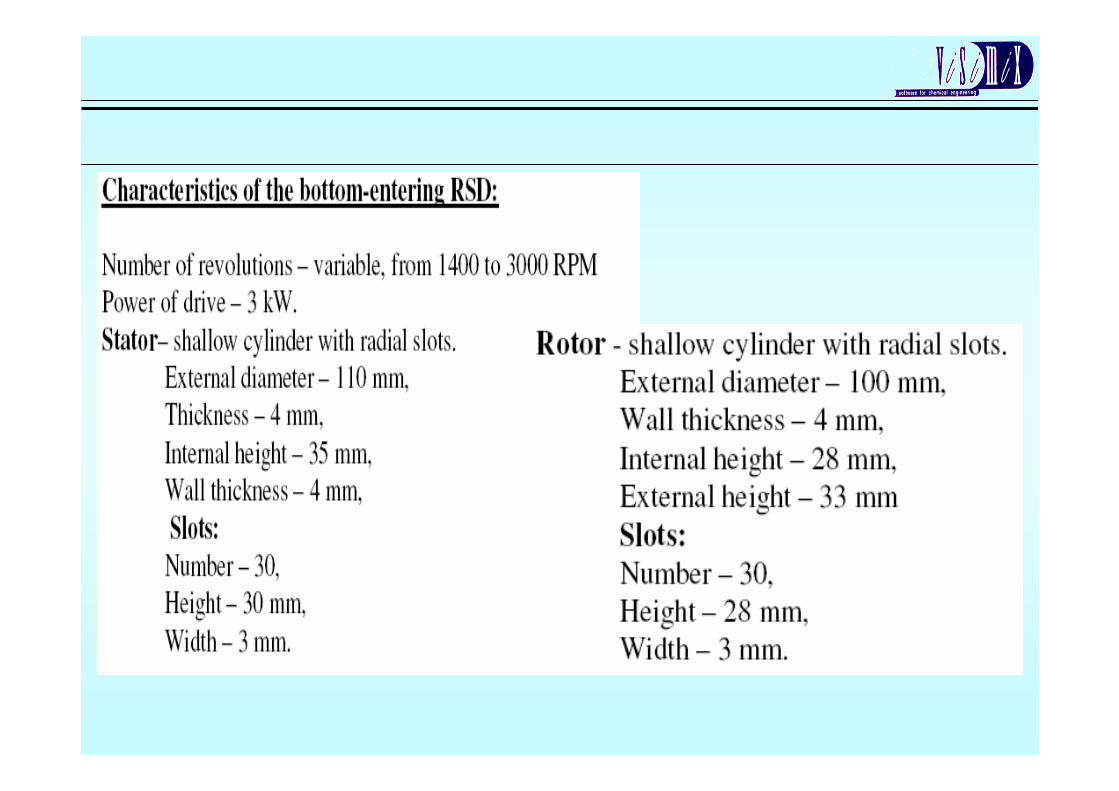
Check the possibility of manufacturing a shampoo in a 500 litre mixing tank with an anchor agitator and bottom-entering Rotor-Stator homogenizer, and evaluate expected duration of the operation.
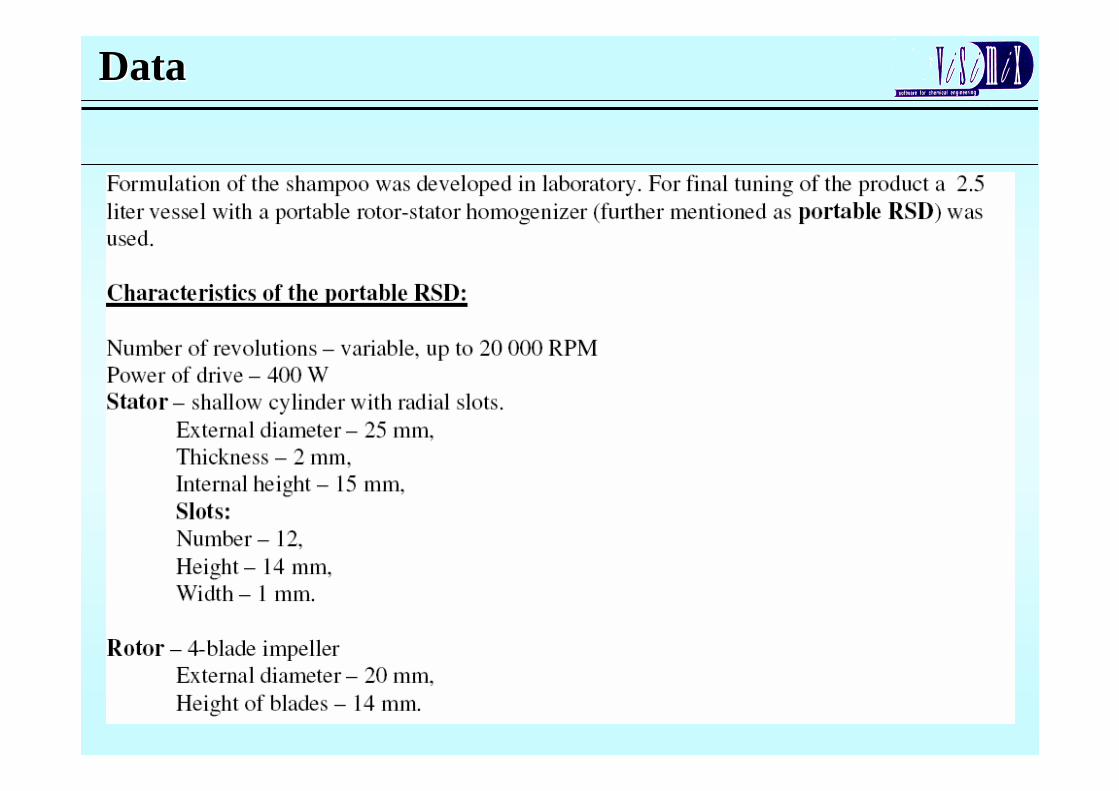
DataData
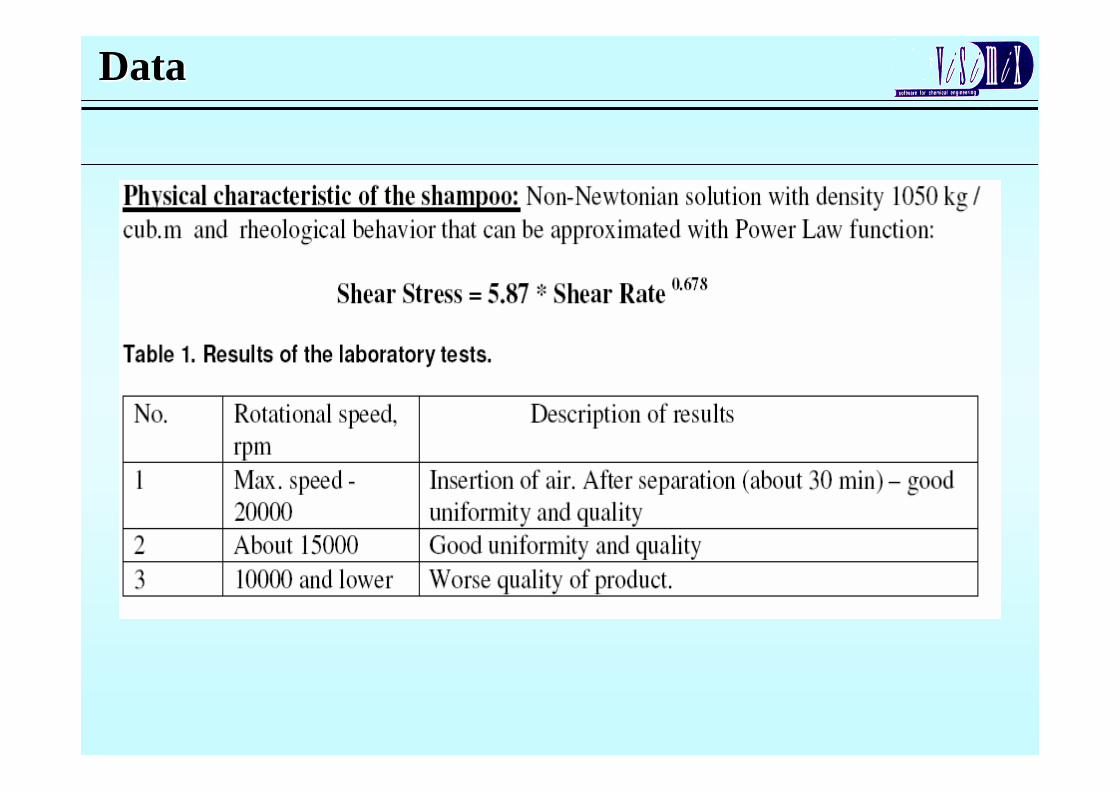
DataData
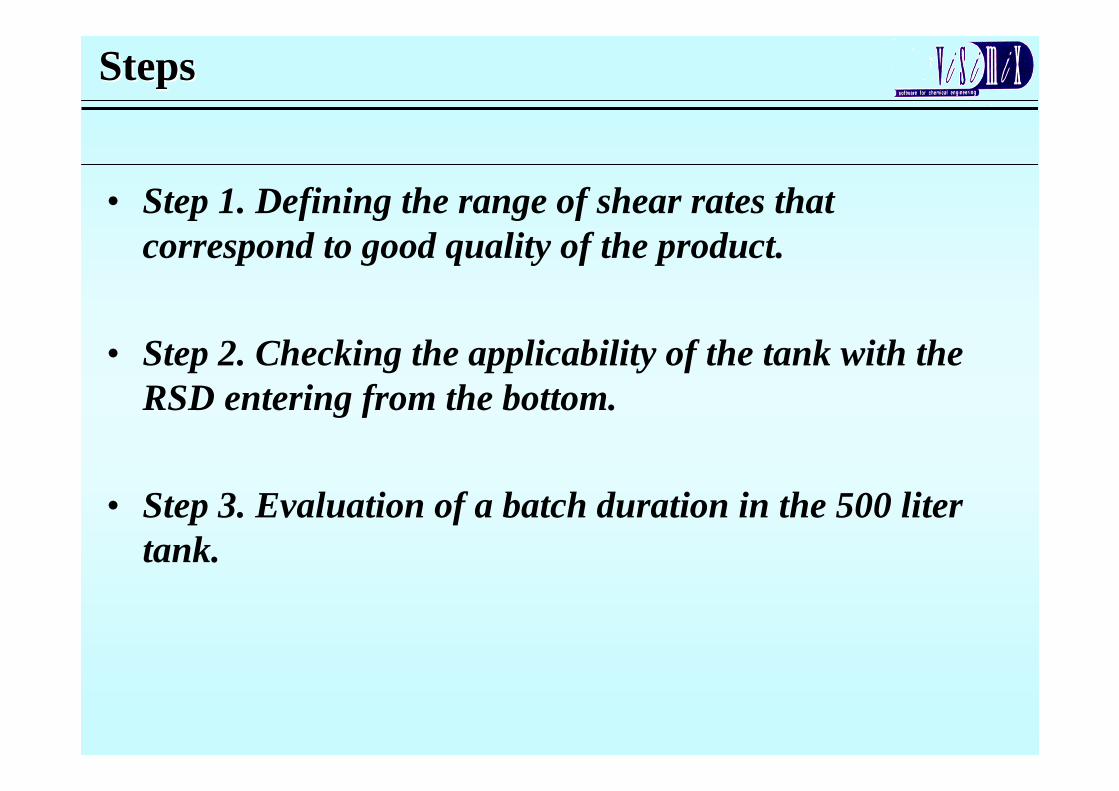
StepsSteps
• Step 1. Defining the range of shear rates that correspond to good quality of the product.
• Step 2. Checking the applicability of the tank with the RSD entering from the bottom.
• Step 3. Evaluation of a batch duration in the 500 liter tank.
ConclusionConclusion
Now you can:
� Eliminate Scale up Costs
� Increase the company knowledge of mixing and Scale Up
� Improve the process performance and increase company profit
� Evaluate a realistic and confident QbD (Quality by Design) for your processes