Boat #6 - SOLAR SPLASH
37
University of Southern Indiana 2016 Solar Splash Team Technical Report Boat #6 4 May 2016 Team Members Rachel Athippozhy ▪ Ryan Elpers ▪ Johnnie Guy ▪ Josh Guy Ryan Loehrlein ▪ Josh Terrell ▪ Jackson Traylor Faculty Advisors Dr. Paul Kuban ▪ Dr. Brandon Field ▪ Mr. Justin Amos
Transcript of Boat #6 - SOLAR SPLASH

University of
Southern Indiana
2016 Solar Splash
Team
Technical Report
Boat #6
4 May 2016
Team Members
Rachel Athippozhy ▪ Ryan Elpers ▪ Johnnie Guy ▪ Josh Guy
Ryan Loehrlein ▪ Josh Terrell ▪ Jackson Traylor
Faculty Advisors
Dr. Paul Kuban ▪ Dr. Brandon Field ▪ Mr. Justin Amos

1 | P a g e
EXECUTIVE SUMMARY
The main goal of The University of Southern Indiana’s 2016 Solar Splash Team is to place in the
top seven in the 2016 Solar Splash Competition. To achieve this goal, the team will need to
improve on every aspect of the boat.
The team for this year’s competition includes two electrical engineering students and five
mechanical engineering students. By creating a responsibility matrix, each sub system of the
boat has been assigned a primary and a secondary leader. The two leaders design and bring their
considerations and data to the entire team. These sub systems include the out drive, steering,
energy management, solar system, instrumentation, and motor and controller.
With a goal of placing in the top seven teams, the speed of the boat needed to be altered. To
change this, the team decided to design a surface drive for the boat. A surface drive is seen a lot
in shallow water applications like swamps. The propeller used for this application is a surface-
piercing propeller. These propellers will perform the best when it is operated half out of the
water.
New this year is an instrumentation panel designed by a group of seniors who graduated in the
fall of 2016. This instrumentation will monitor the battery voltage and the propeller rpm. The
program is also written for a sensor to determine the amount of ambient light. The ambient light
sensor will not be used in this year’s competition.
As far as the batteries go, the team will be using two different sets of three batteries to use the
maximum voltage of 36VDC and stay under the 100lb weight limit. The first set is three Optima
Red-Top deep cycle batteries rated for 132 amp-hours. The other set of three batteries are UPG
batteries and are rated for 150 amp-hours.
As a second year team, The University of Southern Indiana’s team will be one to not be taken
lightly. With many improvements made to the boat from last year, USI plans to place in the top
seven teams or better.

2 | P a g e
Table of Contents EXECUTIVE SUMMARY .......................................................................................................................... 1
I. Overall Project Objective .......................................................................................................................... 3
II. Solar System Design ................................................................................................................................ 3
III. Electrical System .................................................................................................................................... 4
IV. Power Electronics System ...................................................................................................................... 7
V. Hull Design .............................................................................................................................................. 7
VI. Drive Train and Steering ........................................................................................................................ 8
VII. Data Acquisition and Communications ............................................................................................... 20
VIII. Project Management .......................................................................................................................... 21
IX. Conclusions and Recommendations ..................................................................................................... 21
References ................................................................................................................................................... 21
Appendix A: Battery Documentation ......................................................................................................... 23
Appendix B: Flotation Calculations ............................................................................................................ 33
Appendix C: Proof of Insurance ................................................................................................................. 34
Appendix D: Team Roster .......................................................................................................................... 35
Appendix E: Responsibility Matrix ............................................................................................................ 35
Appendix F: Decision Matrix ..................................................................................................................... 36

3 | P a g e
I. Overall Project Objective
The driving force behind USI's goal to place in the top seven teams is to perform better in each
event. Last year, the boat never went faster than about 3.5 knots which is roughly 4 miles per
hour. The speed of the boat is the main focus for the team this year. This will in turn put the
team in a higher place than the previous year.
There have been no changes to the solar system design or the hull design. The hull was donated
to USI from Carnegie Melon University. This hull once competed in the Solar Splash known as
the "Hydra." As for the solar system design, the design from the 2015 competition won an
award. Due to the success of the design, it will not be changed for the 2016 competition.
The old out drive system, which was an out board style motor, has been scrapped and the team
will be using a straight shaft surface drive. Pulleys are also being used to increase the RPM of
the propeller compared to the motor shaft. A new motor was also purchased for the 2016
competition. A permanent magnet DC brushed motor will be used instead of the three-phase AC
motor that was used last year.
Not only is the team looking to improve the boat, but are also trying to improve the technical
report and the poster. The team did not perform well in either of the two categories in the 2015
competition. The change this many of the top technical reports have been analyzed and the team
will try to create a report worth looking at.
In conclusion, by redesigning the out drive and purchasing a new motor and controller, the team
looks to be a top contender on the water for this year’s Solar Splash Competition.
II. Solar System Design
A. Current Design/Analysis
Since the solar design from 2015 did well,
the team decided that no changed should be
made to the solar system design. The solar
panels are a unique monocrystalline high
efficiency style panel and each are 100W
each with a rated open circuit voltage of
17.7V. Figure 1 shows frame that the panels
are mounted to.
Two other types of panels were researched
thin film and crystalline. Crystalline panels
have been around longer than the thin film
technology, the efficiency is higher and they
also have a lower installation cost. Since
Fig 1: Solar Panel Frame

4 | P a g e
cost and efficiency are two important items on the agenda, the crystalline panels were reused.
The panels are mounted on PVC pipes and suspended above the driver. This helps eliminate any
shade that the driver may cast on the panels during the competition, and also acts as a shade for
the driver during the two-hour endurance race.
As stated, each panel is rated at 100 watts giving the entire solar system design a total of 400
watts staying within the 480W requirement. These panels are durable, lightweight and can be
configured in many ways. In the future, other teams may want to configure the panels in a
different fashion. The current panels give that opportunity to any of the following solar splash
teams.
III. Electrical System
A. Current Design
The electrical system design from the 2015 season did not work well for the Solar Splash Team.
A few major changes have been made to the system for the 2016 competition to improve the
performance of the boat.
Last year, the team created a decision matrix to determine what motor they were going to use.
From this, a Permanent magnet DC brushless motor was chosen. Due to the demand of this
motor, every company was on back order and had at least a six month waiting period. The team
turned to an alternative and decided to purchase a 3-phase AC motor with a controller. The
batteries produce a DC voltage and the motor controller had an inverter to convert the DC power
supply to an AC power supply. The motor chosen was the Motenergy ME 1115 PMAC with a
compatible Sevcon Gen4 AC motor controller. Unfortunately, the motor was rated for 96 volts
and 12hp. With the 36V limit, the motor and controller did not perform well and only generated
roughly 2hp. To conclude, the team wants to achieve a higher RPM and more horsepower from a
new motor.
B. Analysis of Design Concepts
Perhaps the most vital component to the Current Cutter’s success in each of the three
competitions is a reliable source of power. While the solar panels and batteries provide a power
source, the electric motor and motor controller allow this power to be used in mechanical means.
The electric motor draws current from the battery bank and transfers this in the form of torque on
an output shaft. The Montenergy ME1115 was very underpowered with the limit of 36V
allowed by the Solar Splash competition rules. In order to utilize all of the power stored in the
batteries, a more suitable motor, and consequently a controller, had to be selected.
Analysis of selecting a new motor began by recognizing where the old selection was lacking.
Testing was performed on the motor-controller setup, and a max RPM of 2100 at 3.6 Nm was

5 | P a g e
achieved. Research was performed on that particular model, and torque curves were analyzed.
While the ME1115 is listed as having 12 horsepower continuous, this is at a supply voltage of
96V. When at 36V, the power is less than 2 horsepower.
Various models of motors, both AC and DC, were analyzed for the Solar Splash application.
Torque curves were analyzed for each motor to conclude which would provide the most rpm and
torque while still being as efficient as possible. Weight was also considered, but most motors
analyzed were relatively close in weight. A conclusion was made on the ME0909 DC motor.
At 36V, the ME0909 is capable of a max rpm of 3300 and max torque of 143 lbin. Power can
also be observed, and at 162 amps of current, the ME0909 makes 4800 Watts, or 6.43
horsepower.
Since the ME0909 was a DC, permanent magnet motor, the previous Sevcon Gen4 AC motor
controller was not compatible. When selecting a new controller, one of the most important
aspects was programmability. The Sevcon, while an efficient and expensive piece of equipment,
takes much skill to program. In addition to purchasing the controller, a separate program must
also be purchased. A controller with a more user-friendly programming system was sought after
in order to ensure multiple tests at different settings could be performed on the ME0909 and
controller. This controller also had to be efficient and compatible with a DC permanent magnet
motor. The max current of the controller also had to be greater than the motor, allowing the
Current Cutter to utilize all of the ME0909’s power.
C. Design Testing and Evaluation
At this point in time only one short test was done using the new equipment. The red top optima
batteries were connected in series and to the motor and controller. A pre-charge resistor and
solid-state relay were used to help power the motor. By using a tachometer, the team measured
the speed of the motor at 100% and 50% throttle with no load.
By utilizing data from the drag test, the team was able to construct strategies for the competition.
The endurance curve is in Figure 2 while the sprint is in Figure 3. Since the force required to
propel the Current Cutter at different velocities was known, the power required from the batteries
could be calculated. For these calculations, a 75% propeller efficiency and a 90% motor
efficiency was assumed. As seen in the tables below, the optimum speed for the endurance race
to avoid premature battery depletion was 9 mph. For the sprint race, a maximum battery
depletion of approximately 3.5%. Last year, the team had reported no loss of voltage from the
batteries during the competition. After reviewing this information, the estimated speed of the
boat last year was only about 5mph. This would result in using less than 400W of energy. The
four solar panels each produced 100W therefore there was no drain from the batteries.

6 | P a g e
Fig 2: Endurance Race Strategy
Fig 3: Sprint Battery Depletion
0
2
4
6
8
10
12
14
16
18
20
0 1 2 3 4 5 6 7 8 9 10 11 12 13 14 15 16 17 18 19 20 21
Dis
tance
Tra
vel
ed (
mil
es)
Velocity (mph)
0
0.5
1
1.5
2
2.5
3
3.5
0 2 4 6 8 10 12 14 16 18 20
Bat
tery
Dep
leti
on (
%)
Velocity (mph)

7 | P a g e
IV. Power Electronics System
A. Current Design/Analysis
The original design includes three 12V Optima Red-Top batteries and three 12V UPG batteries.
The team will be using the same batteries that were used in the competition last year. Due to last
year’s design, the batteries were never fully depleted of electricity and have all been on trickle
chargers since the previous competition. Batteries are one of the most expensive parts of the
boat. By cutting the cost of the batteries out of the budget, more money can be spent on
enhancing the performance of the boat.
The three batteries will be connected in series to produce a maximum operating voltage of 36V.
Also connected to the batteries is the charge controller from the solar panels. The charge
controller for the competition this year is the same charge controller from the year before,
Morningstar TS-45. This charge controller has operation ratings from 12-48 volts and can
handle up to 45 amps. The TS-45 is a pulse width modulation charger which improves the
ability of the charger to effectively charge the batteries without overcharging. This will improve
battery charge capacity and overall life of the batteries. The Morningstar controller has a four
stage charging cycle which includes a bulk charge stage, in which the controller will allow
approximately 14.6 volts to enter the battery until it reaches 75%-85% capacity. The next stage
of the charging cycle is the pulse width modulation regulation. Once this occurs, the charge
controller delivers pulses of approximately 13.9 volts until the battery reaches 95% capacity. The
float charge is the next phase of the charging process. This float charge will match the
discharging rate of the battery to keep the battery fully charged. The TS-45 has circuitry to
prevent the batteries from being overcharged in this state.
V. Hull Design
A. Current Design
The hull design has not been changed from the previous year. The hull was donated to the team
from Carnegie Mellon University in Pittsburgh, PA. The dimensions of the hull are unchanged
at 17 feet long by 22 inches deep by 40 inches wide. The hull alone weighs about 120 lbs. The
bottom of the stern has a flat bottom, much like a johnboat would have. Moving forward on the
boat, the hull has an aggressive V shape that is designed to help reduce surface area when the
boat is on plane.
B. Design Testing and Evaluation
To perform testing on the hull, the team traveled an hour and a half to Patoka Lake. In order to
test the hull as well as the driveshaft components, a drag test was performed. This process is
explained below in the drivetrain and steering section. Results are also seen below in Table 1.

8 | P a g e
R² = 0.9825
0
20
40
60
80
100
120
0 5 10 15 20 25
Ten
sio
n F
orc
e (
lbf)
Speed (mph)
Drag Test Data
Table 1: Drag Test
Data
Speed
(mph)
Force
(lbs)
2.8 7
6.15 26
7.27 35
5.59 26.5
7.83 38
11.8 70
20 110
5.03 17
6.15 30
7.27 34
10.63 50
17.34 86
4.47 16
VI. Drive Train and Steering
A. Steering
1). Current Design/Analysis
The existing steering system, shown in Figure 4, is a rack and pinion design. The utilization of
this existing system was highly desired as
to minimize cost, so an addition to the
steering system compatible with the
proposed surface drive outdrive was
designed. The rack and pinion steering
system thrusts in either direction as the
steering wheel is turned. The thrust rod is
located directly above the stern. This was
the obstacle that had to be overcome by
the new design, as the new design had to
thrust in either direction two feet behind
the stern attached to the surface drive
outer housing.
Fig 4: Steering Cable

9 | P a g e
As seen in Figure 5, two pulleys are mounted to the sides of the boat. A tab was created on the
outdrive outer housing. A rope runs from this tab around both pulleys. The existing rack and
pinion steering system grabs the rope and pulls in either direction as the driver turns the steering
wheel. Due to the fact that the outdrive has
trimming abilities, the necessary length of
the rope varies slightly. A tensioner spring
was inserted into the rope loop to solve this
problem as it applies a tensioning force to the
rope which reduces slack. A minimum
tension force of 10lbf was desired, so a
spring was selected with a constant of
5.82 lbs/in. The spring is to be inserted into
the rope loop while the outdrive is at its
lowest possible trim. The spring will be
stretched four inches and inserted into the
rope loop, in order to allow tension to be
applied even at the highest trim setting.
B. Drive Train Design
1). Existing Design
The 2015 USI Solar Splash, team designed, assembled, and raced their solar powered boat in
Dayton, Ohio. This was the first year that USI entered the competition. In order to cut costs and
manage tasks to meet the deadlines, the 2015 team used a donated hull from Carnegie Mellon
University. This hull is a planing style hull constructed of wood and fiberglass. The hull
measures 17 ft and weighs 120 lbs. A Montenergy ME 1115 AC electric motor, coupled with a
Sevcon Gen4 controller was chosen by the 2015 team to power the boat. The Gen4 controller
and ME 1115 were connected to a powertrain system shown in Figure 6. This shows the
Montenergy electric motor (shown in grey) mounted vertically. The output shaft is facing
downwards, and is coupled to the main driveshaft by a mechanical coupling and setscrew. The
driveshaft travels through the driveshaft housing (shown in orange), and into the lower unit of
the outboard, shown in Figure 6. The propeller for the boat attaches to the propeller shaft,
shown as the horizontal shaft in Figure 7. This shaft has 8 splines on it to secure the propeller.
Last year’s team won the best solar system design, but had one of the slowest boats in the
competition at a top speed of 7 miles per hour. The boat was so slow, in fact, that even after the 2
hours of continuous run time of the endurance challenge, the batteries still read fully charged
(Wargel, 2015). Due to the fact that speed is an essential component of the drag race, endurance
challenge, and slalom challenge, the need to increase the boat’s speed is one of the most vital
issues to address this year.
Fig 5: New Steering System

10 | P a g e
Fig 6: Current design for Solar Splash boat
Fig 7: Lower unit of outboard
The existing design was analyzed and causes for a slow acceleration and low top speed were
identified. These issues began with the ME1115 motor and Sevcon Controller. The ME1115,
while very efficient at voltages between 0-96 volts, is designed for greatest performance at 96
volts. The 2015 team purchased a complete kit with throttle, controller, motor, and all wiring

11 | P a g e
from for the ME1115 motor. This kit was designed to replace the large diesel engines in
sailboats to provide a clean and quiet alternative drive system. These boats are able to have large
banks of batteries, or utilize newer lithium ion batteries to power the motor. Lithium ion
batteries are not allowed for the Solar Splash boat, as the only type of battery accepted at the
competition is the traditional lead acid battery. When connected to a lower voltage such as the
Solar Splash limit of 36 volts DC, the motor draws a very low amount of current resulting in a
low RPM and small amount of output torque. The rpm of the output shaft of the ME1115 motor
was measured to be 2150. At full speed, current draw was measured at 24 amps, and with a
torque constant of 0.15 Nm/amp, the torque produced was calculated to be 3.6 Nm. This results
in a total horsepower of less than 2.0. After travelling through the lower unit of the outboard to
the propeller shaft, this number would shrink even more. From previous boating experience as
well as calculations based on drag forces, it was determined that 2 horsepower would not be enough to
power the Solar Splash boat to the desired speed of 20 mph. Programming the controller to different
parameters could slightly improve performance, but the program used to modify the Gen4 costs more than
$700 and requires extensive knowledge of the software.
2). Analysis of Design Concepts
The drive system chosen for the 2016 Current Cutter was a surface drive. These unique designs
are used on a variety of applications. One variation is shown in Figure 8. Like the term
“surface drive” suggests, these outdrives are meant to be operated on the surface of the water.
The propeller of a surface drive is specifically designed to operate in such a way as well. As it
rotates, the three to four bladed surface piercing propeller only has half of its blades submerged
in the water. As a blade re-enters the water, it transmits an impact force to the water, propelling
the boat in a forward direction. Surface drives were discovered by accident, when Donald
Campbell discovered that at high speeds, the stern of his craft would lift and create a
“roostertail” of water behind it. This “roostertail” was caused by the propeller lifting out of the
water and becoming a surface piercing propeller. Due to the fact that the vessel looked to be
“riding” on the propeller, this design was nicknamed “prop rider” (Smith 2010).
Fig 8: Surface drive outdrive design

12 | P a g e
One large advantage of the surface drive design lies in the significant decrease in drag forces
acting on the mechanical parts of the outdrive. With a surface drive, only a small section of the
rudder and half of the propeller is in contact with the water at one time. When compared to the
surface area that is submerged with an outboard or inboard design, this significant drop in drag
force is not surprising. Another advantage is related to the torque required to spin the propeller.
Since the propeller is only halfway submerged, less torque is required to spin it when compared
to a completely submerged propeller (Smith 2010). Also related to this is the rpm of the
propeller shaft. A higher rpm is achieved due to the smaller amount of torque required. Another
advantage, although one that may not play a large role with the Current Cutter, is that surface
drives are able to run in a very small water depth. For this reason, variations of the surface drive
are used for hunting waterfowl and other shallow-water applications.
Momentum theory proves larger propellers exhibit higher efficiencies than smaller ones at a
given thrust and speed (Peterson, 2005). Traditional, fully submerged propeller selection is
almost always maximizing the propeller diameter while balancing performance limiting factors
such as blade clearance from hull, maximum vessel draft, shaft angle, and engine location.
Designers choose the propeller with the largest diameter that meets these criteria, and this choice
often comes with a loss of efficiency (Peterson, 2005). All of these limitations are applicable to
both outboard and inboard outdrive applications, but a surface drive liberates the design from
these restrictions.
The most notable advantage of surface drive applications over conventional submerged outdrives
is the elimination of cavitation. A propeller works by creating a low-pressure area on the
forward face of the propeller, which creates a forward thrust. Problems arise when this pressure
reaches the vapor pressure of the water (Casciani, 2015). The water vapor bubbles collapse and
exert a large force often exceeding 7 kg/cm2. This force causes propeller damage as well as loss
of speed (Casciani, 2015). Surface piercing propellers eliminate cavitation by bringing air
pockets next to the propeller with every stroke of propeller rotation. When the pressure drops,
these air pockets compress instead of vaporizing the water. There is only a slight performance
loss by allowing air into cavities adjacent to the propeller, due to the atmospheric pressure
pushing against the blades, but this pressure is negligible compared to the thrust pressure of the
propeller (Casciani, 2015).
Surface drives also have distinct disadvantages when compared to other outdrives. Because of
the “rooster tail” of water that is created by the propeller, these applications are not used often on
pleasure boating applications. While this might affect the Current Cutter if the team planned to
pull any water-skiers, there are no rules about the wake that can be produced by the outdrive.
Another slight disadvantage is that the propeller creates a larger amount of noise impacting the
surface of the water when compared to submerged propellers. Again, while this disadvantage
may play into other applications, noise is not a factor with the Solar Splash competition. Perhaps
13 | P a g e
the only disadvantage applicable to the Current Cutter application is the availability of parts.
When compared to a more common outdrive system such as the outboard, surface drive
propellers and accessories are hard to find.
In order to determine which of the three outdrives discussed prior was the best option for the
current cutter, a decision matrix was used. Although some designs combine two of the three
categories, most designs can be placed in one of these three categories. Requirements and
criteria were formed and placed into the decision matrix. Two requirements of a chosen outdrive
design were identified to be a maximum cost of $2,500 and compliance with all Solar Splash
regulations. Five criteria were identified as crucial to our application: estimated cost, frictional
drag, cutting of hull, steering modification, and trim options.
Estimated cost is a necessary criterion because a lower cost outdrive allows the team to allocate
funds to other areas of the boat that are in need of improvement. This was given a 5% weight in
the decision matrix because the outdrive is the largest modification planned for the boat this year,
and a higher performing outdrive with a possible higher initial cost is acceptable in order to use
for future competitions. An outboard outdrive would be the cheapest of the three choices due to
the fact that an outboard outdrive is already assembled. Changes would still need to be made
however, so it was estimated to cost $500 to optimize the existing outboard design. Using an
inboard type outdrive was estimated to cost $1,000 due to the necessity of a complete new
outdrive and rudder assembly. Using a surface drive outdrive was estimated to cost $900 in
order to cover materials for the outdrive design, a new surface piercing propeller, and the
steering modification.
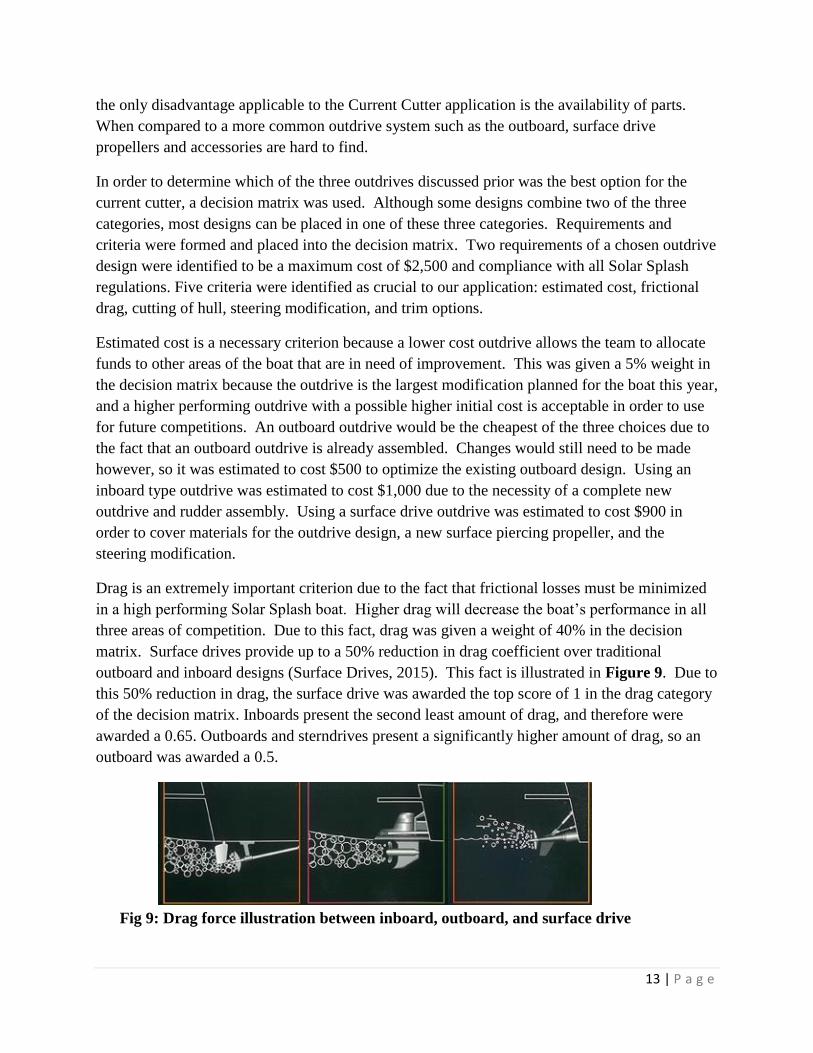
Drag is an extremely important criterion due to the fact that frictional losses must be minimized
in a high performing Solar Splash boat. Higher drag will decrease the boat’s performance in all
three areas of competition. Due to this fact, drag was given a weight of 40% in the decision
matrix. Surface drives provide up to a 50% reduction in drag coefficient over traditional
outboard and inboard designs (Surface Drives, 2015). This fact is illustrated in Figure 9. Due to
this 50% reduction in drag, the surface drive was awarded the top score of 1 in the drag category
of the decision matrix. Inboards present the second least amount of drag, and therefore were
awarded a 0.65. Outboards and sterndrives present a significantly higher amount of drag, so an
outboard was awarded a 0.5.
Fig 9: Drag force illustration between inboard, outboard, and surface drive

14 | P a g e
Estimated hull cutting is important in order to minimize fiberglass patching of the hull.
Fiberglass patches can be unreliable at times, and a leak in the hull could prove to be problematic
on competition day. Therefore, hull cutting was awarded a weight of 10%. The outboard
outdrive type would not require any cutting of the hull; therefore, it was awarded the highest
score of 1. The surface drive was awarded a 0.5 since cutting would be required but it would
only be through the stern part of the boat that is reinforced with plywood. The inboard outdrive
type was awarded a 0.1 since a large amount of cutting would be required in the center section of
the vessel’s fiberglass hull.
Necessary steering modification was chosen as a criterion because a large amount of steering
modifications would complicate the design process and potentially cause the project to exceed
the budget. This criterion was given a 5% weight because alterations could be made, but they
would take time. An outboard style outdrive would not require any steering modifications, so it
was awarded the highest score of 1 in the decision matrix. The inboard type outdrive was
awarded a 0 since a completely new steering system would likely be needed due to the location
of the inboard and the incorporation of a rudder system. The surface drive type outdrive was
awarded a 0.85 since only some steering modification would be needed due to the location of the
outdrive being on the stern.
Efficiency was chosen as a criterion because a high efficiency is one of the main goals of the
Solar Splash boat. Due to this large importance, efficiency was given a weight of 75% in the
decision matrix. Surface drive type outdrives provide the advantage of being 15-30% more fuel
efficient (Surface Drives, 2015). The advantage was assumed to be 30%, so the inboard and
outboard type outdrives were awarded scores of 0.75. The surface drive was awarded a score
that was 130% of the outboard score, the perfect score of 1.
Trim ability was also a desired capability because the line of propulsion should be directly in line
with the center of mass of the boat and its cargo. The term “trimming” a boat refers to the angle
at which the motor propels water with respect to the hull. Trimming an outdrive down will result
in a larger upward force on the hull, while trimming up will result in thrust force parallel with the
surface of the water. The ability to move the center of gravity as needed was desired, so the
ability to trim is a large benefit. The existing center of gravity was calculated to be 163” behind
the bow, 0.15” starboard of centerline, and 20” above the boat floor. Trimming is also important
to helping the boat plane. Getting the Current Cutter to plane is another one of our main goals.
The boat will plane when most of the boat’s weight is supported by hydrodynamic forces, not
buoyant forces. When on plane, less of the boat’s hull is in contact with the water, resulting in a
lower drag force. Because trimming significantly aids planning, trim ability was given a 15%
weight in the decision matrix. Both outboard type outdrives and surface drive outdrives are
capable of trim while inboards are not. Therefore, outboards and surface drives were awarded
scores of 1, the highest score in the decision matrix, and the inboard type was awarded a 0.

15 | P a g e
The totals for each outdrive can be seen in the rightmost column of the table located in the
appendix. As can be seen in the table, the surface drive, obtaining a score of 0.9, proved to be
the best choice while outboard was second with a score of 0.78 and inboard was third with a
score of 0.48. Due to these promising results, a surface drive type outdrive was chosen to begin
the design process.
2.) Design Evaluation
Once an acceptable source of power was selected, a method of transferring this rotational energy
into the drive shaft of the outdrive had to be designed. Several options were considered. The
first and simplest is a direct drive system. In this style, the output shaft of the motor is coupled
directly to the driveshaft. Benefits of this are simplicity and cost, however, no manipulation of
rpm or torque is achieved. Output rpm and torque of the motor is precisely what is delivered to
the driveshaft. For the Current Cutter outdrive, a higher rpm was desired. Since a surface drive
requires less torque to operate than a conventional submerged propeller design, a higher
operating rpm is achievable. In order to increase the drive shaft rpm, a system involving
sprockets, gears, or pulleys was determined to be preferable.
When considering a gear increaser, the key criteria were weight, cost, efficiency, and ease of
installation. A design in which the gear ratio could be adjusted for testing was also favorable.
Due to this, a pulley system was concluded upon. Out of the three, a belt and pulley system was
the least cost, easiest to install, lightest, and easiest to modify. Efficiency was an issue, but was
addressed in the design of the pulleys and selection of the belt(s).
The goal rpm of the propeller on the Current Cutter was determined to be 5000. Technical specs
for the ME0909 were consulted to acquire the predicted rpm of the output shaft at 36VDC.
Given this, a gear increaser of approximately 1.5:1 was calculated to be needed. To begin the
design of the pulley system, measurements were taken of the inside of the Current Cutter where
the motor would be mounted. A center-to-center distance of 12” was determined to be suitable
to allow enough room for installation of the bilge pump and other necessary equipment in the
bottom of the boat. A V-belt system was chosen to increase the contact area between the pulley
and the belt. V-belts have less slip involved in them, making for an overall more efficient design.
For sheave dimensions, the horsepower rating of the ME 0909 was used. Due to the max
horsepower of 12, it was determined that more than one class A belt was needed, or one class B
belt.
The minimum sheave diameter for a class B belt was too large to achieve the desired output rpm,
so a class A belt system was chosen. The driving sheave was chosen to have an outside diameter
of 3 inches, and the driven sheave consequently had on outside diameter of 4.5 inches minimum.
Using AutoCAD, the pulley layout was sketched and an overall length of the belt was measured
to be 35.849 inches. For this reason, an A35 polyamide belt was chosen. The pitch length, Lp,

16 | P a g e
was calculated to be 35.83 inches, so a tensioner was determined to be needed to ensure enough
tension on the belt to avoid slipping. The allowable horsepower for each belt was calculated to
be 8.4. Since the ME0909 is capable of exceeding this in the sprint competition given enough
electrical current, a second A35 belt was added to the design. To accommodate the second belt,
driven and driving sheaves were selected to be double-groove models. An AutoCAD sketch of
the pulley layout is shown in Figure 10.
Fig 10: Pulley Design Layout
The first step in the driveshaft design was the selection of a CV joint to design the rest of the
driveshaft components around. The implementation of a CV joint into the surface drive design
allows for changes in steering and trim without the addition of a rudder. When searching for CV
joints, four things were considered: horsepower rating, size, price, and availability. It was
determined that CV joints on ATVs would be sized the closest to the needs of the Current Cutter.
They are also designed for large torque and RPM due to the applications the vehicles are used
for. The CV joint that was selected was the front right CV joint axle from a Honda TRX450
Foreman 4x4. This axle is designed for a 26.9hp ATV which is well over the 6hp that is
expected from the Current Cutter. Once the CV joint was selected, the rest of the driveshaft was
designed. A ¾” driveshaft was chosen due to the fact that most propellers fit on ¾” spline shafts.
The material selected was stainless steel, and this produced a factor of safety of 19. A housing,
shown in Figure 11, was also designed because rotating shafts in a fluid contribute to frictional
drag more than stationary shafts. Two needle roller bearings were selected to encompass the
driveshaft in the outer housing, and the specifications are included in the appendix. A pillow

17 | P a g e
block bearing was selected to support the driveshaft on the inside of the vessel, and its
specifications are also displayed in the appendix.
Fig 11: Exploded view of the driveshaft, housing, and three bearings it encompasses
Force Distribution
Adequate force distribution was crucial to the designed model due to the fact that the selected
CV joint is not rated for axial loads. In order to quantify the amount of force exerted on the
outdrive design from the propeller, a drag test was performed. Simulations were considered, but
it was determined that an actual experiment would provide more accurate data for the design
decisions. Two different types of drag forces exist on ships: wave making drag and frictional
drag. A ship traveling through water creates a characteristic pattern of waves that originate from
both the bow and stern. Creating these waves requires energy, and this energy loss is considered
wave-making drag. If it were not for these wave making drag forces, speeds of boats would be
significantly faster, and hull designers have only been able to improve a ships resistance to these
drag forces by a small amount (Gillmer, 2016). Frictional drag is also present, and it is
dependent on surface roughness, area, velocity, and density of the fluid. The drag test measures
the sum of all of these different drag forces exerted on the Current Cutter’s hull. The drag test
consisted of towing the Current Cutter behind another vessel at different, constant speeds. The
goal of the Solar Splash team was to implement a boat capable of achieving a speed of 20mph,
so speeds from 0-20mph were used in this test. The tension in the towrope was measured at each
speed, and this force was assumed to equal the sum of the wave making and frictional drag
forces due to having no acceleration. The data from the drag test can be seen in Figure 12. As
seen in Figure 12, the drag forces at speeds of 0-20mph exhibits a linear trend with a R2 value of
0.9825. The drag force as a speed of 20mph was 110lbf, so this was the minimum force that the
outdrive should be able to withstand.

18 | P a g e
Fig 12: Drag Force Quantification Test Data
The force exerted on the driveshaft from the propeller must be transferred to the outer housing
prior to the CV joint. A thrust bearing was selected in order to achieve this. The thrust bearing
that was selected was a TC1220 thrust needle roller bearing. This bearing was selected due to its
low cost, capability of withstanding 10,500lbf statically and 2,900lbf dynamically which is well
over the requirements. The use of a thrust bearing required the use of a collared driveshaft. The
collar on the driveshaft was dimensioned so that half of the rollers on the TC1220 thrust bearing
were in contact with the driveshaft. This allows for adequate clearance between the outer
housing and driveshaft. A collar was also added to the outer housing design for the opposite side
of the thrust bearing to ride against. The same clearance dimensions were used for the housing
collar as the driveshaft collar. With the addition of the thrust bearing and collars, the force will
successfully be transmitted from the driveshaft to the outer housing. Figure 11 shows the collar,
thrust bearing, and roller bearings. The force must then be transmitted to the stern of the boat,
while still having the ability to rotate for steering and trim. A ball and socket design was
selected to achieve these requirements. The ball was designed to attach to the outer housing and
encompass the CV joint, while the socket was designed to attach to the stern and surround the
ball. The ball and socket were dimensioned according to the CV joint that was selected. A 40-
degree steering and trim ability in each direction was desired, so the ball was dimensioned to
allow these capabilities. The material was selected as to minimize weight and cost while still
being capable of withstanding the thrust forces from the propeller. 6061 aluminum was selected
due to its relatively low cost, high availability, low weight, and sufficient yield strength. Figure
13 shows the three components that make up the ball and socket design.
R² = 0.9825
0
20
40
60
80
100
120
0 5 10 15 20 25
Ten
sion
Forc
e (l
bf)
Speed (mph)
Drag Test Data

19 | P a g e
Fig 13: Three components that make up the ball and socket design
In order to determine how the ball, socket, and driveshaft housing would perform under the
thrusting force from the propeller of the Current Cutter, SolidWorks was utilized. Simulations
were performed on each component, first adding the measured 110 lbf, and then at 300 lbf to
ensure a large factor of safety was achieved. For all bolted assemblies, bolts were torqued to 50
ftlbs.
The ability to trim was a requirement of the Current Cutter’s new outdrive system. Most boat
hulls are designed for optimum performance while operating parallel with their at-rest waterline
(Armitage, 2016). The required angle of trim can vary with different water conditions, weight
distribution, and velocities. A properly trimmed boat operates at its peak efficiency by
minimizing the amount of hull in contact with the water, therefore minimizing drag forces
(Armitage, 2016). This is especially important to the Solar Splash design, as efficiency is
crucial. Due to the fact that the necessary trim angle can change with speed, a trim system that
could by adjusted at any point during operation was needed. In order to accomplish this, an
electric linear actuator was chosen and implemented. An electric linear actuator was the best
option for this application due to their relative low cost, high availability, and ability to be
operated using the boat’s batteries. A tab was added to the outer housing of the outdrive to serve
as a connection point for the actuator. This tab can be seen in Figure 11.
For a zero-degree trim angle, the needed length of the actuator was determined to be 24”. An
actuator was selected with 24” within its range of motion, while still having enough retraction
and extension ability to give the outdrive trimming capabilities of 30 degrees in either direction.
The linear actuator selected was shown in Figure 14. A three-position toggle switch was utilized
to control this actuator.

20 | P a g e
Fig 14: Electric linear actuator chosen for the Current Cutter trimming design
VII. Data Acquisition and Communications
A. Current Design
From the rookie year of the team, there was no Data Acquisition or communication hardware in
place. This year the team will be using an Intel Galileo which was programmed by a senior
project for the Current Cutter. The Intel Galileo is a microcontroller board which contains a 32-
bit Pentium class chip system (also referenced as a data sheet). This board was programed to be
universal by adapting and modifying the functionality of the digital pins (ARED and GND pins,
the analog inputs (ICSP and UART port inputs), and the code functionality by using an Arduino
Uno R3 pinout system. With the multi-functionality the microcontroller can monitor a variety of
systems but its main purpose is to monitor the voltage of the batteries and the RPM (revolutions
per minute) of the propeller. Even though there will only be voltage and rpm digital outputs the
Data Acquisition can be varied to read temperature, boat speed, and ambient light with
modifications to the hardware in the future. All of these features will help the skipper to
determine how fast to go during each event based upon RPM and battery voltage levels. Since
the team has never used DAQ, this will be a good year to test the equipment and upgrade in the
future.

21 | P a g e
VIII. Project Management
When working with seven different team members it can be difficult to efficiently complete
tasks. A responsibility matrix was made to help hold each team member accountable for his or
her job. Each student was a primary leader for at least one item and can be secondary for many
other items on the list. The responsibility matrix can be seen in Appendix E. The team also had
weekly meetings to discuss ideas and to see the progress on the boat. The team needed to work
much more than just an hour a week after the meeting to ensure the boat was competition ready.
The University of Southern Indiana has an Applied Engineering Center toward the back of
campus. This is where the team would work on the boat and have the meetings. There were also
many weekends spent working. Time management was also key to the success of the team. It is
difficult to find a time when the entire team can meet so once one time was found that is when
we met for the entire semester.
IX. Conclusions and Recommendations
In conclusion, the work on the boat did not necessarily start until early January. The team is
excited to see how the 2016 competition will go. As a second year team, the members have a
better understanding of the competition and procedures. As stated earlier in the report, the drive
train was the biggest change to the boat this year. Changing from an out board style motor to a
straight shaft surface drive. More testing needs to be done on the boat and the batteries before
the competition. As it sits now, the boat is not ready for the water. The surface drive has not
been fully machined. The team plans to have the boat in the water at least two weeks before the
competition to do testing. A lake at the university will be adequate for the testing. Placing in the
top seven teams for the competition should be no problem for the team this year. After doing
some testing to find to optimum operation of the boat, the team will be ready for the trip to
Dayton.
References
Hale, J. (n.d.). Propeller Basics. Retrieved 2015, from
http://www.propellerworld.co.uk/Prop_Basics,_how_propellers_wor.html
Hemmel, J. (June 20, 2011). Outboard Advantages. Boating Magazine.
Pudney, S. (2015). Outboard vs Inboard: How Do You Choose? Retrieved 2015,
from http://www.powerequipment.com.au/outboard-vs-inboard/

22 | P a g e
Rules of SOLAR SPLASH 2015. (2015). Retrieved 2015
Wargel, C., Richard, P., Ballard, N., & Kaiser, J. (2015). Current Cutter #12(1st ed., Vol. 1, p.
29). Evansville, IN.
23 | P a g e
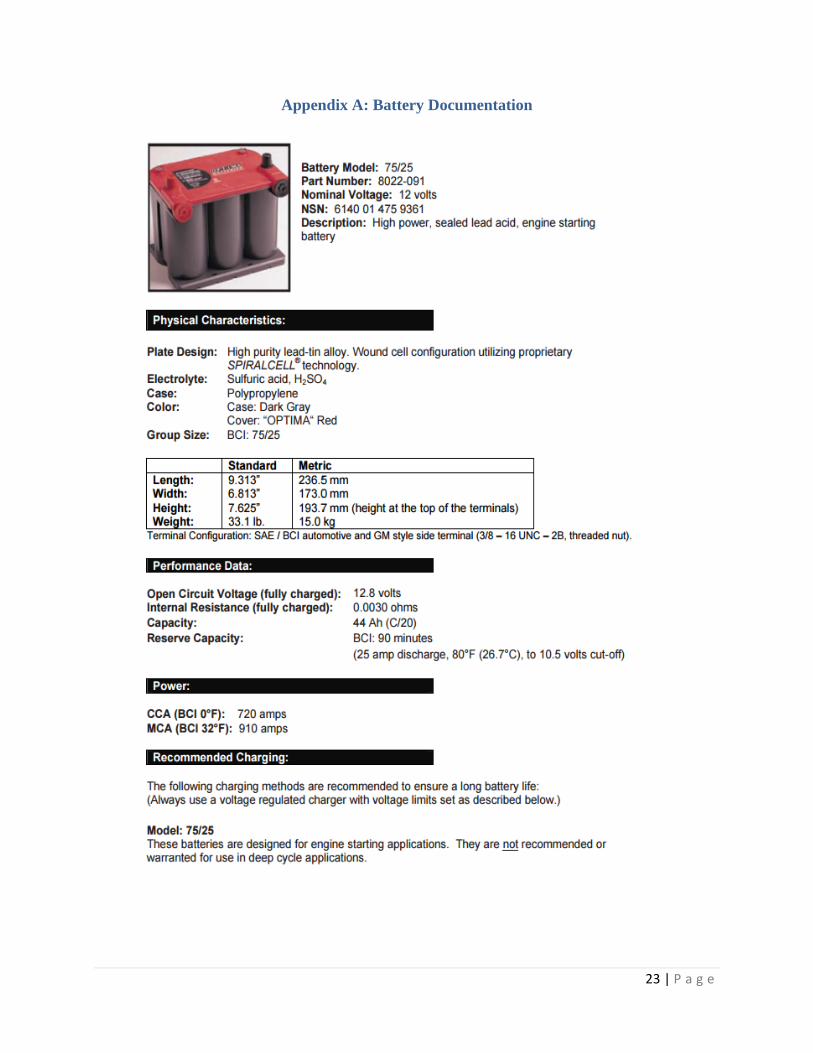
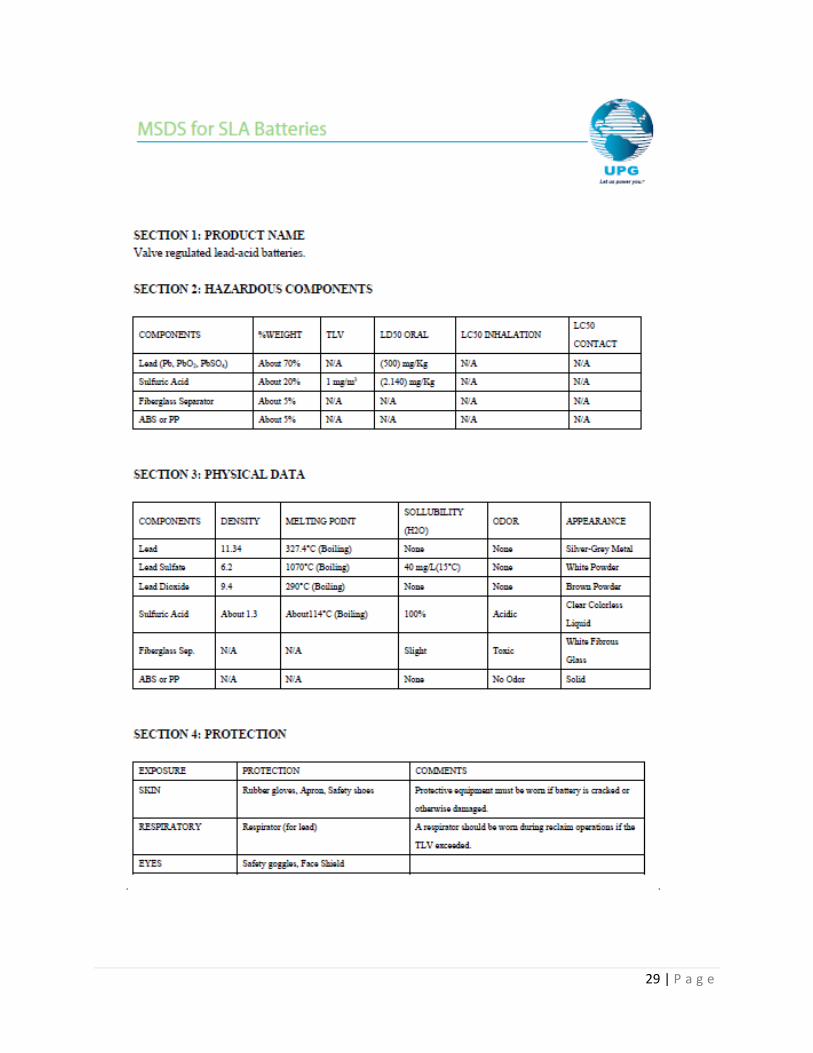
Appendix A: Battery Documentation

24 | P a g e

25 | P a g e

26 | P a g e

27 | P a g e

28 | P a g e
29 | P a g e

30 | P a g e

31 | P a g e

32 | P a g e

33 | P a g e
Appendix B: Flotation Calculations
The 20% safety factor to ensure the boat stays afloat even if the boat is full of water. This was
found by using the following equation.
𝐹𝑏𝑢𝑜𝑦𝑎𝑛𝑡 = 1.2 ∗ 𝑊𝑇𝑜𝑡𝑎𝑙
𝐹𝑏𝑢𝑜𝑦𝑎𝑛𝑡 is found by calculating the volume of everything that will remain in the boat if it were
to fill with water. The volume is then multiplied by the specific weight of water which is 62.2 𝑙𝑏𝑠
𝑓𝑡3. 1.2 is multiplied by the total weight of the vessel including any parts that are connected to
the boat. Multiplying the specific weight of water in lb/in^3 times the total volume the buoyant
force of the boat is 498.66 lbs.
498.66
318= 1.568
498.66
344= 1.449
From this data, you can see that 1.568 and 1.449 are both greater than 1.2 which is the 20%
requirement.
Component Volume(in^3)Wood 840Wood 168
Wood 767.25Wood 252Wood 63
Wood 798Wood -137.5
Wood 176.8125Wood 48.375Foam 2840.5Wood 2819.875Wood 21Wood 315Foam 3458Batteries 1423.042381Total 13853.35488
Sprint EnduranceHull 120 120Batteries 100 100Motor 24 24
Controller 4 4SolarArrayw/stand 0 26Drivetrain 20 20Misc 50 50
318 344
Weight(lbs)Components
62.2 lb/ft^30.03599537 lb/in^3
SpecificWeightofWater

34 | P a g e
Appendix C: Proof of Insurance
Copy of 2016 Certificate of
Liability Insurance has been
requested from the University
35 | P a g e
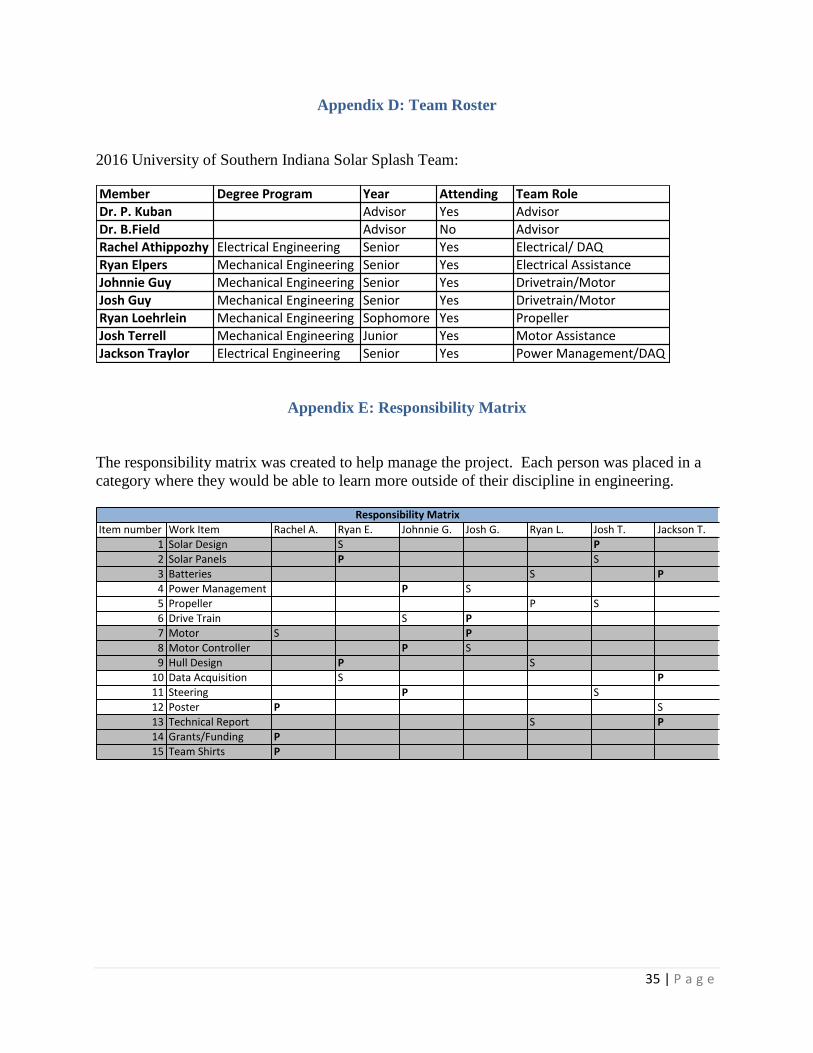
Appendix D: Team Roster
2016 University of Southern Indiana Solar Splash Team:
Appendix E: Responsibility Matrix
The responsibility matrix was created to help manage the project. Each person was placed in a
category where they would be able to learn more outside of their discipline in engineering.
Member DegreeProgram Year Attending TeamRoleDr.P.Kuban Advisor Yes AdvisorDr.B.Field Advisor No AdvisorRachelAthippozhy ElectricalEngineering Senior Yes Electrical/DAQ
RyanElpers MechanicalEngineering Senior Yes ElectricalAssistanceJohnnieGuy MechanicalEngineering Senior Yes Drivetrain/MotorJoshGuy MechanicalEngineering Senior Yes Drivetrain/MotorRyanLoehrlein MechanicalEngineering Sophomore Yes Propeller
JoshTerrell MechanicalEngineering Junior Yes MotorAssistanceJacksonTraylor ElectricalEngineering Senior Yes PowerManagement/DAQ
Itemnumber WorkItem RachelA. RyanE. JohnnieG. JoshG. RyanL. JoshT. JacksonT.1 SolarDesign S P2 SolarPanels P S3 Batteries S P4 PowerManagement P S5 Propeller P S6 DriveTrain S P7 Motor S P8 MotorController P S9 HullDesign P S10 DataAcquisition S P11 Steering P S
12 Poster P S13 TechnicalReport S P14 Grants/Funding P15 TeamShirts P
ResponsibilityMatrix

36 | P a g e
Appendix F: Decision Matrix
Totals
Score Weight Weighted Score Score Weight Weighted Score Score Weight Weighted Score Score Weight Weighted Score Score Weight Weighted Score Score Weight Weighted Score
Outboard 1 0.1 0.1 0.5 0.3 0.15 1 0.1 0.1 1 0.05 0.05 0.75 0.3 0.225 1 0.15 0.15 0.78
Inboard 0.5 0.1 0.05 0.5 0.3 0.15 0.1 0.1 0.01 0 0.05 0 0.75 0.3 0.225 0 0.15 0 0.44
Surface Drive 0.6 0.1 0.056 1 0.3 0.3 0.5 0.1 0.05 0.85 0.05 0.0425 1 0.3 0.3 1 0.15 0.15 0.90
TrimCost Drag Cutting of Hull Steering Modification Efficiency