Black Carbon and Other Gaseous Emissions from an Ocean ... · PDF fileFinal Report . Black...
54
Final Report Black Carbon and Other Gaseous Emissions from an Ocean-Going Vessel Auxiliary Engine Equipped with a Scrubber Prepared for: California Air Resources Board Transportation and Toxics Division Emissions Assessment Branch ARB contract #12-425 December 2013 Submitted by: Author: Dr. Kent Johnson (PI) Contributing Authors: Mr. Bill Welch, Mr. Carlos Espinoza, Mr. Vincent Castelluccio, Dr. Akua Asa-Awuku, and Dr. Wayne Miller (Co-PI) , College of Engineering-Center for Environmental Research and Technology University of California Riverside, CA 92521 (951) 781-5791 (951) 781-5790 fax
Transcript of Black Carbon and Other Gaseous Emissions from an Ocean ... · PDF fileFinal Report . Black...

Final Report
Black Carbon and Other Gaseous Emissions
from an Ocean-Going Vessel Auxiliary Engine Equipped with a Scrubber
Prepared for:
California Air Resources Board Transportation and Toxics Division
Emissions Assessment Branch ARB contract #12-425
December 2013
Submitted by:
Author: Dr. Kent Johnson (PI) Contributing Authors: Mr. Bill Welch, Mr. Carlos Espinoza, Mr. Vincent Castelluccio,
Dr. Akua Asa-Awuku, and Dr. Wayne Miller (Co-PI) ,
College of Engineering-Center for Environmental Research and Technology University of California Riverside, CA 92521
(951) 781-5791 (951) 781-5790 fax

Disclaimer The statements and conclusions in this report are those of the contractor and not necessarily those of the Air Resources Board (ARB). The mention of commercial products, their source, or their use in connection with material reported herein is not to be construed as actual or implied endorsement of such products.
ii

Acknowledgments The authors thank the following organizations and individuals for their valuable contributions to this project. We acknowledge the funding from the International Council on Clean Transportation (ICCT) and the California Air Resources Board (ARB). We acknowledge the staff and support of the APL England for their assistance in conducting the tests. These specifically include the Captain, the Chief Engineer, and many of the other support staff for hauling several hundred pounds of equipment five flights to the test stack location at midnight. We also acknowledge the terminal operators and the ground crews for allowing UCR testing team on the property. We specifically acknowledge Robert Clark of APL, Long Beach for communicating with the vessel, coordinating access, and providing logistics of the testing. We acknowledge Bob Finken of Delta Air Quality Services for the loan of some of his block and tackle to get our equipment to the top of the test stack. We acknowledge Mrs. Rachael Hirst for her analytical support for the particulate matter laboratory measurements, Mr. Kurt Bumiller for his long hours of assistance in preparing for the testing and Eddie, Don, and Joe in helping with configuring the crane hoist to reach the Scrubber stack.
iii

Table of Contents Table of Contents ......................................................................................................................... iv List of Tables ................................................................................................................................. v List of Figures ................................................................................................................................ v Abstract ......................................................................................................................................... vi Acronyms and Abbreviations .................................................................................................... vii Executive Summary ................................................................................................................... viii 1 Background ........................................................................................................................... 1 2 Objectives............................................................................................................................... 3 3 Approach and Procedures .................................................................................................... 4
3.1 PM scrubber system ............................................................................................................ 4 3.2 Test article and matrix ........................................................................................................ 4 3.3 Testing setup and layout ..................................................................................................... 6 3.4 PM measurements ............................................................................................................... 7 3.5 Black Carbon Methods ....................................................................................................... 8
4 Quality Control ................................................................................................................... 10 4.1 Pre-test calibrations ........................................................................................................... 10 4.2 On-site calibrations ........................................................................................................... 10 4.3 Post-test and data validation ............................................................................................. 10
5 Results .................................................................................................................................. 11 5.1 Gaseous and PM emissions ............................................................................................... 11 5.2 PM2.5 and OC emissions ................................................................................................... 14 5.3 Black Carbon emissions .................................................................................................... 14 5.4 Scrubber performance ....................................................................................................... 16
6 Black Carbon Sampling Recommendations ..................................................................... 17 7 Summary and Conclusions ................................................................................................ 18 References .................................................................................................................................... 19
Ship Specifications.............................................................................................. A-1 Appendix A. Scrubber Literature ............................................................................................. B-1 Appendix B. Additional Emissions Results ............................................................................. C-1 Appendix C. Test logs .............................................................................................................. D-1 Appendix D. Relevant published results ................................................................................... E-1 Appendix E. Sampling system description ............................................................................... F-1 Appendix F.
iv

List of Tables Table 3-1 Summary of selected auxiliary engine specifications .................................................... 5 Table 3-2 Test matrix for the tested auxiliary engine ..................................................................... 5 Table 3-3 Auxiliary engine test fuel report provided by the APL England .................................... 5 Table 3-4 PM measurements utilized and their measurement principle ......................................... 8 Table 5-1 Brake specific emission results for the aux. engine (g/kWhr basis) ............................. 13 Table 5-2 Time specific emission results for the aux. engine (g/hr basis) ................................... 14 Table 5-3 Total PM, BC, and EC/OC brake specific PM emissionsError! Bookmark not
defined. Table 5-4 Scrubber PM emission reductions ................................................................................ 16
List of Figures Figure 3-1 APL England scrubber system schematic (source Bloomfield 2013) ........................... 4 Figure 3-2 UCR’s sample system schematic (ISO method) ........................................................... 6 Figure 3-3 Dilution system and measurement layout on the auxiliary engine exhaust stack ......... 7 Figure 3-4 PM sampling and filter change out during testing. ....................................................... 7 Figure 5-1 Real time PM-soot, NOx, and CO2 emissions measurement ..................................... 12 Figure 2 Depiction of BC sampling recommendations for marine testing ................................... 17
v

Abstract Movement of raw materials and finished goods by ocean going vessels represents a large emission source of smog and soot precursors. Accordingly there have been several efforts on the part of regulatory agencies, the ports and others to implement programs to reduce the emissions and mitigate the adverse impacts on near-by port communities and regional air quality. In addition to these actions, efforts are being devoted to better understand the impact of shipping on both the regional and global environment. The International Maritime Organization (IMO), has played a key role in bringing the shipping community and governments from around the world together to look at the impact of ship emissions including emerging issues associated with the release of black carbon (BC) from ships and the subsequent deposition on artic ice. Interest is also growing in California as efforts are expended to identify ways to reduce emissions of short lived climate pollutants such as BC to help meet California’s climate goals. Recent measures enacted to reduce emissions from ocean-going vessels have required the use of cleaner low sulfur fuels. These measures do not specifically target BC emissions. Rather, the focus is on reducing sulfur oxides (SOx) and total particulate matter (PM) which, for ships, includes sulfate, organics, elemental carbon, and metals. Ocean going vessels are a dominate source of sulfate PM due to the high sulfur levels in the fuel thus, many controls that target total PM reduction also reduce sulfate and organics well. It is unknown what impacts the control strategies that target PM have on BC. Control and quantification of BC emissions from ocean going vessels presents a challenging task since access to these vessels is difficult, limited, and there is no source of data available in the literature. The purpose of this research is to evaluate different BC measurement techniques and to utilize these to evaluate the effectiveness of an exhaust gas after-treatment scrubber installed on a marine auxiliary engine in reducing emissions of SOx, PM (which include BC and ultra-fines less than 2.5 µm PM2.5) and other pollutants at different engine loads. Scrubbers are primarily designed to remove SOx emissions with most manufacturers claiming 98-99% reductions in SOx. However manufacturers’ claims for PM2.5 reductions vary widely, from 30-85% or more (4). Little information is available on the effectiveness of scrubbers to remove BC. Preliminary results from this research suggest that for the scrubber technology evaluated, it is capable of reducing total PM from 40 to 50% and averaged 45% across the scrubber, but varied from 10% to 80% for BC depending on load. The results suggest BC reductions are a strong function of engine load for the scrubber technology evaluated in this study. The results of this report provide recommendations for BC measurement, improve our understanding of BC emissions from ocean going vessels, and evaluate the effectiveness of a typical marine PM scrubber control device.
vi

Acronyms and Abbreviations ARB ...................................................Air Resources Board bs ........................................................brake specific BC ......................................................black carbon CARB .................................................California Air Resources Board CE-CERT ...........................................College of Engineering-Center for Environmental Research
and Technology (University of California, Riverside) CFR ....................................................Code of Federal Regulations CO ......................................................carbon monoxide COV ...................................................coefficient of variation CO2 .....................................................carbon dioxide Dp .......................................................particle diameter DPF ....................................................diesel particulate filter DR ......................................................dilution ratio EC ......................................................elemental carbon FID .....................................................flame ionization detector g/hp-h .................................................grams per brake horsepower hour HFO....................................................heavy fuel oil lpm .....................................................liters per minute MDL ...................................................minimum detection limit MFC ...................................................mass flow controller MGO ..................................................marine gas oil nm ......................................................nanometers NOx ....................................................nitrogen oxides OC ......................................................organic carbon OEM ...................................................original equipment manufacturer PA ......................................................photo acoustic PEMS .................................................portable emissions measurement systems PM ......................................................particulate matter PM2.5 .......................................................................... ultra fine particulate matter less than 2.5 µm RPM ...................................................revolutions per minute scfm ....................................................standard cubic feet per minute SEE ....................................................standard error estimate SOF ....................................................soluble organic fraction THC....................................................total hydrocarbons UCR ...................................................University of California at Riverside
vii

Executive Summary Black Carbon (BC) is a climate forcing agent formed through incomplete combustion of fuels. BC has direct and indirect climate effects. Black carbonaceous material can directly affect climate via the absorption of visible solar radiation or indirectly effect climate via interactions with warm and cold clouds. BC emissions are the second strongest contributor to global warming, trailing behind carbon dioxide. BC stays in the atmosphere for weeks, whereas carbon dioxide has an atmospheric lifetime of over a century. Identifying the most effective way to test BC emissions on ocean-going vessels and to improve the understanding of the effectiveness of different ocean-going vessel emission control options is important for informing efforts to reduce emissions from ocean-going vessels that contribute to climate change. The objective of this work is to evaluate and investigate potential measurement techniques for BC, and to quantify the BC, particulate matter (PM), and other gaseous emissions from a marine auxiliary engine (AE) operating on marine gas oil (MGO), with and without an exhaust after-treatment scrubber, and to evaluate the efficiency of the exhaust after-treatment scrubber. The BC measurement techniques evaluated are: Micro soot Sensor, Multi-angle Absorption Photometer, Aethalometer, Micro Balance and Sunset laboratory Carbon analyzer. The performance of the scrubber is based on the characterization of SOx, THCs, NOx, CO2, and PM, including PM2.5 mass, elemental and organic carbon and black carbon. For elemental (EC) and organic carbon (OC), the NIOSH and IMPROVE methods are used. The main findings from this work can be summarized as:
• BC measurements and the existing ISO 8178 sampling procedures work well for in-situ PA-soot type meters, but not for other filter batched type systems like the MAAP and Aethalometer, which are over the range for the ISO 8178 sampling procedures
• Dilution ratio averaged 3.5 where higher dilutions could be utilized to allow other BC source measurements. High dilutions on the order of 200 to 1 are recommended.
• PA-soot, EC-NIOSH, EC-IMPROVE show similar control efficiency trend (high reduction for high load and low reduction for low load).
• Scrubber SOx mass reduction ranges from 95 to 97% with an average of more than 96% across the engine loads tested. This suggests sulfate PM may also be reduced by 96%. This agrees with expected performance for scrubbers (Krystallon 2011)
• Scrubber PM2.5 mass reduction ranges from 40 to 50% with an average of 45% across the engine loads tested. This agrees with expectations from the scrubber manufacturer (Krystallon 2011)
• Organic PM (OC) is reduced around 55% and ranges from 70 to 45%, depending on the method and engine load. The NIOSH method is 40% higher than the IMPROVE method at the low load test point. The NIOSH method shows more OC reduction than the IMPROVE method.
• Results from this testing indicates that the scrubber technology is not as efficient at reducing black carbon at low loads as compared to high loads with the efficiency varying from 80% at high load to less than 10% at low loads.
viii

1 Background Movement of raw materials and finished goods by large ocean going vessels results in significant emissions of smog and soot precursors. Accordingly there are several efforts on the part of regulatory agencies, the ports and others to implement both regulatory and voluntary programs to reduce the emissions and mitigate the adverse impacts on near-by port communities and regional air quality.. These efforts such as requiring ocean-going vessels to use cleaner fuels, to slow down when approaching ports and to connect to shorepower when at-berth have resulted in dramatic reductions in emissions of sulfur oxides (SOx), particulate matter (PM), and to a lesser extent nitrogen oxides (NOx). While some information is available regarding the impacts of these measures on PM emissions, very little data is available on the impacts of these programs on black carbon (BC). Black carbon (BC) is characterized by the ability to strongly absorb visible light. It is often formed from the incomplete combustion of fuels and is thus considered an anthropogenic emission. BC has an average atmospheric life time of a few weeks but can significantly modify the earth’s energy balance during that short time. Hence BC is a short lived climate forcing agent. Thus the reduction of atmospheric BC emissions is being considered as a near-term mitigation strategy for climate impacts. BC has both direct and indirect climatic effects. BC is a dominant absorber of solar radiation in the atmosphere. Furthermore, BC is transported over long distances and can mix with other aerosols to form transcontinental plumes of brown clouds. Anthropogenic sources of BC are concentrated in the tropics where high solar irradiance occurs. BC’s high absorption properties, regional distribution aligned with high solar irradiance, and the capacity to mix and form widespread brown clouds make the emissions of BC the second strongest contribution to global warming, trailing behind carbon dioxide. Furthermore, the deposition of BC darkens snow and ice surfaces, contributing to accelerate melting in Artic sea ice. Recently, the International Maritime Organization’s (IMO) Marine Environment Protection Committee (MEPC) agreed to develop a work plan to address the impact of carbon emissions from ships and instructed the Sub-Committee on Bulk Liquids and Gases (BLG) to develop a definition for black carbon emissions from international shipping. The group is to consider measurement methods for BC and identify the most appropriate method for measuring black carbon emissions from international shipping; investigate appropriate control measures to reduce the impacts of black carbon emissions from international shipping in the Arctic and submit a final report to MEPC 65 in 2014. Prevention of Air Pollution from Ships An effective method to reduce air pollutant emissions from ships is to require the use of cleaner, lower sulfur fuels. California has had a regulation in place since 2008 that requires ocean-going vessels to use low sulfur marine distillate fuels. In addition to California’s regulation, IMO amended Annex VI of the MARPOL convention to require lower sulfur fuels in emission control areas beginning in 2012 with the sulfur limit matching that of the California’s regulation’s 0.1% sulfur limit beginning in 2015. With the lower limits on the sulfur content of fuels set in MARPOL Annex VI, there is an increasing interest in alternatives to the purchase of expensive, low-sulfur fuel and one of those approaches is scrubber technology. The IMO SOx emission
1

limits will require ships to achieve a SOx reduction at least equivalent to a fuel with 0.1% sulfur by 2015 or essentially >97% SOx removal by scrubbing, assuming a fuel with 3.5% sulfur. Scrubber technology is viewed as mature and proven by many because of the number of commercial installations, including the scrubber technology associated with the on-board generation of inert gas on ships. Based on the wide-spread success of scrubber technology, there are a number of advocates who claim that the application for gases points to an application for the removal of gases and soot from the exhaust of diesel engines on ships. Others would say the application of scrubber technology installed on marine vessels is still in its infancy because there are so few installations on marine diesel engines. Furthermore, consider the testimony in the Parliament Transport Committee, Evidence from Maritime UK (SES 03b). These reports indicate there are still issues when scrubbers are installed on ships in commercial operation.
• “Turning to the specific examples given in the Minister’s supplementary evidence. P&O Ferries fitted scrubbers (BP Marine & Marine Exhaust Solutions of Canada) in June 2003 to all four main engines and four auxiliary engines on Pride of Kent. The main engine scrubbers were unable to provide the required scrubbing efficiency, and were de-commissioned. After persevering for almost two years the four auxiliary engines achieved less than 55% scrubbing efficiency vs. the 95% performance standards criteria set so were de-commissioned in August 2005.
• BP Marine together with Krystallon then fitted a prototype unit on one auxiliary engine on Pride of Kent between 17–20 December 2005. This has undergone extensive modifications during the intervening years to improve operating efficiency. Although this unit has now more than 30,000 operating hours there have been long periods of non-availability, unreliability, and considerable crew intervention when it was operating.
• The scrubber fitted to the Holland America cruise ship Zaandam has not managed to operate continuously under any form of compliance regime. It is a prototype and each time it has run it has demonstrated the need to make further modifications and improvements.
• The DFDS Ro-Ro vessel Tor Ficaria has only ever been operated in pilot mode and barely achieved 3,800 hours in 13 months (i.e. less than 30%) and in the view of the owners is still not mature for maritime use. There also remain legal issues to be resolved with respect to discharge of resultant residue waste.”
Scrubber project in the San Pedro Bay Under the ports of Los Angeles and Long Beach’s Technology Advancement Program (TAP), a 36 month test of the effectiveness of seawater scrubbers in reducing air pollution from an at-berth vessel was funded. For this project, the ship used a seawater scrubber supplied through a partnership between Bluefield Holdings Inc. and Krystallon, Ltd., in which seawater is used to scrub contaminants from a ship’s auxiliary engines and boiler before exiting the exhaust stack of a ship. Seawater used in the scrubber is treated and cleansed of solid carbon contaminants before being discharged. The solid contaminants are contained and collected for later disposal. A summary of the project is provided below.
2

The technology is being tested on the APL England, a 5,500 TEU container vessel trading between Asia and the US. The system will allow APL to continue using low cost residual fuels for their auxiliary engines, as per the IMO ECA rules. The project started in 2011 and is expected to last for three years. .As part of the project, the scrubber technology on the APL vessel will be evaluated over a one year period during the ship’s calls to the San Pedro Bay ports. According to the press release, the scrubber is expected to result in air emission reductions of approximately 80-85 percent in diesel particulate matter, 99.9 in sulfur oxide emissions, more than a 90 percent decrease in volatile organic compounds (VOC) and another up to 10 percent reduction in nitrogen oxide pollutants. Diesel particulate matter is
classified in the state of California as a toxic air contaminant based upon its potential to cause health problems and cancer. VOC and nitrogen oxides are gases that contribute to smog.
The work presented in this report describes the evaluation of the ocean going vessel APL England’s auxiliary engine emissions with and without the scrubber technology described above and funded through the TAP. Specifically, this effort includes evaluation of several BC measurement methods to quantify the PM reduction capability of the scrubber technology and possibly any BC performance limitations for marine applications. Impacts on other pollutants are also evaluated.
2 Objectives The objectives for this work are to quantify the black carbon (BC) and other emissions from a marine auxiliary engine (AE) operating on marine gas oil (MGO) and with a scrubber to evaluate the effectiveness of the scrubber to reduce emissions from the auxiliary engine. The performance of the scrubber is based on the characterization of SOx, THCs, NOx, CO2, and particulate matter (PM), including PM2.5 mass (2.5 um fine particles only), elemental, organic and black carbon. Additionally, a key objective is to evaluate and test five several real time and semi-real time BC measurement techniques based on the principles of gravimetric net weight change, flame ionization detection, photoacoustic, aerosol absorption, and filter paper transmission.
3

3 Approach and Procedures This section describes the test article (both the scrubber and the auxiliary engine), measurement approach, and the real time instruments selected. The gaseous pollutants were collected following ISO protocol methods 3.1 PM scrubber system The auxiliary support system of the APL England is equipped with three, similarly sized, fixed RPM engines to provide the necessary electrical needs for the ship. The scrubber system designed for the auxiliary engine includes three venturi PM impaction zones (see circled areas in Figure 3-1) and one PM removal zone in addition to other systems to manage the process. Thus, each of the auxiliary engines is equipped with a separate venturi impaction zone, but the combined engine exhaust manifold supports the total of three engines. The main PM removal (by water impaction, diffusion, adsorption, and absorption) typically occurs in the high velocity venturi section (EPA 1998); see Appendix B for more explanation. The water removed PM is then discarded through a water removal spray system (Bloomfield 2103). The sampling performed by UCR was on one of the three auxiliary engines where the pre-scrubber sample point was on one of the three exhaust stacks which is labeled “Emissions Test Port In” in Figure 3-1. The post-scrubber sample point was collected from the stack after the three engine exhausts were combined which is identified by the “Emissions Test Out” in Figure 3-1.
Figure 3-1 APL England scrubber system schematic (source Bloomfield 2013)
3.2 Test article and matrix The engine tested is a 3.2 MW Samsung-MAN B&W engine, model 7L32/40, with a generator manufacturer by Hyundai; see Table 3-1 below. The electrical capacity of the engine is 2.9MW. The APL England has three auxiliary engines where each engine is configured with a scrubber control system as described earlier, see Figure 3-1. Each of the circled areas represents different PM removal/impaction sections. Since each engine is configured with its own scrubber, it is
4
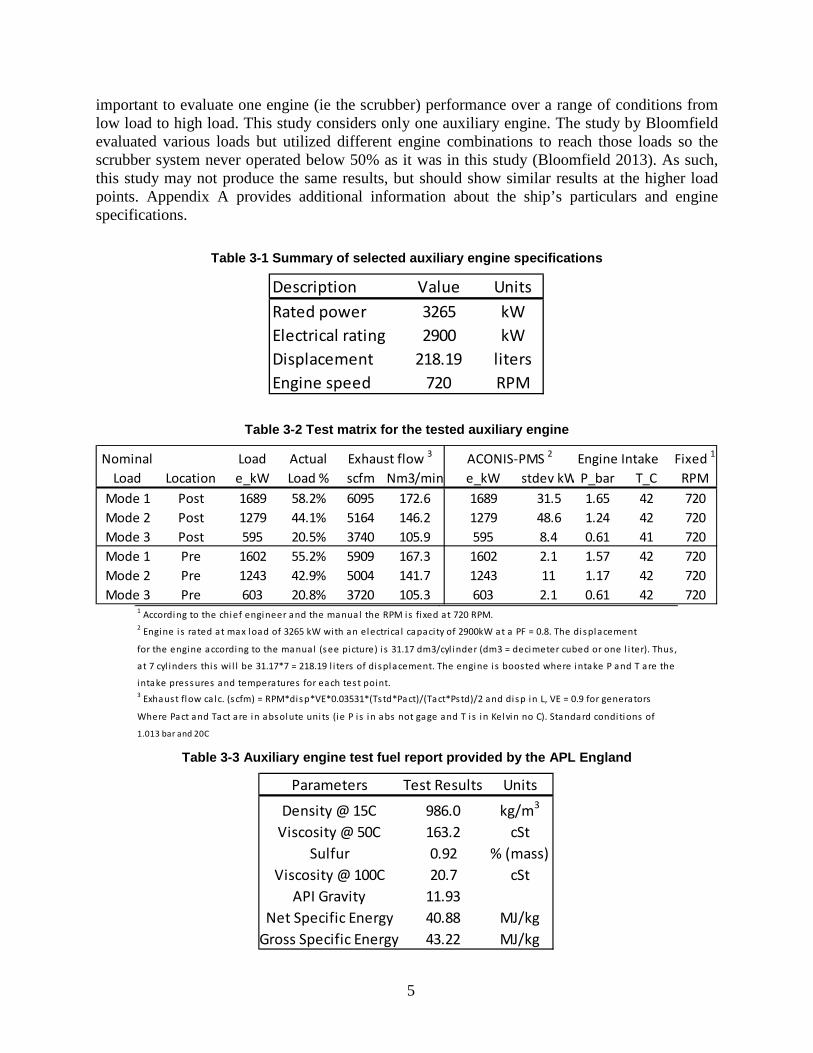
important to evaluate one engine (ie the scrubber) performance over a range of conditions from low load to high load. This study considers only one auxiliary engine. The study by Bloomfield evaluated various loads but utilized different engine combinations to reach those loads so the scrubber system never operated below 50% as it was in this study (Bloomfield 2013). As such, this study may not produce the same results, but should show similar results at the higher load points. Appendix A provides additional information about the ship’s particulars and engine specifications.
Table 3-1 Summary of selected auxiliary engine specifications
Table 3-2 Test matrix for the tested auxiliary engine
Table 3-3 Auxiliary engine test fuel report provided by the APL England
Description Value UnitsRated power 3265 kWElectrical rating 2900 kWDisplacement 218.19 litersEngine speed 720 RPM
Nominal Load Actual Engine Intake Fixed 1
Load Location e_kW Load % scfm Nm3/min e_kW stdev kW P_bar T_C RPMMode 1 Post 1689 58.2% 6095 172.6 1689 31.5 1.65 42 720Mode 2 Post 1279 44.1% 5164 146.2 1279 48.6 1.24 42 720Mode 3 Post 595 20.5% 3740 105.9 595 8.4 0.61 41 720Mode 1 Pre 1602 55.2% 5909 167.3 1602 2.1 1.57 42 720Mode 2 Pre 1243 42.9% 5004 141.7 1243 11 1.17 42 720Mode 3 Pre 603 20.8% 3720 105.3 603 2.1 0.61 42 720
Exhaust flow 3 ACONIS-PMS 2
1 According to the chief engineer and the manual the RPM is fixed at 720 RPM.2 Engine i s rated at max load of 3265 kW with an electrica l capaci ty of 2900kW at a PF = 0.8. The displacement
for the engine according to the manual (see picture) i s 31.17 dm3/cyl inder (dm3 = decimeter cubed or one l i ter). Thus ,
at 7 cyl inders this wi l l be 31.17*7 = 218.19 l i ters of displacement. The engine i s boosted where intake P and T are the
intake pressures and temperatures for each test point.3 Exhaust flow ca lc. (scfm) = RPM*disp*VE*0.03531*(Tstd*Pact)/(Tact*Pstd)/2 and disp in L, VE = 0.9 for generators
Where Pact and Tact are in absolute uni ts (ie P i s in abs not gage and T i s in Kelvin no C). Standard conditions of
1.013 bar and 20C
Parameters Test Results Units
Density @ 15C 986.0 kg/m3
Viscosity @ 50C 163.2 cStSulfur 0.92 % (mass)
Viscosity @ 100C 20.7 cStAPI Gravity 11.93
Net Specific Energy 40.88 MJ/kgGross Specific Energy 43.22 MJ/kg
5

3.3 Testing setup and layout The sampling approach follows UCR’s standard practice for on-vessel emissions testing. This can be seen by the schematic in Figure 3-2 and the on-site layout in figures Figure 3-3 and Figure 3-4. Figure 3-3 shows UCR’s close-coupled sample system where the transfer line has been eliminated to prevent PM losses during in-use ship testing. UCR has found significant PM loss in for moderate length (5-10 feet) of metallic heated lines transfer lines during ship testing. As such, UCR continues to approach all ship testing with direct sampling from the ship’s exhaust. The drawback with this approach is a longer setup time and more difficult testing layout since the equipment needs to be at the sample location which in this case was five stories above the main ship deck. A properly designed sampling system is essential to accurate collection of a representative sample from the exhaust and subsequent analysis. ISO points out that particulate must be collected in either a full flow or partial flow dilution system and UCR chose the partial flow dilution system with single venturi as shown in Figure 3-2.
Figure 3-2 UCR’s sample system schematic (ISO method)
An overview of UCR’s partial dilution system in Figure 3-2 shows that raw exhaust gas is transferred from the exhaust pipe (EP) through a sampling probe (SP) and the transfer tube (TT) to a dilution tunnel (DT) due to the negative pressure created by the venturi (VN) in DT. The gas flow rate through TT depends on the momentum exchange at the venturi zone and is therefore affected by the absolute temperature of the gas at the exit of TT. Consequently, the exhaust split for a given tunnel flow rate is not constant, and the dilution ratio at low load is slightly lower than at high load. More detail on the key components is provided in appendix E.
EGA2
d
Real Time PM Inst.
Air DA
Dilution Tunnel (DT)
l > 10 d
Exhaus
S
EGA1
V
T
Vent
Quart
PTF
To Vacuum
Cyclone
CF
EP
6

Figure 3-3 Dilution system and measurement layout on the auxiliary engine exhaust stack
Figure 3-4 PM sampling and filter change out during testing.
3.4 PM measurements Table 3-4 lists the PM measurements and instrumentation used for this program. These include batch samples for total PM2.5 from Whatman Teflo filters and PM composition utilizing Quartz fiber filters and the NIOSH and IMPROVE analysis method, see Appendix E for more details.
Direct sampling
7

The PM composition reported by the NIOSH and IMPROVE system utilizes 2500 QAT-UP Tissuquartz® (Pall Gelman, Ann Arbor, MI) filters which were preconditioned at 600 ºC for 5 hours. A 1.5 cm2 punch from the filter was analyzed with a Sunset Laboratory (Forest Grove, OR) thermal/optical carbon analyzer according to the NIOSH 5040 reference method (10). For this project, real-time PM instruments were selected to characterize the black carbon emissions. These include the MSS 483 photo acoustic micro-soot sensor (PA-soot) manufactured by AVL, the Thermo Scientific Multi-Angle Absorption Photometer (MAAP), and Magee Aethalometer (AE33). There are other photoacoustic type measurement systems available such as the PA extinction meter (PAX) by Droplet Measurement Technologies meter.
Table 3-4 PM measurements utilized and their measurement principle
Instrument Model Principle Output Wavelength
Micro Balance UMX2 Gravimetric net weight change Total PM2.5 measurement n/a
Sunset Laboratory Carbon analyzer Lab OC-EC
Flame Ionization Detection (FID)
Operationally defined organic and elemental carbon via transmittance
n/a
Micro Soot Sensor (PA-Soot) MSS 483 Photoacoustic
(PA) BC mass from real time in-situ signal (mg/m3) 808 nm
Multi-Angle Absorption Photometer (MAAP)
MAAP 5012
Aerosol absorption
BC mass from transmissions and scattering correction (ug/m3)
670 nm
Aethalometer AE33 Filter paper transmission
BC mass from transmission (ug/m3)
370, 470, 520, 590, 660, 880, and 950
3.5 Black Carbon Methods There are several methods to measure black carbonaceous material and the reported terminology can be mixed. For example, the terms “black carbon, soot, elemental carbon, equivalent black carbon and refractory black carbon” refer to the light-absorbing component of particles but the underlying definitions and measurement methods are different (Petzold 2013). Published articles are available in the literature that describes the different BC measurement methods in detail (Moosmuller 2009). Hence BC measurements of different techniques are required to understand the nature and quantity of Black Carbon from emission sources. Popular BC instrumentation methods use optical, thermal, or incandescence methods to estimate BC mass concentrations. BC emission inventories are mainly based on emission factors derived from thermal-optical methods that detect the carbon evolving from a heated filter sample, while data from atmospheric monitoring stations are mostly derived from optical absorption methods (Petzold 2013).
8

The MAAP, Aethalometer, and the PA-soot are all light-absorption based BC measurement techniques used in this study. The PA-soot has the largest range of the three instruments and can measure up to 50,000 µg/m3. The other instruments require significant dilution of ship emissions to reach their desired BC concentration range (less than 100 µg/m3) The MAAP and Aethalometer report an equivalent BC mass concentrations derived from absorption cross sectional information. The MAAP and Aethalometer are continuous filter based methods whereas, the PA-soot sensor is a photoacoustic measurement. Photoacoustic measurements use the intensity of a sound wave generated by the contraction and expansion of gas molecules when the BC particle is pulsed by a laser beam. The PA-soot method uses a conversion factor calibrated from gravimetric methods to soot content.
9
4 Quality Control This section describes UCR standard practices for calibrations, verifications, and control checks performed before, during and after testing. This section also describes checks performed to validate the data provided in the report. Additional instrument accuracy, precision, and standard verifications is provided in Appendix E. 4.1 Pre-test calibrations Prior to departing from UCR all systems were verified and cleaned for the testing campaign. This included the real time PM PA-soot, Aethalometer, and MAAP. The PA-soot system included cleaning the internal pollution window and performing a span calibration using an internal pollution window. All systems were found to be within specifications and the systems were prepared for testing. 4.2 On-site calibrations Pre- and post-test calibrations were performed on the gaseous analyzer using NIST traceable calibration bottles. Post-test dilution ratio was verified by removing the probe from the dilution tunnel and sampling from the raw exhaust. This method has been used in addition to operating two gas analyzers and has been shown to be reliable. Hourly zero checks were performed with each of the real time PM instruments. Leak checks were performed for the total PM2.5 system prior to each sample point. 4.3 Post-test and data validation Post-test evaluation includes verifying consistent dilution ratios between points, verifying brake specific fuel consumption with reported manufacturer numbers. Typically this involves corresponding with the engine manufacturer to discuss the results on a emissions basis of interest. The brake specific fuel consumption results were with-in reason and thus suggest the load and mass of emissions measured are reasonable and representative. Thus, this suggests the data collected for the APL England auxiliary engine out emissions are accurate and representative of a properly functioning system.
10

5 Results
This section covers the emission results for the tests on the auxiliary engines equipped with a scrubber PM reduction system on the APL England container vessel. The results are organized into four sections, 1) Gaseous and PM emissions, 2) PM2.5 and OC emissions, 3) Black Carbon measurement techniques, and 4) Scrubber performance. 5.1 Data qualification During reporting it was recognized that the post-scrubber exhaust flow could be significantly higher than the pre-scrubber exhaust flow due to the injection of water utilized to remove PM as part of the scrubber design. This higher post-scrubber exhaust flow could impact the overall emissions characterization unless considered. The post-scrubber exhaust increase could be evaluated with the measurement of temperature and dew point temperature of the exhaust exiting the scrubber (the dew point should be near saturation). Alternatively one could perform all the emissions calculations utilizing the pre-scrubber exhaust flow calculations and ignore the contribution due to water. The alternate approach is possible since all the gaseous measurements are dried prior to instrument detection and the PM mass based species are not subjected to the partial pressure influence like the gaseous species. As such all the data provided in this report are accurate and representative of the performance of the emissions from the vessel equipped with a scrubber. As a recommendation, future testing with scrubber will include the measurement of the exhaust gas temperature and humidity in order to characterize the approach. 5.2 Real-time emission trends Figure 5-1 shows the real time PM, NOx and CO2 emissions as a function of time for the auxiliary engine tested. The post-scrubber stack was sampled first followed by the pre-scrubber stack, see Figure 5-1. The dilute NOx concentration varied from 100 to 300 ppm and the dilute CO2 concentration varied from 1.5% to 2.5%. The PA-soot concentration varied from 0.3 mg/m3 to 3mg/m3. The green stars represent when filter batch samples were collected for the Teflon and Quartz filter media. Typically three samples are collected, but due to limited time, some tests only utilized two filter samples. The large spikes in the gaseous emissions are a result of the dilution ratio quantification.
11

Figure 5-1 Real time PM-soot, NOx, and CO2 emissions measurement
During the time period from 11:00 to 12:20 the real time gaseous emissions data recording system stopped, hand records were utilized. There was a glitch in the PEMS logging system where the data was not saved. The backup hand records showed the NOx and CO2 concentrations were stable during this time period. The PA-soot measurement was unstable mode 3 (lowest load) during the filter post-scrubber sample collection. It is not clear what caused the conditions as the engine was stabilized at this mode for over one hour. It is expected that some component of the filter samples during the unstable section may be questionable as discussed in the next two sections. 5.3 Gaseous emissions Table 5-1 and Table 5-2 list the brake specific (bs) and time specific regulated emissions results including the real time PA-soot emissions, respectively at each test Mode (Where PostM1 denotes post-scrubber results Mode 1 and PreM1 denotes pre-scrubber results Mode 1). The load on the engine varied from just under 60% to approximately 20% for the pre and post-scrubber test points. The brake specific NOx (bsNOx) emissions were relatively stable for all the loads for the pre and post-scrubber tests and averaged around 10.3 g/kWhr. The brake specific CO2 (bsCO2) emissions varied from 720 g/kWhr to 820 g/kWhr from high to low load. These values represent expected bsCO2and agree with typical published data where higher brake specific fuel consumption exists at lighter loads. Additionally, the bsCO2 emissions were similar for the pre
12

and post-scrubber test runs suggesting the two test conditions were similar. See Appendix C for a presentation of the measured concentration and g/hp-h emission factors.
Table 5-1 Brake specific emission results for the aux. engine (g/kWhr basis)
A similar auxiliary engine was tested by UCR during previous research projects. The previous results for selected species are listed in Appendix E. The results in the current testing program are in good agreement for NOx and CO2, but are mixed for total PM as explained below. Scrubbers are known to increase the water concentration of the exhaust stream beyond that of traditional emissions calculation where post scrubber humidity needs to be considered. Humidity was not measured as part of this scrubber evaluation but considered during evaluation of the bsCO2 results between pre and post scrubber testing. The bsCO2 results were similar between pre and post scrubber testing suggesting the impact of the humidity was small and didn’t influence the overall sampling approach. As such the PM and BC comparisons results provided should be representative.
Nominal eLoad Load NOx CO CO2 SO2 PM2.5 MSS 1
Load e_kW % g/kWhr g/kWhr g/kWhr mg/kWhr mg/kWhr mg/kWhrPost M1 1689 58.2% 10.79 0.62 717.8 0.04 206.2 5.6Post M2 1279 44.1% 9.76 0.89 719.1 0.04 199.5 22.2Post M3 595 20.5% 10.75 1.63 819.7 0.07 294.4 88.2Pre M1 1602 55.2% 10.66 0.83 752.2 1.43 407.6 28.6Pre M2 1243 42.9% 10.90 0.99 781.8 1.53 373.3 32.5Pre M3 603 20.8% 9.99 2.05 805.2 1.59 491.1 90.5
1 MSS i s the AVL 483 micro soot sensor that measures the acoustic properties of PM or black carbon4 Engine load i s expected to be higher than electrica l load by the a l ternator efficiency and cool ing losses
Tota l Al t efficiency at 100% load i s typica l ly 97% and 80% at less than 50% load. At these conditions the bsCO2 is
estimated at 500 g/bhp-h which i s expected for large sca le medium speed diesel engines .
13

Table 5-2 Time specific emission results for the aux. engine (g/hr basis)
5.4 PM2.5 and OC emissions Table 5-3 shows the brake specific PM2.5(bsPM) emissions for both the pre and post-scrubber tests. The measurements for PM include total PM2.5 and EC/OC PM from both the NIOSH and IMPROVE methods. The engine out bsPM2.5 ranged from 491 mg/kWhr at light loads to 400 mg/kWhr at heavy loads. The higher bsPM2.5 emission at lighter loads agrees with typical diesel engine emission rates. The bsPM2.5 emission rates are also consistent with previous tests of a similar engine at the 58% and 40% load, but were about 30% low for the lightest load, see Appendix E. The organic PM was higher for the NIOSH method as compared to the IMPROVE method. The NIOSH OC varied from 183 mg/kWhr to 296 mg/kWhr where the IMPROVE OC varied from 158 to 173 mg/kWhr for the same load points, see Table 5-3. The NIOSH OC was more than 40% higher than the IMPROVE method at the low load test point. Marine engines, running on high sulfur fuels, tend to have a PM composition dominated by OC and Sulfate. The EC+OC masses were approximately 50% of the total PM2.5. Although sulfate PM was not measured, one can infer the sulfate PM from the measurement of SO2 in the exhaust. It is expected that the difference in the PM2.5 and the sum of OC and EC (including mass factors) is approximately the sulfate PM mass. The total PM composition is thus, approximately 45% sulfate, 45% organic and a small fraction of EC (10%). This agrees with previous tests on the same engine, see Appendix E. 5.5 Black Carbon emissions EC and BC have different measurement principles where some consider the EC to not represent a measure of the back carbon emissions even though EC and BC correlate well. As part of this research it was desired to evaluate different BC measurement methods to consider the BC emissions from ships. Since EC tends to correlate well it was also considered here. Thus, EC, PA, and two transmittance methods are described in this section. The real time PA-soot measurements were in agreement with the EC measurements for both the NIOSH and IMPROVE methods (10). The PA-soot and the EC PM ranged from around 5 mg/kWhr at high load to about 100 mg/kWhr at light loads. The light load EC measurements were not reported due to observed soot instability in the test article during the batch samples. The
Nominal eLoad 4 Load NOx CO CO2 SO2 PM2.5 PA-soot 1
Load e_kW % kg/hr kg/hr kg/hr kg/hr g/hr g/hrPost M1 1689 58.2% 18.22 1.04 1212 0.066 348.2 9.4Post M2 1279 44.1% 12.48 1.13 920 0.056 255.2 28.4Post M3 595 20.5% 6.40 0.97 488 0.045 175.3 52.5Pre M1 1602 55.2% 17.07 1.32 1205 2.288 652.8 45.9Pre M2 1243 42.9% 13.55 1.23 972 1.897 464.0 40.4Pre M3 603 20.8% 6.02 1.24 485 0.955 295.9 54.5
1 MSS i s the AVL 483 micro soot sensor that measures the acoustic properties of PM or black carbon4 Engine load i s expected to be higher than electrica l load by the a l ternator efficiency and cool ing losses
Tota l Al t efficiency at 100% load i s typica l ly 97% and 80% at less than 50% load. At these conditions the bsCO2 is
estimated at 500 g/bhp-h which i s expected for large sca le medium speed diesel engines .
14

EC and PA-soot measurements for the mode 3 post-scrubber test did agree over the same sampling period and are provided in Appendix C.
Table 5-3 Total PM, BC, and EC/OC brake specific PM emissions
The MAPP and Aethalometer measure BC indirectly, but should correlate with the PA-soot method. A perfect correlation is not expected due to varying levels of measurement bias (Moosmuller 2009). The MAPP and Aethalometer PM maximum range is 0.1 mg/m3 and is typically used for low ambient concentrations less than 0.01 ug/m3. Since the soot concentration was greater than 0.3 mg/m3, both the MAPP and Aethalometer were over-ranged and not able to provide any useful data for the entire testing campaign. Higher dilutions would be needed to operate these devices. Dilutions used for this testing averaged 3.5 where a dilution of 200 to 1 would be recommended for the MAPP and Aethalometer. A 200 to 1 dilution is not an easy system to construct and would require a more sophisticated approach as that developed by Matter Engineering. The instability in the PM emissions seemed to be limited to EC and BC measurements as the PM2.5, OC, and SO2 did not show any significant trends. The PA-soot concentration varied from 5 mg/m3 to 2 mg/m3 between 11:00 AM to 12:30 PM. The EC and PA-soot showed a higher PM mass post-scrubber compared to pre-scrubber during the batch samples. This would suggest an increase in soot across the scrubber, see Appendix C. The PM2.5, OC, and SO2 measurements did not show the same increasing trend as EC and BC. At high load and light load PM2.5, OC, and SO2 measurements showed reductions across the scrubber, see Table 5-4. This suggests that PM2.5, organic, and sulfate PM were not affected during the instability observation and possibly only EC and BC were affected. The scrubber system should not create soot particles, therefore the high EC batch samples should be considered suspect and not used in the scrubber performance. In summary the post-scrubber batched sample EC data was not provided in Table 5-3. The EC data for the low loads is provided in Appendix C.
Nominal eLoad 4 Load PM2.5 PA-soot 1 EC OC EC OC MAAP 2 Aeth 3
Load e_kW % mg/kWh mg/kWh mg/kWh mg/kWh mg/kWh mg/kWh mg/kWh mg/kWhPost M1 1689 58.2% 206.2 5.6 3.68 79.6 8.35 74.8 n/a n/aPost M2 1279 44.1% 199.5 22.2 14.13 82.6 27.55 74.6 n/a n/aPost M3 595 20.5% 294.4 88.2 99.09 126.9 133.15 95.5 n/a n/aPre M1 1602 55.2% 407.6 28.6 29.69 257.8 35.21 166.8 n/a n/aPre M2 1243 42.9% 373.3 32.5 27.98 183.0 40.71 158.1 n/a n/aPre M3 603 20.8% 491.1 90.5 n/a 295.8 n/a 173.2 n/a n/a
IMPROVENIOSH
1 MSS i s the AVL 483 micro soot sensor that measures the acoustic properties of PM or black carbon2 MAAP is a mass aerosol particle. The MAAP over ranged at 50 ug/m3 (concentration ranged from 200 to 10,000 ug/m3)3 Aeth i s the aethalometer which uses the l ight scattering principle to measure PM concentration. Aeth over ranged a lso.4 Engine load i s expected to be higher than electrica l load by the a l ternator efficiency and cool ing losses
Tota l Al t efficiency at 100% load i s typica l ly 97% and 80% at less than 50% load. At these conditions the bsCO2 is
estimated at 500 g/bhp-h which i s expected for large sca le medium speed diesel engines .
15

The real time measurements are not restricted in the same way as batch samples. One can analyze the data and consider different evaluation segments. This is one of the benefits of real time data measurements. At 11:50 AM the PA-soot measurement was most stable to evaluate the post scrubber measurement at Mode 3. The analysis for the BC at the lightest load is based on PM-soot measurement at this time. The scrubber efficiency presented in the next section is based on analysis just before the sample probe was moved to the pre-scrubber test location. 5.6 Scrubber performance Table 5-4 shows the PM reductions across the scrubber, the gaseous reductions are presented in Appendix C. A negative value indicates the scrubber reduced that species and a positive value indicates the species increased as a result of the scrubber. The post-scrubber PM was reduced by all measurement methods. The range of total PM2.5 reduction varied from 50% at heavy loads to 40% at light loads. The OC PM reduced from 69% to 55% for the NIOSH method and 55% to 45% for the IMPROVE method. The NIOSH method showed larger reductions and reductions were consistently higher at the highest load and less at lighter loads. The PA-soot PM showed a reduction from 81% at high load to 3% at light load. The standard deviation of the samples at light load suggests there is practically no reduction at light loads. The EC measurement from both the NIOSH and IMPROVE showed a similar trend where the EC reductions were around 80% at high loads and less at lighter loads. The light load EC measurements for the post-scrubber test are suspect and therefore not presented in Table 5-4. The PA-soot reductions are valid at the light load test point as described in the previous section. The PA-soot results suggest that a properly operated scrubber does not reduce BC at light loads as it does at high loads. EC and BC removal by scrubbers is based on impaction and diffusion (EPA 1998). To remove small diesel particles (typically <100 nm) particles one must have sufficient velocity in the venturi impaction zone. At lighter loads the low turbulence (low RE #) may not be sufficient for particle removal and the BC removal efficiency may be reduced as shown by this research. Typically diesel engines are not designed to operate at light loads (less than 30%) in order to maximize efficiency and minimize fuel usage. Thus, it may be reasonable that the observation may be avoided by proper engine operation by the chief engineer. This research does suggest scrubber performance and vessel integration should be accompanied with educating the end user education to maximize its performance.
Table 5-4 Scrubber PM emission reductions
GravimetricNominal eLoad Load PA-soot 1 MAAP 2 Aeth 3 PM2.5 EC OC EC OC
Load e_hp % % % % % % % % %M1 Effic 1645 57% -81% n/a n/a -49% -88% -69% -76% -55%M2 Effic 1261 43% -32% n/a n/a -47% -49% -55% -32% -53%
M3 Effic 4 599 21% -3% n/a n/a -40% n/a -57% n/a -45%
IMPROVEReal TimeEngine Conditions NIOSH
1 MSS i s the AVL 483 micro soot sensor that measures the acoustic properties of PM or black carbon2 MAAP is a mass aerosol particle. The MAAP over ranged at 50 ug/m3 (concentration ranged from 200 to 10,000 ug/m3)3 Aeth i s the aethalometer which uses the l ight scattering principle to measure PM concentration. Aeth over ranged a lso.
16

6 Black Carbon Sampling Recommendations One of the key objectives of this work is to provide a recommended BC sampling approach for marine vessels. This section covers a recommended sampling approach for BC on ocean going vessels. The standard approach for PM2.5 sampling requires a dilution tunnel to control condensation, manage diluted sample temperature of 42 to 52oC and other PM formation process. ISO 8178 requires a dilution tunnel for PM sampling and thus has been the basis for marine testing at UCR. Gaseous sampling can be performed raw and/or dilute where UCR has chosen to perform dilute gaseous sampling. See Appendix F for a detailed explanation of UCR sampling approach and references to ISO 8178. Raw sampling is utilized by UCR for dilution ratio (DR) verification as allowed by ISO 8178-1 Section 17.2.1 (partial flow systems). ISO 8178 recommends a minimum DR of 4 to 1 with no maximum, but does recommend accurate DR verification. The maximum recommended dilution ratio using gas analyzers is 20 to 1 in order to accurately determine the DR to within 10%. Two other methods allowed by ISO8178 are flow measurement or carbon balance. UCR’s BC measurement approach was to sample from the same PM dilution tunnel as utilized for UCR’s PM2.5 and gaseous systems. The PA-soot BC instrument worked well from the dilution tunnel without any modifications. The MAAP and Aethalometer systems were over ranged and did not work well from the UCR dilution tunnel system. It was estimated an additional dilution as high as 200 would be required for proper operation. These high dilutions would require accurate flow measurement at very small flows or an update to the ISO 8178 procedures. Although the PA-soot and other high concentration meters could sample from the raw exhaust, it is recommended to sample from a dilute concentration in order to minimize PM contamination (such as sample lines, orifices, filters, detector windows and other systems). Figure 2 shows a schematic layout of the ISO 8178 procedures for engine sampling. The existing ISO 8178 sampling procedures are reasonable to use for some BC measurements methods. There would be no procedure change for the PA-soot meter and other high concentration measurement approaches (such as incandescence and smoke meters), but would require a procedure change for the MAAP, Aethalometer and other low concentration measurements methods.
Figure 2 Depiction of BC sampling recommendations for marine testing
Standard ISO 8178
Vessel Testing
Modified BC ISO 8178
The MAAP, Aethalometer, and other low concentration BC devices would require a sophisticated dilution system
to reach the 200 or more dilution ratios needed.
Standard BC ISO 8178
Real time BC instruments such as the PA, light
incandesces, smoke meter, and other high concentration source meters can be adopted
into the ISO 8178 method
Standard PM ISO 8178
PM (filter) and Gas Components
17

7 Summary and Conclusions Black carbon and other air pollutant emissions were characterized from a marine auxiliary engine equipped with a PM scrubber. The performance was based on the characterization of SOx, THCs, NOx, CO2, and particulate matter (PM), including PM2.5 mass (2.5 um fine particles only), elemental, organic and black carbon. Additionally the several real time and semi-real time BC measurement techniques were evaluated which were based on the principles of gravimetric net weight change, flame ionization detection, photoacoustic, aerosol absorption, and filter paper transmission The overall results and conclusions from this work can be summarized in the following highlights:
• BC measurements and the existing ISO 8178 sampling procedures work well for in-situ PA-soot type meters, but not for other filter batched type systems like the MAAP and Aethalometer, which are over the range for the ISO 8178 sampling procedures. There would be no procedure change for the PA-soot meter and other high concentration measurement approaches (such as incandescence and smoke meters), but would require a procedure change for the MAAP, Aethalometer and other low concentration measurements methods.
• Dilution ratio averaged 3.5 where higher dilutions could be utilized to allow other BC source measurements. High dilutions on the order of 200 to 1 are recommended.
• PA-soot, EC-NIOSH, EC-IMPROVE show similar control efficiency trend (high reduction for high load and low reduction for low load).
• Scrubber SOx mass reduction ranges from 95 to 97% with an average of more than 96% across the engine loads tested. This suggests sulfate PM may also be reduced by 96%. This agrees with expected performance for scrubbers (Krystallon 2011)
• Scrubber PM2.5 mass reduction ranges from 40 to 50% with an average of 45% across the engine loads tested. This agrees with expectations from the scrubber manufacturer (Krystallon 2011)
• Organic PM (OC) is reduced around 55% and ranges from 70 to 45%, depending on the method and mode. The NIOSH method is 40% higher than the IMPROVE method at the low load test point. The NIOSH method shows more OC reduction than the IMPROVE method.
• Results from this testing indicates that the scrubber technology is not as efficient at reducing black carbon at low loads as compared to high loads with the efficiency varying from 80% at high load to less than 10% at low loads.
18
References
1. ABS (2003), ABS Exhaust Gas Scrubber System Advisory, Status and Guidance, www.eagle.org, TX 02/13 5000 12319
2. Bluefield (2013), Evaluation of the Emissions Reduction Performance of a Hamworthy/Krystallon Exhaust Gas Cleaning Scrubber, Final Report MV APL England, May 2013
3. EPA (1998) Lesson 2: Operating Principles of Scrubbers, EPA document 2.0-7/98 4. Det Norske Veritas. Powerpoint presentation. "SOx Reduction, Class Involvement."
January 28, 2013 5. International Standards Organization, IS0 8178-1, Reciprocating internal combustion
engines - Exhaust emission measurement -Part 1: Test-bed measurement of gaseous particulate exhaust emissions, First edition 1996-08-l5
6. International Standards Organization, IS0 8178-2, Reciprocating internal combustion engines - Exhaust emission measurement -Part 2: Measurement of gaseous and particulate exhaust emissions at site, First edition 1996-08-l5
7. International Maritime Organization, Annex VI of MARPOL 73/78 “Regulations for the Prevention of Air Pollution from Ships and NOx Technical Code”.
8. Krystallon (2011) Design Specification 9. Moosmuller, H, Chakrabarty R, Arnott, W., (2009) Aerosol light absorption and its
measurement: A review, Journal of Quantitative Spectroscopy and Radiative Transfer, 110 (2009) 844-878
10. NIOSH, 1996. NIOSH Manual of Analytical Methods. National Institute of Occupational Safety and Health, Cincinnati, OH.
11. Petzold, A., Ogren, J. A., Fiebig, M., Laj, P., Li, S.-M., Baltensperger, U., Holzer-Popp, T., Kinne, S., Pappalardo, G., Sugimoto, N., Wehrli, C., Wiedensohler, A., and Zhang, X.-Y.: Recommendations for reporting "black carbon" measurements, Atmos. Chem. Phys., 13, 8365-8379, doi:10.5194/acp-13-8365-2013, 2013.
12. Bartocci, A., Aug 25, 2009 PMGasification Scrubbers for Particulate Control, http://www.envitechinc.com/air-pollution-control-innovations/bid/20837/Gasification-Scrubbers-for-Particulate-Control
19
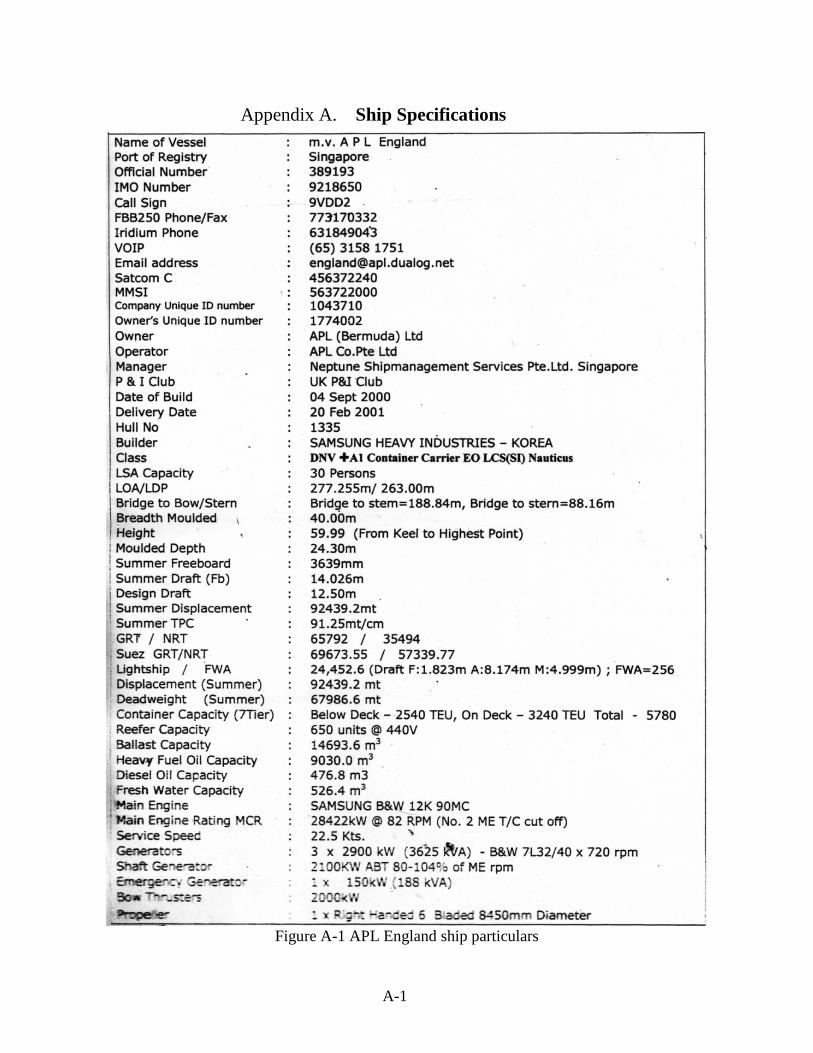
Ship Specifications Appendix A.
Figure A-1 APL England ship particulars
A-1

Figure A-2 APL AE engine specifications from on-ship manual
A-2

Figure A-3APL AE engine specifications from on-ship manual
Figure A-4 APL AE engine name plate photo
A-3

Figure A-5 APL AE engine generator name plate photo
A-4

Figure A-6 APL AE engine general overview photo
A-5

Scrubber Literature Appendix B. A process combination of gas and particulate matter (PM) scrubbing can be carried out in a number of flow configurations: countercurrent flow, cross-flow and co-flow through a venturi as shown in Figure B1. Design information on the counter current scrubber can be found in Keshavarz1 and Cooper2. The focus of this memo is on venturi scrubbers. For the case of the venturi scrubber there is section to separate the water droplets, often a cyclone separator or a packed column. All processes end with a gas velocity low enough to remove remaining water droplets in a mist/entrainment eliminator before the gas is vented to the atmosphere .
(c) Typical venturi scrubber with cyclone separator
Figure B1 Selected Configurations for a Gas & PM Scrubber2
Thus several design elements needed in the final design of a venturi scrubber for an on-board scrubber and these are covered in the following sections. Gas Scrubbing…One process for controlling sulfur oxides (SOx) and other acid gases released in the combustion process is through absorption of the gasses into the aqueous phase. For this study the main acid gases of interest were sulfur trioxide (SO3) or its reaction product with water, sulfuric acid, and sulfur dioxide (SO2), although there are also carbon dioxide and nitrogen oxides. Results indicate the reaction of SO2 to SO3 is slow so usually >95% of the sulfur in the feed is converted to SO2. Absorption of SOx gases into the aqueous phase is driven by the equilibrium and mass transfer rates. While equilibrium represents the ultimate state, mass
1 Keshavarz, P., Bozorgi, Y., J. Fathikalajahi J., M. Taheri, M., Prediction of the spray scrubbers’ performance in the gaseous and particulate scrubbing processes Chemical Engineering Journal 140, 22–31 (2008) 2 C. David Cooper and F. C. Alley, Air Pollution Control Technology: A Design Approach;; Waveland Press, Inc. 4th edition
B-1

transfer dictates the rate at which equilibrium is approached. Consequently, real world engineering data are needed to design systems to remove sulfur oxides and many processes are available3 given the number of regulations to control emissions of sulfur oxides. From a fundamental picture when removing sulfur oxides, the gas must be transferred from the bulk gaseous phase to the bulk aqueous phase. As indicated in Figure B2 the gas concentration is constant in the turbulent conditions of the bulk phase and then declines across the gas film to the interface where the transfer occurs. Thus a molecule of sulfur oxide in getting to the bulk liquid phase is transferred through two films and an interface which act as resistances and slow the overall process.
Figure B2 Schematic of the Gas Absorption Processes
For sulfur trioxide, there is only one resistance as the reaction at the interface is instantaneously and transfer is fast. For SO2, transfer in the liquid phase is slow so many of the industrial processes3 add a base to create an instantaneous reaction at the interface. One such case is a scrubber using the natural alkalinity of seawater. Table 1 provides an analysis from the University of Hawaii4 on the mineral makeup of seawater with a salinity of 35 pounds of salt per 1,000 pounds of sea water. Typical PH is about 8 and alkalinity is about 2.3 milli-equivalents per liter. Many commercial power plants, smelters and refineries have used this process for decades, some with guaranteed SOx removal efficiencies of 99%. Table 5 Chemical Composition and Major Ions in Seawater of Salinity 35
Final scrubber design would consider the liquid to gas ratio and diameter of the water droplets as that specifies the surface area where the absorption and mass transfer takes place. Passing the
3 Gas Purification; Arthur Kohl and Richard Nielson; Gulf Publishing Company; 5th Edition 4 http://www.soest.hawaii.edu/oceanography/courses/OCN623/Spring2010/salinity.pdf ; Chemical composition of seawater; Salinity and the Major Constituents
B-2

droplets through a venturi would speed the gas velocity and reduce the gas film thickness and resistance; thereby increasing the rate of absorption. In any case, the use of alkaline solutions to remove sulfur oxides at efficiencies >95% is well proved. PM Scrubbing with a Venturi: General terms… EPA describes wet scrubbing in their Air Pollution Training Institute (APTI)5 booklets. The design of a venturi scrubber to remove PM involves mechanisms fundamentally different from gas scrubbing. “Basically PM scrubbers are designed to generate high inertial forces on particles to drive them into the droplets while gas absorbers are designed to have high liquid surface areas and relatively long residence times to maximize the absorption of gaseous contaminants into liquid droplets. Despite the fundamental operating differences, most PM scrubbers have modest efficiencies for gaseous contaminant removal, and most gaseous absorbers have modest efficiencies for removal of PM >3µm.” The primary mechanism in venturi scrubbers is impaction. Impaction occurs when a particle has too much inertia to avoid a crashing into a droplet instead of following the gas streamlines and going around. Some books talk about Stokes number or stopping distance and particles cannot stop in time.
Figure B3 Particle Capture by Inertia Impaction
The efficiency of particle collection by impaction is proportional to the inertial impaction parameter shown in the equation below.
5 Environmental Protection Agency, APTI 413: Control of Particulate Matter Emissions Chapter 8 Wet Scrubbers, 5th Edition (1999)
B-3
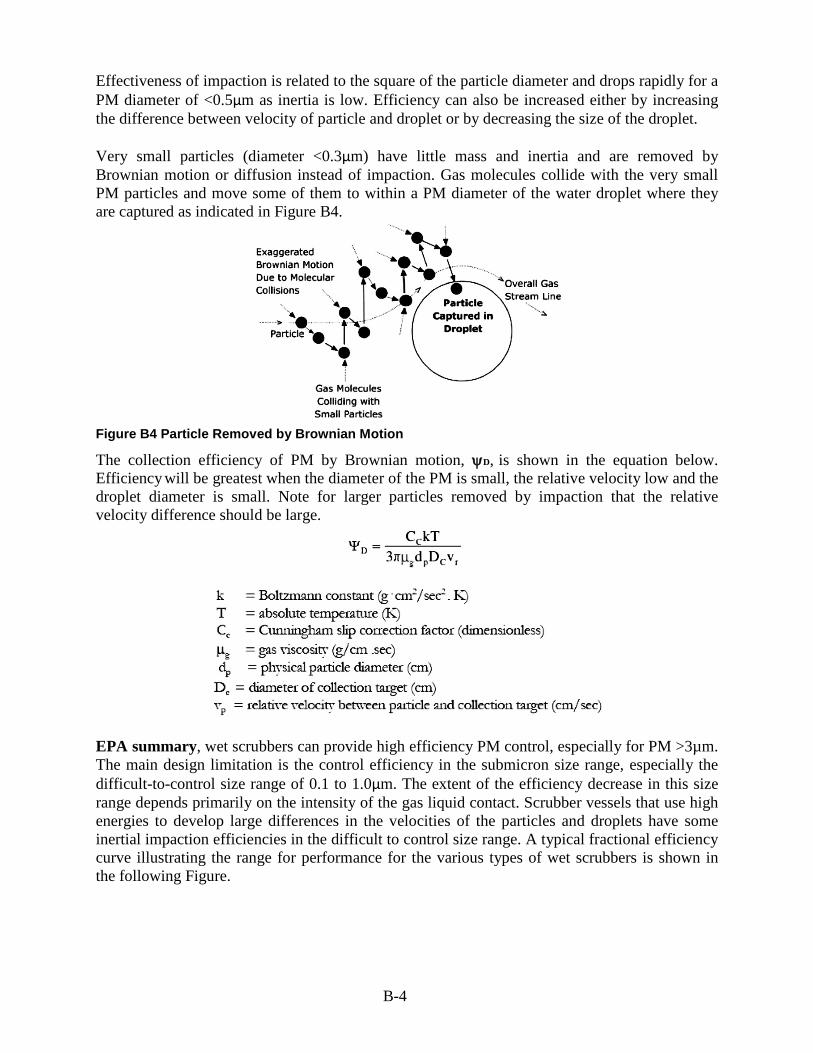
Effectiveness of impaction is related to the square of the particle diameter and drops rapidly for a PM diameter of <0.5µm as inertia is low. Efficiency can also be increased either by increasing the difference between velocity of particle and droplet or by decreasing the size of the droplet. Very small particles (diameter <0.3µm) have little mass and inertia and are removed by Brownian motion or diffusion instead of impaction. Gas molecules collide with the very small PM particles and move some of them to within a PM diameter of the water droplet where they are captured as indicated in Figure B4.
Figure B4 Particle Removed by Brownian Motion
The collection efficiency of PM by Brownian motion, ψD, is shown in the equation below. Efficiency will be greatest when the diameter of the PM is small, the relative velocity low and the droplet diameter is small. Note for larger particles removed by impaction that the relative velocity difference should be large.
EPA summary, wet scrubbers can provide high efficiency PM control, especially for PM >3µm. The main design limitation is the control efficiency in the submicron size range, especially the difficult-to-control size range of 0.1 to 1.0µm. The extent of the efficiency decrease in this size range depends primarily on the intensity of the gas liquid contact. Scrubber vessels that use high energies to develop large differences in the velocities of the particles and droplets have some inertial impaction efficiencies in the difficult to control size range. A typical fractional efficiency curve illustrating the range for performance for the various types of wet scrubbers is shown in the following Figure.
B-4

Figure B5 Typical Fractional Efficiency Curves for Various Types of Wet Scrubbers (EPA5)
PM Scrubbing with a Venturi: Design Approach…An understanding of the parameters that enable prediction of PM removed and pressure drop were first developed by Calvert6 in the 1970s at the University of California, Riverside. Basically a venturi scrubber involves prediction for two independent processes in order to estimate PM collection efficiency. One process is the generation and size of water droplets and the other is the scrubbing/removal of the PM from the gas stream. The commonly accepted tool for predicting droplet size resulting from liquid atomization by a gas jet is the empirical correlation of Nukiyama and Tanasawa7. Their analytical model for predicting the Sauter diameter is below.
Equation 1
Later Calvert simplified Equation 1 for systems of water and air showing the Sauter diameter varied directly with: 1) the volume ratio of water to air to the 1.5 power, and indirectly with the velocity of the gas.
6 Seymour Calvert, Venturi and Other Atomizing Scrubbers Efficiency and Pressure Drop, AlChE Journal Vol. 16, No. 3 392-396 (1970) 7 Nukiyama, S., and Y. Tanasawa, Tran. Soc Mech. Engrs. (Japan), 4, 86 ( 1938).
B-5

Equation 2
Where do = Sauter (surface/volume ratio) mean droplet diameter,µ vg = = gas velocity relative to duct, ft./sec. L’ = ratio of liquid to gas flow rates, ga1./1,000 cu.ft.
The second process in the venturi scrubber is the removal of PM mass for which Calvert developed an equation for estimating the penetration of PM as a function of particle diameter, Equation 3.
Equation 3
where
VG is the superficial gas velocity; Q is the volumetric flow rate of the L, liquid, and gas, G. f is an empirical factor; = 0.25 for hydrophobic PM and = 0.5 for hydrophilic PM. Other parameters: µ for viscosity and ρ is the density.
Example: Cooper2 shows the collection efficiency of venturi scrubber for 1µm particles with VG = 50m/s at the throat entrance; QL/QG = 1L/m3; atmospheric pressure and 20°C. In that example, the Sauter mean droplet diameter was 128 µm, about average for most venturi scrubbers according to the literature. The calculated value of the impaction parameter, Kp, was 2.41. The PM scrubbing efficiency was 48%.
B-6
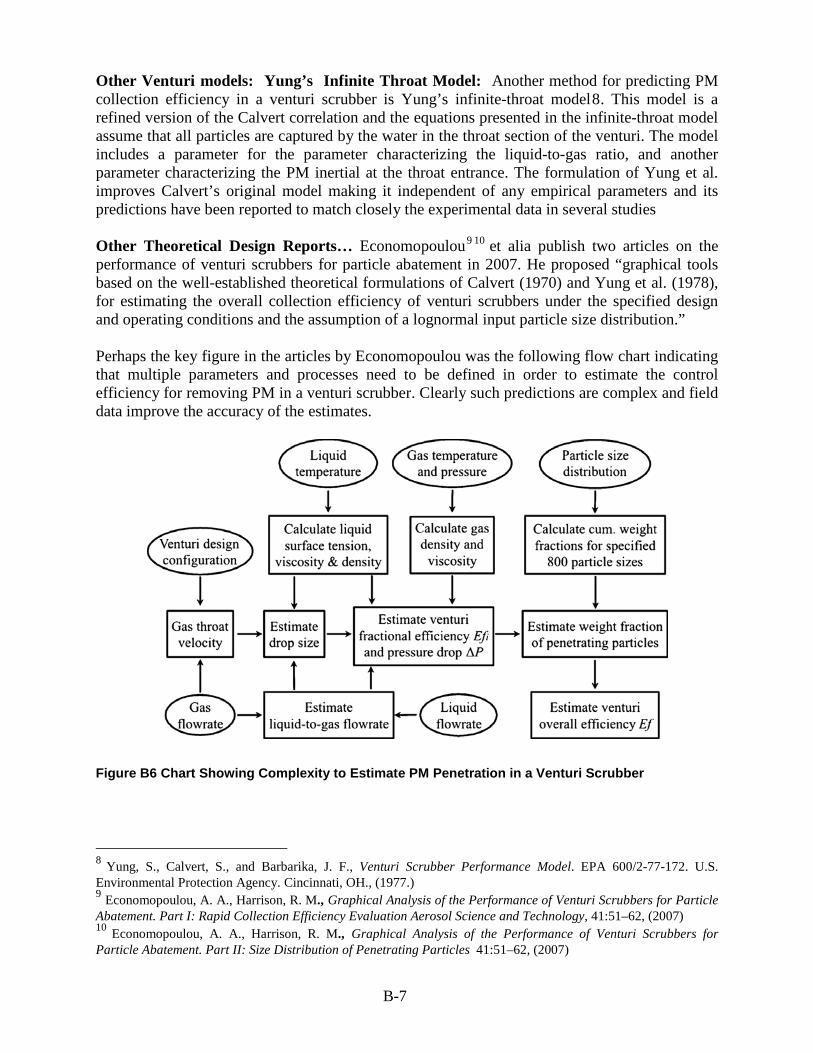
Other Venturi models: Yung’s Infinite Throat Model: Another method for predicting PM collection efficiency in a venturi scrubber is Yung’s infinite-throat model8. This model is a refined version of the Calvert correlation and the equations presented in the infinite-throat model assume that all particles are captured by the water in the throat section of the venturi. The model includes a parameter for the parameter characterizing the liquid-to-gas ratio, and another parameter characterizing the PM inertial at the throat entrance. The formulation of Yung et al. improves Calvert’s original model making it independent of any empirical parameters and its predictions have been reported to match closely the experimental data in several studies Other Theoretical Design Reports… Economopoulou9 10 et alia publish two articles on the performance of venturi scrubbers for particle abatement in 2007. He proposed “graphical tools based on the well-established theoretical formulations of Calvert (1970) and Yung et al. (1978), for estimating the overall collection efficiency of venturi scrubbers under the specified design and operating conditions and the assumption of a lognormal input particle size distribution.” Perhaps the key figure in the articles by Economopoulou was the following flow chart indicating that multiple parameters and processes need to be defined in order to estimate the control efficiency for removing PM in a venturi scrubber. Clearly such predictions are complex and field data improve the accuracy of the estimates.
Figure B6 Chart Showing Complexity to Estimate PM Penetration in a Venturi Scrubber
8 Yung, S., Calvert, S., and Barbarika, J. F., Venturi Scrubber Performance Model. EPA 600/2-77-172. U.S. Environmental Protection Agency. Cincinnati, OH., (1977.) 9 Economopoulou, A. A., Harrison, R. M., Graphical Analysis of the Performance of Venturi Scrubbers for Particle Abatement. Part I: Rapid Collection Efficiency Evaluation Aerosol Science and Technology, 41:51–62, (2007) 10 Economopoulou, A. A., Harrison, R. M., Graphical Analysis of the Performance of Venturi Scrubbers for Particle Abatement. Part II: Size Distribution of Penetrating Particles 41:51–62, (2007)
B-7

Additional Emissions Results Appendix C. This appendix contains additional emission results such as time specific emissions, measured concentrations, and gaseous emission reduction between pre and post scrubber samples. No gaseous emissions reductions over the scrubber are expected. The percent change over the scrubber reflects possible changes in engine out conditions and/or sampling conditions (dilution ratio or calibrations).
Table C-1 Average measured concentration and dilution ratio
Table C-2 Average measured concentration and dilution ratio
Nominal eLoad 4 Load NOx CO CO2 PM2.5 PA-soot 1
Load e_kW % g/kWh g/kWh g/kWh mg/kWh mg/kWhPost M1 1689 58.2% 10.79 0.62 717.8 206.2 5.6Post M2 1279 44.1% 9.76 0.89 719.1 199.5 22.2Post M3 595 20.5% 10.75 1.63 819.7 294.4 88.2Pre M1 1602 55.2% 10.66 0.83 752.2 407.6 28.6Pre M2 1243 42.9% 10.90 0.99 781.8 373.3 32.5Pre M3 603 20.8% 9.99 2.05 805.2 491.1 90.5
Nominal NOx CO CO2 O2 SO2 PA-soot 1 MAAP 2 Aeth 3 DR 4 PM2.5 EC OC EC OCLoad ppm ppm % % ppm mg/m3 mg/m3 mg/m3 n/a mg/m3 mg/m3 mg/m3 mg/m3 mg/m3
Post M1 302.1 28.3 2.10% 18.2% 1.8 0.30 >50 ug >50 ug 3.05 11.0 0.2 4.3 0.4 4.0Post M2 254.0 37.8 1.96% 18.3% 1.9 1.10 >50 ug >50 ug 2.93 9.9 0.7 4.1 1.4 3.7Post M3 175.0 43.6 1.39% 19.0% 2.0 2.74 >50 ug >50 ug 3.01 9.2 3.1 3.9 4.1 3.0Pre M1 255.9 32.6 1.89% 18.4% 56.4 1.32 >50 ug >50 ug 3.47 18.7 1.4 11.8 1.6 7.7Pre M2 242.1 36.0 1.82% 18.5% 55.7 1.38 >50 ug >50 ug 3.44 15.9 1.2 7.8 1.7 6.7Pre M3 176.5 59.7 1.49% 18.9% 46.0 3.06 >50 ug >50 ug 2.82 16.6 4.0 10.0 4.1 5.9
NIOSH IMPROVE
1 MSS i s the AVL 483 micro soot sensor that measures the acoustic properties of PM or black carbon2 MAAP is a mass aerosol particle. The MAAP over ranged at 50 ug/m3 (concentration ranged from 200 to 10,000 ug/m3)3 Aeth i s the aethalometer which uses the l ight scattering principle to measure PM concentration. Aeth over ranged a lso.4 ISO-8178-1 2006 Chapter 12.4 "Adjustment of the di lution ratio": Speci fication i s minimum of 4 to 1. We were s l ightly lower.
C-1

Table C-3 PM and gaseous change during scrubber testing (NIOSH EC/OC)
Nominal eLoad Load SO2 PM2.5 EC OC NOx CO CO2Load e_hp % % % % % % % %
M1 Effic #DIV/0! 57% -97% -49% -88% -69% 1% -25% -5%M2 Effic #DIV/0! 43% -97% -47% -49% -55% -10% -10% -8%M3 Effic #DIV/0! 21% -95% -40% n/a -57% 8% -21% 2%
1 MSS i s the AVL 483 micro soot sensor that measures the acoustic properties of PM or black carbon2 MAAP is a mass aerosol particle. The MAAP over ranged at 50 ug/m3 (concentration ranged from 200 to 10,000 ug/m3)3 Aeth i s the aethalometer which uses the l ight scattering principle to measure PM concentration. Aeth over ranged a lso.4 Engine load i s expected to be higher than electrica l load by the a l ternator efficiency and cool ing losses
Tota l Al t efficiency at 100% load i s typica l ly 97% and 80% at less than 50% load. At these conditions the bsCO2 is
estimated at 500 g/bhp-h which i s expected for large sca le medium speed diesel engines .
C-2

Test logs Appendix D.
Table D-1 Engine test log
Fixed 1
Time Load kW Amps Inake P_bar Intake T_C RPM Location Comments9:00 1708 2702 1.65 42 720 Post9:28 1701 2704 1.64 42 720 Post9:39 1684 2671 1.63 42 720 Post9:47 1714 2722 1.70 44 720 Post Picture on engine plate and generator10:13 1636 2605 1.61 42 720 Post10:17 Changing loads to 40%10:26 1326 2045 1.30 42 720 Post10:38 1282 1992 1.22 42 720 Post10:56 1229 1847 1.20 42 720 Post11:05 Changing loads to 20%11:11 605 860 0.62 41 720 Post11:39 590 855 0.61 41 720 Post12:01 591 895 0.61 41 720 Post12:05 Switching probes12:57 604 921 0.61 42 720 Pre13:10 601 928 0.61 42 720 Pre13:12 Change Loads13:23 1235 1845 1.18 42 720 Pre13:28 1251 1880 1.16 42 720 Pre13:34 Change Loads13:35 1603 2460 1.57 42 720 Pre13:42 1600 2470 1.56 42 720 Pre
ACONIS-PMS Engine
1 According to the chief engineer the RPM was fixed at 720 RPM. The manual as lo sa id the same thing2 Engine rated at max load of 3265 kW with an electrica l capaci ty of 2900kW at a PF = 0.8. The displacment
for the engine according to the manual (see picture) i s 31.17 dm3/cyl inder (dm3 = decimeter cubed or one l i ter). Thus ,
at 7 cyl inders this wi l l be 31.17*7 = 218.19 l i ters of displacement. The engine i s boosted where intake P and T are the
intake pressures and temperatures for each test point.
D-1

Table D-2 Filter log and summary weights
Initial Weights Final Weights NETSerial ID (mg/filter) (mg/filter) (mg/filter)
P0672968 137.7865 137.9917 0.2047 pending final weights
P0672969 136.9967 138.9755 1.9789 pending final weights
P0672971 134.3308 136.2145 1.8837 pending final weights
P0672972 139.0258 140.6669 1.6411 pending final weights
P0672975 136.9461 138.7805 1.8344 pending final weights
P0672973 140.9822 142.4008 1.4182 pending final weights
P0672974 137.7520 139.4067 1.6547 pending final weights
P0672956 141.4956 143.0472 1.5516 pending final weights
P0672960 140.8009 141.7687 0.9678 pending final weights
P0672958 142.2253 143.2410 1.0171 pending final weights
P0672959 141.8570 142.7066 0.8500 pending final weights
P0672961 141.2802 142.0954 0.8152 pending final weights
P0672962 141.1801 142.2563 1.0762 pending final weights
P0672965 137.3899 138.2779 0.8892 pending final weights
WT130138
WT130146
9/6/213
9/6/213
9/6/213
9/6/213
9/6/213WT130144
CE-CERTCollege of Engineering: Center for Environmental Research and Technology
Sample ID Date Received
WT130137
9/6/213
WT130145
WT130139
WT130141
WT130142
WT130143
WT130135
WT130136
Project Fund #:Send Results: Kent Johnson
Analytical LaboratoryUniversity of California, RiversideData Results For TEFLON Filters
9/6/213
9/6/213
9/6/213
Project Name: Bristol Harbor Boat TestingPI/Contact: Kent Johnson
WT130132
WT130133
WT130134
COMMENTSInitials
9/6/213
9/6/213
9/6/213
9/6/213
9/6/213
D-2

Table D-3 Summary EC/OC data IMPROVE method
Table D-4 Summary EC/OC data NIOSH method
Sample ID
OC(ug/sq cm) OC unc
EC(ug/sq cm) EC unc
TC(ug/sq cm) TC unc
EC/TC ratio Date Time
calibration area Analyst
EC weight
OC weight
Split time
Q130001 75.91599 3.895799 10.13852 0.606926 86.0545 4.502725 0.117815 9/12/2013 12:54:49 PM 91795 Nolan 97.54 730.40 795Q130002 70.3532 3.61766 8.032979 0.501649 78.38618 4.119309 0.10248 9/12/2013 2:24:44 PM 92058 Nolan 77.29 676.88 796Q130003 64.40951 3.320475 7.016529 0.450826 71.42603 3.771302 9.82E-02 9/12/2013 3:19:35 PM 375772 Nolan 67.51 619.69 792Q130004 66.2193 3.410965 20.96554 1.148277 87.18484 4.559242 0.240472 9/16/2013 3:03:13 PM 257773 Henry 201.71 637.10 786Q130005 58.75832 3.037916 25.21708 1.360854 83.9754 4.39877 0.300291 9/16/2013 3:46:03 PM 350736 Henry 242.62 565.32 782Q130006 59.15779 3.05789 71.64716 3.682358 130.805 6.740248 0.54774 9/16/2013 4:36:01 PM 131771 Henry 689.33 569.16 783Q130007 50.01562 2.600781 69.76861 3.58843 119.7842 6.189211 0.582452 9/17/2013 10:55:31 AM 344929 Henry 671.25 481.21 775Q130009 39.44017 2.072009 27.34836 1.467418 66.78853 3.539426 0.409477 9/17/2013 11:27:46 AM 347067 Henry 263.12 379.46 772Q130009_2Q130010 38.68979 2.03449 31.92866 1.696433 70.61845 3.730923 0.452129 9/17/2013 12:03:54 PM 348102 Henry 307.19 372.24 771Q130011 35.70439 1.88522 10.43807 0.621903 46.14246 2.507123 0.226214 9/17/2013 2:16:27 PM 367680 Henry 100.43 343.52 783Q130012 32.15274 1.707637 7.035389 0.45177 39.18813 2.159407 0.179529 9/17/2013 2:52:07 PM 362794 Henry 67.69 309.35 795Q130013 42.97473 2.248736 10.82032 0.641016 53.79504 2.889752 0.20114 9/17/2013 3:25:34 PM 361648 Henry 104.10 413.47 789Q130014 34.39335 1.819668 5.514058 0.375703 39.90741 2.19537 0.138171 9/17/2013 4:00:14 PM 360440 Henry 53.05 330.90 806
Sample ID OC(ug/sq cm) OC unc EC(ug/sq cm) EC unc TC(ug/sq cm) TC unc EC/TC ratio Date Timecalibration area Analyst EC weight OC weight
Split time
Q130001 71.9438 3.69719 3.598105 0.2799053 75.54191 3.977095 4.76E-02 9/9/2013 2:07:23 PM 345414 Henry 34.62 692.18 587Q130002 74.11252 3.805626 3.576632 0.2788316 77.68915 4.084457 4.60E-02 9/9/2013 2:46:18 PM 345097 Henry 34.41 713.05 575Q130003 69.36564 3.568282 3.057932 0.2528966 72.42357 3.821178 4.22E-02 9/9/2013 3:14:26 PM 344833 Henry 29.42 667.38 589Q130004 69.69212 3.584606 9.198255 0.5599127 78.89038 4.144519 0.1165954 9/9/2013 3:36:50 PM 305365 Henry 88.50 670.52 566Q130005 68.69747 3.534873 14.48324 0.8241619 83.18071 4.359035 0.1741178 9/9/2013 4:00:36 PM 343619 Henry 139.35 660.95 564Q130006 47.02869 2.451434 26.53219 1.426609 73.56087 3.878044 0.3606834 9/10/2013 4:58:14 PM 356317 Henry 255.27 452.47 549Q130007 66.508 3.4254 51.92102 2.696051 118.429 6.121451 0.4384147 9/11/2013 12:02:34 PM 358652 Henry 499.54 639.88 564Q130009 112.1341 5.706707 73.88271 3.794136 186.0169 9.500843 0.3971829 9/11/2013 2:15:49 PM 32525 Henry 710.83 1078.86 472Q130009_2 5.390052 0.369503 1.830355 0.1915177 7.220407 0.5610204 0.2534974 9/11/2013 2:53:34 PM 254802 Henry 17.61 51.86 848Q130010 44.81749 2.340874 23.22489 1.261244 68.04237 3.602119 0.3413298 9/11/2013 3:34:54 PM 369894 Henry 223.45 431.19 558Q130011 44.28608 2.314304 7.594243 0.4797121 51.88033 2.794016 0.14638 9/11/2013 4:36:03 PM 281767 Henry 73.07 426.08 569Q130012 34.23694 1.811847 4.411888 0.3205944 38.64883 2.132441 0.1141532 9/11/2013 5:08:46 PM 363837 Henry 42.45 329.40 581Q130013 48.00858 2.500429 6.312881 0.4156441 54.32146 2.916073 0.1162134 9/11/2013 5:31:39 PM 356899 Henry 60.74 461.90 576Q130014 71.58469 3.679235 7.460981 0.473049 79.04568 4.152284 9.44E-02 9/11/2013 5:57:56 PM 122311 Henry 71.78 688.73 588
3

Relevant published results Appendix E. Previous tests by UCR of the same engine show similar engine out results. Figure E-1 c “before SCR” shows the bsNOx emissions to range from 13 g/kWhr to 9g/kWhr at 22 to 69% load and PM to range from 700 mg/kWhr to 200 mg/kWhr. The result in the current test show similar NOx results, but the PM agrees better at the high load and is half the previous value at light load.
Figure E-1 Selected emission rates from previous tests on a similar auxiliary engine
F- E-1
Sampling system description Appendix F. ISO 8178-111 and ISO 8178-212 specify the measurement and evaluation methods for gaseous and particulate exhaust emissions when combined with combinations of engine load and speed provided in IS0 8178- Part 4: Test cycles for different engine applications. The emission results represent the mass rate of emissions per unit of work accomplished. Specific emission factors are based on brake power measured at the crankshaft, the engine being equipped only with the standard auxiliaries necessary for its operation. Per ISO, auxiliary losses are <5 % of the maximum observed power. IMO ship pollution rules and measurement methods are contained in the “International Convention on the Prevention of Pollution from Ships”, known as MARPOL 73/7813, and sets limits on NOx and SOx emissions from ship exhausts. The intent of this protocol was to conform as closely as practical to both the ISO and IMO standards. Gaseous and Particulate Emissions A properly designed sampling system is essential to accurate collection of a representative sample from the exhaust and subsequent analysis. ISO points out that particulate must be collected in either a full flow or partial flow dilution system and UCR chose the partial flow dilution system with single venturi as shown in Figure E-1.
11 International Standards Organization, IS0 8178-1, Reciprocating internal combustion engines - Exhaust emission measurement -Part 1: Test-bed measurement of gaseous particulate exhaust emissions, First edition 1996-08-l5 12 International Standards Organization, IS0 8178-2, Reciprocating internal combustion engines - Exhaust emission measurement -Part 2: Measurement of gaseous and particulate exhaust emissions at site, First edition 1996-08-l5 13 International Maritime Organization, Annex VI of MARPOL 73/78 “Regulations for the Prevention of Air Pollution from Ships and NOx Technical Code”.
F-1

Figure E-1 Partial Flow Dilution System with Single Venturi
A partial flow dilution system was selected based on cost and the impossibility of a full flow dilution for “medium and large” engine testing on the test bed and at site. The flow in the dilution system eliminates water condensation in the dilution and sampling systems and maintains the temperature of the diluted exhaust gas at <52°C before the filters. ISO cautions the advantages of partial flow dilution systems can be lost to potential problems such as: losing particulates in the transfer tube, failing to take a representative sample from the engine exhaust and inaccurately determining the dilution ratio. An overview of UCR’s partial dilution system in Figure E-1 shows that raw exhaust gas is transferred from the exhaust pipe (EP) through a sampling probe (SP) and the transfer tube (TT) to a dilution tunnel (DT) due to the negative pressure created by the venturi (VN) in DT. The gas flow rate through TT depends on the momentum exchange at the venturi zone and is therefore affected by the absolute temperature of the gas at the exit of TT. Consequently, the exhaust split for a given tunnel flow rate is not constant, and the dilution ratio at low load is slightly lower than at high load. More detail on the key components is provided in Table E-1. Dilution Air System A partial flow dilution system requires dilution air and UCR uses compressed air in the field as it is readily available. ISO recommends the dilution air be at 25 ±5°C, filtered and charcoal scrubbed to eliminate background hydrocarbons. The dilution air may be dehumidified. To ensure the compressed air is of a high quality UCR processes any
EGA2
d
Real Time PM
Air DA
Dilution Tunnel (DT)
l > 10 d
Exhaus
S
EGA1
V
T
Secondary dilution
Vent
Quart
PTF
To Vacuum
Cyclone
CF
EP
F-2

supplied air through a field processing unit that reduces the pressure to about 30psig as that level allows a dilution ratio of about 5/1 in the geometry of our system. The next stages, in sequence, include: a liquid knock-out vessel, desiccant to remove moisture with silica gel containing an indicator, hydrocarbon removal with activated charcoal and a HEPA filter for the fine aerosols that might be present in the supply air. The silica gel and activated carbon are changed for each field campaign. Figure E-2 shows the field processing unit in its transport case. In the field the case is used as a framework for supporting the unit
Figure E-2 Field Processing Unit for Purifying Dilution Air in Carrying Case
F-3

Table E-1 Components of a Sampling System: ISO/IMO Criteria & UCR Design Section Selected ISO and IMO Criteria UCR Design
Exhaust Pipe (EP)
In the sampling section, the gas velocity is > 10 m/s, except at idle, and bends are minimized to reduce inertial deposition of PM. Sample position is 6 pipe diameters of straight pipe upstream and 3 pipe diameters downstream of the probe.
UCR follows the ISO recommendation, as closely as practical.
Sampling Probe (SP) -
The minimum inside diameter is 4 mm and the probe is an open tube facing upstream on the exhaust pipe centerline. No IMO code.
UCR uses a stainless steel tube with diameter of 8mm placed near the center line.
Transfer Tube (TT)
• As short as possible and < 5 m in length; • Equal to/greater than probe diameter & < 25 mm diameter; • TTs insulated. For TTs > 1m, heat wall temperature to a minimum of 250°C or
set for < 5% thermophoretic losses of PM.
UCR no longer uses a transfer tube.
Dilution Tunnel (DT)
• shall be of a sufficient length to cause complete mixing of the exhaust and dilution air under turbulent flow conditions;
• shall be at least 75 mm inside diameter (ID) for the fractional sampling type, constructed of stainless steel with a thickness of > 1.5 mm.
UCR uses fractional sampling; stainless steel tunnel has an ID of 50mm and thickness of 1.5mm.
Venturi (VN) -- The pressure drop across the venturi in the DT creates suction at the exit of the transfer tube TT and gas flow rate through TT is basically proportional to the flow rate of the dilution air and pressure drop.
Venturi proprietary design provided by MAN B&W; provides turbulent mixing.
Exhaust Gas Analyzers (EGA)
One or several analyzers may be used to determine the concentrations. Calibration and accuracy for the analyzers are like those for measuring the gaseous emissions.
UCR uses a 5-gas analyzer meeting IMO/ISO specs
4

Calculating the Dilution Ratio According to ISO 8178, “it is essential that the dilution ratio be determined very accurately” for a partial flow dilution system such as what UCR uses. The dilution ratio is simply calculated from measured gas concentrations of CO2 and/or NOx in the raw exhaust gas, the diluted exhaust gas and the dilution air. UCR has found it useful to independently determine the dilution ration from both CO2 and NOx and compare the values to ensure that they are within ±10%. UCR’s experience indicates the independently determined dilution ratios are usually within 5%. At systematic deviations within this range, the measured dilution ratio can be corrected, using the calculated dilution ratio. According to ISO, dilution air is set to obtain a maximum filter face temperature of <52°C and the dilution ratio shall be > 4. Dilution System Integrity Check ISO describes the necessity of measuring all flows accurately with traceable methods and provides a path and metric to quantifying the leakage in the analyzer circuits. UCR has adopted the leakage test and its metrics as a check for the dilution system. According to ISO the maximum allowable leakage rate on the vacuum side shall be 0.5 % of the in-use flow rate for the portion of the system being checked. Such a low leakage rate allows confidence in the integrity of the partial flow system and its dilution tunnel. Experience has taught UCR that the flow rate selected should be the lowest rate in the system under test. Measuring the Gaseous Emissions: CO, CO2, HC, NOx, O2, SO2 Measurement of the concentration of the main gaseous constituents is one of the key activities in measuring emission factors. This section covers the ISO/IMO protocols and that used by UCR. For SO2, ISO recommends and UCR concurs that the concentration of SO2 is calculated based on the fact that 95+% of the fuel sulfur is converted to SO2. Measuring Gaseous Emissions: ISO & IMO Criteria ISO specifies that either one or two sampling probes located in close proximity in the raw gas can be used and the sample split for different analyzers. However, in no case can condensation of exhaust components, including water and sulfuric acid, occur at any point of the analytical system. ISO specifies the analytical instruments for determining the gaseous concentration in either raw or diluted exhaust gases.
• Heated flame ionization detector (HFID) for the measurement of hydrocarbons; • Non-dispersive infrared analyzer (NDIR) for the measurement of carbon monoxide and
carbon dioxide; • Heated chemiluminescent detector (HCLD) or equivalent for measurement of nitrogen
oxides; • Paramagnetic detector (PMD) or equivalent for measurement of oxygen.
ISO states the range of the analyzers shall accurately cover the anticipated concentration of the gases and recorded values between 15% and 100% of full scale. A calibration curve with five points is specified. However, with modern electronic recording devices, like a computer, ISO allows the range to be expanded with additional calibrations. ISO details instructions for establishing a calibration curve below 15%. In general, calibration curves must be < ±2 % of each calibration point and by < ±1 % of full scale zero.
5

ISO outlines their verification method. Each operating range is checked prior to analysis by using a zero gas and a span gas whose nominal value is more than 80 % of full scale of the measuring range. If, for the two points considered, the value found does not differ by more than ±4 % of full scale from the declared reference value, the adjustment parameters may be modified. If >4%, a new calibration curve is needed. ISO & IMO specify the operation of the HCLD. The efficiency of the converter used for the conversion of NO2 into NO is tested prior to each calibration of the NOx analyzer. The efficiency of the converter shall be > 90 %, and >95 % is strongly recommended. ISO requires measurement of the effects from exhaust gases on the measured values of CO, CO2, NOx, and 02. Interference can either be positive or negative. Positive interference occurs in NDIR and PMD instruments where the interfering gas gives rise to the same effect as the gas being measured, but to a lesser degree. Negative interference occurs in NDIR instruments due to the interfering gas broadening the absorption band of the measured gas, and in HCLD instruments due to the interfering gas quenching the radiation. Interference checks are recommended prior to an analyzer’s initial use and after major service intervals. Measuring Gaseous Emissions: UCR Design The concentrations of CO, CO2, NOx and O2 in the raw exhaust and in the dilution tunnel are measured with a Horiba PG-250 portable multi-gas analyzer. The PG-250 simultaneously measures five separate gas components with methods recommended by the ISO/IMO and USEPA. The signal output of the instrument is connected to a laptop computer through an RS-232C interface to continuously record measured values. Major features include a built-in sample conditioning system with sample pump, filters, and a thermoelectric cooler. The performance of the PG-250 was tested and verified under the U.S. EPA ETV program.
Figure E-3 Setup Showing Gas Analyzer with Computer for Continuous Data Logging
Details of the gases and the ranges for the Horiba instrument are shown in Table E-2. Note that the Horiba instrument measured sulfur oxides (SO2); however, the UCR follows the protocol in ISO and calculates the SO2 level from the sulfur content of the fuel as the direct measurement for SO2 is less precise than calculation.
6

Table E-2 Detector Method and Concentration Ranges for Monitor
Component Detector Ranges
Nitrogen Oxides (NOx) Heated Chemiluminescence
Detector (HCLD) 0-25, 50, 100, 250, 500, 1000, & 2500 ppmv
Carbon Monoxide (CO) Non dispersive Infrared Absorption
(NDIR) 0-200, 500, 1000, 2000, & 5000 ppmv
Carbon Dioxide (CO2) Non dispersive Infrared Absorption
(NDIR) 0-5, 10, & 20 vol%
Sulfur Dioxide (SO2) Non dispersive Infrared Absorption
(NDIR) 0-200, 500, 1000, & 3000 ppmv
Oxygen Zirconium oxide sensor 0-5, 10, & 25 vol%
For quality control, UCR carries out analyzer checks with calibration gases both before and after each test to check for drift. Because the instrument measures the concentration of five gases, the calibration gases are a blend of several gases (super-blend) made to within 1% specifications. Experience has shown that the drift is within manufacturer specifications of ±1% full scale per day shown in Table E-3. The PG-250 meets the analyzer specifications in ISO 8178-1 Section 7.4 for repeatability, accuracy, noise, span drift, zero drift and gas drying.
Table E-3 Quality Specifications for the Horiba PG-250
Repeatability ±0.5% F.S. (NOx: </= 100ppm range CO: </= 1,000ppm range) ±1.0% F. S.
Linearity ±2.0% F.S. Drift ±1.0% F. S./day (SO2: ±2.0% F.S./day)
7

Measuring the Particulate Matter (PM) Emissions ISO 8178-1 defines particulates as any material collected on a specified filter medium after diluting exhaust gases with clean, filtered air at a temperature of </= 52ºC, as measured at a point immediately upstream of the primary filter. The particulate consists of primarily carbon, condensed hydrocarbons and sulfates, and associated water. Measuring particulates requires a dilution system and UCR selected a partial flow dilution system. The dilution system design completely eliminates water condensation in the dilution/sampling systems and maintains the temperature of the diluted exhaust gas at < 52°C immediately upstream of the filter holders. IMO does not offer a protocol for measuring PM. A comparison of the ISO and UCR practices for sampling PM is shown in Table E-3 Table E-3 Measuring Particulate by ISO and UCR Methods
ISO UCR Dilution tunnel Either full or partial flow Partial flow Tunnel & sampling system Electrically conductive Same Pretreatment None Cyclone, removes >2.5µm Filter material Fluorocarbon based Teflon (TFE) Filter size, mm 47 (37mm stain diameter) Same Number of filters in series Two One Number of filters in parallel Only single filter Two; 1 TFE & 1 Quartz Number of filters per mode Single or multiple Multiple Filter face temp. °C < 52 Same Filter face velocity, cm/sec 35 to 80. ~33 Pressure drop, kPa For test <25 Same Filter loading, µg >500 500-1,000 + water w/sulfate Weighing chamber 22±3°C & RH= 45%± 8 Same Analytical balance, LDL µg 10 0.5 Flow measurement Traceable method Same Flow calibration, months < 3months Every campaign Sulfur content. According to ISO, particulates measured using IS0 8178 are “conclusively proven” to be effective for fuel sulfur levels up to 0.8%. UCR is often faced with measuring PM for fuels with sulfur content exceeding 0.8% and has extended this method to those fuels as no other method is prescribed for fuels with a higher sulfur content. Added Comments about UCR’s Measurement of PM In the field UCR uses a raw particulate sampling probe fitted close to and upstream of the raw gaseous sample probe and directs the PM sample to the dilution tunnel. There are two gases stream leaving the dilution tunnel; the major flow vented outside the tunnel and the minor flow directed to a cyclone separator, sized to remove particles >2.5um. The line leaving the cyclone separator is split into two lines; each line has a 47 Gelman filter holder. One holder collects PM on a Teflon filter and the other collects PM on a quartz filter. UCR simultaneously collects PM on Teflon and quartz filters at each operating mode and analyzes them according to standard procedures.
8
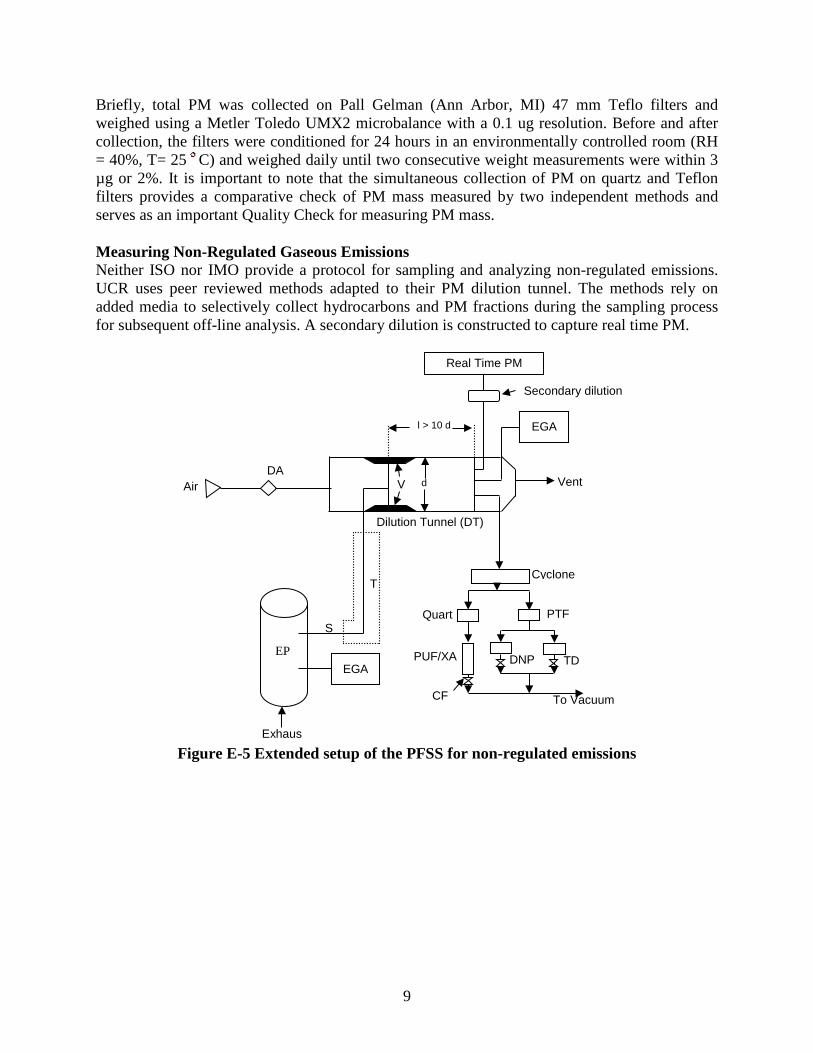
Briefly, total PM was collected on Pall Gelman (Ann Arbor, MI) 47 mm Teflo filters and weighed using a Metler Toledo UMX2 microbalance with a 0.1 ug resolution. Before and after collection, the filters were conditioned for 24 hours in an environmentally controlled room (RH = 40%, T= 25 C) and weighed daily until two consecutive weight measurements were within 3 µg or 2%. It is important to note that the simultaneous collection of PM on quartz and Teflon filters provides a comparative check of PM mass measured by two independent methods and serves as an important Quality Check for measuring PM mass. Measuring Non-Regulated Gaseous Emissions Neither ISO nor IMO provide a protocol for sampling and analyzing non-regulated emissions. UCR uses peer reviewed methods adapted to their PM dilution tunnel. The methods rely on added media to selectively collect hydrocarbons and PM fractions during the sampling process for subsequent off-line analysis. A secondary dilution is constructed to capture real time PM.
Figure E-5 Extended setup of the PFSS for non-regulated emissions
EGA
d
Real Time PM
Air DA
Dilution Tunnel (DT)
l > 10 d
Exhaus
S
EGA
V
T
Secondary dilution
Vent
Quart
PTF
PUF/XA
DNP
TD
To Vacuum
Cyclone
CF
EP
9
![Control of Gaseous Emissions Chapter 1_final[1].pdf](https://static.fdocuments.us/doc/165x107/577cde7e1a28ab9e78af413c/control-of-gaseous-emissions-chapter-1final1pdf.jpg)