![Learning human behaviors and lifestyle by capturing ...let allocation (LDA) model [3]. The LDA can infer the function (LDA \topic") of a region (LDA \document") in a city, e.g., educational](https://static.fdocuments.us/doc/165x107/5f660a21498c6c339720e9c1/learning-human-behaviors-and-lifestyle-by-capturing-let-allocation-lda-model.jpg)
AN OVERVIEW OF INDIA January 2007 Information contained in this document is prepared by The Boston...
27
AN OVERVIEW OF INDIA January 2007 Information contained in this document is prepared by The Boston Consulting Group, Lda
-
Upload
jewel-shipwash -
Category
Documents
-
view
213 -
download
1
Transcript of AN OVERVIEW OF INDIA January 2007 Information contained in this document is prepared by The Boston...
AN OVERVIEW OF INDIA
January 2007
Information contained in this document is prepared by The Boston Consulting Group, Lda
- 2 -- 2 -Copyright BCG
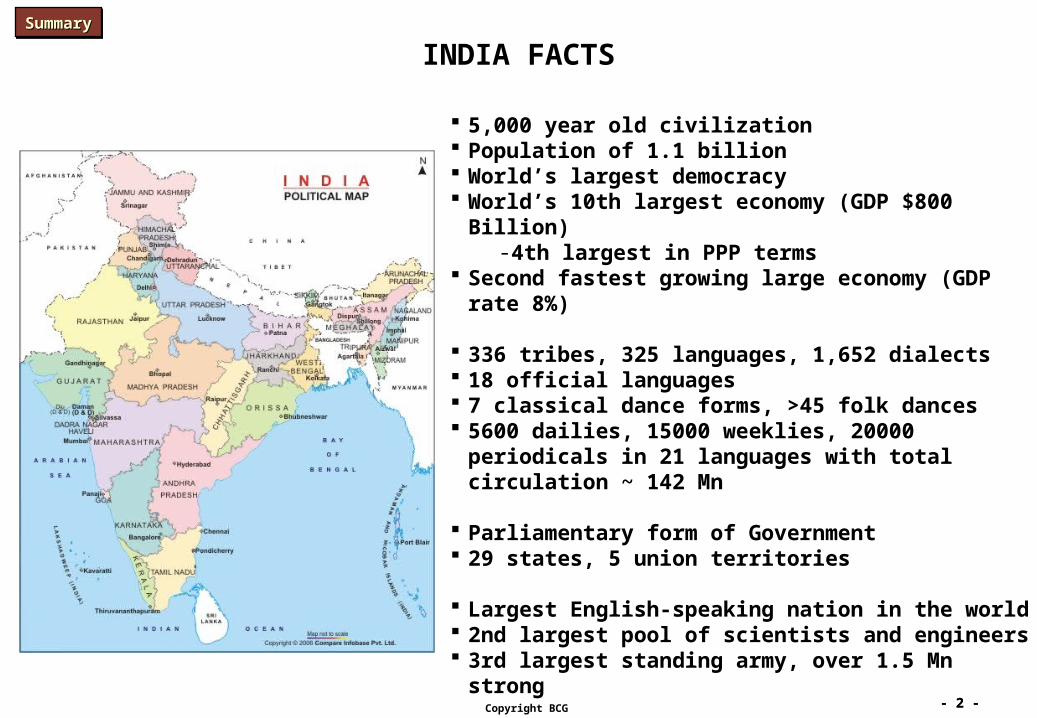
5,000 year old civilization Population of 1.1 billion World’s largest democracy World’s 10th largest economy (GDP $800 Billion)
-4th largest in PPP terms Second fastest growing large economy (GDP rate 8%)
336 tribes, 325 languages, 1,652 dialects 18 official languages 7 classical dance forms, >45 folk dances 5600 dailies, 15000 weeklies, 20000 periodicals in 21
languages with total circulation ~ 142 Mn
Parliamentary form of Government 29 states, 5 union territories
Largest English-speaking nation in the world 2nd largest pool of scientists and engineers 3rd largest standing army, over 1.5 Mn strong
INDIA FACTSSummarySummarySummarySummary
- 3 -- 3 -Copyright BCG
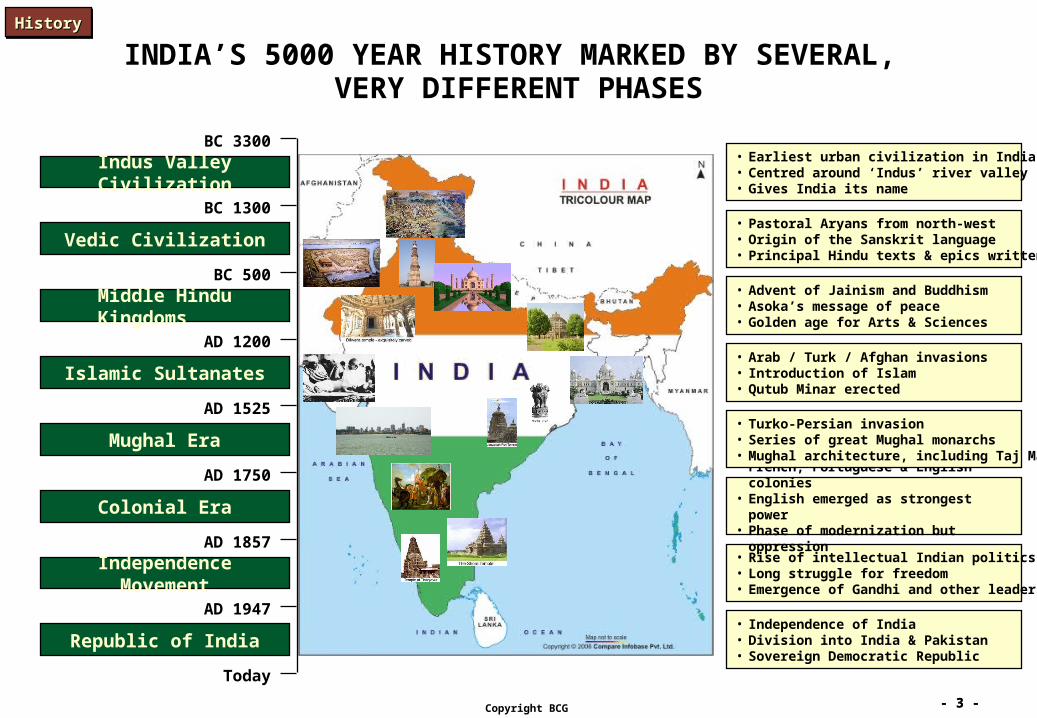
INDIA’S 5000 YEAR HISTORY MARKED BY SEVERAL, VERY DIFFERENT PHASES
Indus Valley Civilization
Vedic Civilization
Middle Hindu Kingdoms
Islamic Sultanates
Mughal Era
Colonial Era
Republic of India
Independence Movement
BC 3300
BC 1300
BC 500
AD 1200
AD 1525
AD 1750
AD 1857
AD 1947
Today
• Earliest urban civilization in India• Centred around ‘Indus’ river valley• Gives India its name
• Independence of India• Division into India & Pakistan• Sovereign Democratic Republic
• Rise of intellectual Indian politics• Long struggle for freedom• Emergence of Gandhi and other leaders
• French, Portuguese & English colonies• English emerged as strongest power• Phase of modernization but oppression
• Turko-Persian invasion• Series of great Mughal monarchs• Mughal architecture, including Taj Mahal
• Arab / Turk / Afghan invasions• Introduction of Islam• Qutub Minar erected
• Advent of Jainism and Buddhism• Asoka’s message of peace• Golden age for Arts & Sciences
• Pastoral Aryans from north-west• Origin of the Sanskrit language• Principal Hindu texts & epics written
HistoryHistoryHistoryHistory
- 4 -- 4 -Copyright BCG
ReligionsReligions
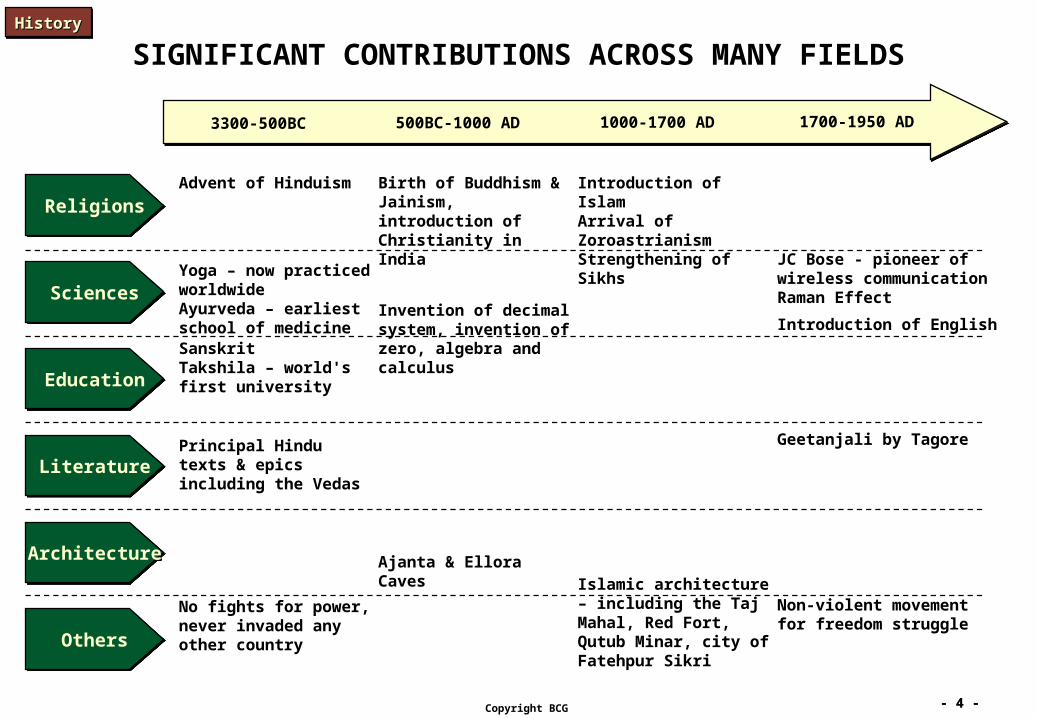
SIGNIFICANT CONTRIBUTIONS ACROSS MANY FIELDS
3300-500BC 500BC-1000 AD 1000-1700 AD 1700-1950 AD
Advent of Hinduism
Yoga – now practiced worldwideAyurveda – earliest school of medicineSanskritTakshila – world's first university
Principal Hindu texts & epics including the Vedas
No fights for power, never invaded any other country
Birth of Buddhism & Jainism, introduction of Christianity in India
Invention of decimal system, invention of zero, algebra and calculus
Ajanta & Ellora Caves
Introduction of IslamArrival of ZoroastrianismStrengthening of Sikhs
Islamic architecture – including the Taj Mahal, Red Fort, Qutub Minar, city of Fatehpur Sikri
SciencesSciences
EducationEducation
LiteratureLiterature
ArchitectureArchitecture
OthersOthers
JC Bose - pioneer of wireless communicationRaman Effect
Introduction of English
Geetanjali by Tagore
Non-violent movement for freedom struggle
HistoryHistoryHistoryHistory
- 5 -- 5 -Copyright BCG
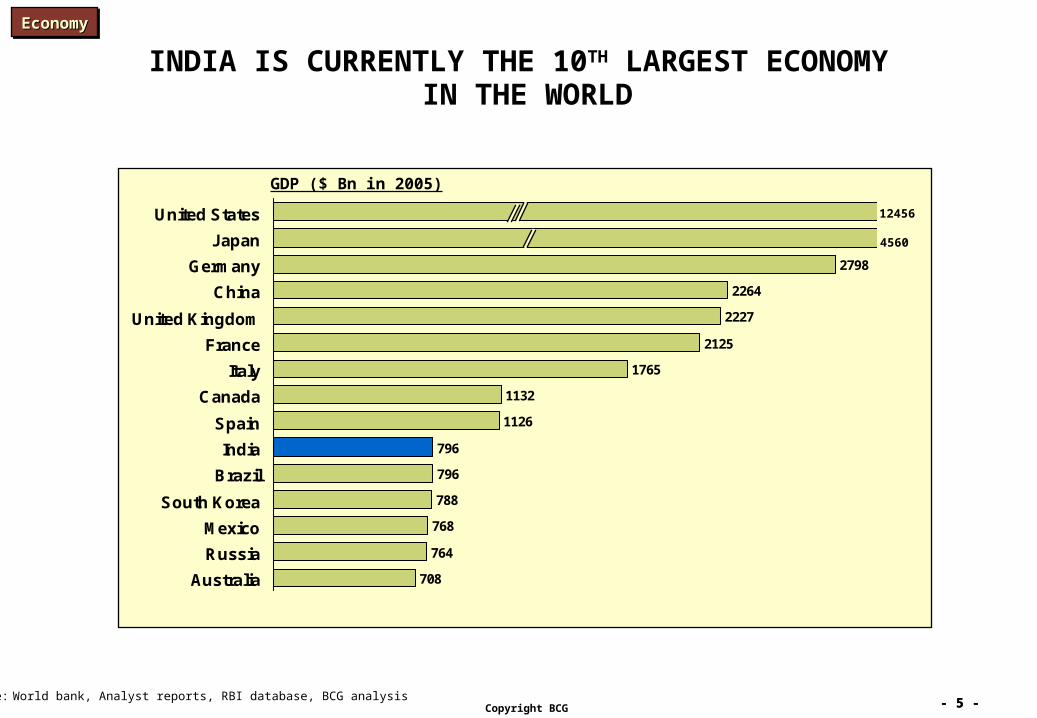
INDIA IS CURRENTLY THE 10TH LARGEST ECONOMY IN THE WORLD
708
764
768
788
796
796
1126
1132
1765
2125
2227
2264
2798
Australia
Russia
Mexico
South Korea
Brazil
India
Spain
Canada
Italy
France
United Kingdom
China
Germany
Japan
United States 12456
4560
Source: World bank, Analyst reports, RBI database, BCG analysis
GDP ($ Bn in 2005)
EconomyEconomyEconomyEconomy
- 6 -- 6 -Copyright BCG
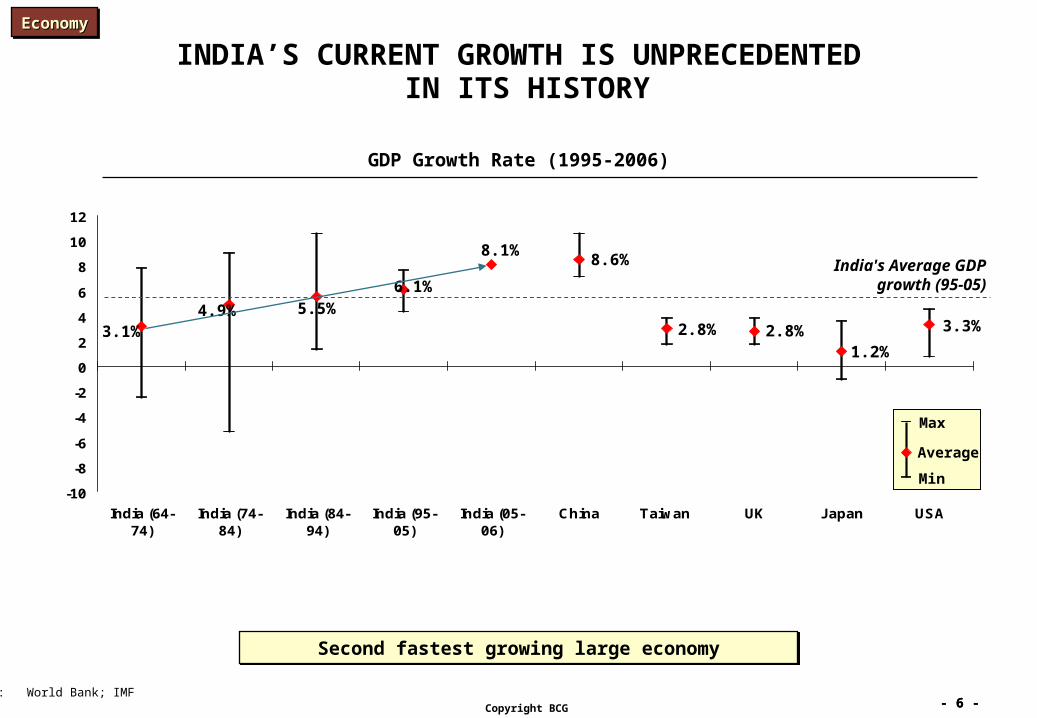
INDIA’S CURRENT GROWTH IS UNPRECEDENTED IN ITS HISTORY
-10
-8
-6
-4
-2
0
2
4
6
8
10
12
India (64-74)
India (74-84)
India (84-94)
India (95-05)
India (05-06)
China Taiwan UK Japan USA
GDP Growth Rate (1995-2006)
India's Average GDP growth (95-05)
Max
Average
Min
4.9% 5.5%6.1%
8.6%
2.8% 2.8%1.2%
3.3%
Source: World Bank; IMF
Second fastest growing large economySecond fastest growing large economy
3.1%
8.1%
EconomyEconomyEconomyEconomy
- 7 -- 7 -Copyright BCG
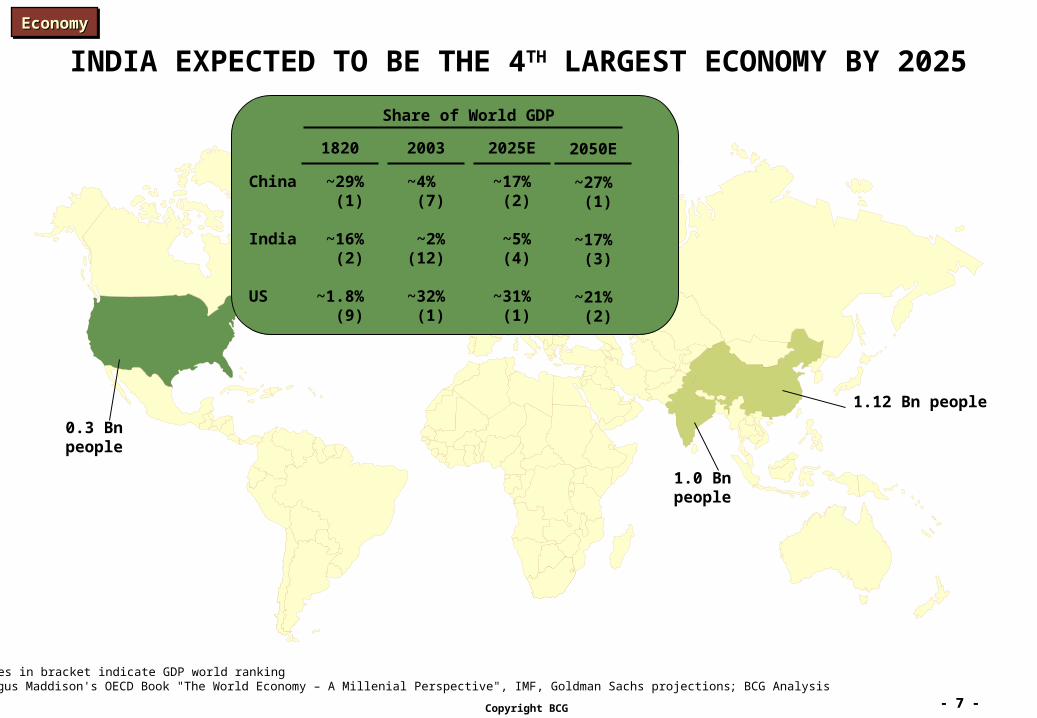
INDIA EXPECTED TO BE THE 4TH LARGEST ECONOMY BY 2025
Note: Figures in bracket indicate GDP world rankingSource: Angus Maddison's OECD Book "The World Economy – A Millenial Perspective", IMF, Goldman Sachs projections; BCG Analysis
1.12 Bn people
1.0 Bn people
China
India
US
~29%(1)
~16%(2)
~1.8%(9)
~4% (7)
~2% (12)
~32%(1)
~17%(2)
~5%(4)
~31%(1)
Share of World GDP
~27%(1)
~17%(3)
~21%(2)
1820 2003 2025E 2050E
0.3 Bn people
EconomyEconomyEconomyEconomy
- 8 -- 8 -Copyright BCG
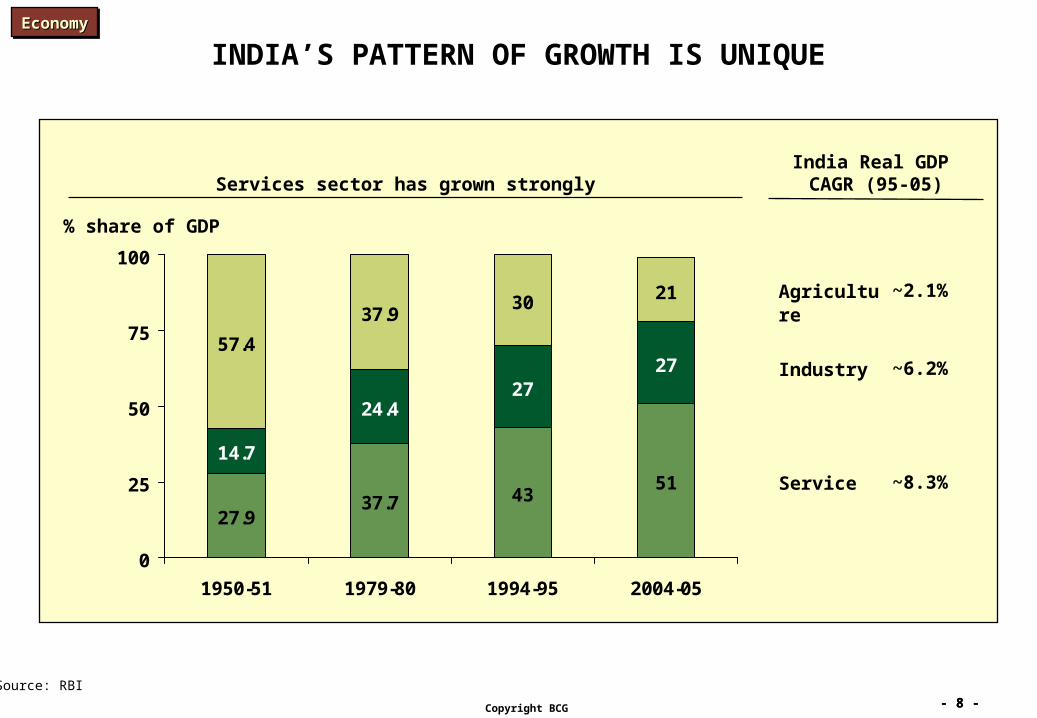
INDIA’S PATTERN OF GROWTH IS UNIQUE
India Real GDP CAGR (95-05)
~8.3%
~6.2%
~2.1%
Industry
Service
Agriculture
Services sector has grown strongly
Source: RBI
% share of GDP
27.937.7 43
51
14.7
24.427
2757.4
37.930 21
0
25
50
75
100
1950-51 1979-80 1994-95 2004-05
EconomyEconomyEconomyEconomy
- 9 -- 9 -Copyright BCG
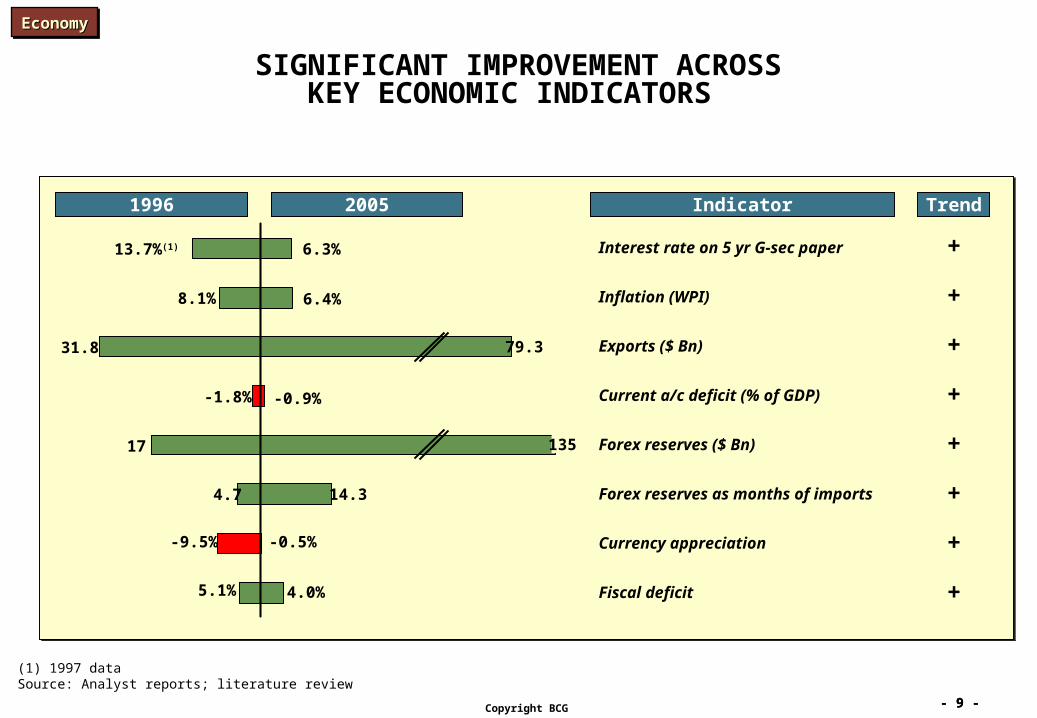
SIGNIFICANT IMPROVEMENT ACROSSKEY ECONOMIC INDICATORS
Interest rate on 5 yr G-sec paper
Inflation (WPI)
Exports ($ Bn)
Forex reserves ($ Bn)
Forex reserves as months of imports
Currency appreciation
Current a/c deficit (% of GDP)
Fiscal deficit
(1) 1997 dataSource: Analyst reports; literature review
Indicator
+
+
+
+
+
+
+
+
Trend
13.7%(1) 6.3%
8.1% 6.4%
31.8 79.3
17
4.7
-9.5%
14.3
-1.8% -0.9%
5.1% 4.0%
1996 2005
135
-0.5%
EconomyEconomyEconomyEconomy
- 10 -- 10 -Copyright BCG
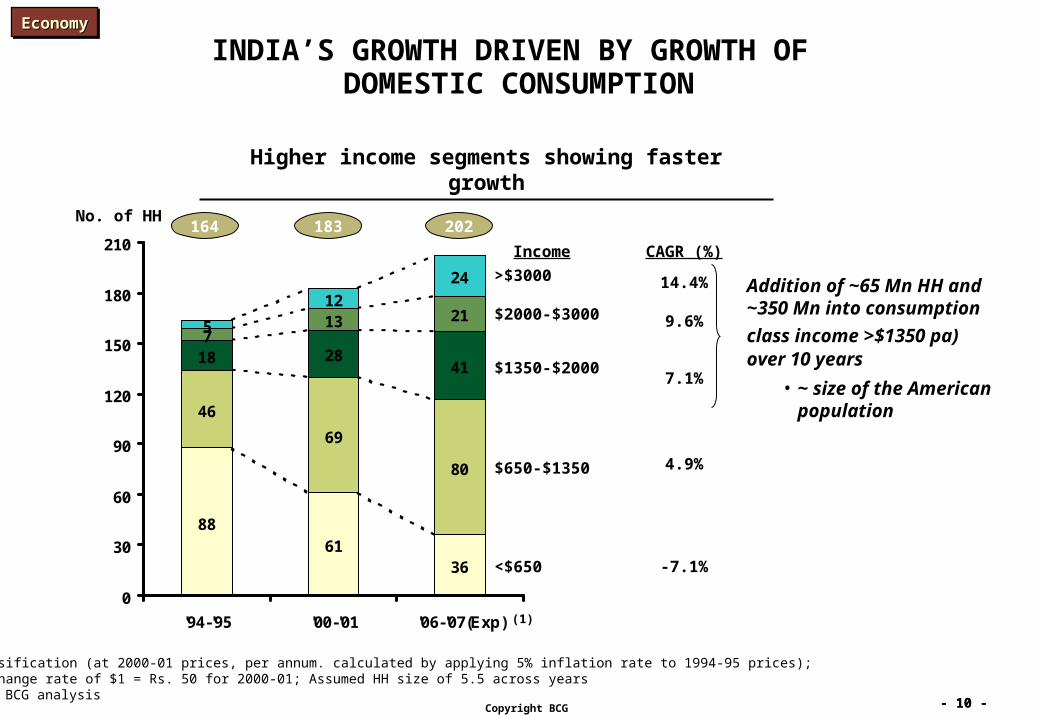
INDIA’S GROWTH DRIVEN BY GROWTH OF DOMESTIC CONSUMPTION
8861
36
46
69
80
18 2841
713 21
5
12
24
0
30
60
90
120
150
180
210
'94-'95 '00-'01 '06-'07(Exp)
Higher income segments showing faster growth
<$650
$650-$1350
$1350-$2000
$2000-$3000
>$3000
Expected figures Note: Income classification (at 2000-01 prices, per annum. calculated by applying 5% inflation rate to 1994-95 prices);
Assumed exchange rate of $1 = Rs. 50 for 2000-01; Assumed HH size of 5.5 across yearsSource: NCAER, SOI; BCG analysis
(1)
-7.1%
4.9%
7.1%
9.6%
14.4%
CAGR (%)
164 183 202No. of HH
Income
Addition of ~65 Mn HH and ~350 Mn into consumption
class income >$1350 pa) over 10 years
• ~ size of the American population
EconomyEconomyEconomyEconomy
- 11 -- 11 -Copyright BCG
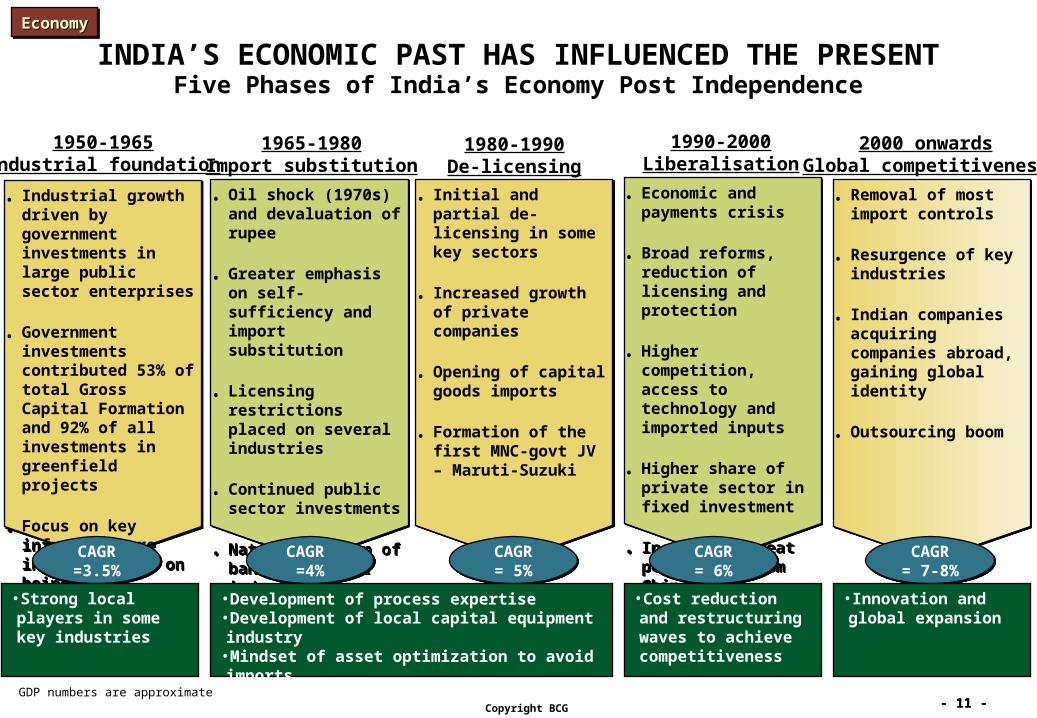
INDIA’S ECONOMIC PAST HAS INFLUENCED THE PRESENTFive Phases of India’s Economy Post Independence
• Initial and partial de-licensing in some key sectors
• Increased growth of private companies
• Opening of capital goods imports
• Formation of the first MNC-govt JV – Maruti-Suzuki
• Initial and partial de-licensing in some key sectors
• Increased growth of private companies
• Opening of capital goods imports
• Formation of the first MNC-govt JV – Maruti-Suzuki
1980-1990De-licensing
CAGR= 5%
CAGR= 5%
• Oil shock (1970s) and devaluation of rupee
• Greater emphasis on self-sufficiency and import substitution
• Licensing restrictions placed on several industries
• Continued public sector investments
• Nationalization of banks and other industries
• Oil shock (1970s) and devaluation of rupee
• Greater emphasis on self-sufficiency and import substitution
• Licensing restrictions placed on several industries
• Continued public sector investments
• Nationalization of banks and other industries
1965-1980Import substitution
CAGR =4%
CAGR =4%
• Industrial growth driven by government investments in large public sector enterprises
• Government investments contributed 53% of total Gross Capital Formation and 92% of all investments in greenfield projects
• Focus on key infrastructure industries and on being self-sufficient
• Industrial growth driven by government investments in large public sector enterprises
• Government investments contributed 53% of total Gross Capital Formation and 92% of all investments in greenfield projects
• Focus on key infrastructure industries and on being self-sufficient
1950-1965Industrial foundation
CAGR=3.5%CAGR=3.5%
•Strong local players in some key industries
•Development of process expertise•Development of local capital equipment industry•Mindset of asset optimization to avoid imports•Focus on flexibility rather than scale
• Economic and payments crisis
• Broad reforms, reduction of licensing and protection
• Higher competition, access to technology and imported inputs
• Higher share of private sector in fixed investment
• Increased threat perception from China
• Economic and payments crisis
• Broad reforms, reduction of licensing and protection
• Higher competition, access to technology and imported inputs
• Higher share of private sector in fixed investment
• Increased threat perception from China
1990-2000Liberalisation
CAGR= 6%
CAGR= 6%
•Cost reduction and restructuring waves to achieve competitiveness
• Removal of most import controls
• Resurgence of key industries
• Indian companies acquiring companies abroad, gaining global identity
• Outsourcing boom
• Removal of most import controls
• Resurgence of key industries
• Indian companies acquiring companies abroad, gaining global identity
• Outsourcing boom
2000 onwardsGlobal competitiveness
CAGR= 7-8%CAGR= 7-8%
•Innovation and global expansion
Note: GDP numbers are approximate
EconomyEconomyEconomyEconomy
- 12 -- 12 -Copyright BCG
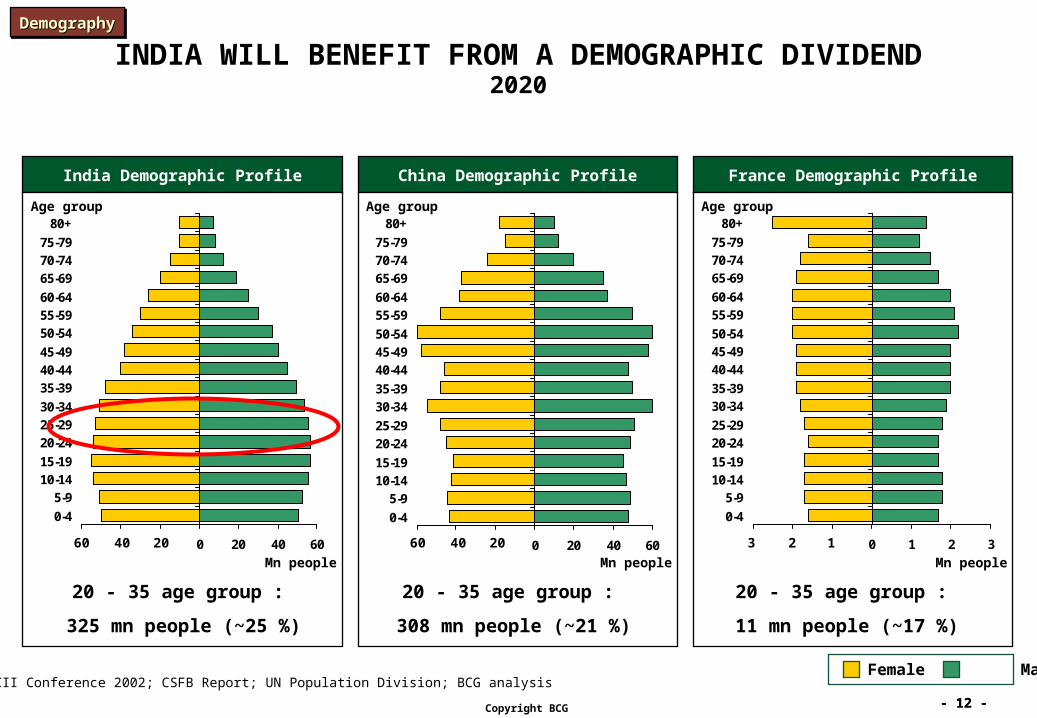
INDIA WILL BENEFIT FROM A DEMOGRAPHIC DIVIDEND2020
India Demographic Profile China Demographic Profile France Demographic Profile
-60 -40 -20 0 20 40 60
0-4
5-910-1415-19
20-2425-2930-34
35-3940-4445-49
50-5455-5960-64
65-6970-7475-79
80+
Mn people
Age group
Female Male
-60 -40 -20 0 20 40 60
0-4
5-910-1415-19
20-2425-29
30-3435-39
40-4445-4950-54
55-5960-64
65-6970-7475-79
80+
Mn people
Age group
-3 -2 -1 0 1 2 3
0-4
5-910-1415-19
20-2425-29
30-3435-39
40-4445-4950-54
55-5960-64
65-6970-7475-79
80+
Mn people
Age group
204060204060 123
Source: CII Conference 2002; CSFB Report; UN Population Division; BCG analysis
20 - 35 age group :
325 mn people (~25 %)
20 - 35 age group :
308 mn people (~21 %)
20 - 35 age group :
11 mn people (~17 %)
DemographyDemographyDemographyDemography
- 13 -- 13 -Copyright BCG
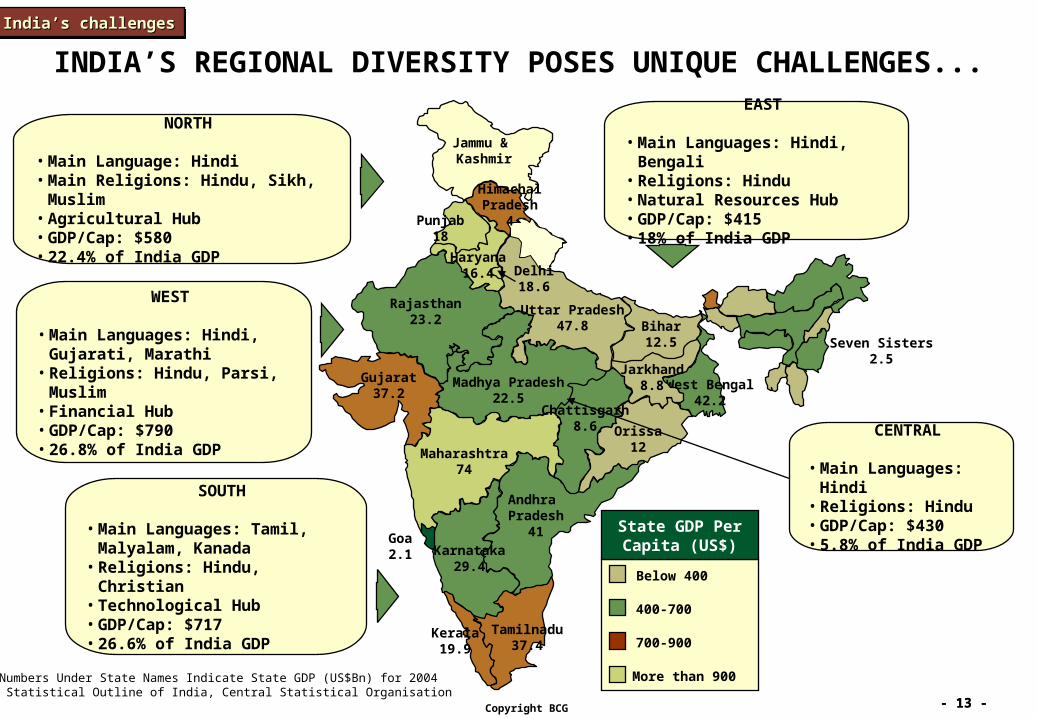
INDIA’S REGIONAL DIVERSITY POSES UNIQUE CHALLENGES...
Below 400
400-700
700-900
More than 900
State GDP Per Capita (US$)
NORTH
• Main Language: Hindi• Main Religions: Hindu, Sikh, Muslim• Agricultural Hub• GDP/Cap: $580• 22.4% of India GDP
EAST
• Main Languages: Hindi, Bengali• Religions: Hindu• Natural Resources Hub• GDP/Cap: $415• 18% of India GDP
WEST
• Main Languages: Hindi, Gujarati, Marathi
• Religions: Hindu, Parsi, Muslim• Financial Hub• GDP/Cap: $790• 26.8% of India GDP
SOUTH
• Main Languages: Tamil, Malyalam, Kanada
• Religions: Hindu, Christian• Technological Hub• GDP/Cap: $717• 26.6% of India GDP
Andhra Pradesh
41
Karnataka29.4
Gujarat37.2
Madhya Pradesh22.5
Chattisgarh8.6
Maharashtra74
Orissa12
Rajasthan23.2
West Bengal42.2
Delhi18.6
Seven Sisters2.5
Goa2.1
Punjab18
Haryana16.4
Note: Numbers Under State Names Indicate State GDP (US$Bn) for 2004Source: Statistical Outline of India, Central Statistical Organisation
Uttar Pradesh47.8
Kerala19.9
Tamilnadu37.4
Jarkhand8.8
Bihar12.5
CENTRAL
• Main Languages: Hindi• Religions: Hindu• GDP/Cap: $430• 5.8% of India GDP
HimachalPradesh
4
Jammu & Kashmir
India’s challengesIndia’s challengesIndia’s challengesIndia’s challenges
- 14 -- 14 -Copyright BCG
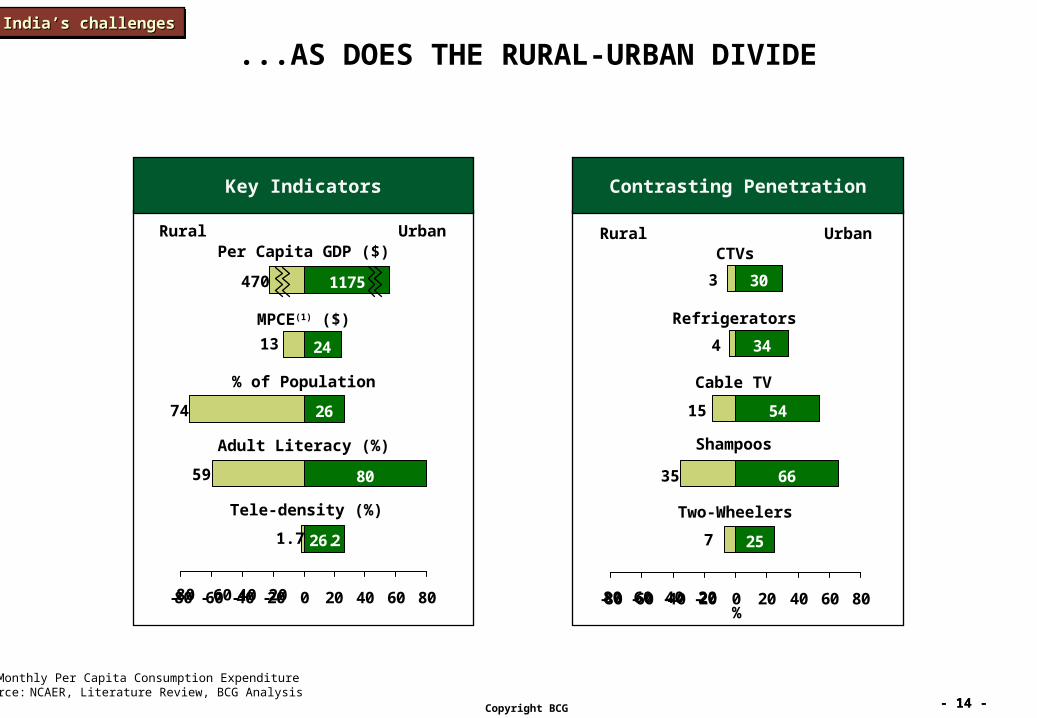
...AS DOES THE RURAL-URBAN DIVIDE
Key Indicators Contrasting Penetration
30
34
54
66
25
-80 -60 -40 -20 0 20 40 60 80%
80 60 40 20
Rural UrbanCTVs
Refrigerators
Shampoos
Cable TV
Two-Wheelers
24
26
80
26.2
1175
-80 -60 -40 -20 0 20 40 60 80 80 60 40 20
Rural UrbanPer Capita GDP ($)
MPCE(1) ($)
% of Population
Adult Literacy (%)
Tele-density (%)
1.7
59
74
13
470
7
35
15
4
3
(1) Monthly Per Capita Consumption ExpenditureSource: NCAER, Literature Review, BCG Analysis
BackupIndia’s challengesIndia’s challengesIndia’s challengesIndia’s challenges
- 15 -- 15 -Copyright BCG
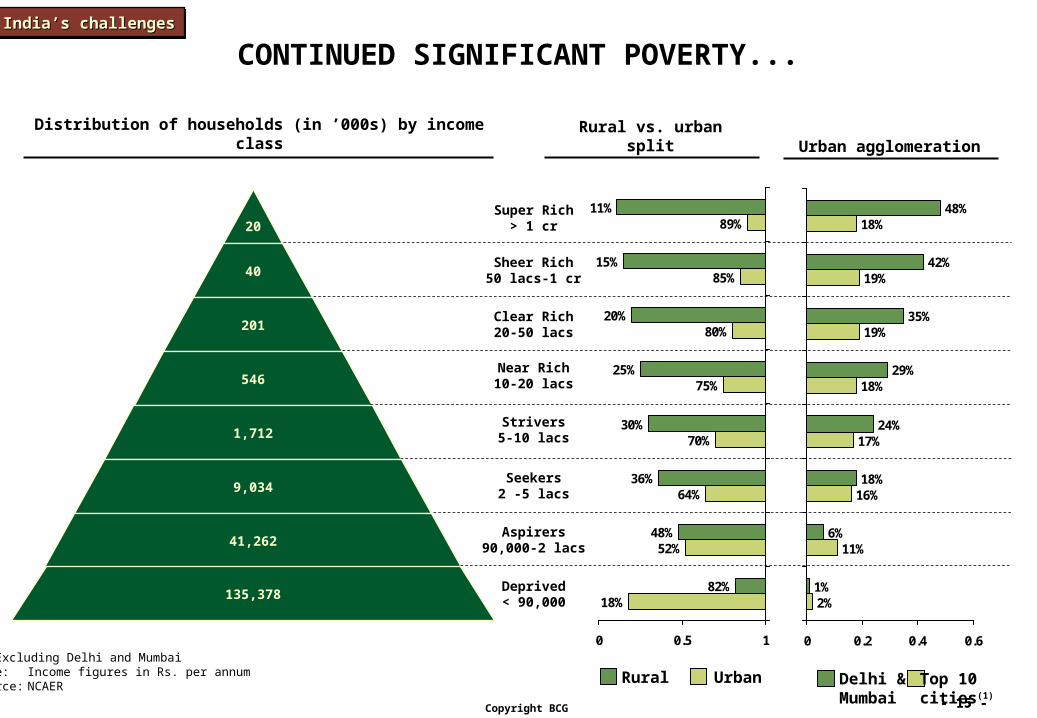
CONTINUED SIGNIFICANT POVERTY...
Distribution of households (in ’000s) by income class Rural vs. urban split
18%
52%
64%
70%
75%
80%
85%
89%
82%
48%
36%
30%
25%
20%
15%
11%
0 0.5 1
20
40
201
546
1,712
9,034
41,262
135,378Deprived< 90,000
Aspirers90,000-2 lacs
Seekers2 -5 lacs
Strivers5-10 lacs
Near Rich10-20 lacs
Clear Rich20-50 lacs
Sheer Rich50 lacs-1 cr
Super Rich> 1 cr
UrbanRural
2%
11%
16%
17%
18%
19%
19%
18%
1%
6%
18%
24%
29%
35%
42%
48%
0 0.2 0.4 0.6
Top 10cities(1)
Delhi &Mumbai
Urban agglomeration
(1) Excluding Delhi and MumbaiNote: Income figures in Rs. per annumSource: NCAER
India’s challengesIndia’s challengesIndia’s challengesIndia’s challenges
- 16 -- 16 -Copyright BCG
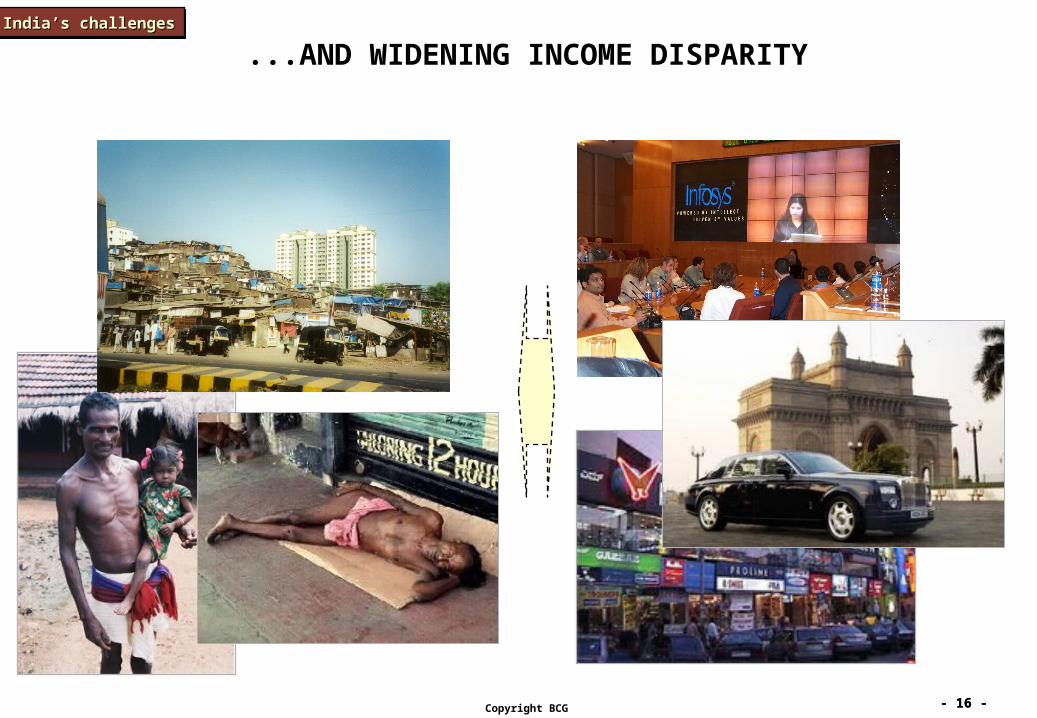
...AND WIDENING INCOME DISPARITYIndia’s challengesIndia’s challengesIndia’s challengesIndia’s challenges
- 17 -- 17 -Copyright BCG
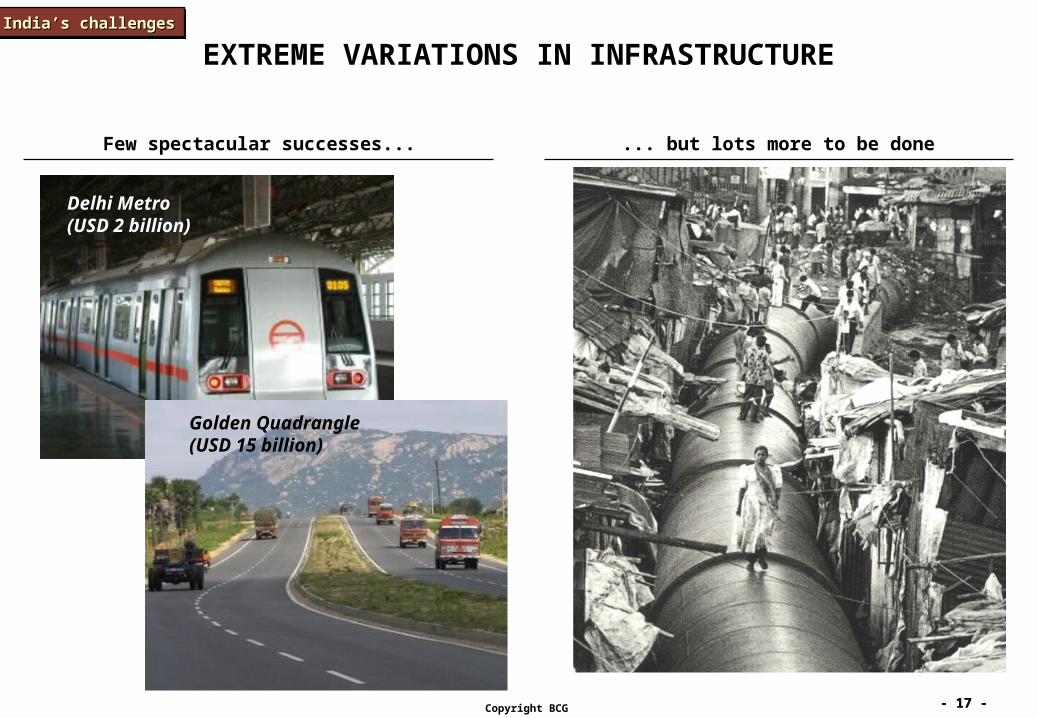
EXTREME VARIATIONS IN INFRASTRUCTURE
Few spectacular successes... ... but lots more to be done
Delhi Metro(USD 2 billion)
Golden Quadrangle(USD 15 billion)
India’s challengesIndia’s challengesIndia’s challengesIndia’s challenges
- 18 -- 18 -Copyright BCG
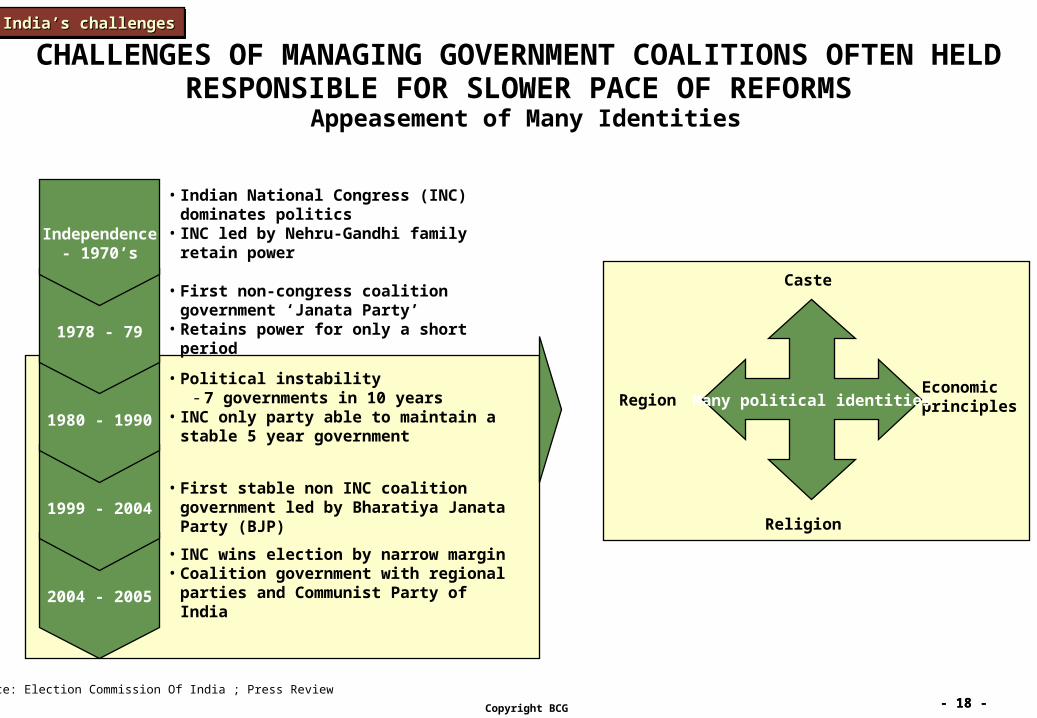
CHALLENGES OF MANAGING GOVERNMENT COALITIONS OFTEN HELD RESPONSIBLE FOR SLOWER PACE OF REFORMS
Appeasement of Many Identities
2004 - 2005
1999 - 2004
1980 - 1990
1978 - 79
Independence- 1970’s
• Indian National Congress (INC) dominates politics
• INC led by Nehru-Gandhi family retain power
• First non-congress coalition government ‘Janata Party’
• Retains power for only a short period
• Political instability- 7 governments in 10 years
• INC only party able to maintain a stable 5 year government
• First stable non INC coalition government led by Bharatiya Janata Party (BJP)
• INC wins election by narrow margin• Coalition government with regional parties
and Communist Party of India
Source: Election Commission Of India ; Press Review
Caste
Region
Religion
EconomicprinciplesMany political identities
India’s challengesIndia’s challengesIndia’s challengesIndia’s challenges
- 19 -- 19 -Copyright BCG
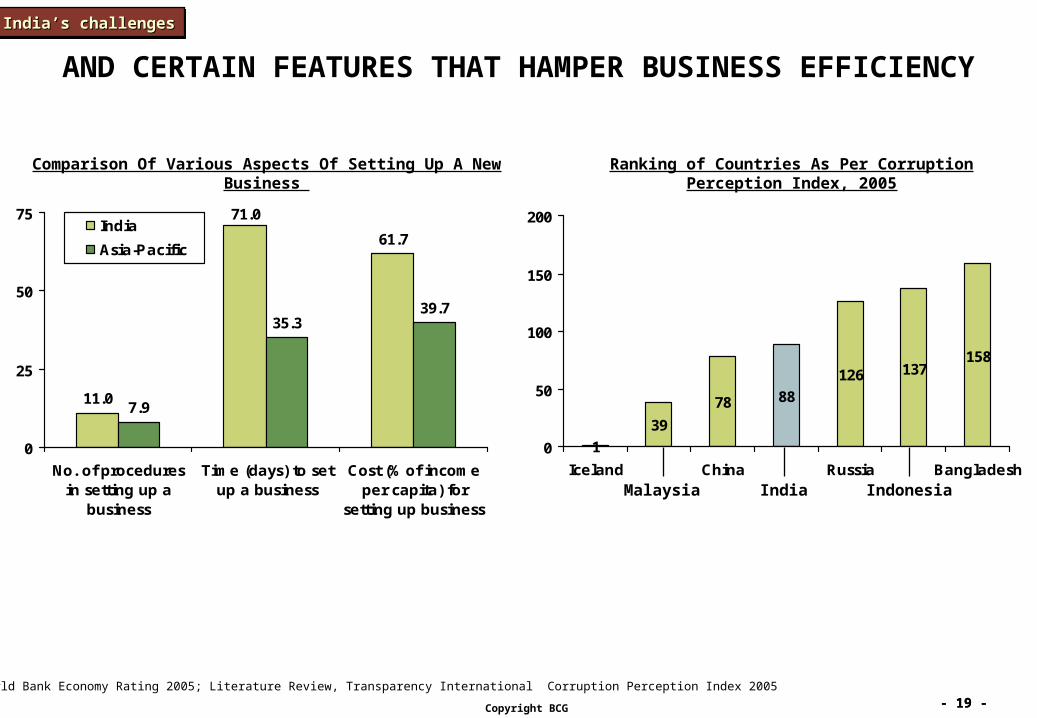
AND CERTAIN FEATURES THAT HAMPER BUSINESS EFFICIENCY
Comparison Of Various Aspects Of Setting Up A New Business
11.0
71.0
61.7
7.9
35.339.7
0
25
50
75
No. of proceduresin setting up a
business
Time (days) to setup a business
Cost (% of incomeper capita) for
setting up business
India
Asia-Pacific
Source: World Bank Economy Rating 2005; Literature Review, Transparency International Corruption Perception Index 2005
1
39
78
126 137158
88
0
50
100
150
200
Iceland China Russia Bangladesh
Ranking of Countries As Per Corruption Perception Index, 2005
Malaysia India Indonesia
India’s challengesIndia’s challengesIndia’s challengesIndia’s challenges
- 20 -- 20 -Copyright BCG
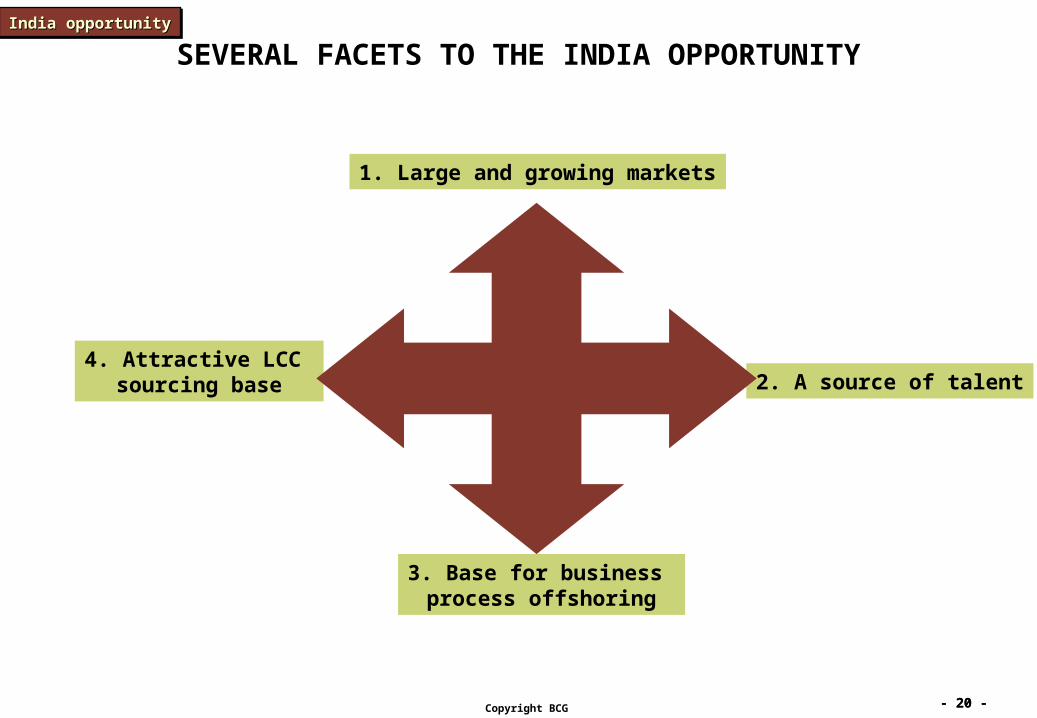
SEVERAL FACETS TO THE INDIA OPPORTUNITY
1. Large and growing markets
2. A source of talent
3. Base for business process offshoring
4. Attractive LCC sourcing base
India opportunityIndia opportunityIndia opportunityIndia opportunity
- 21 -- 21 -Copyright BCG
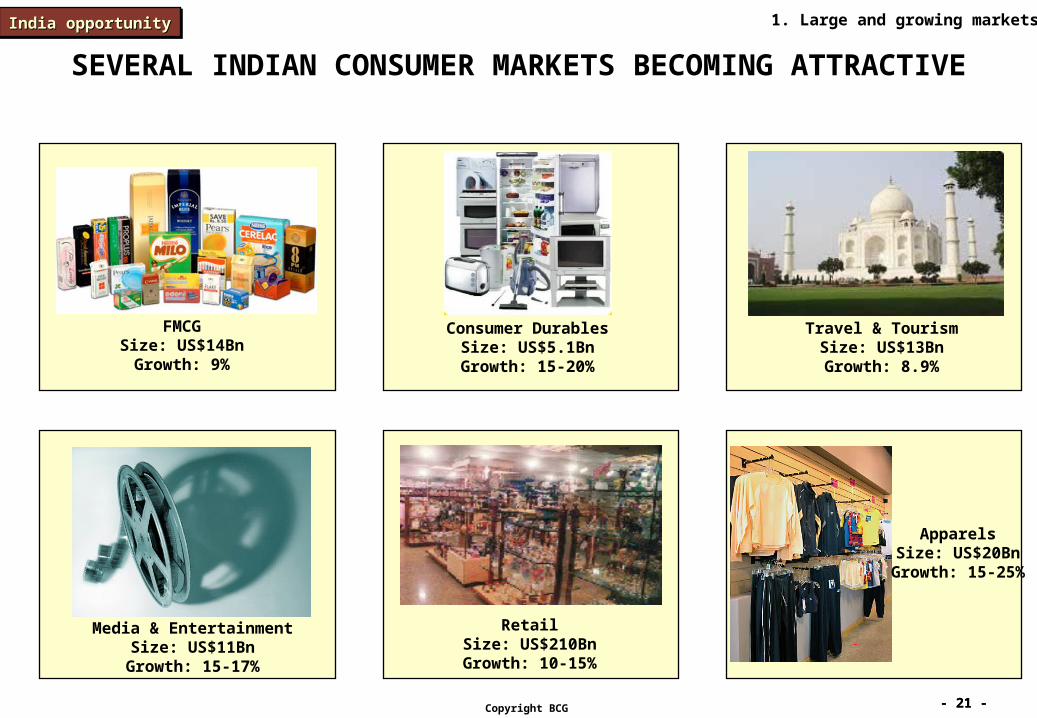
SEVERAL INDIAN CONSUMER MARKETS BECOMING ATTRACTIVE
FMCGSize: US$14Bn
Growth: 9%
Media & EntertainmentSize: US$11BnGrowth: 15-17%
Consumer DurablesSize: US$5.1BnGrowth: 15-20%
RetailSize: US$210BnGrowth: 10-15%
ApparelsSize: US$20BnGrowth: 15-25%
Travel & TourismSize: US$13BnGrowth: 8.9%
1. Large and growing marketsIndia opportunityIndia opportunityIndia opportunityIndia opportunity
- 22 -- 22 -Copyright BCG
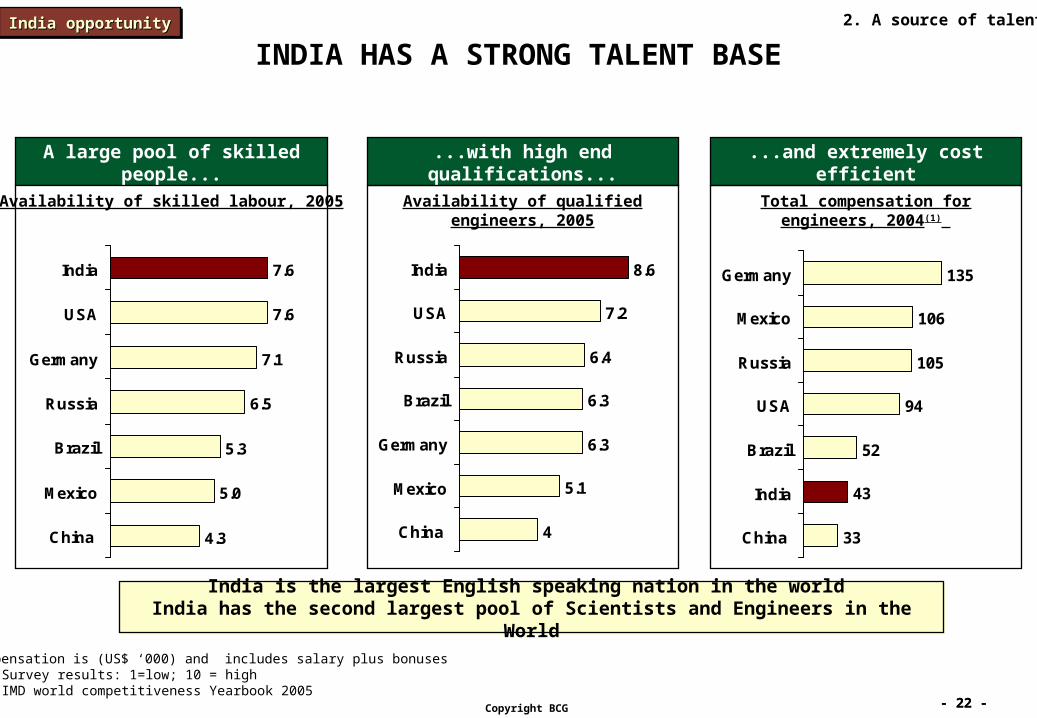
INDIA HAS A STRONG TALENT BASE
(1) Compensation is (US$ ‘000) and includes salary plus bonusesNote: Survey results: 1=low; 10 = highSource: IMD world competitiveness Yearbook 2005
...with high end qualifications...
4
5.1
6.3
6.3
6.4
7.2
8.6
China
Mexico
Germany
Brazil
Russia
USA
India
...and extremely cost efficient
33
43
52
94
105
106
135
China
India
Brazil
USA
Russia
Mexico
Germany
Availability of qualified engineers, 2005
India is the largest English speaking nation in the world India has the second largest pool of Scientists and Engineers in the World
India is the largest English speaking nation in the world India has the second largest pool of Scientists and Engineers in the World
A large pool of skilled people...
4.3
5.0
5.3
6.5
7.1
7.6
7.6
China
Mexico
Brazil
Russia
Germany
USA
India
Availability of skilled labour, 2005 Total compensation for engineers, 2004(1)
2. A source of talentIndia opportunityIndia opportunityIndia opportunityIndia opportunity
- 23 -- 23 -Copyright BCG
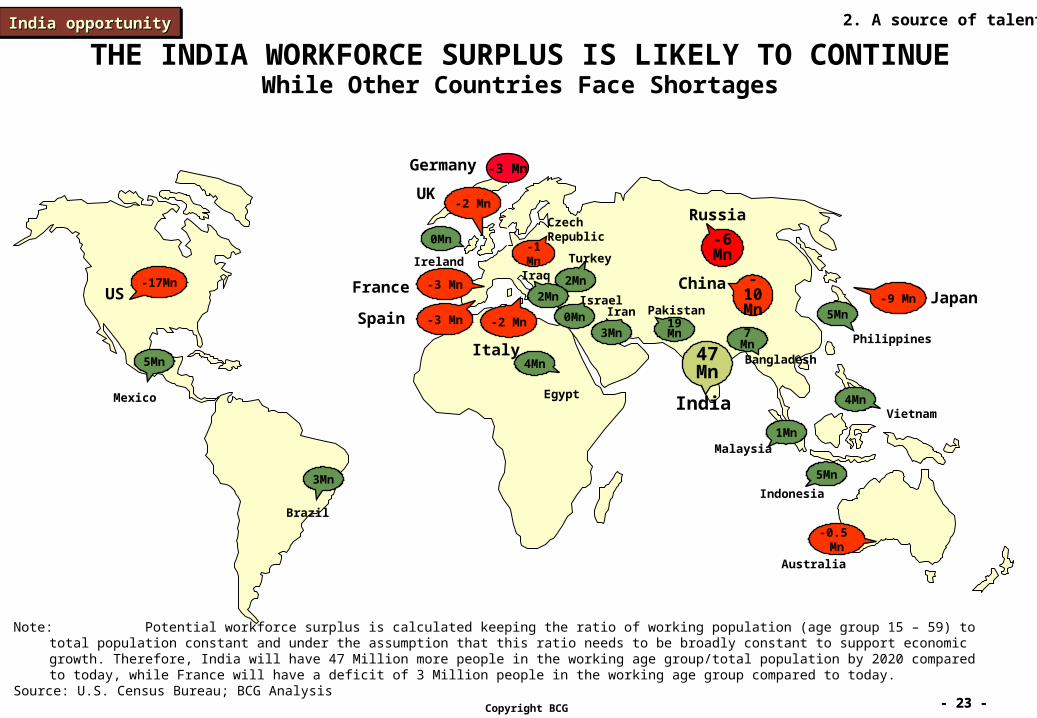
47Mn
19Mn 7
Mn
3Mn
5Mn
3Mn
India
Bangladesh
PakistanIran
Brazil
Mexico
Philippines
5Mn
4MnVietnam
2Mn
Turkey
Potential surplus population in working age group (2020)
-10Mn
China
-6Mn
Russia
5Mn
Indonesia
1MnMalaysia
0Mn
Ireland
Israel0Mn
THE INDIA WORKFORCE SURPLUS IS LIKELY TO CONTINUEWhile Other Countries Face Shortages
Iraq
2Mn
-1Mn
CzechRepublic
Note: Potential workforce surplus is calculated keeping the ratio of working population (age group 15 – 59) to total population constant and under the assumption that this ratio needs to be broadly constant to support economic growth. Therefore, India will have 47 Million more people in the working age group/total population by 2020 compared to today, while France will have a deficit of 3 Million people in the working age group compared to today.
Source: U.S. Census Bureau; BCG Analysis
4Mn
Egypt
-17MnUS
-2 MnUK
-2 Mn
Italy
-3 MnFrance-9 Mn Japan
-0.5 Mn
Australia
-3 MnSpain
-3 MnGermany
2. A source of talentIndia opportunityIndia opportunityIndia opportunityIndia opportunity
- 24 -- 24 -Copyright BCG
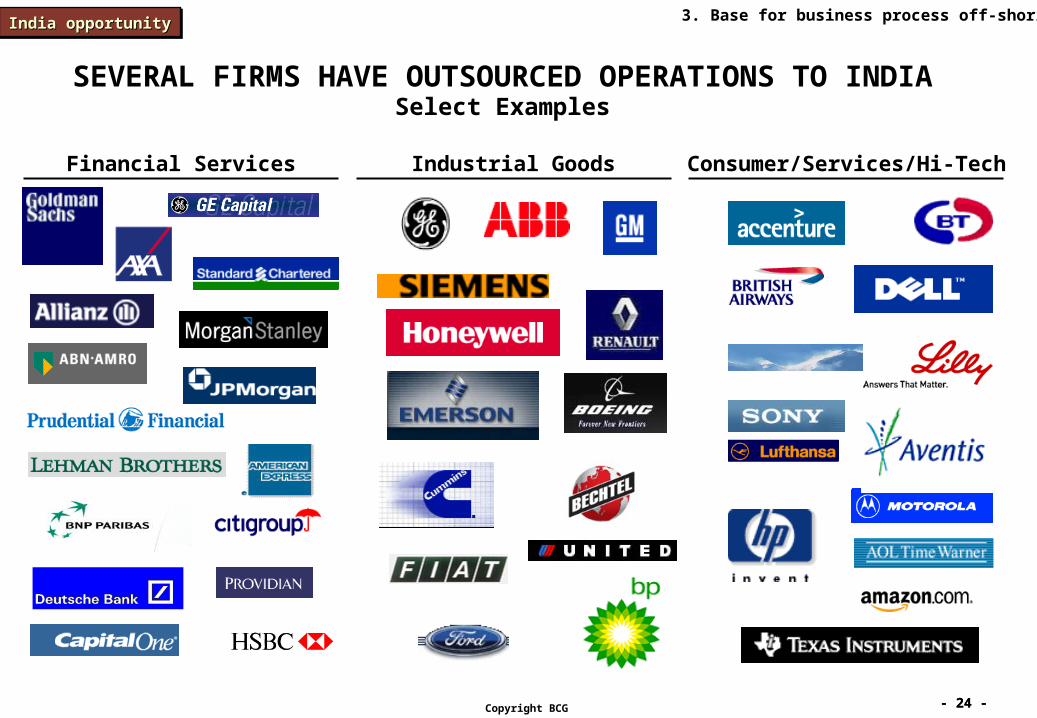
SEVERAL FIRMS HAVE OUTSOURCED OPERATIONS TO INDIASelect Examples
Industrial Goods Consumer/Services/Hi-TechFinancial Services
3. Base for business process off-shoringIndia opportunityIndia opportunityIndia opportunityIndia opportunity
- 25 -- 25 -Copyright BCG
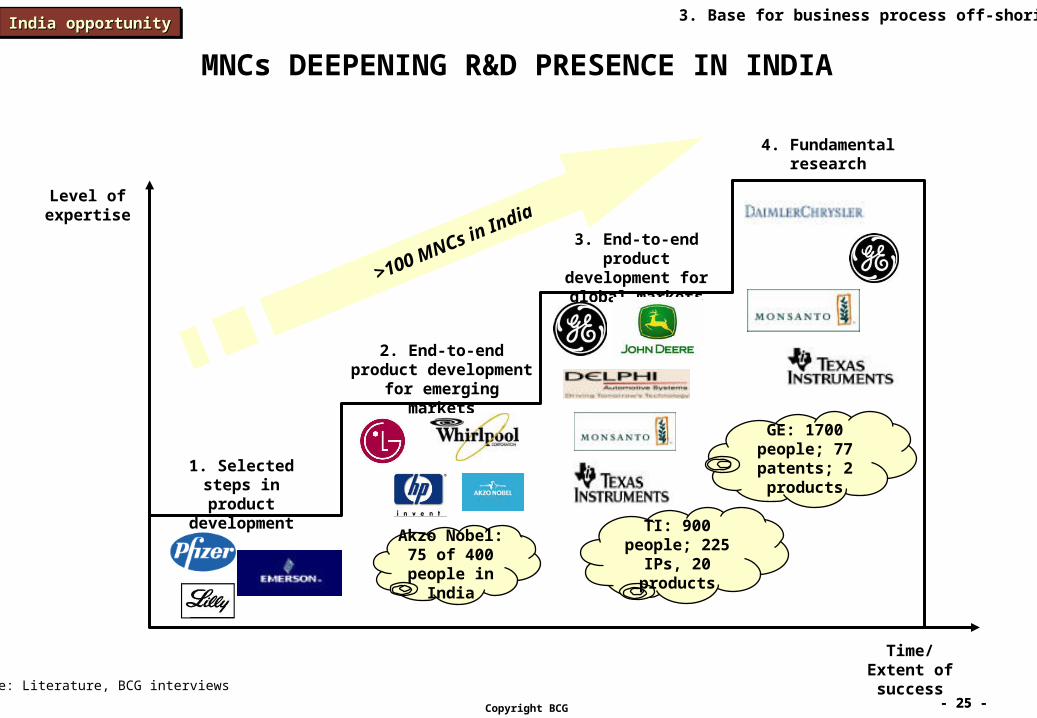
MNCs DEEPENING R&D PRESENCE IN INDIA
>100 MNCs in IndiaLevel of
expertise
1. Selected steps in product
development
2. End-to-end product development for
emerging markets
3. End-to-end product development for global markets
4. Fundamental research
TI: 900 people; 225 IPs, 20 products
GE: 1700 people; 77 patents; 2
products
Time/Extent of success
Akzo Nobel: 75 of 400 people in
India
Source: Literature, BCG interviews
3. Base for business process off-shoringIndia opportunityIndia opportunityIndia opportunityIndia opportunity
- 26 -- 26 -Copyright BCG
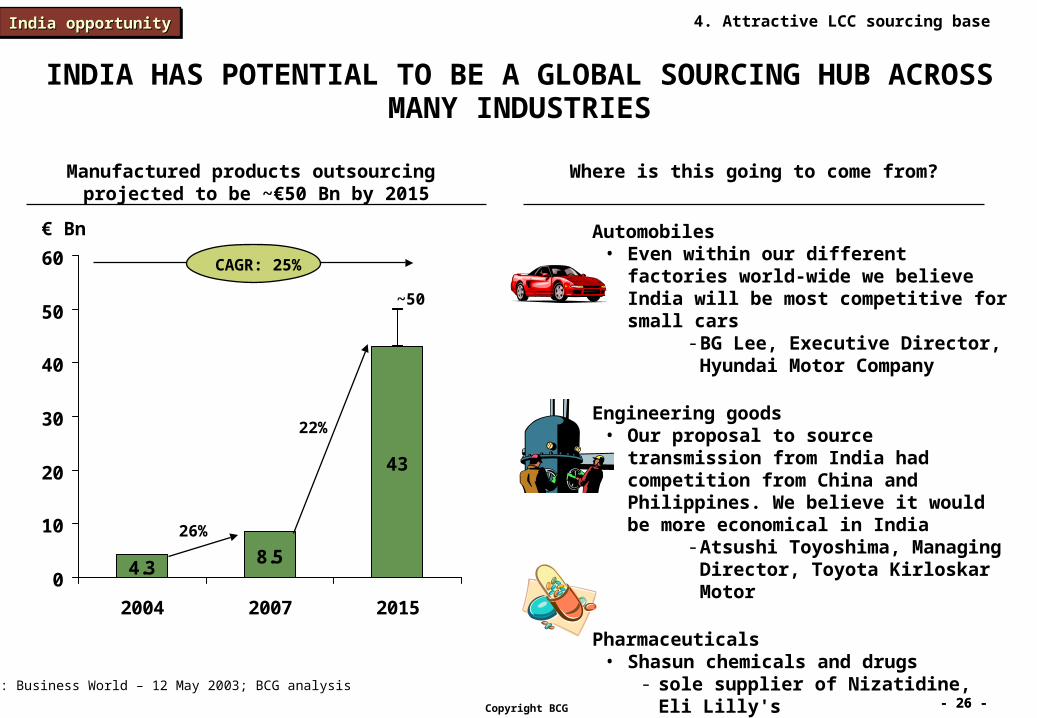
INDIA HAS POTENTIAL TO BE A GLOBAL SOURCING HUB ACROSS MANY INDUSTRIES
Source: Business World – 12 May 2003; BCG analysis
Automobiles• Even within our different factories world-
wide we believe India will be most competitive for small cars
- BG Lee, Executive Director, Hyundai Motor Company
Engineering goods• Our proposal to source transmission from
India had competition from China and Philippines. We believe it would be more economical in India
- Atsushi Toyoshima, Managing Director, Toyota Kirloskar Motor
Pharmaceuticals• Shasun chemicals and drugs
- sole supplier of Nizatidine, Eli Lilly's ~€190 Mn anti ulcer drug
- 60% of Knoll Pharma's global requirement of Ibuprofen
€ Bn
4.38.5
43
0
10
20
30
40
50
60
2004 2007 2015
26%
22%
~50
CAGR: 25%
Manufactured products outsourcing projected to be ~€50 Bn by 2015
Where is this going to come from?
4. Attractive LCC sourcing baseIndia opportunityIndia opportunityIndia opportunityIndia opportunity
- 27 -- 27 -Copyright BCG
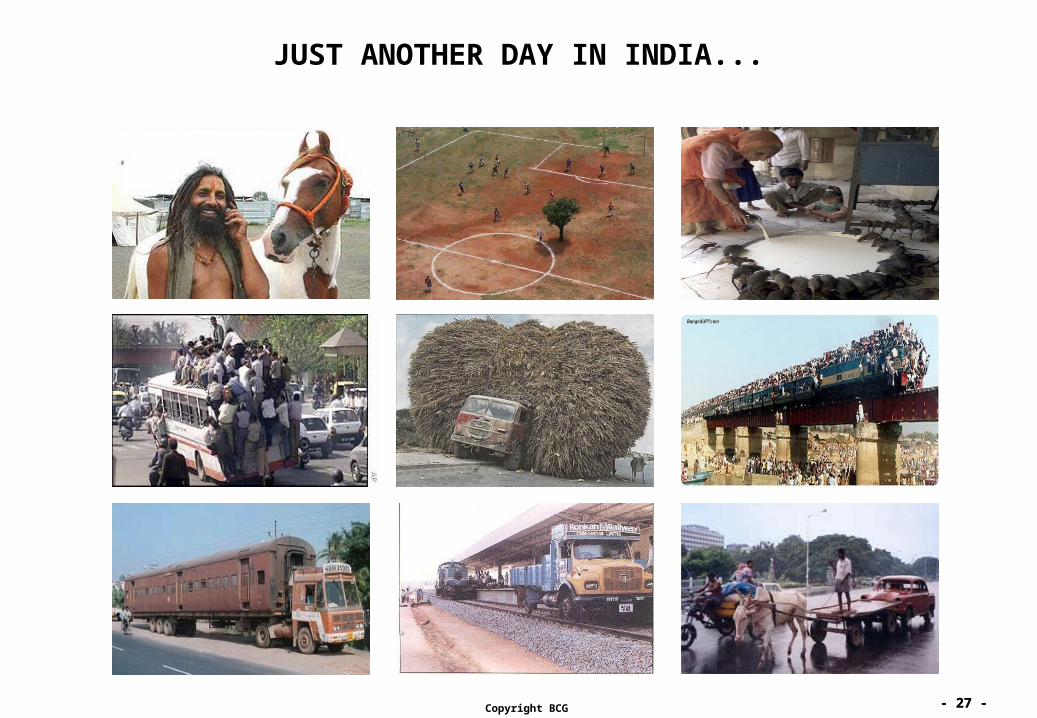
JUST ANOTHER DAY IN INDIA...