Linear Discriminant Analysis(LDA)syllabus.cs.manchester.ac.uk/pgt/COMP61021/lectures/LDA.pdf• Case...
22
Linear Discriminant Analysis (LDA) COMP61021 Modelling and Visualization of High Dimensional Data Additional reading can be found from non-assessed exercises (week 9) in this course unit teaching page. Textbooks: Sect. 6.6 in [1] and Sect. 4.1 in [2] This lecture note is adapted from Prof. Gutierrez-Osuna’s “Fisher Discriminant Analysis” lecture note with permission.
Transcript of Linear Discriminant Analysis(LDA)syllabus.cs.manchester.ac.uk/pgt/COMP61021/lectures/LDA.pdf• Case...
Linear Discriminant Analysis (LDA)
COMP61021 Modelling and Visualization of High Dimensional Data
Additional reading can be found from non-assessed exercises (week 9) in this course unit teaching page.
Textbooks: Sect. 6.6 in [1] and Sect. 4.1 in [2]
This lecture note is adapted from Prof. Gutierrez-Osuna’s“Fisher Discriminant Analysis” lecture note with permission.
COMP61021 Modelling and Visualization of High Dimensional Data2
Outline• Introduction • LDA for Two Classes• LDA for Multiple Classes • Example• Case Study: PCA vs. LDA • Relevant Issues• Conclusions
COMP61021 Modelling and Visualization of High Dimensional Data3
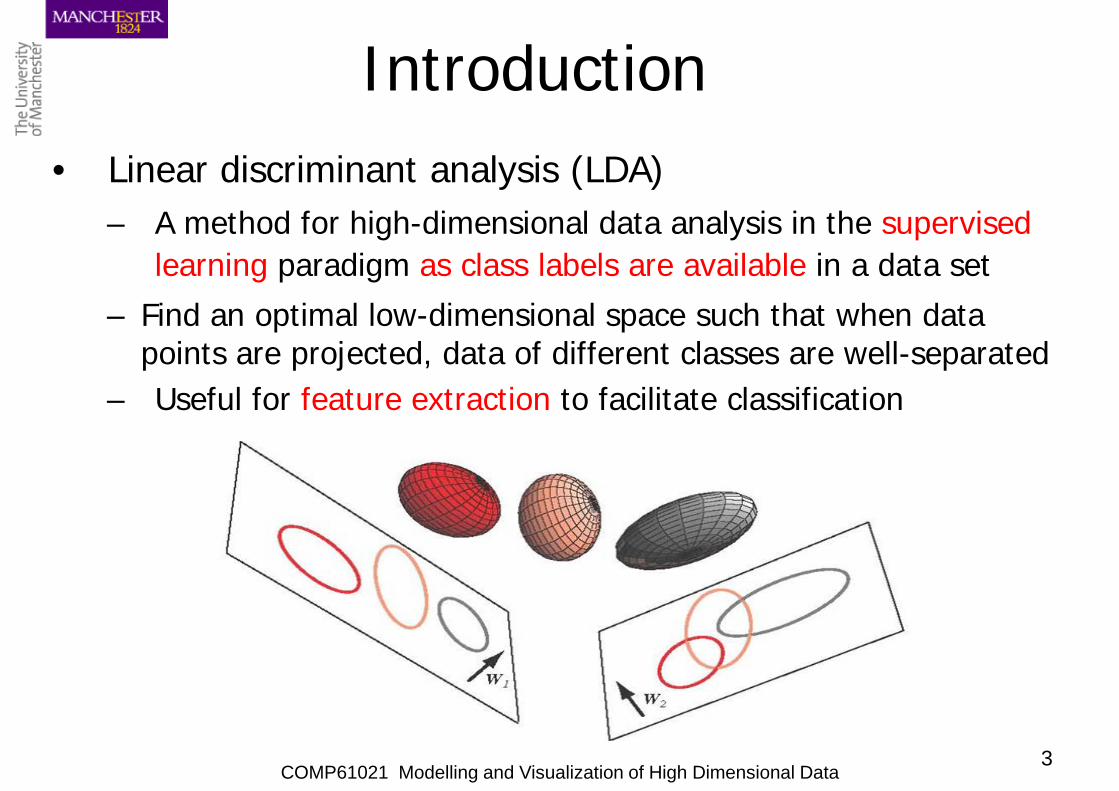
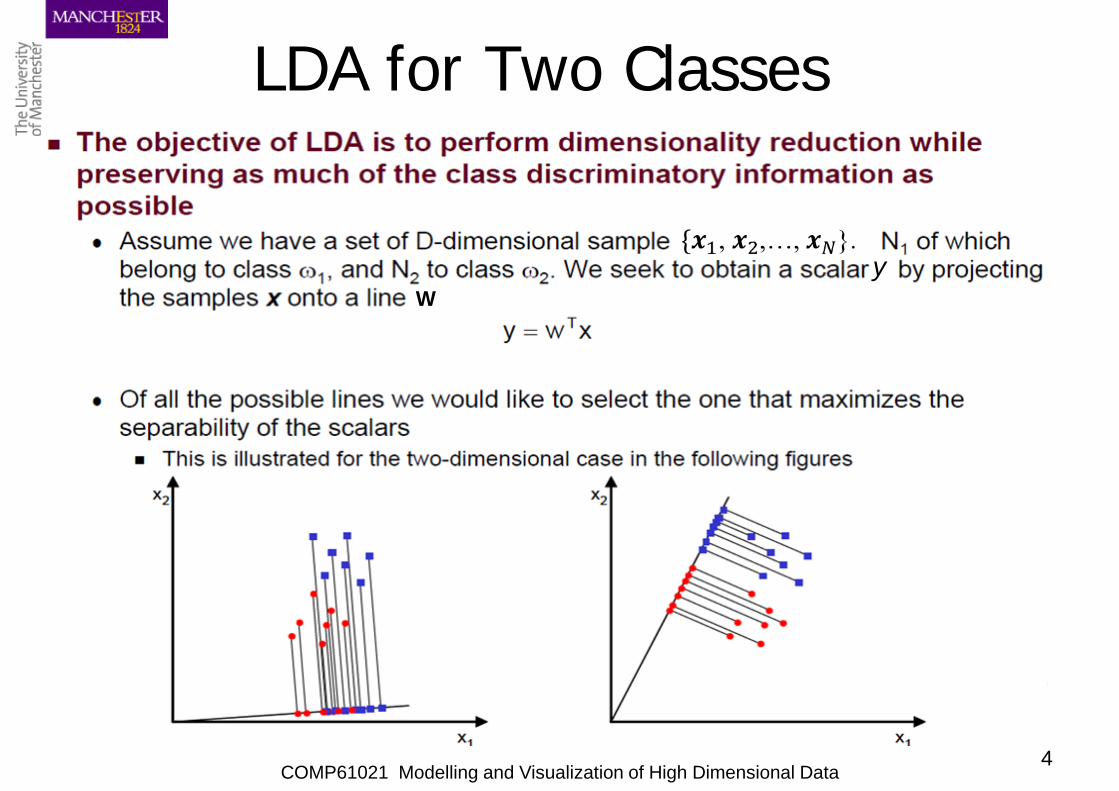
Introduction• Linear discriminant analysis (LDA)
– A method for high-dimensional data analysis in the supervised learning paradigm as class labels are available in a data set
– Find an optimal low-dimensional space such that when data points are projected, data of different classes are well-separated
– Useful for feature extraction to facilitate classification
COMP61021 Modelling and Visualization of High Dimensional Data4
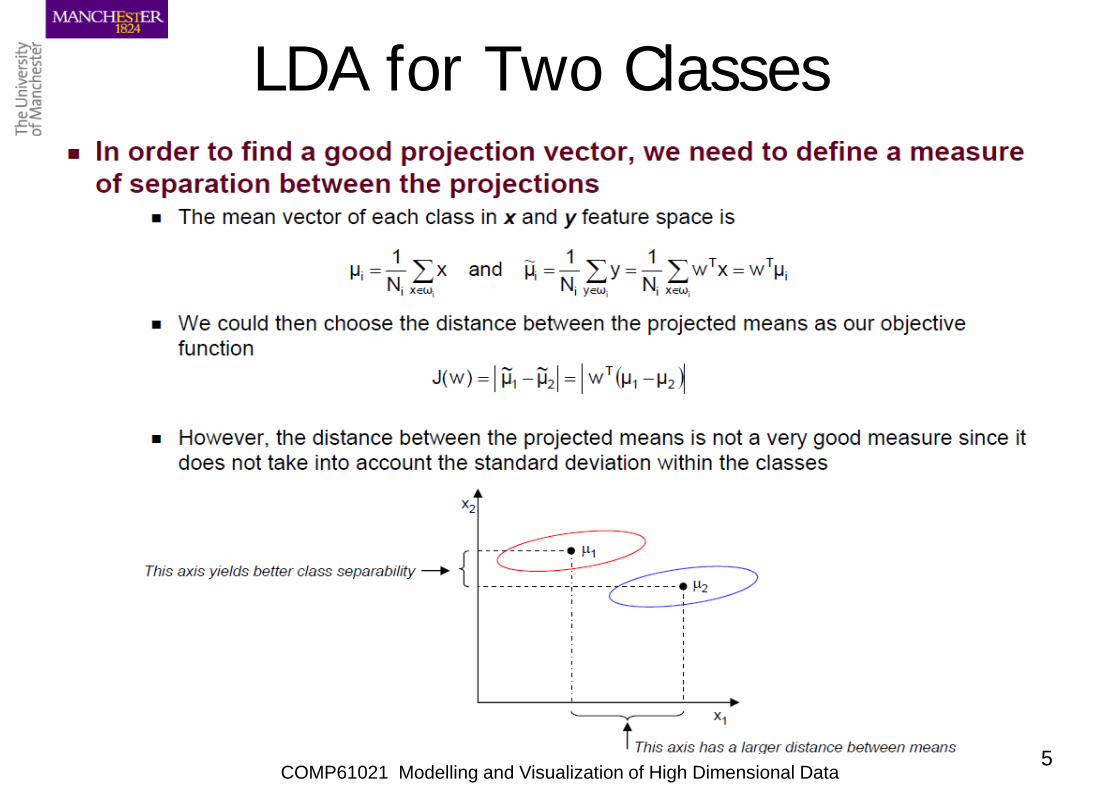
LDA for Two Classes
yW
COMP61021 Modelling and Visualization of High Dimensional Data5
LDA for Two Classes
COMP61021 Modelling and Visualization of High Dimensional Data6
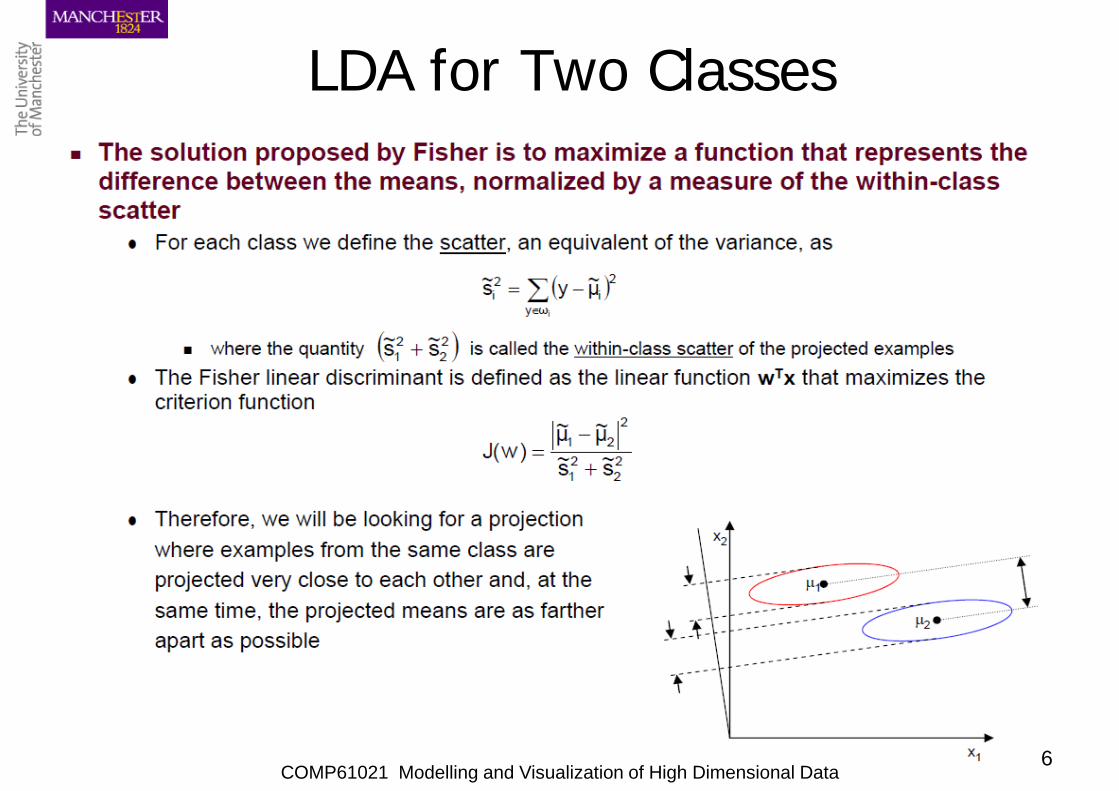
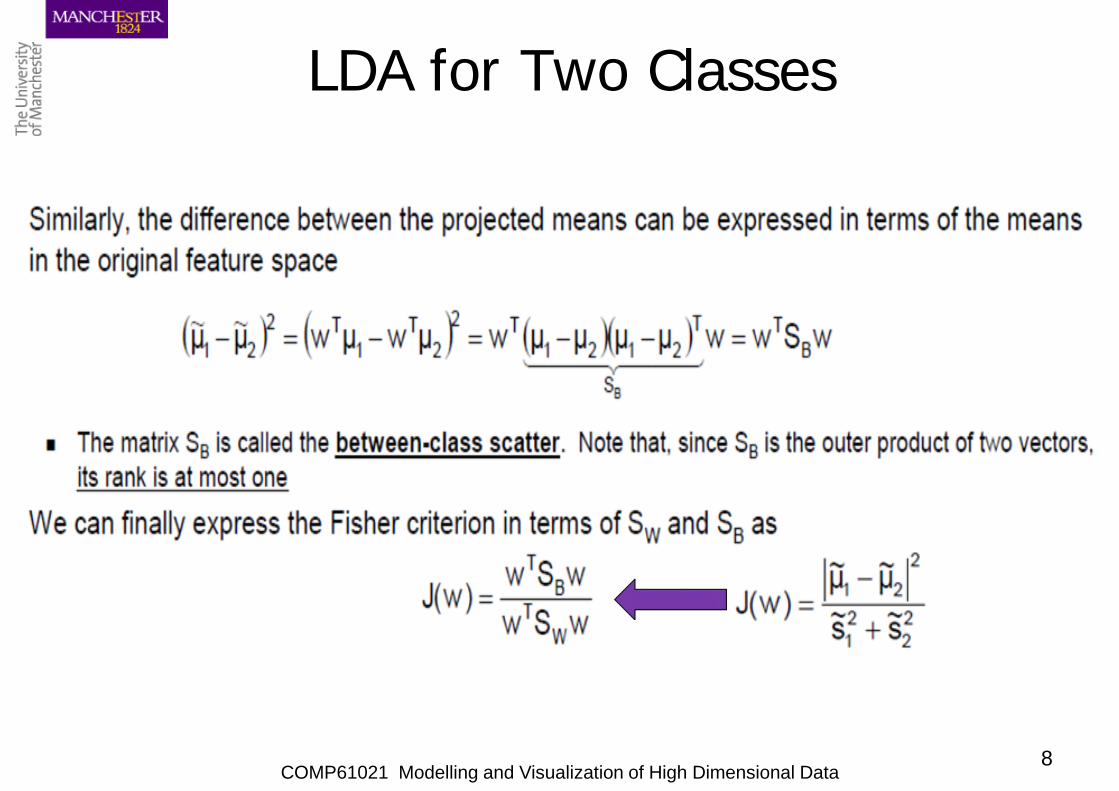
LDA for Two Classes
COMP61021 Modelling and Visualization of High Dimensional Data7
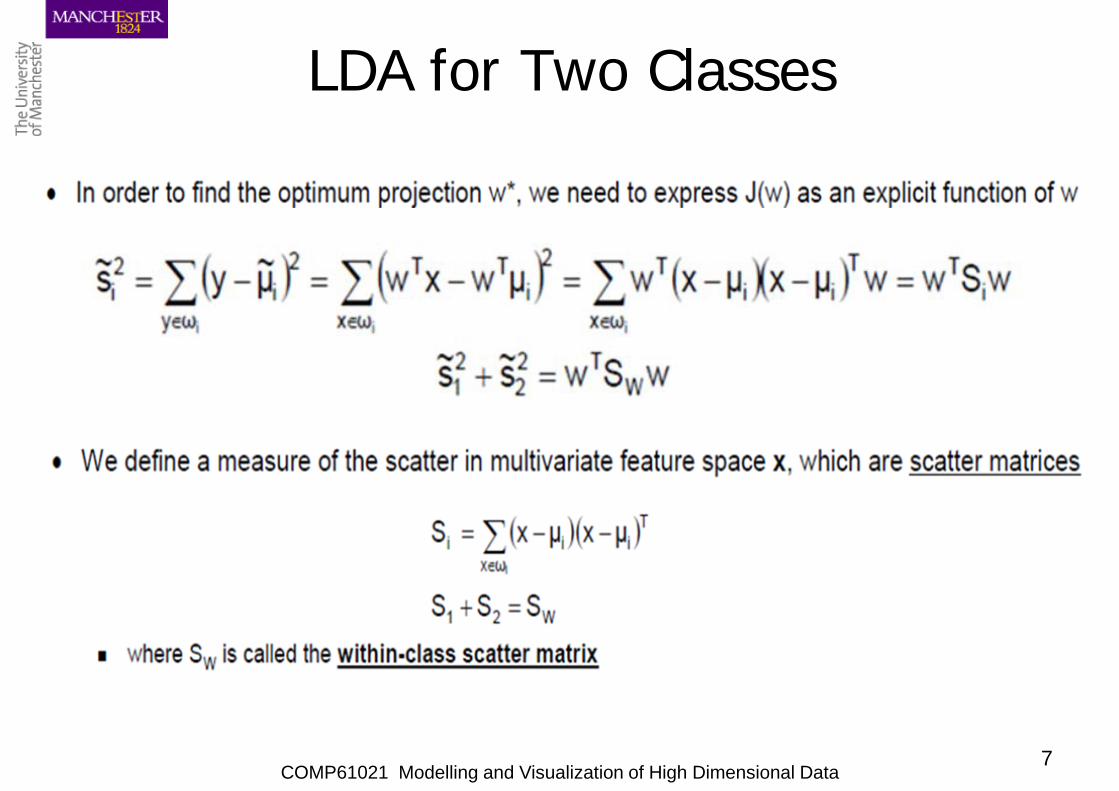
LDA for Two Classes
COMP61021 Modelling and Visualization of High Dimensional Data8
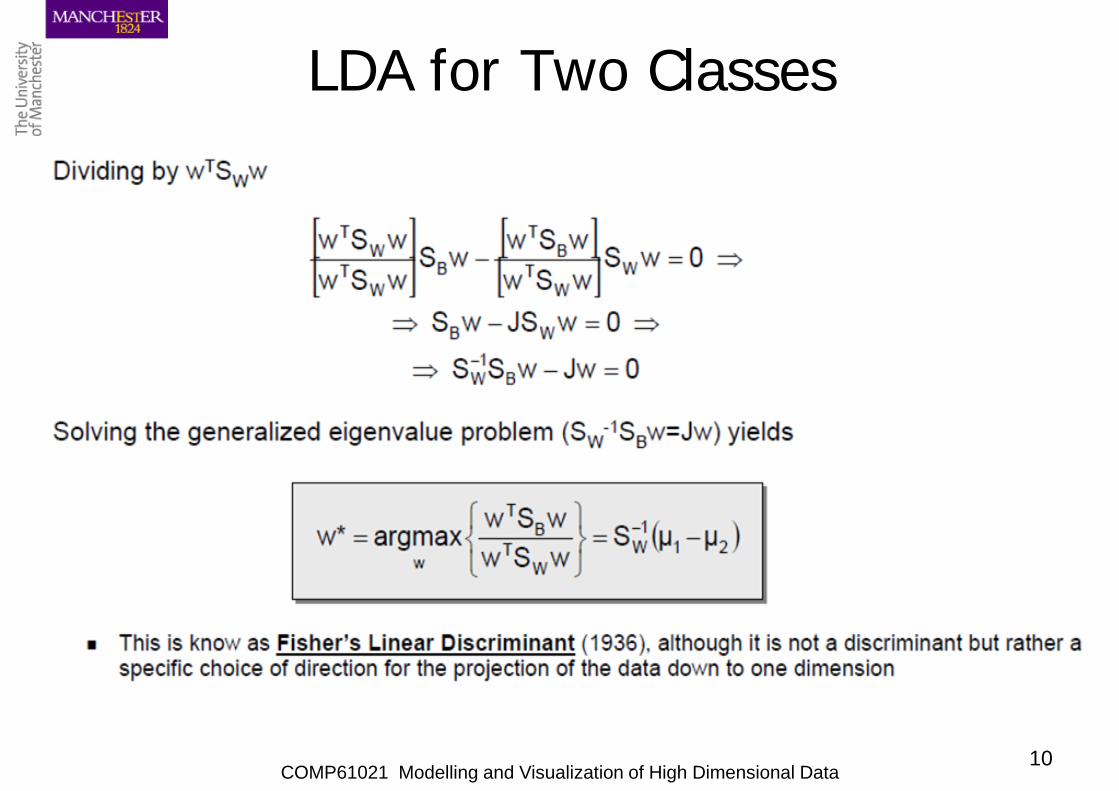
LDA for Two Classes
COMP61021 Modelling and Visualization of High Dimensional Data9
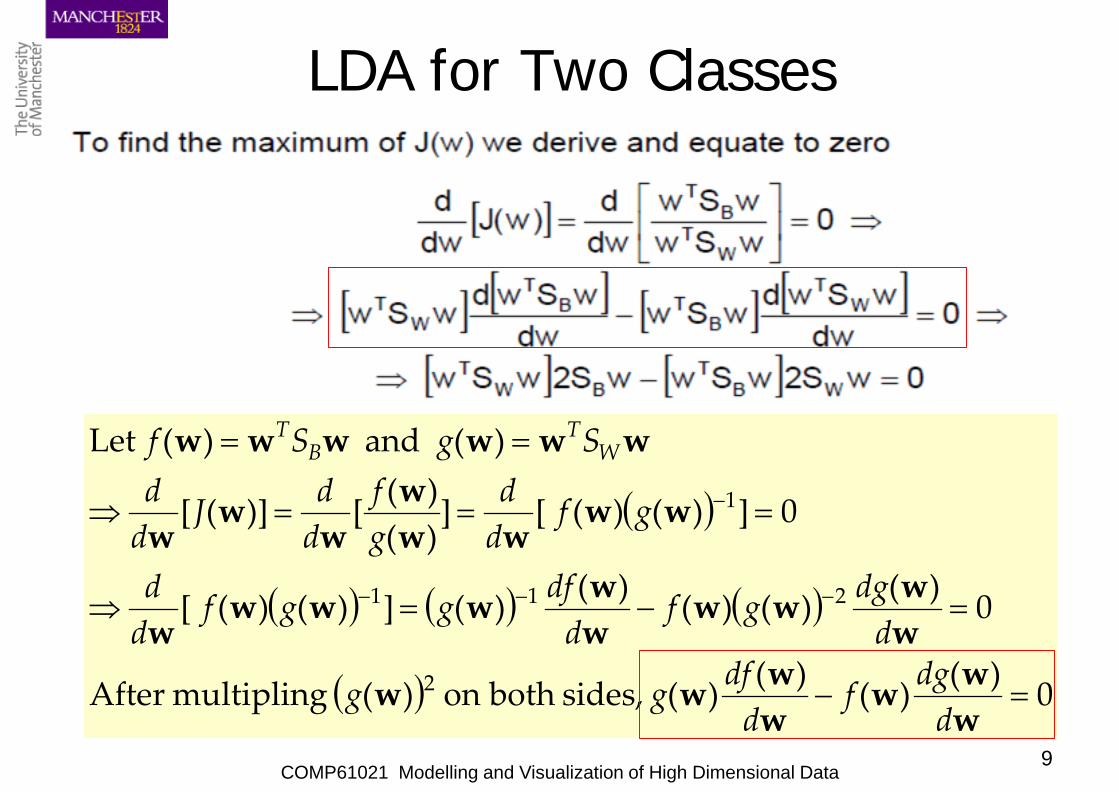
LDA for Two Classes
( )
( ) ( ) ( )
( ) 0)()()()( sides, both on )( multipling After
0)()()()()(])()( [
0])()( [])()([)]([
)( and )( Let
2
211
1
=−
=−=⇒
===⇒
==
−−−
−
www
wwww
wwww
wwwww
w
wwww
ww
ww
wwwwww
ddgf
ddfgg
ddggf
ddfggf
dd
gfdd
gf
ddJ
dd
SgSf WT
BT
COMP61021 Modelling and Visualization of High Dimensional Data10
LDA for Two Classes
COMP61021 Modelling and Visualization of High Dimensional Data11
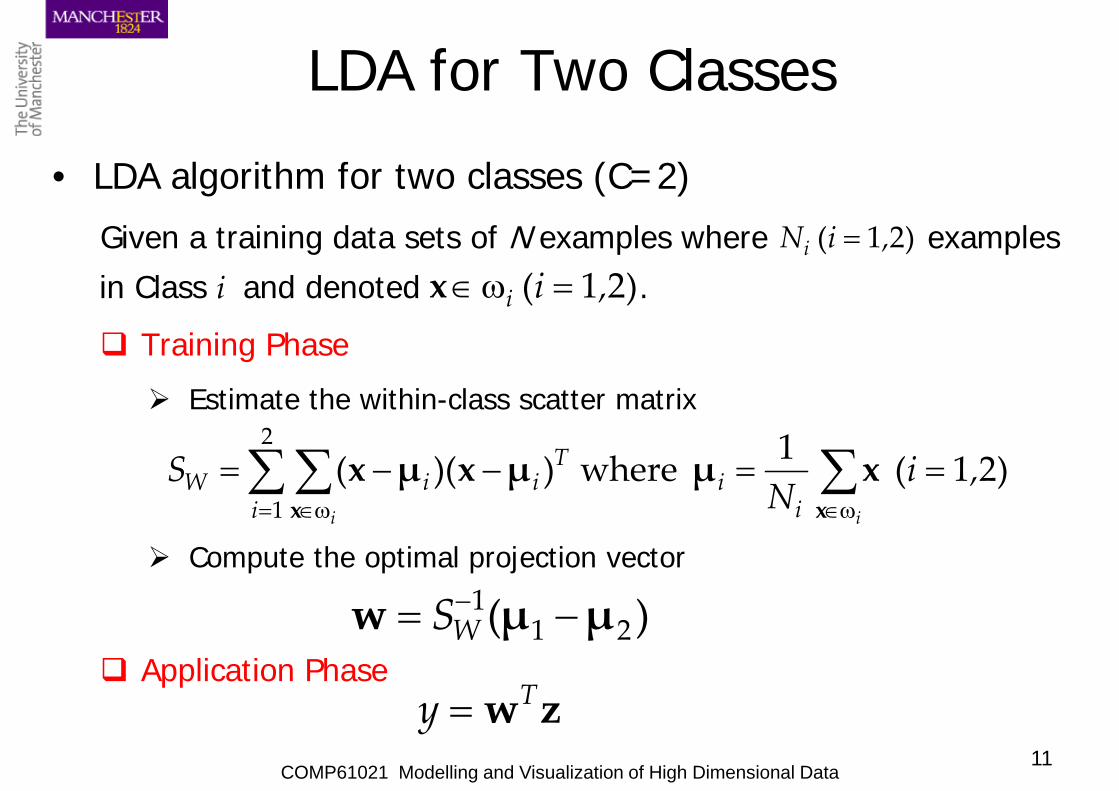
LDA for Two Classes• LDA algorithm for two classes (C=2)
Given a training data sets of N examples where examples in Class i and denoted . Training Phase Estimate the within-class scatter matrix
Compute the optimal projection vector
Application Phase
)21( ,iNi =
)21( ,ii =ω∈x
)21( 1 where ))((2
1,i
NS
ii ii
Tii
iW ==−−= ∑∑∑
ω∈= ω∈ xxxμμxμx
)( 211 μμw −= −
WS
zwTy =
COMP61021 Modelling and Visualization of High Dimensional Data12
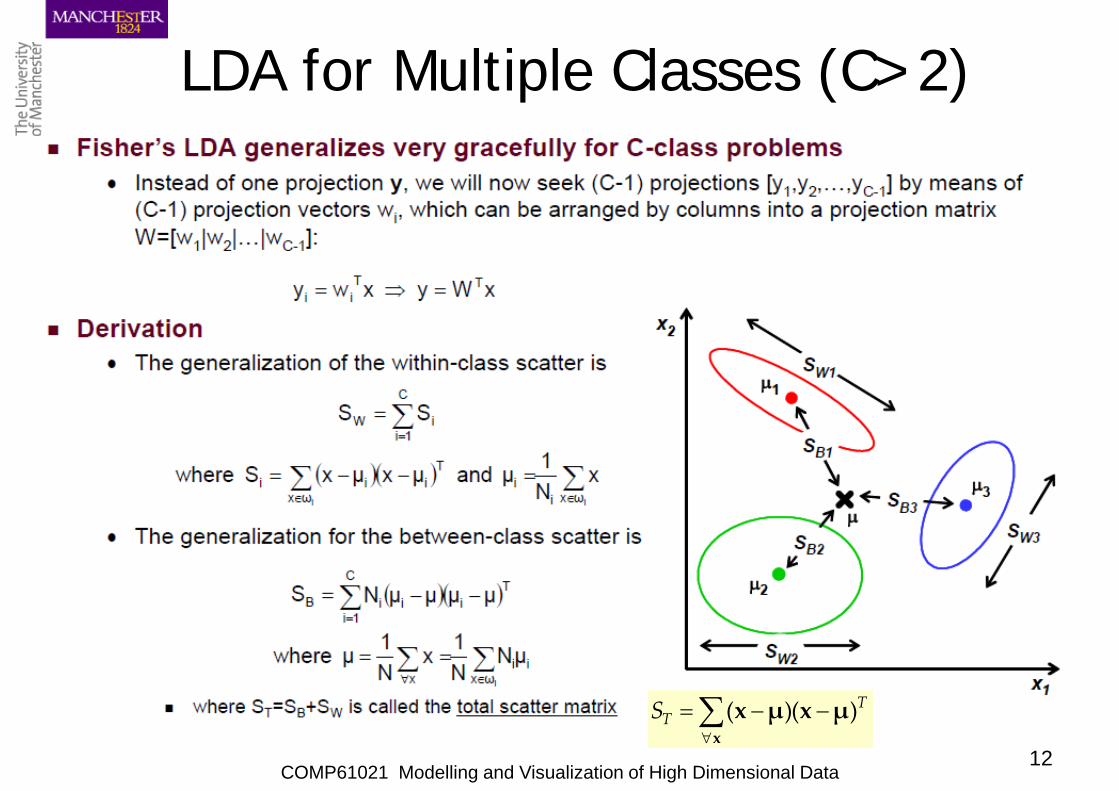
LDA for Multiple Classes (C>2)
TTS )()( μxμx
x−−= ∑
∀
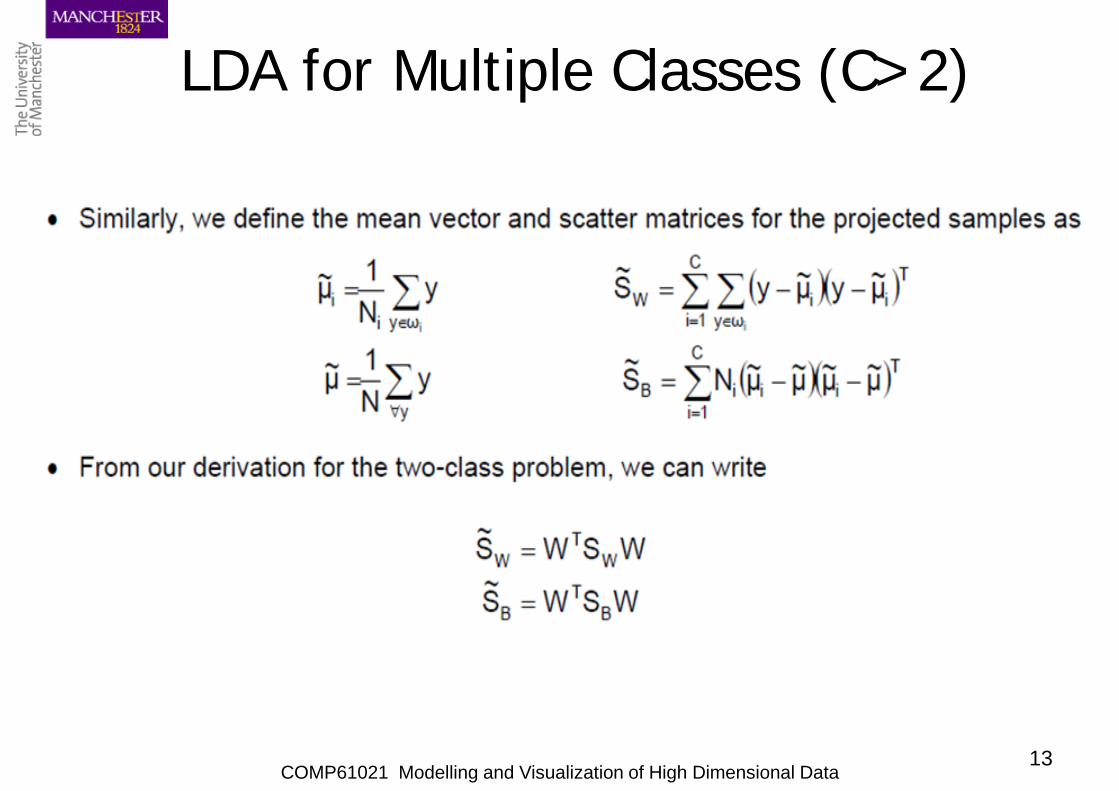
COMP61021 Modelling and Visualization of High Dimensional Data13
LDA for Multiple Classes (C>2)
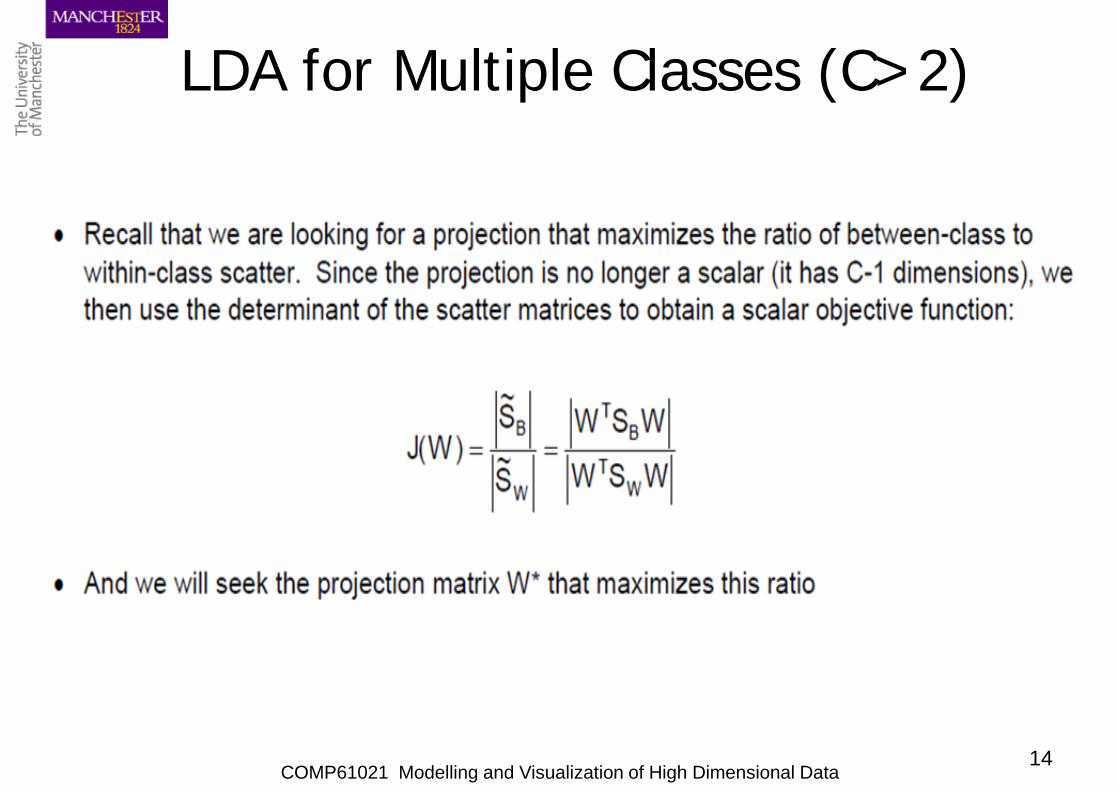
COMP61021 Modelling and Visualization of High Dimensional Data14
LDA for Multiple Classes (C>2)
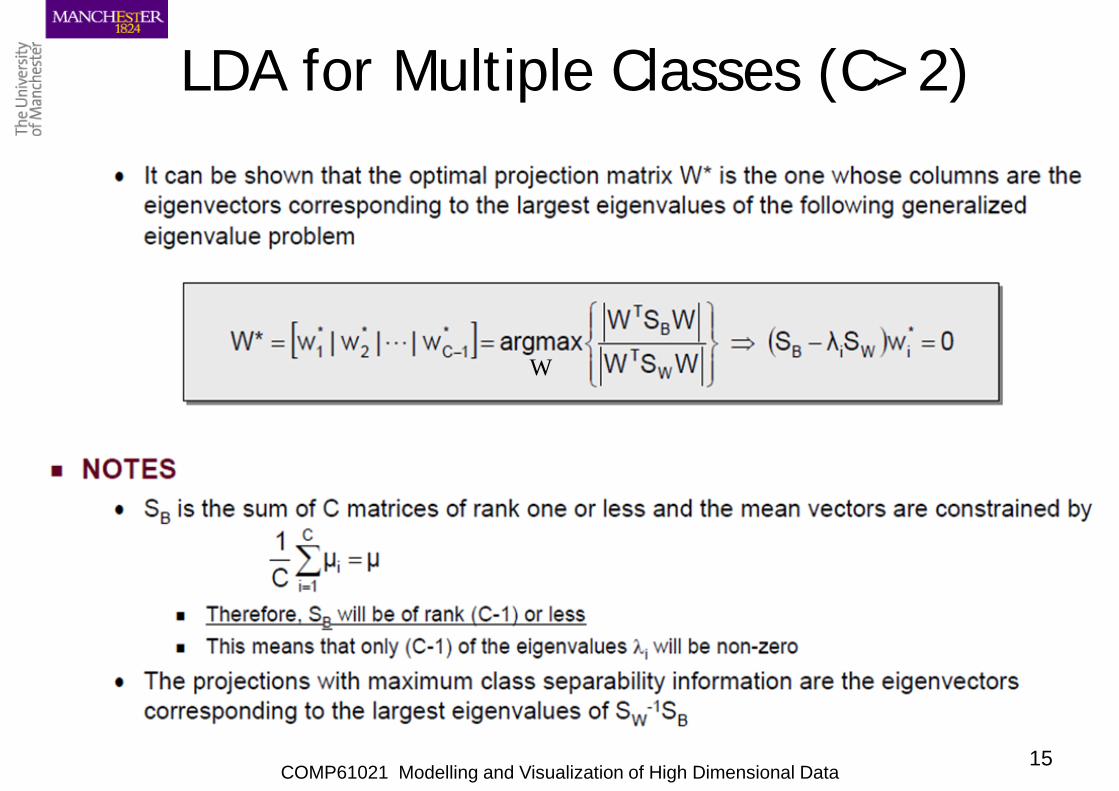
COMP61021 Modelling and Visualization of High Dimensional Data15
LDA for Multiple Classes (C>2)
W
COMP61021 Modelling and Visualization of High Dimensional Data16
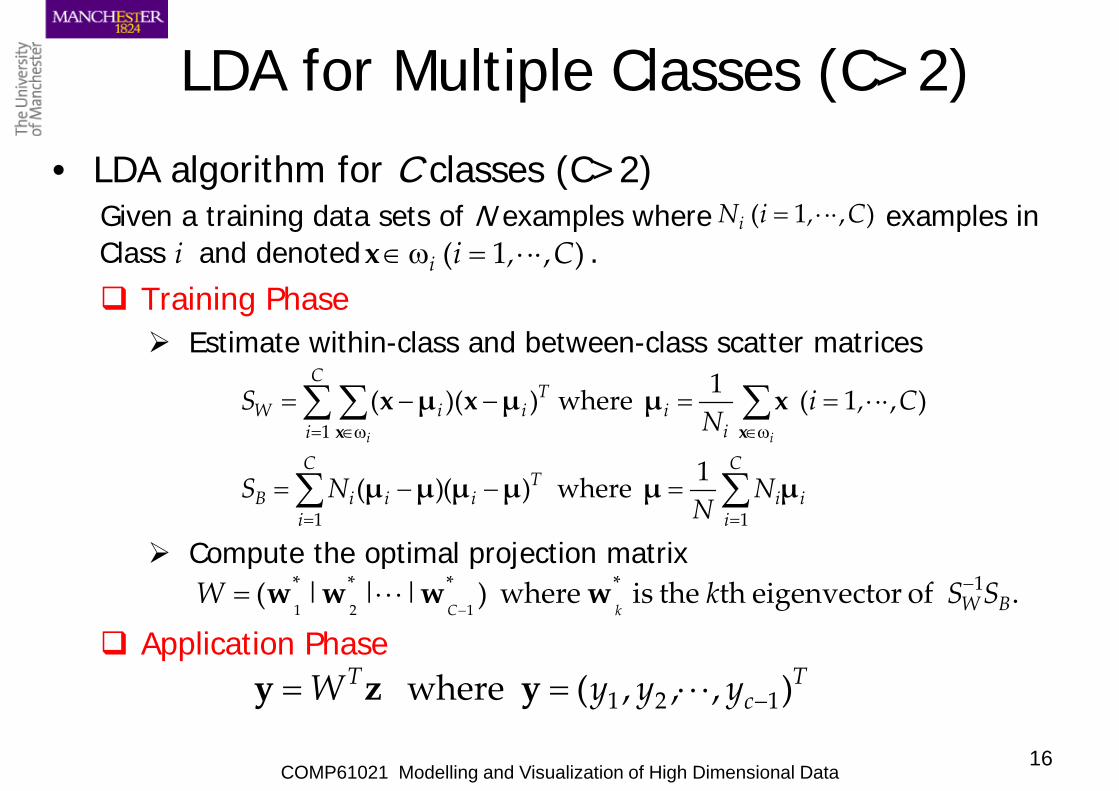
LDA for Multiple Classes (C>2) • LDA algorithm for C classes (C>2)
Given a training data sets of N examples where examples in Class i and denoted . Training Phase Estimate within-class and between-class scatter matrices
Compute the optimal projection matrix
Application Phase
),1( C,iNi ⋅⋅⋅=
),1( C,ii ⋅⋅⋅=ω∈x
i
C
ii
Ti
C
iiiB
ii
Tii
C
iW
NN
NS
C,iN
Sii
μμμμμμ
xμμxμxxx
∑∑
∑∑∑
==
ω∈= ω∈
=−−=
⋅⋅⋅==−−=
11
1
1 where )()(
),1( 1 where ))((
.of reigenvecto th the is where )|||( 1****121 BW SSkW
kC
−−
⋅⋅⋅= wwww
Tc
T yyyW ),,,( where 121 −⋅⋅⋅== yzy
COMP61021 Modelling and Visualization of High Dimensional Data17
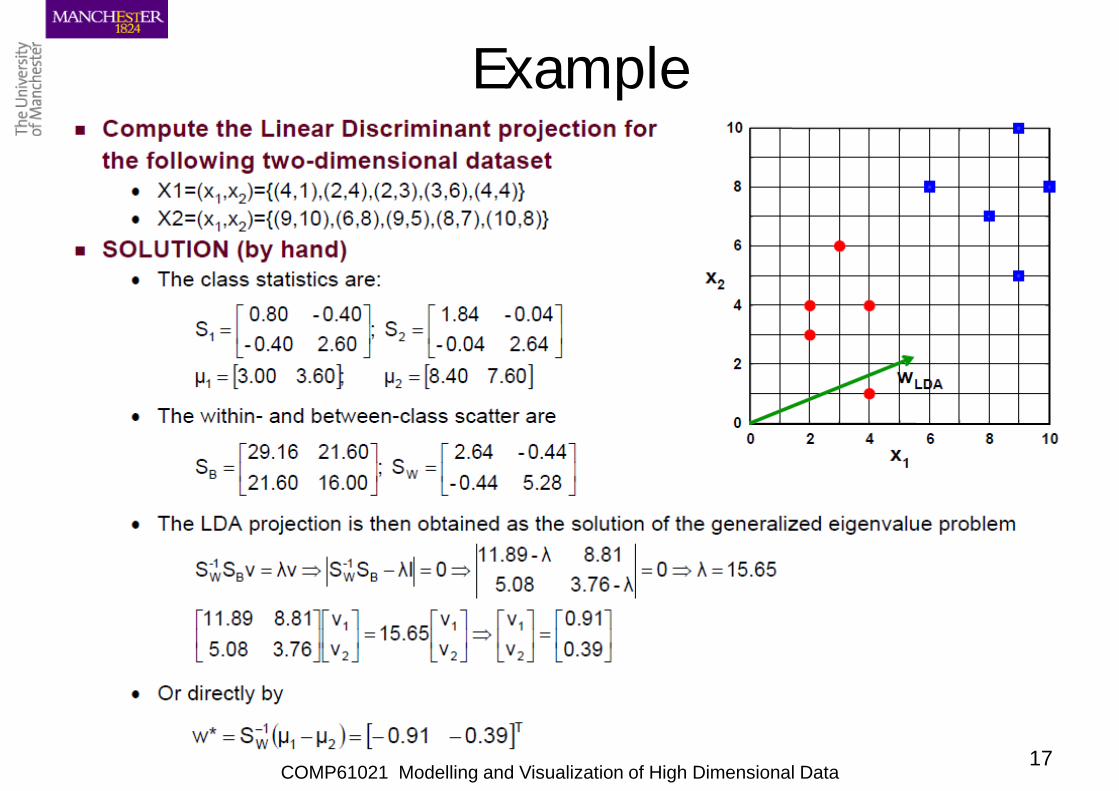
Example
COMP61021 Modelling and Visualization of High Dimensional Data18
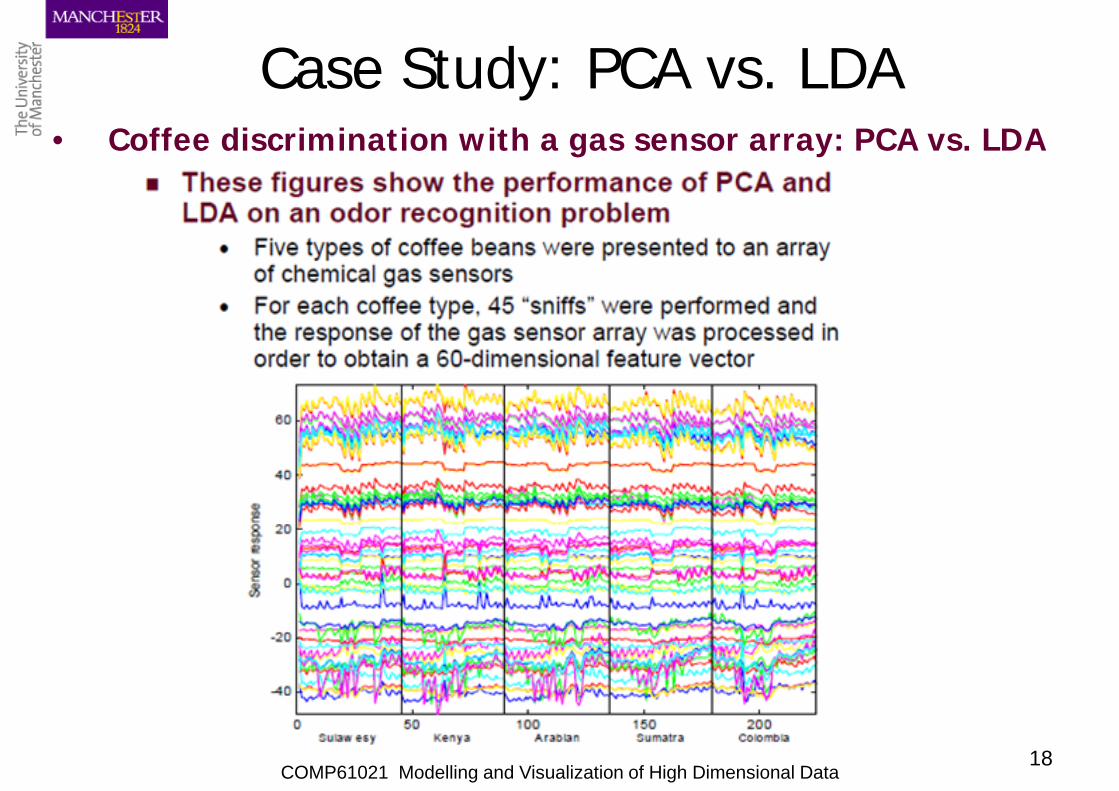
Case Study: PCA vs. LDA• Coffee discrimination with a gas sensor array: PCA vs. LDA
COMP61021 Modelling and Visualization of High Dimensional Data19
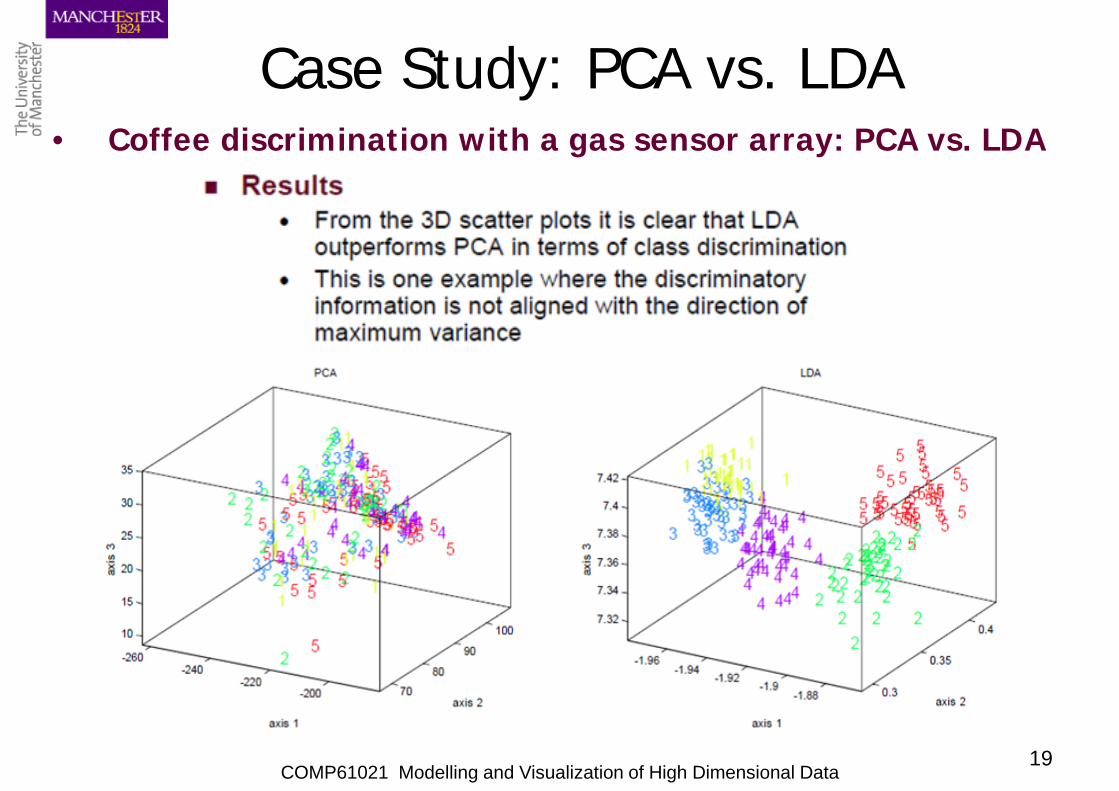
Case Study: PCA vs. LDA• Coffee discrimination with a gas sensor array: PCA vs. LDA
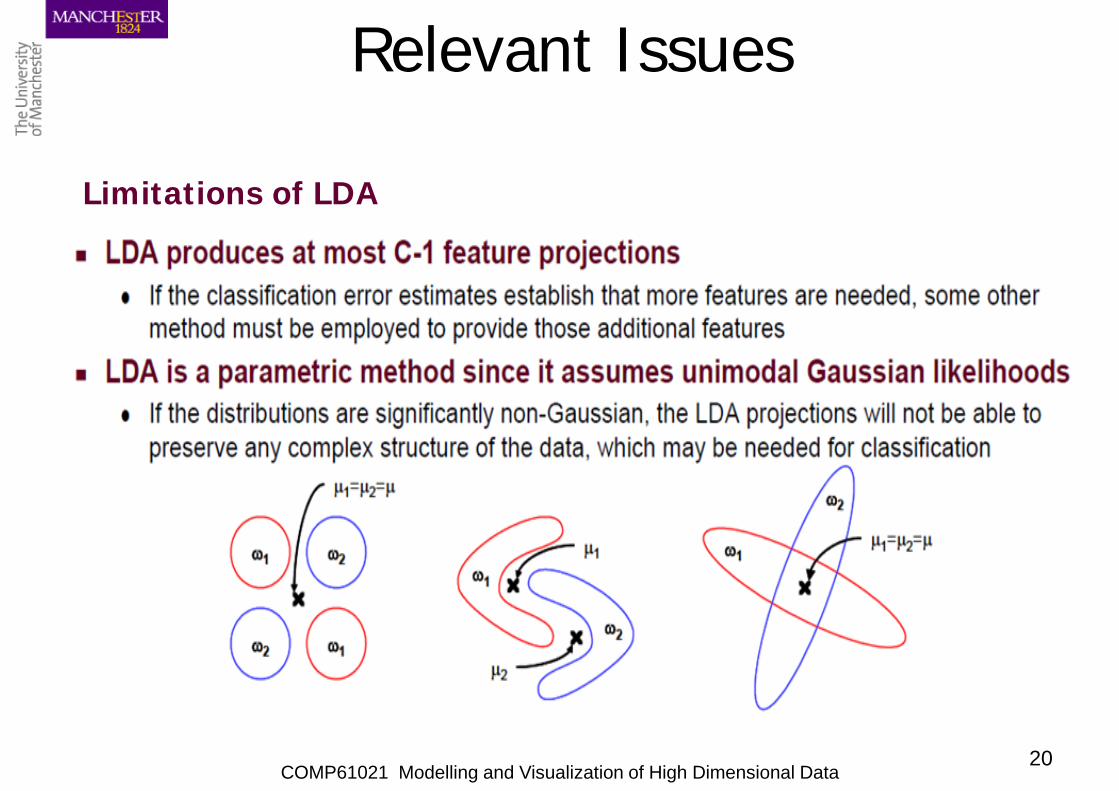
Limitations of LDA
COMP61021 Modelling and Visualization of High Dimensional Data20
Relevant Issues
COMP61021 Modelling and Visualization of High Dimensional Data21
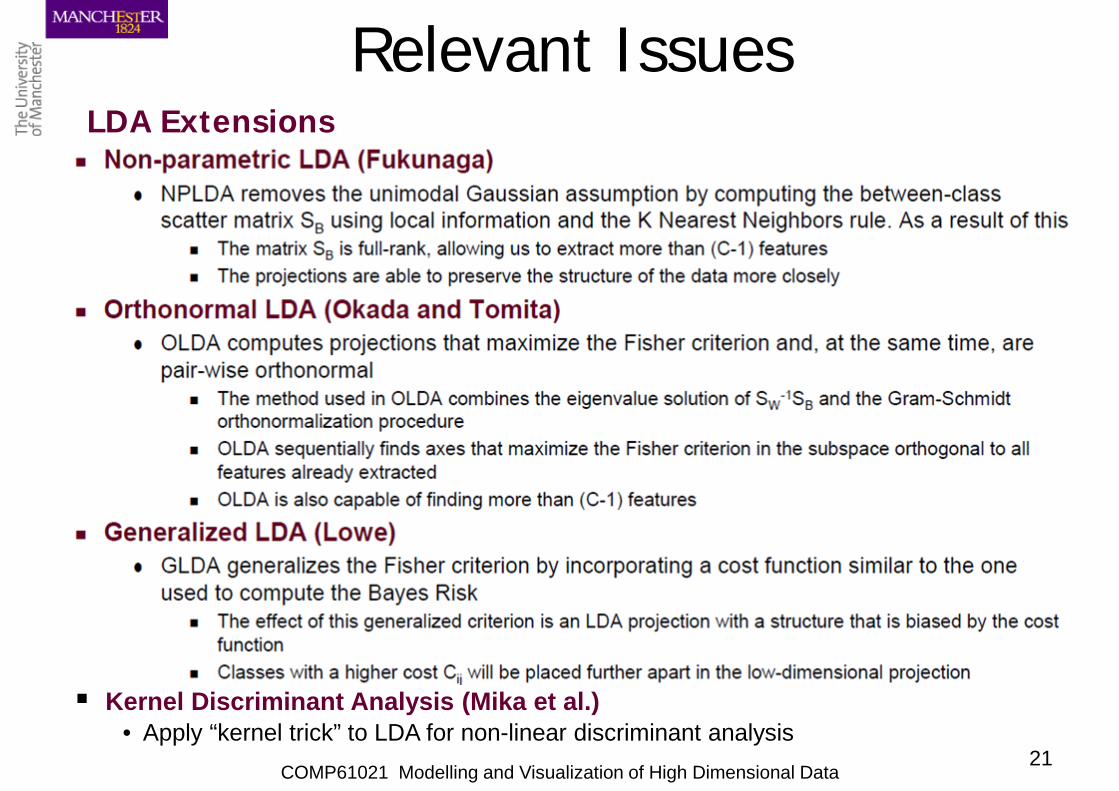
Relevant IssuesLDA Extensions
Kernel Discriminant Analysis (Mika et al.)• Apply “kernel trick” to LDA for non-linear discriminant analysis
COMP61021 Modelling and Visualization of High Dimensional Data22
Conclusions• LDA is a simple yet popular method for handling high
dimensional data as class labels are available.• It is a linear method for dimensionality reduction by
projecting original data to C-1 dimensional space.• LDA is often superior to PCA in feature extraction for
classification but does not always perform better.• There are a number of limitations in the standard LDA.• There are several variants or extensions, which tends to
overcome the limitations of the standard LDA.


![UvA-DARE (Digital Academic Repository) Chemical … discriminant analysis (LDA) ... Fertilizer prills or granules consist, ... plastic explosive no. 4 (PE4) [14], ...](https://static.fdocuments.us/doc/165x107/5ab6a52c7f8b9a86428ddf27/uva-dare-digital-academic-repository-chemical-discriminant-analysis-lda.jpg)