AN ANALYSIS OF FACTORS AFFECTING HCAHPS SCORES AND …
97
AN ANALYSIS OF FACTORS AFFECTING HCAHPS SCORES AND THEIR IMPACT ON MEDICARE REIMBURSEMENT TO ACUTE CARE HOSPITALS THESIS Presented to the Graduate Council of Texas State University-San Marcos in Partial Fulfillment of the Requirements for the Degree Master of BUSINESS ADMINISTRATION by Amy Mandaville, B.S., M.A. San Marcos, Texas December 2012
Transcript of AN ANALYSIS OF FACTORS AFFECTING HCAHPS SCORES AND …

AN ANALYSIS OF FACTORS AFFECTING HCAHPS SCORES AND
THEIR IMPACT ON MEDICARE REIMBURSEMENT
TO ACUTE CARE HOSPITALS
THESIS
Presented to the Graduate Council of
Texas State University-San Marcos
in Partial Fulfillment
of the Requirements
for the Degree
Master of BUSINESS ADMINISTRATION
by
Amy Mandaville, B.S., M.A.
San Marcos, Texas
December 2012

AN ANALYSIS OF FACTORS AFFECTING HCAHPS SCORES AND
THEIR IMPACT ON MEDICARE REIMBURSEMENT
TO ACUTE CARE HOSPITALS
Committee Members Approved:
______________________________
William Chittenden, Chair
______________________________
Francis Méndez
______________________________
Ravi Jillapalli
Approved:
___________________________
J. Michael Willoughby
Dean of the Graduate College

COPYRIGHT
by
Amy Mandaville
2012

FAIR USE AND AUTHOR’S PERMISSION STATEMENT
Fair Use
This work is protected by the Copyright Laws of the United States (Public Law 94-553,
section 107). Consistent with fair use as defined in the Copyright Laws, brief quotations
from this material are allowed with proper acknowledgement. Use of this material for
financial gain without the author’s express written permission is not allowed.
Duplication Permission
As the copyright holder of this work, I, Amy Mandaville, authorize duplication of this
work, in whole or in part, for educational or scholarly purposes only.

v
ACKNOWLEDGEMENTS
The author acknowledges the committee members whose knowledge and support
were invaluable in the completion of this paper. She also is grateful to her husband,
Kevin Mandaville, for his tireless encouragement. Finally, she would like to mention her
colleagues at University Medical Center at Brackenridge who inspired her to pursue
additional academic endeavors.
This manuscript was submitted on October 21, 2012.

vi
TABLE OF CONTENTS
Page
ACKNOWLEDGEMENTS .................................................................................................v
LIST OF TABLES ........................................................................................................... viii
LIST OF FIGURES .............................................................................................................x
ABSTRACT .................................................................................................................... xi
CHAPTER
I. INTRODUCTION .......................................................................................1
II. REVIEW OF THE LITERATURE ..............................................................3
III. PURPOSE OF THE STUDY .......................................................................6
IV. RESEARCH OBJECTIVES ........................................................................7
V. SURVEY DATA.........................................................................................8
Description of the sample ............................................................................9
Incompatibilities between samples ............................................................21
VI. METHODS
Factor Analysis ..........................................................................................22
General Linear Regression Analysis and ANOVA ...................................22
Nonparametric Analysis.............................................................................23
Quantile Analysis .......................................................................................24

vii
VII. RESULTS Page
Factor Analysis ......................................................................................................25
General Linear Regression Analysis and ANOVA ...............................................27
Nonparametric Analysis.........................................................................................47
Quantile Regression ...............................................................................................51
VIII. CONCLUSION ......................................................................................................63
IX. APPENDIX A: HCAHPS SURVEY ....................................................................66
X. APPENDIX B: DATA CODES ............................................................................70
XI. APPENDIX C: QUANTILE ANALYSIS RESULTS TABLES .........................73
XII. BIBLIOGRAPHY ..................................................................................................83

viii
LIST OF TABLES
Table Page
1. AGE DISTRIBUTION 2005 ........................................................................................10 2. HOSPITAL SIZE DISTRIBUTION 2005 ....................................................................10 3. AGE DISTRIBUTION 2006 ........................................................................................12 4. HOSPITAL SIZE DISTRIBUTION 2006 ....................................................................12 5. AGE DISTRIBUTION 2007 ........................................................................................14 6. HOSPITAL SIZE DISTRIBUTION 2007 ....................................................................15 7. TOTAL AGE DISTRIBUTION ...................................................................................16 8. TOTAL HOSPITAL SIZE DISTRIBUTION ...............................................................17 9. TEACHING STATUS DISTRIBUTION .....................................................................18 10. LANGUAGE DISTRIBUTION .................................................................................18 11. RACE DISTRIBUTION .............................................................................................19 12. CORRELATION COEFFICIENTS (KENDALL TAU) ............................................25 13. FACTOR LOADINGS (VARIMAX ROTATION) ...................................................26 14. 2005 MODEL 1 RESULTS ........................................................................................29 15. 2005 MODEL 2 RESULTS ........................................................................................31 16. 2005 MODEL 3 RESULTS ........................................................................................33 17. 2006 MODEL 1 RESULTS ........................................................................................35 18. 2006 MODEL 2 RESULTS ........................................................................................37 19. 2006 MODEL 3 RESULTS ........................................................................................38 20. 2007 MODEL 1 RESULTS ........................................................................................41 21. 2007 MODEL 2 RESULTS ........................................................................................42 22. 2007 MODEL 3 RESULTS ........................................................................................43

ix
Table Page 23. MODEL GOODNESS OF FIT RESULTS FOR 2005 ...............................................46 24. MODEL GOODNESS OF FIT RESULTS FOR 2006 ...............................................46 25. MODEL GOODNESS OF FIT RESULTS FOR 2007 ...............................................46 26. ROBUST MEASURES OF CENTER AND DISPERSION, 2005 ............................47 27. ROBUST MEASURES OF CENTER AND DISPERSION, 2006 ............................48
28. ROBUST MEASURES OF CENTER AND DISPERSION, 2007 ............................50
29. QUANTILE SUMMARY FOR 2005 .........................................................................53
30. 2005 TEACHING QUANTILE REGRESSION COMPARISONS ..........................55
31. QUANTILE SUMMARY FOR 2006 .........................................................................56
32. 2006 TEACHING QUANTILE REGRESSION COMPARISONS ...........................58
33. QUANTILE SUMMARY FOR 2007 .........................................................................59
34. 2005 50th
QUANTILE REGRESSION RESULTS ....................................................73
35. 2005 25th
QUANTILE REGRESSION RESULTS ....................................................75
36. 2005 75th
QUANTILE REGRESSION RESULTS ....................................................76
37. 2006 50th
QUANTILE REGRESSION RESULTS ....................................................77
38. 2006 25th
QUANTILE REGRESSION RESULTS ....................................................78
39. 2006 75th
QUANTILE REGRESSION RESULTS ....................................................79
40. 2007 50th
QUANTILE REGRESSION RESULTS ....................................................80
41. 2007 25th
QUANTILE REGRESSION RESULTS ....................................................81
42. 2007 75th
QUANTILE REGRESSION RESULTS ....................................................82

x
LIST OF FIGURES
Figure Page
1. Distribution of Hospital Ratings ..................................................................................20
2. Scree Plot for 2005 Survey ...........................................................................................26
3. Comparison of Ratings for 2005 ...................................................................................47
4. Comparison of Ratings for 2006 ...................................................................................49
5. Comparison of Ratings for 2007 ...................................................................................50
6. 2005 Base Case Quantile Comparison Chart ................................................................54
7. 2005 Pain Control Quantile Comparison Chart ............................................................55
8. 2006 Base Case Quantile Comparison Chart ................................................................57
9. 2006 Pain Control Quantile Comparison Chart ............................................................57
10. 2007 Base Case Quantile Comparison Chart ..............................................................60
11. 2007 Pain Control Quantile Comparison Chart ..........................................................61
12. 2007 Teaching Quantile Comparison Chart ...............................................................61

xi
ABSTRACT
AN ANALYSIS OF FACTORS AFFECTING HCAHPS SCORES AND
THEIR IMPACT ON MEDICARE REIMBURSEMENT
TO ACUTE CARE HOSPITALS
by
Amy Mandaville, B.S., M.A.
Texas State University-San Marcos
December 2012
SUPERVISING PROFESSOR: WILLIAM CHITTENDEN
Patient responses to the Hospital Consumer Assessment of Healthcare Providers
and Systems (HCAHPS) for 2005, 2006, and 2007 were analyzed to determine if a
pattern of responses correlated with overall acute care hospital ratings. Although a
statistically significant difference was noted between major teaching hospitals, minor
teaching hospitals, and non-teaching hospitals, there was no practical significance
observed when other variables were added. Pain control and nurse interaction with
patients were the variables found to be most closely correlated with overall hospital
ratings.

1
I. INTRODUCTION
Medicare is a national health insurance program passed into law in 1965 to
provide guaranteed medical coverage for aged and disabled citizens. Medicare is
administered by the federal government and currently provides healthcare coverage for
U.S. citizens 65 years or older, as well as younger individuals with disabilities and those
with permanent kidney disease. It is funded by employee/employer payroll taxes and by
premiums deducted from Social Security checks. Medicare is divided into four defined
benefits. Part A covers hospital care, Part B provides outpatient services, Part C (or
Medicare Advantage) allows participation in a federally subsidized private health plan,
and Part D encompasses prescription drug coverage (Social Security 2012).
Medicare is the single largest source of reimbursement for medical services in the
United States, paying $318,009,000,000 to healthcare providers in 2010. Most recipients
of Medicare services are over 65 years old, but 16.85% of Medicare patients are younger
and disabled (U.S. Social Security Administration 2011). Starting in October 2012,
Medicare will begin reimbursing hospitals based on patient satisfaction survey scores.
“Under the CMS's (Centers for Medicare and Medicaid Services) proposal, Medicare will
begin withholding 1% of its payments to hospitals starting in October 2012. That money
— $850 million in the first year — will go into a pool to be doled out as bonuses to
hospitals that score above average on several measures. Patient survey scores would
determine 30% of the bonuses, while clinical measures for basic quality care would set

2
the rest” (Rau 2011). Medicare will increase hospital payments withholding to 2% in
2017 (Adamy 2012). The implications of this funding change may be significant for
hospitals that serve patients who are not likely to report high patient satisfaction.
Examination of differences in patient satisfaction scores between different types of
hospitals and factors measured may yield useful information about adjustments that
might be considered to render more equitable distribution of funds under the new system.

3
II. REVIEW OF THE LITERATURE
Although patient satisfaction surveys have been used in the healthcare community
for many years, there was not an approved standardized instrument to compare different
facilities before 2005. In addition, the information from the surveys was not publicly
reported. In September 1999, an organization was founded to improve national
healthcare quality, including standardizing health quality measurement and reporting,
called the National Quality Forum (NQF) (National Quality Forum 2011). With the
consensus of a variety of stakeholders and in cooperation with RAND, Harvard Medical
School, and the American Institutes for Research (Gage 2008), NQF formally endorsed
the Hospital Consumer Assessment of Healthcare Providers and Systems (HCAHPS)
Survey as an instrument that would produce comparable, reportable data about patient
care perceptions in May 2005 (Services 2011).
The HCAHPS is a patient satisfaction survey consisting of 27 questions that can
be administered by four possible methods or modes: mail, telephone, mail followed by
telephone, or active interactive voice response (IVR). Eighteen of the questions are
patient rating items that cover “communication with doctors, communication with nurses,
responsiveness of hospital staff, pain management, communication about medicines,
discharge information, cleanliness of environment, and quietness of the hospital
environment” (Services 2011). Additional questions include screener items, such as

4
overall hospital rating and whether the patient would recommend the hospital
demographic items to assist with analysis of the information collected. The survey is
available in English, Spanish, Chinese, Russian, and Vietnamese. A copy of the English
survey is included in Appendix A (HCAHPS Hospital Survey 2012).
It is well documented (Young 2000) (Fenton 2012) that different demographics of
patients respond differently to patient satisfaction survey questions, which will now affect
hospital reimbursement. Patient characteristics, as well as mode of survey, were
considered in a study by O’Malley in 2005 to develop a model for case-mix adjustment
and not penalize hospitals unfairly for types of patients and disorders that present to the
hospital. The study indicated that “hospital service (surgery, obstetric, medical), age,
race (non-Hispanic black), education, general health status, speaking Spanish at home,
having a circulatory disorder, and interactions of each of these variables with service”
modestly but significantly affected patient satisfaction ratings (O'Malley 2005, 2162).
More recent information indicated that ratings of nurses, doctors, and pain management
had the most impact on HCAHPS scores (Maxfield 2012). Identical results were
determined in the findings of this study.
Other healthcare facilities have conducted research into variables affecting patient
satisfaction scores. “Dr. James Merlino, chief experience officer at the Cleveland Clinic,
which scores below average on seven of nine key patient-satisfaction questions, tells
Kaiser Health News that doctors and nurses have done their own studies and concluded
that very sick and depressed patients give skewed views. Very ill patients are less likely
to report that nurses check in on them every hour — even when logs prove they did, he
says” (Suttell 2011). It was also found that patients who receive emergency care are

5
more likely to rate their experiences poorly than patients who receive scheduled care
(Gage 2008).
Based on the studies of patient characteristics, CMS determined that an
adjustment for mode of survey and patient mix, including emergency room admission
(HCAHPS - Hospital Care Quality Care Information from the Customer Perspective
2008), prior to reporting the data on www.hospitalcompare.hhs.gov was warranted
(Hospital Compare 2012). The adjustment appeared to have a lesser impact on scores
than on overall hospital rating, but CMS felt that the adjustment reduced bias in the
comparison of hospitals, particularly for hospitals that served lower socio-economic
patients and those with multiple co-morbidities affecting overall health (Gage 2008).
However, there is concern in the medical community that all variables that
contribute to patient satisfaction scores have not been considered. For example, teaching
hospitals, which provide educational experience to the next generation of physicians, are
33% more costly than non-teaching hospitals (Cameron 1985) and only 10% of them
reportedly can compete with non-teaching hospitals based on the provision of patient
services (Grosskopf 2001) (Weissman 2002) (Khuri 2001). Although some studies
indicate improved patient survival rates and measures of quality care in teaching hospitals
(Allison 2011), perceptions of patient satisfaction are not necessarily correlated to better
medical care (Fenton 2012). In fact, some research shows that teaching hospital and
other large hospitals receive worse patient evaluations than other hospitals, a factor that
CMS will not consider in its funding decisions (Weaver 2011).

6
III. PURPOSE OF THE STUDY
The HCAHPS survey is being used to measure hospital patient satisfaction
nationally, and the results will be utilized to determine Medicare funding within the next
year. Research about survey mode and patient-mix has resulted in adjustment to scores
to accommodate factors that might unfairly lead to lower scores. However, no research
has addressed whether or not scores for teaching hospitals have statistically significantly
lower scores than the average score of non-teaching hospitals, despite literature to
indicate that teaching hospitals may indeed have lower scores and require higher costs to
operate than non-teaching hospitals. Changes in Medicare funding will negatively affect
teaching hospitals’ ability to train new physicians, impacting healthcare across the
country. Additional factors, such as pain control, nurse interactions and physician
interactions, and their affects on hospital ratings, have not been extensively examined.
This study, then, will examine the relationship between factors such as teaching
hospitals’ patient satisfaction survey scores and those of non-teaching hospitals, pain
control variables, and nurse and physician interactions with patients. A statistically
significant difference between these factors may allow CMS to examine adjustment to
HCAHPS scores prior to posting them publicly and adjusting levels of reimbursement
accordingly. This information is significant for healthcare providers, healthcare
administrators, and any individual who will access hospital healthcare services.

7
IV. RESEARCH OBJECTIVES
In order to determine whether HCAHPS scores vary by different factors, a
description of the responses and the population of respondents will be presented. A
descriptive analysis of the data will be performed in order to determine the characteristics
of the hospitals in the sample. The composition of the sample will be compared to the
composition of the target population of hospitals.
A factor analysis will be performed to observe how consistently the individual
items load with groupings designated by HCAHPS as nurse care and MD care. These
groups will be analyzed separately. The study will present analysis of how these sources
of care and the general hospital experience are related to overall quality ratings. As noted
in the literature review, quality ratings can be influenced by patients’ overall health
rating, educational level, race/ethnicity, language spoken in the home, age, and gender.
Pain management was not included in previous research (O'Malley 2005), but it will be
included in this study as a possible predictor of patient satisfaction. Size of hospital and
hospital ownership are not variables that have been suggested to influence patient
satisfaction ratings significantly, and they will not be included in the study. In addition,
teaching hospitals are suggested by the literature to have lower patient satisfaction scores
and higher costs than non-teaching hospitals and are one focus of this investigation.

8
V. SURVEY DATA
Raw data from HCAHPS surveys from 2005, 2006, and 2007 were obtained from
the CAHPS database in Rockville, MD. Current information indicates that HCAHPS
survey responses have remained essentially flat over the last five years, varying no more
than 8% from year to year (Maxfield 2012), indicating that the raw data obtained from
2005-2007 should be valid for current analysis. The data required some manipulation in
order to complete the analyses. Unlike the HCAHPS surveys response files for 2006 and
2007, the data from 2005 surveys were not coded with hospital size, ownership, or
teaching status in the same data set; therefore, those hospital codes were added to the
2005 data to facilitate the comparison and the analysis. For the variable age, the code
999 was used as a nonresponse or missing data flag. The 999s were replaced with the
missing data identifier used in R language (“NA”). Finally, some of the data utilized
actual ages of the patient, while other data were coded as age ranges. Since for the 2006
and 2007 files only ranges are available, the actual ages in the 2005 data were categorized
following the same convention of the files for 2006 and 2007. All question responses on
the HCAHPS survey were recoded from negative to positive, with the exception of
Overall Health rating in the survey. In order to compare items during analysis, the
Overall Health rating responses were recoded to place the most negative rating as the first

9
possible response and the most positive rating as the last possible response. The teaching
status, hospital size, hospital ownership, and age range codes can be found in Appendix
B. Finally, hospital service (obstetric, medical, or surgical) was not coded in the 2005
data but was available for the 2006 and 2007 data.
Description of the sample
The 2005 HCAHPS data consist of 151,296 responses from 254 hospitals. 52,322
(34.58%) of respondents were male and 96,912 (64.05%) respondents were female.
Gender was not specified in 2062 (1.36%) cases. A total of 26,849 (17.75%) responses
were from major teaching hospitals, 49,487 (32.70%) were from minor teaching
hospitals, and 74,960 (49.55%) were from non-teaching hospitals. A total of 3,332
(2.20%) responses were from non-profit hospitals, 114,433(75.64%) were from for-profit
hospitals, and 33,531(22.16%) were from non-federal government hospitals. A total of
182 respondents in this data set were minor children, under the age of 18. These
responses for minor children were eliminated from the study because they will not be
included in Medicare reimbursement changes in the future. The following tables show
age distributions and hospital size in the 2005 data set:

10
TABLE 1: AGE DISTRIBUTION 2005
TABLE 2: HOSPITAL SIZE DISTRIBUTION 2005
Bedsize
Number of
Respondents
Percentage of
Respondents
6-24 1689 1.12%
25-49 6071 4.01%
50-99 12402 8.20%
100-199 28659 18.94%
200-299 26591 17.58%
300-399 30766 20.33%
400-499 12517 8.27%
500+ 32601 21.55%
Totals 151296 100.00%
Additional information about the respondents was obtained from the data,
including educational level, race, ethnicity, and survey language. Educational level for
Age Number of Respondents Percentage of Respondents
18-24 12624 8.58%
25-29 11457 7.79%
30-34 10985 7.47%
35-39 8842 6.01%
40-44 8520 5.79%
45-49 9559 6.50%
50-54 10374 7.05%
55-59 10809 7.35%
60-64 10601 7.20%
65-69 11138 7.57%
70-74 11607 7.89%
75-79 12030 8.18%
80-84 10278 6.98%
85-89 5760 3.91%
90+ 2567 1.74%
Totals 147151 100.00%

11
the 2005 data included 4,615 (5.61%) of respondents having less than an 8th
grade
education, 8,943 (10.86%) with some high school, 25,886 (31.45%) reporting to be high
school graduates or obtaining G.E.D.s, 22,934 (27.86%) with some college or a two year
degree, 10,950 (13.30%) with four year college degrees, and 8,993 (10.92%) with
education beyond a four year college degree. The number of respondents who completed
the survey in a given language was 76,738 (92.66%) for English, 4,754 (5.74%) for
Spanish, and 1,322 (1.60%) for Chinese. Ethnicity was described as 9,052 (11.48%)
Spanish/Hispanic/Latino and 69,818 (88.52%) not Spanish/Hispanic/Latino. Race was
categorized as 41,267(27.28%) Caucasian/White; 7,678 (5.07%) African-
American/Black; 1,131 (0.75%) Asian-American; 260 (0.19%) Pacific Islander; 961
(0.64%) American Indian or Alaska native; and 5,775 (3.82%) Other. The remainder of
the data was not coded for race, which included 94,224 (62.28%) respondents in the 2005
data set.
The 2006 HCAHPS data consist of 190,690 responses from 935 hospitals. A total
of 67,112 (35.28%) of respondents were male and 123,090 (64.72%) respondents were
female, comparable to the composition of 2005. Gender was not specified in 488
(0.26%) cases. A total of 18,423 (9.66%) responses were from major teaching hospitals,
28,452 (14.92%) were from minor teaching hospitals, and 143,815 (75.42%) were from
non-teaching hospitals. A total of 10,593 (5.56%) responses were from non-federal
government hospitals, 109,652 (57.50%) were from non-profit hospitals, 68,892
(36.13%) were from for-profit hospitals, and 1553 (0.81%) were from federal
government hospitals. The following table shows age distributions in the 2006 data set:

12
TABLE 3: AGE DISTRIBUTION 2006
Age Number of
Respondents
Percentage of
Respondents
18-24 11405 6.08%
25-29 11890 6.33%
30-34 11165 5.95%
35-39 8693 4.63%
40-44 7792 4.15%
45-49 9625 5.13%
50-54 11584 6.17%
55-59 13926 7.42%
60-64 14834 7.91%
65-69 17419 9.28%
70-74 18667 9.94%
75-79 20071 10.69%
80-84 16844 8.97%
85-89 9594 5.11%
90+ 4204 2.24%
Totals 187713 100.00%
The size of the hospital was coded by number of beds. The following table shows the
distribution of hospital size in the 2006 data set.
TABLE 4: HOSPITAL SIZE DISTRIBUTION 2006
Bedsize Number of Respondents Percentage of Respondents
0-24 723 0.38%
25-49 7408 3.88%
50-99 22443 11.77%
100-199 57472 30.14%
200-299 38980 20.44%
300-399 27627 14.49%
400-499 16428 8.62%
500+ 19609 10.28%
Totals 190690 100%

13
Educational level for the 2006 data included 11,947 (6.57%) of respondents
having less than an 8thgrade education, 18,456 (10.15%) with some high school, 54,510
(29.96%) reporting to be high school graduates or obtaining G.E.D.s, 52,226 (28.71%)
with some college or a two year degree, 22,910 (12.59%) with four year college degrees,
and 21,873 (12.02%) with education beyond a four year college degree.
The number of respondents who completed the survey in a given language was
167,503 (91.65%) for English, 11,401(6.24%) for Spanish, and 3,867 (2.12%) for
Chinese. Ethnicity was described as 131,562 (76.58%) not Spanish/Hispanic/Latino;
25,037(14.57%) Puerto Rican; 7,789 (4.53%) Mexican-American/Chicano; 574 (0.33%)
Cuban; or 6834 (3.98%) other Spanish/Hispanic/Latino. Race was categorized as
148,801 (78.03%) Caucasian/White; 15,650 (8.21%) African-American/Black; 6,965
(3.65%) Asian-American; 1,303 (0.68%) Pacific Islander; 3,877 (2.03%) American
Indian or Alaska native and 14,094 (7.39%) Other. In addition, since the 2006 and 2007
data include principal reason for hospital admission, 22,661(16.10%) was obstetric,
69,561(49.43%) was medical, and 48,500 (34.47%) was surgical for the 2006 data.
The 2007 HCAHPS data consist of 547,391 responses from 1325 hospitals.
191,027 (35.38%) of respondents were male and 348,921(64.62%) respondents were
female; a similar distribution to the ones from 2005 and 2006. Gender was not specified
in 7,443 (1.36%) cases. A total of 54,671 (9.99%) responses were from major teaching
hospitals, 102,672 (18.76%) were from minor teaching hospitals, and 390,047 (71.26%)
were from non-teaching hospitals. A total of 345,467 (63.11%) responses were from
non-profit hospitals, 159,683 (29.17%) were from for-profit hospitals, 40,036 (7.31%)

14
were from non-federal government hospitals, and 2204 (0.40%) were from federal
government hospitals. The following table shows age distributions in the 2007 data set:
TABLE 5: AGE DISTRIBUTION 2007
The size of the hospital was coded by number of beds. The following table shows the
distribution of hospital size in the 2007 data set.
AgeNumber of
Respondents
Percentage of
Respondents
18-24 32252 5.94%
25-29 34688 6.38%
30-34 31602 5.82%
35-39 21983 4.05%
40-44 21983 4.05%
45-49 28183 5.19%
50-54 34417 6.33%
55-59 41057 7.56%
60-64 46497 8.56%
65-69 52721 9.70%
70-74 54804 10.09%
75-79 56016 10.31%
80-84 47482 8.74%
85-89 27705 5.10%
90+ 11896 2.19%
Totals 543286 100.00%

15
TABLE 6: HOSPITAL SIZE DISTRIBUTION 2007
BedsizeNumber of
Respondents
Percentage of
Respondents
0-24 5705 1.05%
25-49 31367 5.73%
50-99 68894 12.59%
100-199 144254 26.35%
200-299 115680 21.13%
300-399 76320 13.94%
400-499 37892 6.92%
500+ 67278 12.29%
Totals 547390 100.00%
Educational level for the 2007 data was delineated with 35,206 (6.76%) of
respondents having less than an 8th
grade education, 54,373(10.43%) with some high
school, 160,180 (30.74%) reporting to be high school graduates or having obtained
G.E.D.s, 148,795 (28.55%) with some college or a two year degree, 63,040 (12.10%)
with four year college degrees, and 59,522 (11.42%) with education beyond a four year
college degree.
The number of respondents who completed the survey in a given language was
487,809 (92.90%) for English, 27,861 (5.31%) for Spanish, and 9,425 (1.79%) for
Chinese. Ethnicity was described as 431,514 (88.11%) not Spanish/Hispanic/Latino;
5,331(1.09%) Puerto Rican; 29,435 (6.01%) Mexican-American/Chicano; 3,269 (0.67%)
Cuban; or 20,216 (4.13%) other Spanish/Hispanic/Latino. Race was categorized as
434,348 (79.35%) Caucasian/White; 47,335 (8.65%) African-American/Black; 17,299
(3.16%) Asian-American; 4,363 (0.80%) Pacific Islander; 11,628 (2.12%) American
Indian or Alaska native and 32,418 (5.92%) Other. In conclusion, hospital service was
coded as 82,911 (16.59%) obstetric, 246,658 (49.36%) medical, and 170,093 (34.04%)
surgical for the 2007 data.

16
TABLE 7 shows a comparison of the composition of the age distributions for the
samples of 2005, 2006 and 2007. Although age distribution appears to be fairly
consistent across data samples, the 2006 and 2007 respondents appear to be slightly older
than the respondents from the 2005 data sample. Beginning at the 60-64 year age range,
the survey participants appear to be 1-2% more prevalent in the 2006 and 2007 data sets
than in the 2005 data set. In the younger age ranges, respondents appear with 1-2% less
frequency in the 2006-2007 data sets than those in the 2005 data sample. It should be
noted that the 2005 data set was significantly smaller than the 2006 and 2007 data sets,
and older participants may not have been as readily available at that time.
TABLE 7: TOTAL AGE DISTRIBUTION
Percentage of Respondents
Age 2005 2006 2007
18-24 8.58% 6.08% 5.94%
25-29 7.79% 6.33% 6.38%
30-34 7.47% 5.95% 5.82% 35-39 6.01% 4.63% 4.05% 40-44 5.79% 4.15% 4.05%
45-49 6.50% 5.13% 5.19%
50-54 7.05% 6.17% 6.33%
55-59 7.35% 7.42% 7.56% 60-64 7.20% 7.90% 8.56% 65-69 7.57% 9.28% 9.70%
70-74 7.89% 9.94% 10.09% 75-79 8.18% 10.69% 10.31% 80-84 6.98% 8.97% 8.74%
85-89 3.91% 5.11% 5.10%
90+ 1.74% 2.24% 2.19%
Totals 100.00% 100.00% 100.00%

17
TABLE 8 shows a comparison of the composition of the hospital bedsize
distributions for the samples of 2005, 2006 and 2007. There were more hospitals at the
100-199 bed range and the 200-299 bed range in the 2006-2007 data sets than there were
TABLE 8 shows a comparison of the composition of the hospital bedsize distributions
for the samples of 2005, 2006 and 2007. There were more hospitals at the 100-199 bed
range and the 200-299 bed range in the 2006-2007 data sets than there were in the 2005
data set. There were fewer beds in the 300+ bed range in the 2006-2007 data sets than
there were in the 2005 data set. There is no apparent reason for this variation, other than
which hospitals agreed to participate in the survey. Responses for year 2005 had a larger
participation for larger hospitals than the ones in 2006 and 2007.
TABLE 8: TOTAL HOSPITAL
SIZE DISTRIBUTION
Bedsize 2005 2006 2007
6-24 1.12% 0.38% 1.04%
25-49 4.01% 3.88% 5.73%
50-99 8.20% 11.77% 12.59%
100-199 18.94% 30.14% 26.35%
200-299 17.58% 20.44% 21.13%
300-399 20.33% 14.49% 13.94%
400-499 8.27% 8.62% 6.92%
500+ 21.55% 10.28% 12.30%
Totals 100.00% 100.00% 100.00%
A table comparing distribution of teaching and non-teaching hospitals was
included as this variable is one of the subjects of investigation. Major Teaching hospital
refers to a facility with a large number of physician residency programs and is typically
affiliated with a medical school. Minor Teaching hospital refers to a facility with a small

18
number of physician residency programs and may or may not be directly affiliated with a
medical school. Non-teaching hospitals are those that do not provide clinical education
to student physicians.
TABLE 9 shows a comparison of the composition of the teaching status
distributions for the samples of 2005, 2006 and 2007. Fewer teaching hospitals (both
major and minor) participated in the 2006 and 2007 surveys than did in the 2005 surveys.
TABLE 9: TEACHING STATUS DISTRIBUTION
Hospital Status 2005 2006 2007
Major Teaching 17.75% 9.66% 9.99%
Minor Teaching 32.70% 14.92% 18.76%
Non-Teaching 49.55% 75.42% 71.25%
Total 100.00% 100.00% 100.00%
TABLE 10 shows a comparison of the composition of language distributions for
the samples of 2005, 2006 and 2007. No significant difference in language distribution
was observed throughout the data sets.
TABLE 10: LANGUAGE DISTRIBUTION
Language 2005 2006 2007
English 92.66% 91.64% 92.90%
Spanish 5.74% 6.24% 5.31%
Chinese 1.60% 2.12% 1.79%
Total 100.00% 100.00% 100.00%

19
TABLE 11 shows a comparison of the composition of race distributions for the
samples of 2005, 2006, and 2007. Since race was not coded for the majority of the 2005
data sample, comparison between 2005 and 2006/2007 would not be accurate. However,
race appears to be consistently distributed between data sets of 2006 and 2007. Most of
the observations for 2005 appear not coded for race (62.28%); therefore, skewed results
were expected concerning this variable.
TABLE 11: RACE DISTRIBUTION
Race 2005 2006 2007
White/Caucasian 27.28% 78.03% 79.35%
Black/African-American 5.07% 8.21% 8.65%
Asian 0.74% 3.65% 3.16%
Pacific Islander/Native Hawaiian 0.18% 0.68% 0.80%
Native American/Native Alaskan 0.63% 2.03% 2.12%
Other 3.82% 7.40% 5.92%
Not Coded 62.28% 0.00% 0.00%
Total 100.00% 100.00% 100.00%
In addition, the initial data analysis revealed the data to be negatively skewed,
meaning patients were more likely to rate a hospital, nurse, doctor, etc. favorably, rather
than unfavorably. This finding presented challenges, since most regressions and other
statistical methods assume data to be normally distributed. Some examples of the
negative skew in the data are illustrated in figures below:
Figure 1 shows the Data Distribution of Hospital Ratings (where 1 is worst
hospital possible and 10 is best hospital possible) for years 2005, 2006, and 2007.

20
Figure 1: Distribution of Hospital Ratings
2005 (top left), 2006 (top right) and 2007 (bottom left).

21
Incompatibilities between surveys
Several incompatibilities were found between the 2005 HCAHPS survey and the
subsequent 2006 and 2007 surveys. For instance, hospital service (obstetric, medical, or
surgical) was absent from the 2005 data and could not be included in our models. In
addition, mental health status and major diagnostic categories were not available for any
of the data and were excluded from analysis.
It should also be noted that in O’Malley (2005), nurse, doctor, and hospital were
each rated on a single ten-point scale. In the 2005-2007 data, nurse and doctor ratings
were obtained from three questions, given a four-point scale. The 2006 and 2007
nurse/doctor questions on the HCAHPS are as follows: 1) During this hospital stay, how
often did nurses/doctors treat you with courtesy and respect?; 2) During this hospital stay,
how often did nurses/doctors listen carefully to you?; 3) During this hospital stay, how
often did nurses/doctors explain things in a way you could understand? Possible ratings
were Never, Sometimes, Usually, and Always.

22
VI. METHODS
Factor Analysis
Factor analysis (FA) is one of several methods that can be used for data reduction.
Beginning with a set of measures on a number of observed variables, a smaller set of
artificial variables (factors) accounting for a fraction of the variability in the observed
variables is developed. The underlying rationale is that observed variables correlating
with a factor are measuring the same construct (Jobson 1992) (Patefield 1991) (Hope
1968).
A Cronbach’s α was reported for each factor or subgroup of items being
considered. The Cronbach’s α is a measure of association studied to assess the
consistency (reliability) of the responses within each factor. The absolute value of the
coefficient ranges from 0 to 1. The closer the value of the Cronbach’s α is to one, the
more consistent the responses associated with the factor. Literature in the social sciences
usually reports an α of 0.70 or higher to be adequate (Nunnally 1978).
General Linear Regression and ANOVA
Linear regressions were completed to determine which independent variables
affected the dependent variable of Hospital Rating. Regressions were completed with
individual independent variables to determine which were significant in relation to the

23
dependent variable, and multiple regressions were completed to develop three separate
models for analysis. Model 1 is a linear model that included variables found to be
significant in the original case-mix study (O’Malley 2005) and did not contribute to
multicollinearity. Model 2 was identical to Model 1, with the addition of a Pain Control
variable, which was not included in the original case-mix study. Model 3 consisted of
Model 2, plus the Teach indicator variable, which is the focus of this investigation.
An ANOVA was completed for each dataset to determine if changes in hospital
ratings could be attributed to three different teaching hospital conditions: Major
Teaching Hospital, Minor Teaching Hospital, or Non-teaching Hospital. Both Tukey and
Bonferroni confidence interval tests were employed in the event that one correction
method revealed different results than the other.
Nonparametric Analysis
A nonparametric measure of Kruskal-Wallis was utilized since it does not assume
normally distributed data. The Kruskal-Wallis test is a one-way analysis of variance by
ranks. It determines if the different subgroups in the sample have the same median or
not. The assumptions in this technique are less restrictive than linear models and may
provide additional information about the data that could not be realized utilizing
parametric methods.

24
Quantile Analysis
Finally, since the distribution of the response variable, satisfaction rating, shows a
skewed distribution, a quantile regression analysis for Model 3 of each dataset was
performed at the 50th
, 25th
, and 75th
quantile to estimate the conditional median (25th
and
75th
percentiles too), rather than mean. Quantile regression was utilized to employ a
different measure of central tendency (median) and statistical dispersion to obtain a more
comprehensive analysis of the relationship between the variables, given the negative
skewed pattern of the data. This technique was also selected because it makes no
distributional assumptions about the error term in the model, which is expected to be non-
Gaussian.

25
VI. RESULTS
Factor Analysis
A factor analysis was performed on the responses to items related to care received
from nurses and care received from doctors. The purpose of the factor analysis was to
confirm if these items, as a group, reflect the respondents’ perception about the care
received and the consistency of the responses to these perceptions.
Items 1 through 4 in the survey referred to care received from nurses. Items 5
through 7 referred to care received from doctors (see Appendix A). A correlation
analysis revealed some evidence that the responses for items referring to care received
from nurses were positively correlated. Likewise, there was some evidence of responses
corresponding to care received from doctors being positively correlated. However, there
seemed to be little evidence of a correlation between responses to care received from
nurses and responses to care received from doctors.
TABLE 12: CORRELATION COEFFICIENTS
(KENDALL TAU)
Q01 Q02 Q03 Q04 Q05 Q06 Q07
Q01 1.0000 0.6405 0.5252 0.4657 0.3099 0.3035 0.2812
Q02 0.6405 1.0000 0.5763 0.5049 0.3120 0.3802 0.3432
Q03 0.5252 0.5763 1.0000 0.4250 0.3150 0.3792 0.4403
Q04 0.4657 0.5049 0.4250 1.0000 0.2382 0.2785 0.2697
Q05 0.3099 0.3120 0.3150 0.2382 1.0000 0.6756 0.5599
Q06 0.3035 0.3802 0.3792 0.2785 0.6756 1.0000 0.6567
Q07 0.2812 0.3432 0.4403 0.2697 0.5599 0.6567 1.0000

26
Figure 2: Scree Plot for 2005 Survey
A scree plot suggests that three or four components explain most of the variability in the
responses (see Figure 2). A factor analysis with three components (varimax rotation) was
then evaluated.
TABLE 13: FACTOR LOADINGS
(VARIMAX ROTATION)
Factor1 Factor2 Factor3
Q01 0.751 0.165
Q02 0.808 0.134 0.149
Q03 0.638 0.12 0.302
Q04 0.584 0.102 0.13
Q05 0.181 0.941 0.276
Q06 0.267 0.516 0.509
Q07 0.219 0.296 0.863
Three factors explained 66% of the variability in responses. A hypothesis test
revealed that three factors were not sufficient to explain the variability in the data.
However, there is some evidence supporting the findings from the correlation analysis
(see Tables 12 and 13). Table 13 shows that items 1, 2, 3 and 4 load in the first

27
component (Cronbach alpha = 0.80). The Cronbach alpha constitutes evidence of
consistency in the responses for care received from nurses. Items 5 and 6 load on the
second component (Cronbach alpha = 0.79) and item 7 loads on a third component; these
were the responses for care received from doctors. The items with nurses correlate well
to the first component. A large percentage of the variation in performance is explained
by the nurses’ performance, implying that the survey performance is consistent. Doctor
performance is loaded over two components, in which listening is relevant to both.
General Linear Regression Model and ANOVA
O’Malley (2005) found that hospital service, age, race, education, general health
status, circulatory disorder, and language are important case-mix variables and consistent
with overall ratings of nurse, doctor, and hospital. The available variables from the 2005
data were included in the initial analysis presented in the manuscript. Age and
educational level were excluded from the initial model as being too closely correlated to
hospital ratings to yield additional information to the investigation. The first model (1) to
analyze is one in which hospital rating is expressed as a function of the following
explanatory variables: Nurse Courtesy, Nurse Listening, Nurse Explaining, Doctor
Courtesy, Doctor Listening, Doctor Explaining, Overall Health, Race, and Language of
the patient.
Nurse Courtesy refers to the question “During this hospital stay, how often did
nurses treat you with courtesy and respect?”. Nurse Listening refers to the question
“During this hospital stay, how often did nurses listen carefully to you?”. Nurse
Explaining refers to the question “During this hospital stay, how often did nurses explain

28
things in a way you could understand?”. Doctor Courtesy, Doctor Listening, and Doctor
Explaining were posed as identical questions to the nurse questions with doctor
substituted for nurse. All of the aforementioned questions were rated as Never,
Sometimes, Usually, or Always. Overall Health refers to the question, “In general, how
would you rate your overall health?”. Possible responses were Excellent, Very good,
Good, Fair, or Poor. Race was coded by self-report as White, Black (or African
American), Asian, Pacific Islander (including Native Hawaiian), or Native American
(including Alaska Native). Finally, Language refers to self-reported primary language of
the home, including English, Spanish, Chinese, Russian, Vietnamese, or Other. For all
models, English was the base case against which other languages were compared.
For model 2, the rating of pain management was included, as it was determined to
be an important variable in the patient’s overall hospital rating (Maxfield 2012).
O’Malley (2005) did not address the pain variable in the original case mix study. This
analysis found that if pain was not well managed, overall patient satisfaction ratings were
decreased. The inclusion of pain management in this analysis is justified based on an
increased Adjusted R2 when the pain variable was included.
There are three items that encompass characteristics of doctors and nurses that
relate to the hospital quality rating, including dimensions of courtesy/respect, listening,
and explaining. The reduced model (model 1: TABLE 14) for 2005 is based on
O’Malley (2005) models: Nurse Courtesy, Nurse Listening, Nurse Explaining, Doctor
Courtesy, Doctor Listening, Doctor Explaining, Overall Health, Race, and Language.

29
TABLE 14: 2005 MODEL 1 RESULTS
Variable Estimate Std. Error t value Pr(>|t|)
(Intercept) 0.95981 0.10201 9.409 < 2e-16 ***
Nurse Courtesy Sometimes -0.0674 0.08639 -0.780 0.435591
Nurse Courtesy Usually 0.83919 0.08614 9.742 < 2e-16 ***
Nurse Courtesy Always 1.54854 0.08579 18.051 < 2e-16 ***
Nurse Listening Sometimes 0.93876 0.06407 14.651 < 2e-16 ***
Nurse Listening Usually 1.73765 0.06548 26.537 < 2e-16 ***
Nurse Listening Always 2.32065 0.06558 35.386 < 2e-16 ***
Nurse Explaining Sometimes 0.58854 0.04681 12.572 < 2e-16 ***
Nurse Explaining Usually 1.05538 0.04675 22.577 < 2e-16 ***
Nurse Explaining Always 1.42065 0.04669 30.428 < 2e-16 ***
Doctor Courtesy Sometimes 0.20539 0.07782 2.639 0.008311 **
Doctor Courtesy Usually 0.44570 0.07826 5.695 1.24e-08 ***
Doctor Courtesy Always 0.67388 0.07791 8.649 < 2e-16 ***
Doctor Listening Sometimes 0.54617 0.06428 8.497 < 2e-16 ***
Doctor Listening Usually 0.79793 0.06620 12.053 < 2e-16 ***
Doctor Listening Always 1.02427 0.06639 15.428 < 2e-16 ***
Doctor Explaining Sometimes 0.19996 0.05455 3.665 0.000247 ***
Doctor Explaining Usually 0.32738 0.05477 5.977 2.28e-09 ***
Doctor Explaining Always 0.48941 0.05467 8.952 < 2e-16 ***
Overall Health Fair 0.03764 0.01989 1.892 0.058485
Overall Health Good 0.03019 0.01890 1.597 0.110170
Overall Health Very Good 0.02214 0.01925 1.150 0.250187
Overall Health Excellent 0.13396 0.02080 6.440 1.21e-10 ***
Race White 0.79339 0.01006 78.898 < 2e-16 ***
Race Black 0.87677 0.01722 50.915 < 2e-16 ***
Race Asian 0.55775 0.04571 12.201 < 2e-16 ***
Race Pacific Islander 0.44309 0.08663 5.115 3.15e-07 ***
Race Native American 0.44565 0.04455 10.002 < 2e-16 ***
Language Spanish 0.92905 0.02044 45.459 < 2e-16 ***
Language Chinese 0.22821 0.04046 5.640 1.70e-08 ***
Signif. codes: 0 ‘***’ 0.001 ‘**’ 0.01 ‘*’ 0.05 ‘.’ 0.1 ‘ ’ 1
Residual standard error: 1.303 on 76990 degrees of freedom
(74276 observations deleted due to missingness)
Multiple R-squared: 0.4676, Adjusted R-squared: 0.4674
F-statistic: 2332 on 29 and 76990 DF, p-value: < 2.2e-16
30
In general, the evidence in 2005 Model 1 supports O’Malley’s (2005) findings of
race, overall health status (when the rating was Excellent), and speaking Spanish at home
as important case-mix variables. Nurse and doctor ratings also appear relevant, with the
exception of the nurse question about treating the patient with courtesy and respect, when
the rating was Sometimes. There was no statistically significant difference between a
patient indicating that they had Never been treated with courtesy and respect and when
they had Sometimes been treated courteously by the nurse. However, overall nurse
ratings appear to be most relevant, based on the magnitude of the coefficients.
Model 2 includes all variables in Model 1 with the pain management question
added. Maxfield (2012) reported that the quality of pain management would be
associated with the overall quality rating provided by the patient . Pain Control refers to
the question “During this hospital stay, how often was your pain well controlled?”
Ratings included Never, Sometimes, Usually, or Always. In relation to pain management
and the mean ratings obtained, the results for model 2 show that the addition of the pain
variable increased the adjusted R2 from 0.4674 to 0.5018, indicating that the pain variable
contributes to the explanatory power of the model.

31
TABLE 15 - 2005 MODEL 2 RESULTS
Variable Estimate Std. Error t value Pr(>|t|)
(Intercept) 0.365024 0.118808 3.072 0.002125 **
Nurse Courtesy Sometimes -0.035667 0.097639 -0.365 0.714893
Nurse Courtesy Usually 0.869635 0.097903 8.883 < 2e-16 ***
Nurse Courtesy Always 1.531348 0.097623 15.686 < 2e-16 ***
Nurse Listening Sometimes 0.722839 0.072589 9.958 < 2e-16 ***
Nurse Listening Usually 1.491526 0.074614 19.990 < 2e-16 ***
Nurse Listening Always 2.025143 0.074808 27.071 < 2e-16 ***
Nurse Explaining Sometimes 0.582619 0.053776 10.834 < 2e-16 ***
Nurse Explaining Usually 1.019862 0.054030 18.876 < 2e-16 ***
Nurse Explaining Always 1.339335 0.053965 24.819 < 2e-16 ***
Doctor Courtesy Sometimes 0.227380 0.089807 2.532 0.011348 *
Doctor Courtesy Usually 0.358757 0.090815 3.950 7.81e-05 ***
Doctor Courtesy Always 0.557192 0.090467 6.159 7.37e-10 ***
Doctor Listening Sometimes 0.678212 0.074624 9.088 < 2e-16 ***
Doctor Listening Usually 0.935292 0.077205 12.114 < 2e-16 ***
Doctor Listening Always 1.134605 0.077446 14.650 < 2e-16 ***
Doctor Explaining Sometimes 0.108225 0.063179 1.713 0.086719
Doctor Explaining Usually 0.166509 0.063564 2.620 0.008807 **
Doctor Explaining Always 0.295708 0.063411 4.663 3.12e-06 ***
Overall Health Fair 0.001088 0.022981 0.047 0.962223
Overall Health Good -0.038279 0.021723 -1.762 0.078049
Overall Health Very Good -0.061340 0.021860 -2.806 0.005016 **
Overall Health Excellent 0.034523 0.023357 1.478 0.139402
Race White 0.783386 0.011675 67.098 < 2e-16 ***
Race Black 0.886887 0.019637 45.164 < 2e-16 ***
Race Asian 0.567349 0.050203 11.301 < 2e-16 ***
Race Pacific Islander 0.366811 0.095298 3.849 0.000119 ***
Race Native American 0.469516 0.048842 9.613 < 2e-16 ***
Language Spanish 0.937483 0.022360 41.926 < 2e-16 ***
Language Chinese 0.287772 0.045261 6.358 2.06e-10 ***
Pain Control Sometimes 0.644107 0.056818 11.336 < 2e-16 ***
Pain Control Usually 1.012912 0.055702 18.184 < 2e-16 ***
Pain Control Always 1.345891 0.055447 24.274 < 2e-16 ***
Signif. codes: 0 ‘***’ 0.001 ‘**’ 0.01 ‘*’ 0.05 ‘.’ 0.1 ‘ ’ 1
Residual standard error: 1.277 on 55653 degrees of freedom
(95610 observations deleted due to missingness)
Multiple R-squared: 0.5021, Adjusted R-squared: 0.5018
F-statistic: 1754 on 32 and 55653 DF, p-value: < 2.2e-16

32
Variables not found to be significant in the 2005 Model 2 included Nurse
Courtesy Sometimes as was observed in Model 1, but this model also found Doctor
Courtesy Sometimes and Doctor Explaining Sometimes to be insignificant (p<0.01).
Overall Health ratings of Fair, Good, and Excellent were not significant, but a rating of
Very Good was significant. In Model 1, only a rating of Excellent was significant. Then,
Model 3 was fitted to include the teaching variable, with the following codes: Major
Teaching hospital (Teach 1), Minor Teaching hospital (Teach 2), and Non-teaching
hospital (Teach 3).

33
TABLE 16 - 2005 MODEL 3 RESULTS
Variable Estimate Std. Error t value Pr(>[t])
(Intercept) 0.469700 0.119659 3.925 8.67e-05 ***
Minor Teaching -0.115590 0.017502 -6.604 4.03e-11 ***
Non-teaching -0.105607 0.015932 -6.629 3.42e-11 ***
Nurse Courtesy Sometimes -0.033538 0.097597 -0.344 0.731120
Nurse Courtesy Usually 0.872789 0.097861 8.919 < 2e-16 ***
Nurse Courtesy Always 1.534169 0.097581 15.722 < 2e-16 ***
Nurse Listening Sometimes 0.725424 0.072561 9.997 < 2e-16 ***
Nurse Listening Usually 1.493142 0.074584 20.020 < 2e-16 ***
Nurse Listening Always 2.027451 0.074780 27.112 < 2e-16 ***
Nurse Explaining Sometimes 0.581008 0.053753 10.809 < 2e-16 ***
Nurse Explaining Usually 1.016964 0.054011 18.829 < 2e-16 ***
Nurse Explaining Always 1.336744 0.053944 24.780 < 2e-16 ***
Doctor Courtesy Sometimes 0.223290 0.089770 2.487 0.012872 *
Doctor Courtesy Usually 0.352882 0.090780 3.887 0.000102 ***
Doctor Courtesy Always 0.553458 0.090429 6.120 9.40e-10 ***
Doctor Listening Sometimes 0.677138 0.074592 9.078 < 2e-16 ***
Doctor Listening Usually 0.935475 0.077171 12.122 < 2e-16 ***
Doctor Listening Always 1.136125 0.077412 14.676 < 2e-16 ***
Doctor Explaining
Sometimes
0.108462 0.063151 1.717 0.085894
Doctor Explaining Usually 0.165178 0.063536 2.600 0.009332 **
Doctor Explaining Always 0.295807 0.063384 4.667 3.06e-06 ***
Overall Health Fair -0.001691 0.022978 -0.074 0.941327
Overall Health Good -0.042525 0.021728 -1.957 0.050333
Overall Health Very Good -0.066623 0.021872 -3.046 0.002320 **
Race White 0.773197 0.011967 64.610 < 2e-16 ***
Race Black 0.866693 0.019858 43.645 < 2e-16 ***
Race Asian 0.561605 0.050207 11.186 < 2e-16 ***
Race Pacific Islander 0.372515 0.095260 3.911 9.22e-05 ***
Race Native American 0.470225 0.048838 9.628 < 2e-16 ***
Language Spanish 0.938264 0.022450 41.794 < 2e-16 ***
Language Chinese 0.285486 0.045249 6.309 2.82e-10 ***
Pain Control Sometimes 0.643342 0.056796 11.327 < 2e-16 ***
Pain Control Usually 1.011790 0.055679 18.172 < 2e-16 ***
Pain Control Always 1.345769 0.055425 24.281 < 2e-16 ***
---
Signif. codes: 0 ‘***’ 0.001 ‘**’ 0.01 ‘*’ 0.05 ‘.’ 0.1 ‘ ’ 1
Residual standard error: 1.276 on 55651 degrees of freedom
(95610 observations deleted due to missingness)
Multiple R-squared: 0.5026, Adjusted R-squared: 0.5023
F-statistic: 1654 on 34 and 55651 DF, p-value: < 2.2e-16

34
2005 Model 3 found insignificant variables identical to 2005 Model 2. Nurse
Courtesy Sometimes, Doctor Courtesy Sometimes, Doctor Explaining Sometimes, and
Overall Health Ratings of Fair, Good, and Excellent were all found not to be significant
(p<0.01) in this model. These findings indicate that adding the Variable Teach did not
change the interaction of the other variables in the regression or add to the predictive
value of the model. However, there are statistically significant differences between
Major and Minor Teaching hospitals, indicating that Minor Teaching hospitals were more
likely to correlate negatively to hospital ratings than Major Teaching Hospitals were. It
should also be noted that nursing performance across models was the variable most
highly correlated with hospital rating.
An ANOVA analysis indicated that there was a significant difference between
teaching hospitals and non-teaching hospitals in the 2005 data. Minor teaching hospital
and non-teaching hospital indicated a decrease in hospital ratings, relative to the
reference Major Teaching hospital. However, although the differences between
Teaching hospitals and non-teaching hospitals were statistically significant in the analysis
of variance, none of the changes appear to be practically significant in the linear
regression model.
0.000 0.000 3 -.112005 .227732 0.000 2 -.339737 Col Mean 1 2Row Mean- (Bonferroni) Comparison of Q21 by Teach
Bartlett's test for equal variances: chi2(2) = 12.7894 Prob>chi2 = 0.002
Total 276612.41 83615 3.30816732 Within groups 275387.023 83613 3.29359098Between groups 1225.3874 2 612.693699 186.03 0.0000 Source SS df MS F Prob > F Analysis of Variance

35
2006 Data regressions were then completed using Models 1, 2, and 3 to determine
if any differences could be determined between the datasets. As noted previously, Model
1 included Nurse Courtesy, Nurse Listening, Nurse Explaining, Doctor Courtesy, Doctor
Listening, and Doctor Explaining, Overall Health rating, Race, and Language. Model 2
included the previous variables listed with pain control added, and Model three included
all aforementioned variables in addition to teach. The results are outlined below:
TABLE 17 - 2006 MODEL 1 RESULTS
Variable
Estimate Std. Error t value Pr(>[t])
(Intercept) 0.44878 0.07349 6.107 1.02e-09 ***
Nurse Courtesy Sometimes 0.37258 0.06381 5.838 5.28e-09 ***
Nurse Courtesy Usually 1.60463 0.06480 24.764 < 2e-16 ***
Nurse Courtesy Always 2.35774 0.06496 36.296 < 2e-16 ***
Nurse Listening Sometimes 1.12943 0.04454 25.356 < 2e-16 ***
Nurse Listening Usually 2.15907 0.04652 46.411 < 2e-16 ***
Nurse Listening Always 2.71621 0.04701 57.780 < 2e-16 ***
Nurse Explaining Sometimes 0.66795 0.03411 19.583 < 2e-16 ***
Nurse Explaining Usually 1.17491 0.03471 33.852 < 2e-16 ***
Nurse Explaining Always 1.53979 0.03508 43.897 < 2e-16 ***
Doctor Courtesy Sometimes 0.52129 0.05768 9.038 < 2e-16 ***
Doctor Courtesy Usually 0.92047 0.05933 15.516 < 2e-16 ***
Doctor Courtesy Always 1.12980 0.05967 18.934 < 2e-16 ***
Doctor Listening Sometimes 0.34000 0.04689 7.251 4.15e-13 ***
Doctor Listening Usually 0.59949 0.04900 12.235 < 2e-16 ***
Doctor Listening Always 0.77791 0.04957 15.693 < 2e-16 ***
Doctor Explaining Sometimes 0.11763 0.03997 2.943 0.003250 **
Doctor Explaining Usually 0.20459 0.04082 5.012 5.40e-07 ***
Doctor Explaining Always 0.31689 0.04118 7.696 1.41e-14 ***
Overall Health Fair 0.05689 0.01571 3.622 0.000292 ***
Overall Health Good 0.03497 0.01506 2.323 0.020183 *
Overall Health Very Good 0.06216 0.01533 4.054 5.04e-05 ***
Overall Health Excellent 0.16451 0.01673 9.832 < 2e-16 ***
Race White -0.08315 0.02527 -3.290 0.001001 **
Race Black -0.05226 0.02672 -1.956 0.050506
Race Asian -0.01924 0.03177 -0.606 0.544743
Race Pacific Islander -0.09663 0.04793 -2.016 0.043795 *
Race Native American -0.00915 0.02698 -0.339 0.734485
Language Spanish 0.50135 0.02002 25.047 < 2e-16 ***
Language Chinese 0.03299 0.02916 1.131 0.258017

36
TABLE 17 - 2006 MODEL 1 RESULTS (CONTINUED)
Signif. codes: 0 ‘***’ 0.001 ‘**’ 0.01 ‘*’ 0.05 ‘.’ 0.1 ‘ ’ 1
Residual standard error: 1.41 on 153101 degrees of freedom
(37559 observations deleted due to missingness)
Multiple R-squared: 0.4816, Adjusted R-squared: 0.4815
F-statistic: 4905 on 29 and 153101 DF, p-value: < 2.2e-16
The evidence in 2006 Model 1 supports O’Malley’s (2005) findings of nurse
performance, doctor performance, and speaking Spanish at home as important case-mix
variables. However, in 2006 Model 1, indicating an Overall Health Rating of Good, and
Race of Black, Asian, Pacific Islander, and Native American descent were not found to
be significant. Speaking Chinese at home was also not found to be significant, as had
been noted in the previous study.

37
TABLE 18 - 2006 MODEL 2 RESULTS
Variable Estimate Std. Error t value Pr(>[t])
(Intercept) -0.263335 0.085515 -3.079 0.002075 **
Nurse Courtesy Sometimes 0.451570 0.072233 6.252 4.08e-10 ***
Nurse Courtesy Usually 1.638001 0.073628 22.247 < 2e-16 ***
Nurse Courtesy Always 2.322473 0.073893 31.430 < 2e-16 ***
Nurse Listening Sometimes 1.027985 0.050335 20.423 < 2e-16 ***
Nurse Listening Usually 1.975457 0.052900 37.343 < 2e-16 ***
Nurse Listening Always 2.484238 0.053525 46.413 < 2e-16 ***
Nurse Explaining Sometimes 0.651547 0.039312 16.574 < 2e-16 ***
Nurse Explaining Usually 1.131843 0.040200 28.155 < 2e-16 ***
Nurse Explaining Always 1.478435 0.040664 36.357 < 2e-16 ***
Doctor Courtesy Sometimes 0.432440 0.066998 6.455 1.09e-10 ***
Doctor Courtesy Usually 0.773937 0.069228 11.180 < 2e-16 ***
Doctor Courtesy Always 0.966286 0.069637 13.876 < 2e-16 ***
Doctor Listening Sometimes 0.337545 0.054824 6.157 7.45e-10 ***
Doctor Listening Usually 0.559553 0.057620 9.711 < 2e-16 ***
Doctor Listening Always 0.716025 0.058306 12.280 < 2e-16 ***
Doctor Explaining Sometimes 0.171752 0.047370 3.626 0.000288 ***
Doctor Explaining Usually 0.217371 0.048561 4.476 7.61e-06 ***
Doctor Explaining Always 0.288304 0.048969 5.887 3.93e-09 ***
Overall Health Fair 0.003619 0.018518 0.195 0.845076
Overall Health Good -0.063964 0.017690 -3.616 0.000299 ***
Overall Health Very Good -0.052685 0.017797 -2.960 0.003074 **
Overall Health Excellent 0.042532 0.019133 2.223 0.026216 *
Race White -0.085206 0.028196 -3.022 0.002512 **
Race Black -0.028887 0.029874 -0.967 0.333559
Race Asian 0.014348 0.035687 0.402 0.687647
Race Pacific Islander -0.076648 0.053827 -1.424 0.154453
Race Native American 0.020570 0.030375 0.677 0.498277
Language Spanish 0.507634 0.022962 22.108 < 2e-16 ***
Language Chinese 0.046190 0.033287 1.388 0.165247
Pain Control Sometimes 0.699201 0.040382 17.314 < 2e-16 ***
Pain Control Usually 1.159846 0.039558 29.320 < 2e-16 ***
Pain Control Always 1.483748 0.039610 37.459 < 2e-16 ***
--
Signif. codes: 0 ‘***’ 0.001 ‘**’ 0.01 ‘*’ 0.05 ‘.’ 0.1 ‘ ’ 1
Residual standard error: 1.374 on 106831 degrees of freedom
(83826 observations deleted due to missingness)
Multiple R-squared: 0.523, Adjusted R-squared: 0.5229
F-statistic: 3660 on 32 and 106831 DF, p-value: < 2.2e-16
Variables not found to be significant in the 2006 Model 2 included Overall Health
ratings of Fair and Excellent (p<0.01), which were not observed in 2006 Model 1. Race

38
of Black, Asian, Pacific Islander or Native American were again found to be
insignificant, and Chinese language continued to be insignificant in 2006 Model 2, as had
been observed in Model 1.
TABLE 19 - 2006 MODEL 3 RESULTS
Variable Estimate Std. Error t value Pr(>[t])
(Intercept) -0.149472 0.086637 -1.725 0.084483
Minor Teaching -0.114044 0.017480 -6.524 6.87e-11 ***
Non-teaching -0.114991 0.014305 -8.038 9.19e-16 ***
Nurse Courtesy Sometimes 0.451178 0.072213 6.248 4.18e-10 ***
Nurse Courtesy Usually 1.637108 0.073608 22.241 < 2e-16 ***
Nurse Courtesy Always 2.321567 0.073873 31.427 < 2e-16 ***
Nurse Listening Sometimes 1.027677 0.050321 20.422 < 2e-16 ***
Nurse Listening Usually 1.974452 0.052885 37.335 < 2e-16 ***
Nurse Listening Always 2.483839 0.053512 46.417 < 2e-16 ***
Nurse Explaining Sometimes 0.648941 0.039301 16.512 < 2e-16 ***
Nurse Explaining Usually 1.129145 0.040190 28.095 < 2e-16 ***
Nurse Explaining Always 1.475188 0.040654 36.287 < 2e-16 ***
Doctor Courtesy Sometimes 0.431468 0.066978 6.442 1.18e-10 ***
Doctor Courtesy Usually 0.773743 0.069207 11.180 < 2e-16 ***
Doctor Courtesy Always 0.965881 0.069616 13.874 < 2e-16 ***
Doctor Listening Sometimes 0.336057 0.054809 6.131 8.74e-10 ***
Doctor Listening Usually 0.558067 0.057605 9.688 < 2e-16 ***
Doctor Listening Always 0.714562 0.058289 12.259 < 2e-16 ***
Doctor Explaining Sometimes 0.172594 0.047356 3.645 0.000268 ***
Doctor Explaining Usually 0.217332 0.048547 4.477 7.59e-06 ***
Doctor Explaining Always 0.289692 0.048955 5.918 3.28e-09 ***
Overall Health Fair 0.002688 0.018513 0.145 0.884580
Overall Health Good -0.064928 0.017685 -3.671 0.000241 ***
Overall Health Very Good -0.053919 0.017795 -3.030 0.002446 **
Overall Health Excellent 0.041630 0.019130 2.176 0.029540 *
Race White -0.088936 0.028198 -3.154 0.001611 **
Race Black -0.039591 0.029910 -1.324 0.185612
Race Asian 0.010183 0.035682 0.285 0.775345
Race Pacific Islander -0.082662 0.053816 -1.536 0.124534
Race Native American 0.017842 0.030369 0.588 0.556856
Language Spanish 0.509201 0.022971 22.167 < 2e-16 ***
Language Chinese 0.045540 0.033281 1.368 0.171206
Pain Control Sometimes 0.699231 0.040371 17.320 < 2e-16 ***
Pain Control Usually 1.160405 0.039548 29.342 < 2e-16 ***
Pain Control Always 1.483974 0.039599 37.475 < 2e-16 ***

39
TABLE 19 - 2006 MODEL 3 RESULTS (CONTINUED)
---Signif. codes: 0 ‘***’ 0.001 ‘**’ 0.01 ‘*’ 0.05 ‘.’ 0.1 ‘ ’ 1
Residual standard error: 1.374 on 106829 degrees of freedom
(83826 observations deleted due to missingness)
Multiple R-squared: 0.5233, Adjusted R-squared: 0.5231
F-statistic: 3449 on 34 and 106829 DF, p-value: < 2.2e-16
2006 Model 3 found insignificant variables identical to 2006 Model 2. Overall
Health of Fair and Excellent, Black Race, Asian Race, Pacific Islander Race, Native
American Race, and Chinese Language were all found to lack significance in the model.
These findings indicate that adding the Variable Teach did not change the interaction of
the other variables in the regression or add to the predictive value of the model.
An ANOVA analysis indicated that there was a significant difference between
teaching hospitals and non-teaching hospitals in the 2006 data. Minor teaching hospitals
and non-teaching hospitals indicate a decrease in hospital ratings, relative to the reference
Major Teaching hospitals. However, none of the changes appear to be significant in the
linear regression model.
0.000 0.000 3 -.137795 .120814 0.000 2 -.258609 Col Mean 1 2Row Mean- (Bonferroni) Comparison of Q21_06 by FINAL_TEACHING
Bartlett's test for equal variances: chi2(2) = 171.9703 Prob>chi2 = 0.000
Total 749028.479 186675 4.01247344 Within groups 748287.452 186673 4.00854677Between groups 741.027034 2 370.513517 92.43 0.0000 Source SS df MS F Prob > F Analysis of Variance

40
2005-2006 Model Comparisons
Qualitative analysis between results of linear regression models for 2005 and
2006 revealed similarities and differences between the two datasets. For all models for
2006, Chinese as the primary language of the home was found to be insignificant
(p>0.01), but it was significant for all models in 2005. All findings for race were
significant in the 2005 data set, but Black, Asian, Pacific Islander, and Native American
were insignificant (p>0.01) for all models in the 2006 data. Self-report of Fair or Good
health was not found to be significant (p>0.01) for all models in the 2005 dataset, and
Excellent health was not significant in Models 2 and 3, while Very Good health was not
significant in Model 1. In the 2006 data set, Good health was not significant in Model 1,
and Fair and Excellent health were not significant in Models 2 and 3. A rating of nurse
treating the patient with courtesy and respect “Sometimes” was found not to be
significant in all three models of the 2005 dataset. Finally, doctor ratings of Sometimes
treating patients with courtesy/respect and explaining to patients was not significant for
Models 2 and 3 for the 2005 data set, but these ratings were significant for Model 1 in
2005 and all models in 2006.
Finally, 2007 Data regressions were completed using Models 1, 2, and 3 to
determine if any differences could be determined between the datasets. Identical to
procedures for datasets 2005 and 2006, Model 1 included Nurse Courtesy, Nurse
Listening, Nurse Explaining, Doctor Courtesy, Doctor Listening, and Doctor Explaining,
Overall Health rating, Race, and Language. Model 2 added the variable pain control, and
Model 3 added the teaching variable to the variables from Model 2. The results are
outlined below:

41
TABLE 20 - 2007 MODEL 1 RESULTS
Variable Estimate Std. Error t value Pr(>[t])
(Intercept) 0.65601 0.04969 13.201 < 2e-16 ***
Nurse Courtesy Sometimes 0.37095 0.04323 8.582 < 2e-16 ***
Nurse Courtesy Usually 1.50147 0.04396 34.159 < 2e-16 ***
Nurse Courtesy Always 2.27221 0.04404 51.596 < 2e-16 ***
Nurse Listening Sometimes 1.07218 0.03104 34.538 < 2e-16 ***
Nurse Listening Usually 2.06297 0.03249 63.497 < 2e-16 ***
Nurse Listening Always 2.66237 0.03280 81.172 < 2e-16 ***
Nurse Explaining Sometimes 0.55048 0.02372 23.208 < 2e-16 ***
Nurse Explaining Usually 1.11317 0.02424 45.925 < 2e-16 ***
Nurse Explaining Always 1.52807 0.02448 62.415 < 2e-16 ***
Doctor Courtesy Sometimes 0.31297 0.03905 8.014 1.11e-15 ***
Doctor Courtesy Usually 0.65866 0.04010 16.425 < 2e-16 ***
Doctor Courtesy Always 0.88283 0.04028 21.916 < 2e-16 ***
Doctor Listening Sometimes 0.32333 0.03216 10.053 < 2e-16 ***
Doctor Listening Usually 0.63892 0.03360 19.015 < 2e-16 ***
Doctor Listening Always 0.84228 0.03397 24.796 < 2e-16 ***
Doctor Explaining Sometimes 0.18969 0.02710 6.999 2.58e-12 ***
Doctor Explaining Usually 0.31720 0.02764 11.476 < 2e-16 ***
Doctor Explaining Always 0.45181 0.02786 16.217 < 2e-16 ***
Overall Health Fair 0.05800 0.01063 5.458 4.82e-08 ***
Overall Health Good 0.03973 0.01020 3.895 9.83e-05 ***
Overall Health Very Good 0.06814 0.01036 6.577 4.82e-11 ***
Overall Health Excellent 0.18657 0.01134 16.453 < 2e-16 ***
Race White -0.13256 0.01693 -7.829 4.91e-15 ***
Race Black -0.21751 0.01779 -12.228 < 2e-16 ***
Race Asian -0.13418 0.02129 -6.304 2.91e-10 ***
Race Pacific Islander -0.17404 0.02999 -5.803 6.53e-09 ***
Race Native American -0.13310 0.01844 -7.218 5.27e-13 ***
Language Spanish 0.50692 0.01423 35.623 < 2e-16 ***
Language Chinese 0.09072 0.02078 4.366 1.27e-05 ***
---Signif. codes: 0 ‘***’ 0.001 ‘**’ 0.01 ‘*’ 0.05 ‘.’ 0.1 ‘ ’ 1
Residual standard error: 1.667 on 455379 degrees of freedom
(91981 observations deleted due to missingness)
Multiple R-squared: 0.4047, Adjusted R-squared: 0.4046
F-statistic: 1.067e+04 on 29 and 455379 DF, p-value: < 2.2e-16
The 2007 Model 1 found all variables to be significant. Nurse Courtesy, Nurse
Listening, Nurse Explaining, Doctor Courtesy, Doctor Listening, Doctor Explaining,

42
Overall Health, Race, and Language were all significant for each rating within each
question.
TABLE 21 - 2007 MODEL 2 RESULTS
Variables Estimate Std. Error t value Pr(>[t])
(Intercept) 0.04540 0.05844 0.777 0.437249
Nurse Courtesy Sometimes 0.34622 0.04913 7.047 1.83e-12 ***
Nurse Courtesy Usually 1.40788 0.05020 28.046 < 2e-16 ***
Nurse Courtesy Always 2.11950 0.05036 42.089 < 2e-16 ***
Nurse Listening Sometimes 0.95532 0.03530 27.065 < 2e-16 ***
Nurse Listening Usually 1.87305 0.03720 50.356 < 2e-16 ***
Nurse Listening Always 2.39765 0.03762 63.736 < 2e-16 ***
Nurse Explaining Sometimes 0.50054 0.02734 18.311 < 2e-16 ***
Nurse Explaining Usually 1.04860 0.02809 37.330 < 2e-16 ***
Nurse Explaining Always 1.43323 0.02840 50.466 < 2e-16 ***
Doctor Courtesy Sometimes 0.28959 0.04517 6.411 1.45e-10 ***
Doctor Courtesy Usually 0.58780 0.04667 12.594 < 2e-16 ***
Doctor Courtesy Always 0.79195 0.04690 16.884 < 2e-16 ***
Doctor Listening Sometimes 0.36146 0.03761 9.612 < 2e-16 ***
Doctor Listening Usually 0.62179 0.03947 15.754 < 2e-16 ***
Doctor Listening Always 0.79269 0.03993 19.853 < 2e-16 ***
Doctor Explaining Sometimes 0.17695 0.03203 5.525 3.30e-08 ***
Doctor Explaining Usually 0.28155 0.03272 8.604 < 2e-16 ***
Doctor Explaining Always 0.37677 0.03299 11.422 < 2e-16 ***
Overall Health Fair 0.01786 0.01266 1.410 0.158477
Overall Health Good -0.03924 0.01209 -3.245 0.001175 **
Overall Health Very Good -0.02501 0.01214 -2.060 0.039357 *
Overall Health Excellent 0.08321 0.01308 6.361 2.01e-10 ***
Race White -0.12332 0.01922 -6.416 1.40e-10 ***
Race Black -0.18354 0.02024 -9.069 < 2e-16 ***
Race Asian -0.09306 0.02437 -3.819 0.000134 ***
Race Pacific Islander -0.13574 0.03429 -3.959 7.53e-05 ***
Race Native American -0.09578 0.02087 -4.590 4.43e-06 ***
Language Spanish 0.50693 0.01667 30.409 < 2e-16 ***
Language Chinese 0.12739 0.02391 5.327 9.98e-08 ***
Pain Control Sometimes 0.66944 0.02744 24.393 < 2e-16 ***
Pain Control Usually 1.14532 0.02688 42.611 < 2e-16 ***
Pain Control Always 1.49418 0.02691 55.520 < 2e-16 ***
---Signif. codes: 0 ‘***’ 0.001 ‘**’ 0.01 ‘*’ 0.05 ‘.’ 0.1 ‘ ’ 1
Residual standard error: 1.638 on 321325 degrees of freedom
(226032 observations deleted due to missingness)
Multiple R-squared: 0.4402, Adjusted R-squared: 0.4402
F-statistic: 7897 on 32 and 321325 DF, p-value: < 2.2e-16

43
While 2007 Model 1 found all variables to be significant, Model 2 indicated that
Overall Health Ratings of Fair and Very Good were not significant (p<0.01). Adding the
pain control variable appears to have influenced how health ratings can be utilized to
determine overall hospital ratings by patients.
TABLE 22 - 2007 MODEL 3 RESULTS
Variable Estimate Std. Error t value Pr(>[t])
(Intercept) -0.34204 0.05902 -5.795 6.83e-09 ***
Minor Teaching 0.46183 0.01163 39.701 < 2e-16 ***
Non-teaching 0.40627 0.01015 40.019 < 2e-16 ***
Nurse Courtesy Sometimes 0.34090 0.04899 6.958 3.45e-12 ***
Nurse Courtesy Usually 1.39732 0.05006 27.912 < 2e-16 ***
Nurse Courtesy Always 2.10950 0.05022 42.006 < 2e-16 ***
Nurse Listening Sometimes 0.96096 0.03520 27.301 < 2e-16 ***
Nurse Listening Usually 1.88040 0.03709 50.693 < 2e-16 ***
Nurse Listening Always 2.40526 0.03751 64.115 < 2e-16 ***
Nurse Explaining Sometimes 0.50095 0.02726 18.377 < 2e-16 ***
Nurse Explaining Usually 1.05057 0.02801 37.504 < 2e-16 ***
Nurse Explaining Always 1.43562 0.02832 50.691 < 2e-16 ***
Doctor Courtesy Sometimes 0.29424 0.04504 6.532 6.49e-11 ***
Doctor Courtesy Usually 0.59251 0.04655 12.730 < 2e-16 ***
Doctor Courtesy Always 0.79714 0.04678 17.042 < 2e-16 ***
Doctor Listening Sometimes 0.35637 0.03750 9.503 < 2e-16 ***
Doctor Listening Usually 0.61431 0.03936 15.607 < 2e-16 ***
Doctor Listening Always 0.78390 0.03982 19.688 < 2e-16 ***
Doctor Explaining Sometimes 0.18800 0.03194 5.886 3.96e-09 ***
Doctor Explaining Usually 0.29316 0.03263 8.984 < 2e-16 ***
Doctor Explaining Always 0.38440 0.03290 11.685 < 2e-16 ***
Overall Health Fair 0.02244 0.01263 1.777 0.075649
Overall Health Good -0.03380 0.01206 -2.802 0.005079 **
Overall Health Very Good -0.02121 0.01211 -1.752 0.079796
Overall Health Excellent 0.08755 0.01305 6.709 1.96e-11 ***
Race White -0.12249 0.01917 -6.390 1.66e-10 ***
Race Black -0.14899 0.02020 -7.376 1.63e-13 ***
Race Asian -0.08883 0.02431 -3.655 0.000257 ***
Race Pacific Islander -0.13131 0.03420 -3.840 0.000123 ***
Race Native American -0.08693 0.02081 - 4.177 2.95e-05 ***
Language Spanish 0.51940 0.01663 31.233 < 2e-16 ***
Language Chinese 0.13936 0.02385 5.843 5.13e-09 ***
Pain Control Sometimes 0.66660 0.02737 24.357 < 2e-16 ***
Pain Control Usually 1.13946 0.02680 42.510 < 2e-16 ***
Pain Control Always 1.48735 0.02684 55.419 < 2e-16 ***

44
TABLE 22 - 2007 MODEL 3 RESULTS (CONTINUED)
---Signif. codes: 0 ‘***’ 0.001 ‘**’ 0.01 ‘*’ 0.05 ‘.’ 0.1 ‘ ’ 1
Residual standard error: 1.634 on 321323 degrees of freedom
(226032 observations deleted due to missingness)
Multiple R-squared: 0.4433, Adjusted R-squared: 0.4433
F-statistic: 7526 on 34 and 321323 DF, p-value: < 2.2e-16
2007 Model 3 found insignificant variables identical to 2007 Model 2. Overall
Health of Fair and Very Good were found to lack significance in the model. These
findings indicate that adding the Variable Teach did not change the interaction of the
other variables in the regression or add to the predictive value of the model.
An ANOVA analysis indicated that there was a significant difference between
teaching hospitals and non-teaching hospitals in the 2007 data. Minor teaching hospital
and non-teaching hospital factors indicate an increase in hospital ratings, relative to the
reference Major Teaching hospital. However, none of the changes appear to be
significant in the linear regression model.
0.000 0.005 3 .501527 -.024834 0.000 2 .52636 Col Mean 1 2Row Mean- (Bonferroni) Comparison of Q21_07 by FINAL_TEACHING
Bartlett's test for equal variances: chi2(2) = 1.2e+04 Prob>chi2 = 0.000
Total 2619238.9 533807 4.90671517 Within groups 2607157.08 533805 4.88410015Between groups 12081.822 2 6040.911 1236.85 0.0000 Source SS df MS F Prob > F Analysis of Variance

45
2005, 2006 and 2007 Model Comparisons
Qualitative analysis between results of linear regression models for 2005, 2006,
and 2007 revealed that most of the differences were between the 2006 and the other two
datasets. For example, Chinese language was a significant predictor for all models in
2005 and 2007, but not for 2006, even though the proportion of Chinese respondents is
greater for 2006 than for other years. All findings for race were significant in the 2005
and 2007 data sets, but Black, Asian, Pacific Islander, and Native American were
insignificant (p>0.01) for all models in the 2006 data. Self-report of Fair or Good
health (item 23) was not found to be significantly (p>0.01) different from respondents
reporting Poor health for all models in the 2005 dataset, and Excellent health was not
significant in Models 2 and 3, while Very Good health was not significantly different
from those responding having poor health in Model 1. In the 2006 data set, Good health
was not significant in Model 1. Fair and Excellent health ratings were not significantly
different from poor health in Models 2 and 3. In the 2007 dataset, Fair and Very Good
health ratings were not significantly different from those responding poor health in
Models 2 and 3, but all health ratings were otherwise significantly different. A rating of
nurse treating the patient with courtesy and respect Sometimes was found not to be
significantly different from those responding Never in all three models of the 2005 and
2007 datasets. Finally, doctor ratings of Sometimes treating patients with
courtesy/respect and explaining to patients was not significantly different from those
reporting Never for Models 2 and 3 for the 2005 data set, but these ratings were
significantly different from those reporting Never for Model 1 in 2005 and all models in

46
2006 and 2007. The following are result tables for Models 1, 2 and 3 for 2005, 2006, and
2007 datasets:
TABLE 23- MODEL GOODNESS OF FIT RESULTS FOR 2005
2005 Data R² Adjusted R² Standard Error Degrees of Freedom
Model 1 0.4676 0.4674 1.303 76990
Model 2 0.5021 0.5018 1.277 55653
Model 3 0.5026 0.5023 1.276 55651
TABLE 24 – MODEL GOODNESS OF FIT RESULTS FOR 2006
2006 Data R² Adjusted R² Standard Error Degrees of Freedom
Model 1 0.4816 0.4815 1.41 153101
Model 2 0.523 0.5229 1.374 106831
Model 3 0.5233 0.5231 1.374 106829
TABLE 25: MODEL GOODNESS OF FIT RESULTS FOR 2007
2007 Data R² Adjusted R² Standard Error Degrees of Freedom
Model 1 0.4047 0.4046 1.667 455379
Model 2 0.4402 0.4402 1.638 321325
Model 3 0.4433 0.4433 1.634 321323

47
The above tables demonstrate evidence of an improvement in model fit with the addition
of the pain variable in Model 2 and the Teach variable in Model 3 for each year of data
examined.
NONPARAMETRIC ANALYSES
Analysis of 2005 Dataset
TABLE 26: ROBUST MEASURES OF
CENTER AND DISPERSION, 2005
Figure 3: Comparison of Ratings for 2005
Figure 3 and Table 26 show that the typical rating for minor teaching hospitals is
Teaching
Rating Major Minor None
Mode 10 9 10Median 9 9 9
IQR 2 2 2

48
slightly lower than the typical rating for the major teaching and non-teaching hospitals.
A non-parametric analysis of variance (Kruskal-Wallis) show statistical evidence of a
difference among the median ratings for each type of hospital (p-value=0.0001), in 2005.
Table 26 and Figure 3 show that there is no pronounced difference in the shape of
the distribution of ratings; the three distributions are negatively skewed. This supports
the idea that the finding from the Kruskal-Wallis test for equality in median ratings is due
to a difference in the median ratings and not due to a difference in the shape of the
distributions.
Analysis of 2006 Dataset
TABLE 27: ROBUST MEASURES OF
CENTER AND DISPERSION, 2006
probability = 0.0001chi-squared with ties = 713.320 with 2 d.f.
probability = 0.0001chi-squared = 674.730 with 2 d.f.
3 46399 1.99e+09 2 24837 9.59e+08 1 12380 5.51e+08 teach Obs Rank Sum
Kruskal-Wallis equality-of-populations rank test
Teaching
Rating Major Minor None
Mode 10 10 10
Median 9 9 9
IQR 2 2 2

49
Figure 4: Comparison of Ratings for 2006
A non-parametric analysis of variance (Kruskal-Wallis) shows statistical evidence
of a difference among the median ratings for each type of hospital (p-value=0.0001), in
2006. There is no pronounced difference in the shape of the distribution of ratings; the
three distributions are negatively skewed. This supports the idea that the finding from the
probability = 0.0001chi-squared with ties = 215.070 with 2 d.f.
probability = 0.0001chi-squared = 199.563 with 2 d.f.
3 140991 1.32e+10 2 27807 2.51e+09 1 17878 1.74e+09 final_~g Obs Rank Sum
Kruskal-Wallis equality-of-populations rank test

50
Kruskal-Wallis was due to a difference in the median ratings and not due to a difference
in the shape of the distributions.
Analysis of the 2007 Dataset
Figure 5: Comparison of Ratings for 2007
TABLE 28: ROBUST MEASURES OF
CENTER AND DISPERSION, 2007
2007 Teaching
Rating Major Minor None
Mode 10 10 10
Median 9 9 9
IQR 3 2 2

51
A non-parametric analysis of variance (Kruskal-Wallis) showed statistical
evidence of a difference among the median ratings for each type of hospital (p-
value=0.0001), in 2007. There was no pronounced difference in the shape of the
distribution of ratings; the three distributions were negatively skewed. This supports the
idea that the finding from the Kruskal-Wallis was due to a difference in the median
ratings and not due to a difference in the shape of the distributions.
These findings indicate that there was a significant difference between the median
scores for Major Teaching hospitals, Minor Teaching hospitals, and Non-teaching
hospitals for all three datasets. The next section shows a nonparametric analysis, which
incorporated the covariates used in the previous regression analyses. Most of these
covariates were the same ones that O’Malley (2005) study used to condition the quality
rating responses.
Quantile Regression
Quantile regressions at the 25th
, 50th
, and 75th
quantile were completed for Models
1, 2, and 3 for all datasets to attempt to condition the analysis due to the fact that the
responses to the quality rating item appeared to be negatively skewed throughout all
probability = 0.0001chi-squared with ties = 148.029 with 2 d.f.
probability = 0.0001chi-squared = 136.584 with 2 d.f.
3 381436 1.02e+11 2 100457 2.67e+10 1 51915 1.35e+10 final_~g Obs Rank Sum
Kruskal-Wallis equality-of-populations rank test

52
samples. The teaching variable was not found to be a factor related to quality responses
in any of the OLS (ordinary least squares) linear regression models, but since the quality
ratings were not normally distributed, the findings may be misleading.
Utilizing quantile regression at the 25thth
, 50thth
, and 75th
quantile for Models 1,
2, and 3 for 2005, 2006, and 2007 datasets revealed that analyzing the data at different
quantiles did not affect the results of the linear regression in a manner that revealed the
teaching variable to be associated with hospital satisfaction ratings. Tables 29, 31, and
33 summarize the coefficients for the years of 2005, 2006, and 2007.

53
TABLE 29: QUANTILE SUMMARY FOR 2005
2005 Comparison Coefficients
Covariate 25th quantile 50th quantile 75th quantile
Constant -2.5000 -0.2500 4.0000
Pain Control Sometimes 0.6000 0.6250 0.7500
Pain Control Usually 1.1000 0.8750 1.0000
Pain Control Always 1.5000 1.5000 1.0000
Minor Teaching 0.0000 0.0000 0.0000
Non-teaching 0.0000 0.0000 0.0000
Nurse Courtesy Sometimes 0.2000 0.2500 -1.2500
Nurse Courtesy Usually 1.4000 1.2500 -0.5000
Nurse Courtesy Always 2.1000 1.8750 0.0000
Nurse Listening Sometimes 0.9000 1.0000 0.7500
Nurse Listening Usually 2.0000 1.7500 1.2500
Nurse Listening Always 2.6000 2.3750 1.7500
Nurse Explaining Sometimes 0.7000 0.7500 0.5000
Nurse Explaining Usually 1.3000 1.1250 0.7500
Nurse Explaining Always 1.7000 1.5000 1.0000
Doctor Courtesy Sometimes 0.5000 0.1250 0.0000
Doctor Courtesy Usually 0.7000 0.3750 0.0000
Doctor Courtesy Always 1.0000 0.5000 0.2500
Doctor Listening Sometimes 0.8000 0.6250 0.5000
Doctor Listening Usually 1.0000 0.8750 0.7500
Doctor Listening Always 1.2000 1.1250 1.0000
Doctor Explaining Sometimes 0.1000 0.1250 0.0000
Doctor Explaining Usually 0.3000 0.1250 0.0000
Doctor Explaining Always 0.4000 0.3750 0.0000
Overall Health Fair 0.0000 0.0000 0.0000
Overall Health Good 0.0000 0.0000 0.0000
Overall Health Very Good 0.0000 0.0000 0.0000
Overall Health Excellent 0.0000 0.0000 0.0000
Race White 1.0000 0.8750 1.0000
Race Black 1.0000 1.0000 1.0000
Race Asian 0.7000 0.5000 1.0000
Race Pacific Islander 0.4000 0.1250 1.0000
Race Native American 0.4000 0.1250 1.0000
Language Spanish 1.0000 1.0000 1.0000
Language Chinese 0.3000 0.1250 0.0000

54
The base case for all three data sets is a patient at a major teaching hospital who
never had pain control, never had nurse or doctor courtesy, listening, or explaining, rated
their overall health as poor, and spoke English. The 2005 findings indicate that the 50th
quantile (median) falls below the linear regression (overall mean) for the base case, with
significant variation noted at the 25th
and 75th
quantiles. Figure 6 below illustrates the
variation observed with quantile regression.
Figure 6: 2005 Base Case Quantile Comparison Chart
Analysis of the quantile regressions indicate that the variable Pain Control
Sometimes changes minimally across the quantiles (and in the linear regression), but Pain
Control Usually decreases at the 50th
quantile, and Pain Control Always decreases
significantly at the 75th
quantile. Therefore, the influence of pain control diminishes
towards the 75th
quantile. The lower 25th
and 50th
quantiles of the respondents (low
raters) are associated with Pain Control Always in a more significant and important way.
25th quantile 50th quantile 75th quantile
Constant -2.5000 -0.2500 4.0000
-3.0000
-2.0000
-1.0000
0.0000
1.0000
2.0000
3.0000
4.0000
5.0000
Constant
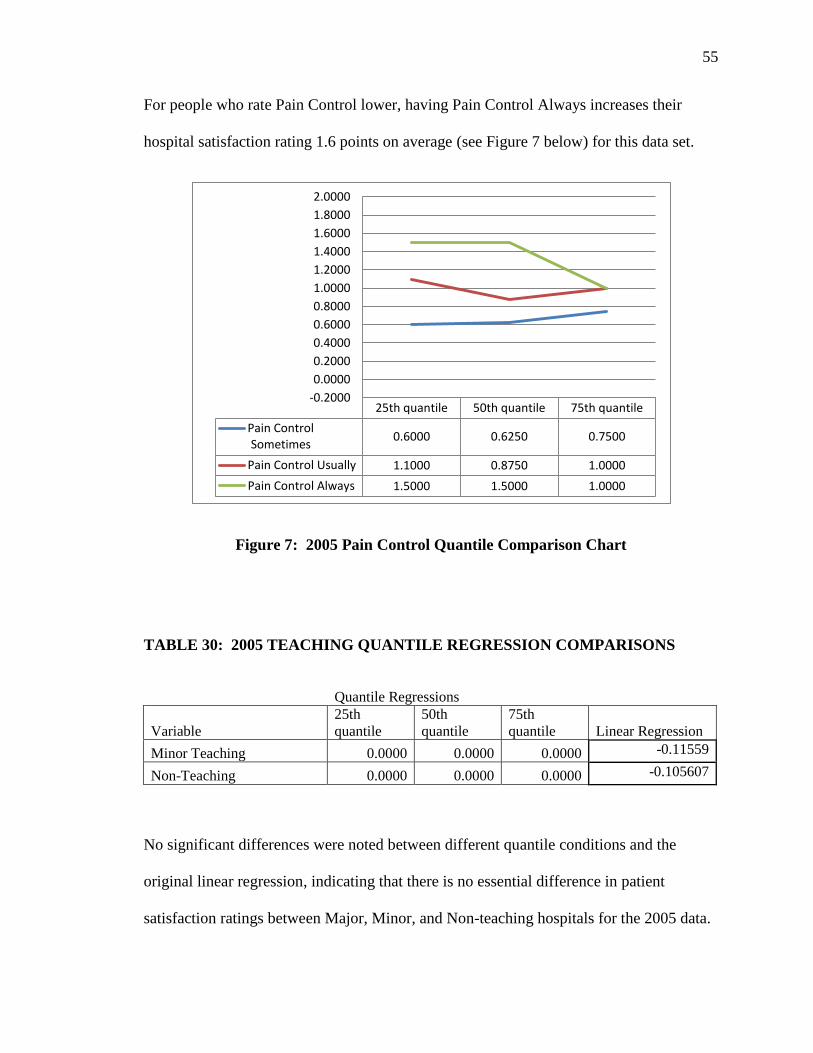
55
For people who rate Pain Control lower, having Pain Control Always increases their
hospital satisfaction rating 1.6 points on average (see Figure 7 below) for this data set.
Figure 7: 2005 Pain Control Quantile Comparison Chart
TABLE 30: 2005 TEACHING QUANTILE REGRESSION COMPARISONS
Quantile Regressions
Variable
25th
quantile
50th
quantile
75th
quantile Linear Regression
Minor Teaching 0.0000 0.0000 0.0000 -0.11559
Non-Teaching 0.0000 0.0000 0.0000 -0.105607
No significant differences were noted between different quantile conditions and the
original linear regression, indicating that there is no essential difference in patient
satisfaction ratings between Major, Minor, and Non-teaching hospitals for the 2005 data.
25th quantile 50th quantile 75th quantile
Pain Control Sometimes
0.6000 0.6250 0.7500
Pain Control Usually 1.1000 0.8750 1.0000
Pain Control Always 1.5000 1.5000 1.0000
-0.2000
0.0000
0.2000
0.4000
0.6000
0.8000
1.0000
1.2000
1.4000
1.6000
1.8000
2.0000

56
TABLE 31: QUANTILE SUMMARY FOR 2006
2006 Comparison Coefficients
Covariate 25th quantile 50th quantile 75th quantile
Constant -0.8750 0.7143 2.5000
Minor Teaching 0.0000 0.0000 0.0000
Non-Teaching 0.0000 0.0000 0.0000
Nurse Courtesy Sometimes 0.6250 1.0000 1.5000
Nurse Courtesy Usually 2.1250 2.2857 2.5000
Nurse Courtesy Always 1.6250 2.2857 3.0000
Nurse Listening Sometimes 1.8750 1.7143 1.5000
Nurse Listening Usually 3.6250 3.1429 2.0000
Nurse Listening Always -1.1250 -1.1429 2.0000
Nurse Explaining Sometimes 0.7500 0.8571 0.5000
Nurse Explaining Usually 1.2500 1.8571 1.0000
Nurse Explaining Always 1.2500 0.8571 1.0000
Doctor Courtesy Sometimes 0.5000 0.0000 0.5000
Doctor Courtesy Usually 0.7500 0.2857 1.0000
Doctor Courtesy Always 0.7500 0.4286 1.0000
Doctor Listening Sometimes 0.3750 0.2857 0.0000
Doctor Listening Usually 0.6250 0.7143 0.5000
Doctor Listening Always 0.3750 0.4286 0.5000
Doctor Explaining Sometimes 0.1250 0.0000 0.0000
Doctor Explaining Usually 0.1250 0.1429 0.0000
Doctor Explaining Always 0.1250 -0.5714 0.0000
Pain Control Sometimes 0.8750 1.0000 0.5000
Pain Control Usually 0.8750 1.7143 1.0000
Pain Control Always 0.8750 0.0000 1.0000
Overall Health Fair 0.0000 0.7143 0.0000
Overall Health Good 0.0000 0.1429 0.0000
Overall Health Very Good 0.0000 0.0000 0.0000
Overall Health Excellent 0.0000 0.0000 0.0000
Race White 0.0000 0.0000 0.0000
Race Black 0.0000 0.0000 0.0000
Race Asian 0.0000 0.4286 0.0000
Race Pacific Islander 0.0000 0.0000 0.0000
Race Native American 0.0000 0.0000 0.0000
Language Spanish 0.0000 0.0000 0.0000
Language Chinese 0.0000 0.2857 0.0000

57
Figure 8: 2006 Base Case Quantile Comparison Chart
These findings (in Figure 8) indicate that the 50th
quantile (median) falls above the linear
regression (mean), with significant variation noted at the 25th
and 75th
quantiles. It
should be noted that the differences for the base case in this data set are not extensive.
Figure 9: 2006 Pain Control Quantile Comparison Chart
25th quantile 50th quantile 75th quantile
Constant -0.8750 0.7143 2.5000
-1.5000
-1.0000
-0.5000
0.0000
0.5000
1.0000
1.5000
2.0000
2.5000
3.0000
Constant
25th quantile 50th quantile 75th quantile
Pain Control Sometimes
0.8750 1.0000 0.5000
Pain Control Usually 0.8750 1.7143 1.0000
Pain Control Always 0.8750 0.0000 1.0000
-0.2000
0.0000
0.2000
0.4000
0.6000
0.8000
1.0000
1.2000
1.4000
1.6000
1.8000
2.0000

58
Analysis of the quantile regressions indicate that the variable Pain Control
Sometimes changes minimally across the quantiles (and in the linear regression), but Pain
Control Usually increases substantially at the 50th
quantile and is significantly different
from Pain Control Sometimes and Pain Control Always. Pain Control Always decreases
significantly at the 50th
quantile. Therefore, the 50th
quantile of the respondents are
associated with Pain Control Usually in a more significant way for the 2006 data (see
Figure 9 above).
TABLE 32: 2006 TEACHING QUANTILE REGRESSION COMPARISONS
Quantile Regressions
Variable
25th
quantile
50th
quantile 75th quantile
Linear
Regression
Minor Teaching 0.0000 0.0000 0.0000 -0.114044
Non-Teaching 0.0000 0.0000 0.0000 -0.114991
No significant differences were noted between different quantile conditions and the linear
regression.

59
TABLE 33: QUANTILE SUMMARY FOR 2007
2007 Comparison Coefficients
Covariate 25th quantile 50th quantile 75th quantile
Constant -0.6667 1.0000 2.3142
Minor Teaching 0.0000 0.0000 0.2886
Non-Teaching 0.0000 0.0000 0.2455
Nurse Courtesy Sometimes 0.5000 0.8333 1.1447
Nurse Courtesy Usually 2.0000 2.0000 2.0390
Nurse Courtesy Always 1.0000 2.0000 2.4453
Nurse Listening Sometimes 1.6667 1.8333 1.5363
Nurse Listening Usually 3.5000 3.3333 2.2469
Nurse Listening Always -0.5000 -1.3333 2.1098
Nurse Explaining Sometimes 0.6667 0.6667 0.6671
Nurse Explaining Usually 1.1667 1.6667 1.1525
Nurse Explaining Always 1.1667 0.6667 1.0850
Doctor Courtesy Sometimes 0.3333 0.1667 0.3586
Doctor Courtesy Usually 0.5000 0.3333 0.5434
Doctor Courtesy Always 0.5000 0.5000 0.7450
Doctor Listening Sometimes 0.5000 0.3333 0.3095
Doctor Listening Usually 0.5000 0.6667 0.5111
Doctor Listening Always 0.5000 0.3333 0.4582
Doctor Explaining Sometimes 0.1667 0.1667 0.1835
Doctor Explaining Usually 0.1667 0.5000 0.2824
Doctor Explaining Always 0.1667 -0.1667 0.2033
Pain Control Sometimes 0.8333 0.5000 0.5262
Pain Control Usually 0.8333 1.3333 1.0116
Pain Control Always 0.8333 0.0000 0.7954
Overall Health Fair 0.0000 0.1667 0.2886
Overall Health Good 0.0000 0.0000 0.0834
Overall Health Very Good 0.0000 0.0000 -0.0360
Overall Health Excellent 0.0000 0.0000 -0.0889
Race White 0.0000 0.0000 0.0260
Race Black 0.0000 0.0000 -0.2285
Race Asian 0.0000 0.5000 0.0935
Race Pacific Islander 0.0000 0.0000 -0.1375
Race Native American 0.0000 0.0000 -0.2420
Language Spanish 0.0000 0.0000 0.0056
Language Chinese 0.0000 0.1667 0.1056

60
These findings indicate that the 50th
quantile (median) is significantly above the linear
regression (mean) for the base case, with variation noted at the 25th
and 75th
quantiles.
Figure 10 below illustrates the variation observed with quantile regression.
Figure 10: 2007 Base Case Quantile Comparison Chart
Analysis of the quantile regressions indicate that the variable Pain Control
Sometimes changes minimally across the quantiles (and in the linear regression), but Pain
Control Usually increases substantially at the 50th
quantile and is significantly different
from Pain Control Sometimes and Pain Control Always. Pain Control Always decreases
at the 50th
quantile. Therefore, 50th
quantile of the respondents are associated with Pain
Control Usually in a more significant way in the 2007 data (see Figure 11 below). These
findings are similar to the findings of the 2006 data.
25th quantile 50th quantile 75th quantile
Constant -0.6667 1.0000 2.3142
-1.0000
-0.5000
0.0000
0.5000
1.0000
1.5000
2.0000
2.5000
Constant

61
Figure 11: 2007 Pain Control Quantile Comparison Chart
Figure 12: 2007 Teaching Quantile Comparison Chart
25th quantile 50th quantile 75th quantile
Pain Control Sometimes
0.8333 0.5000 0.5262
Pain Control Usually 0.8333 1.3333 1.0116
Pain Control Always 0.8333 0.0000 0.7954
-0.2000 0.0000 0.2000 0.4000 0.6000 0.8000 1.0000 1.2000 1.4000 1.6000 1.8000 2.0000
25th quantile 50th quantile 75th quantile
Minor Teaching 0.0000 0.0000 0.2886
Non-Teaching 0.0000 0.0000 0.2455
0.0000
0.0500
0.1000
0.1500
0.2000
0.2500
0.3000
0.3500

62
No significant differences were noted at the 25th
and 50th
quantile conditions
between Major, Minor, and Non-teaching hospitals for the 2007 data, but findings at the
75th
quantile approach the findings of the linear regression, indicating that high raters’
scores were more consistent with the mean ratings for Minor and Non-teaching hospitals.
At the 95% confidence interval, the differences are statistically different, but they
represent no practical difference between the Teach conditions.
It should be noted that in the 2006-2007 data sets, Pain Control Usually leads to
higher hospital ratings across all respondents. Pain Control Always leads to lower
hospital ratings at the 25th
and 50th
quantiles. The reasons for this difference are unclear,
but one possibility might be that patients whose pain was well managed were not as
severely injured or ill as those whose pain could only be managed in most instances. The
more severely injured or ill patients might rate hospitals more highly, given the dire
medical situation in which they found themselves.

63
VIII. CONCLUSION
The purpose of this study was to examine differences in patient satisfaction scores
between different types of hospitals (major teaching, minor teaching, and non-teaching)
and other factors measured in the Hospital Consumer Assessment of Healthcare
Providers and Systems (HCAHPS) survey, given that Medicare begins distributing and
withholding funds based on this patient satisfaction survey in October 2012. An initial
case-mix study by O’Malley (2005) indicated that type of hospital service, age, race,
education, general health rating, speaking Spanish, and a circulatory disorder diagnosis
affected patient satisfaction ratings. Medicare will make adjustments for these factors in
an attempt to make fund distribution more equitable. Other factors that will be given
consideration are survey method and whether the patient was admitted through the
emergency room. Type of hospital, pain control, and nurse/physician interactions with
patients have not yet been examined in detail and are the focus of the current
investigation.
Although there is a statistically significant difference between hospital ratings by
major teaching hospitals, minor teaching hospitals, and non-teaching hospitals, the
difference appears to lose practical significance in relation to other variables, such as
nurse and doctor patient interaction, overall health of the patient, pain control, race, and
language. The findings do not contradict those of the original study by O’Malley (2005).

64
Therefore, HCAHPS ratings adjustments based on the O’Malley (2005) case-mix study
appear to be appropriate. Addition of the teaching variable does not add value to the
ratings adjustment, and no evidence of teaching hospitals being unjustly penalized by
HCAHPS ratings was found.
All nurse interactions have more impact on hospital ratings than any patient
interactions with physicians. It is hypothesized that nurses spend a greater percentage of
time with patients than doctors do and would have a greater impact on patient
satisfaction. There may be other explanations which have not been explored.
The pain control variable does appear to have a significant contribution to hospital
ratings. By definition, patients in acute care hospitals are receiving short-term medical
treatment for an acute illness or injury or are recovering from surgery. The patient’s pain
is likely to be the most intense and severe during that hospitalization, and pain
management would likely influence the patient’s perception of a hospital stay.
This study has limitations in the large volume of missing data and that the most
recent data supplied is five years old. The 2005 data appear to be fundamentally different
from the 2006 and 2007 data, in that it has larger hospitals and more teaching hospitals
than the other two data sets. Also, most respondents did not code race in the 2005 data,
whereas most respondents coded race in 2006 and 2007. In addition, the patient
population surveyed across data sets is not representative of the majority of Medicare
recipients, with 65% of the patients surveyed being younger than 65 years of age.
Approximately 83.15% of Medicare recipients are older than 65, and only 16.85% of
patients younger than 65 were receiving Medicare in 2010 due to disability.

65
Another limitation of the study is observed in the quantile regressions for pain
management findings. The interpretations are made for point estimates, leading to
statements about practical significance, as opposed to statistical significance. It is also
unclear why respondents who indicate that their pain was Usually controlled rating
hospitals more highly than respondents who indicated that their pain was Always
controlled.
Further research based on these findings should be conducted with more current
data than those obtained for 2007. Nurse interaction may be studied in more depth to
determine what types of behavior lead patients to indicate that they have been treated
courteously, were listened to, and had their treatment explained. Physician interaction
with patients might be studied in a similar manner. Another factor that may be
considered is the role of gender in patient interactions. Currently in the United States, the
majority of nurses are female (90%) and the majority of physicians are male (68%)
(Ulrich 2010). Separating interactions by gender, as well as by discipline, might yield
additional information about gender-based communication styles as they relate to patient
satisfaction.
Finally, pain control ratings might be examined based on pain location,
mechanism of injury, and number of injuries. Specific types of injuries, location of
injuries, or having multiple injuries at once (typically observed in trauma patients), may
result in higher reports of pain and decreased pain management. Therefore, these
proposed findings may lead to a better understanding of why patients rate hospitals more
favorably when their pain is only Usually controlled.

66
IX. APPENDIX A – HCAHPS Survey

67

68

69

70
X. APPENDIX B – Data Codes
Teaching Codes
1 Major Teaching Hospital
2 Minor Teaching Hospital
3 Non-teaching Hospital
Bedsize of Hospital
1 6-24
2 25-44
3 50-99
4 100-199
5 200-299
6 300-399
7 400-499
8 500+
Ownership of Hospital
1 Not for Profit
2 For Profit
3 Non-federal Government
4 Federal Government
Age Codes
1 18-24
2 25-29
3 30-34
4 35-39
5 40-44
6 45-49
7 50-54
8 55-59
9 60-64

71
Age Codes (Continued)
10 65-69
11 70-74
12 75-79
13 80-84
14 85-89
15 90+
Principal Reason for Admission
1 Obstetric
2 Medical
3 Surgical
Education
1 <8th
grade
2 Some High School
3 High School Graduate or G.E.D.
4 Some College or 2 year degree
5 4 year College Graduate
6 >4 year College Degree
Language Survey
1 English
2 Spanish
3 Chinese
Race
A. White/Caucasian
B. Black/African-American
C. Asian
D. Pacific Islander/Native Hawaiian
E. Native American/Alaska Native
F. Other

72
Ethnicity
1 Not Spanish/Hispanic/Latino
2 Puerto Rican
3 Mexican American/Chicano
4 Cuban
5 Other Spanish/Hispanic/Latino

73
XI. APPENDIX C: Quantile Analysis Results Tables
TABLE 34: 2005 50th
QUANTILE REGRESSION RESULTS
q21 Coef. Std. Err. P>t [95%
Conf.
Interval]
Pain Control Sometimes 0.6250 0.0000 0.0000 0.6250 0.6250
Pain Control Usually 0.8750 0.0000 0.0000 0.8750 0.8750
Pain Control Always 1.5000 0.0000 0.0000 1.5000 1.5000
Minor Teaching 0.0000 0.0000 0.0000 0.0000 0.0000
Non-Teaching 0.0000 0.0000 0.0000 0.0000 0.0000
Nurse Courtesy Sometimes 0.2500 0.0000 0.0000 0.2500 0.2500
Nurse Courtesy Usually 1.2500 0.0000 0.0000 1.2500 1.2500
Nurse Courtesy Always 1.8750 0.0000 0.0000 1.8750 1.8750
Nurse Listening Sometimes 1.0000 0.0000 0.0000 1.0000 1.0000
Nurse Listening Usually 1.7500 0.0000 0.0000 1.7500 1.7500
Nurse Listening Always 2.3750 0.0000 0.0000 2.3750 2.3750
Nurse Explaining Sometimes 0.7500 0.0000 0.0000 0.7500 0.7500
Nurse Explaining Usually 1.1250 0.0000 0.0000 1.1250 1.1250
Nurse Explaining Always 1.5000 0.0000 0.0000 1.5000 1.5000
Doctor Courtesy Sometimes 0.1250 0.0000 0.0000 0.1250 0.1250
Doctor Courtesy Usually 0.3750 0.0000 0.0000 0.3750 0.3750
Doctor Courtesy Always 0.5000 0.0000 0.0000 0.5000 0.5000
Doctor Listening Sometimes 0.6250 0.0000 0.0000 0.6250 0.6250
Doctor Listening Usually 0.8750 0.0000 0.0000 0.8750 0.8750
Doctor Listening Always 1.1250 0.0000 0.0000 1.1250 1.1250
Doctor Explaining Sometimes 0.1250 0.0000 0.0000 0.1250 0.1250
Doctor Explaining Usually 0.1250 0.0000 0.0000 0.1250 0.1250
Doctor Explaining Always 0.3750 0.0000 0.0000 0.3750 0.3750
Overall Health Fair 0.0000 0.0000 0.0000 0.0000 0.0000
Overall Health Good 0.0000 0.0000 0.0000 0.0000 0.0000
Overall Health Very Good 0.0000 0.0000 0.0000 0.0000 0.0000
Overall Health Excellent 0.0000 0.0000 0.0000 0.0000 0.0000
Race White 0.8750 0.0000 0.0000 0.8750 0.8750
Race Black 1.0000 0.0000 0.0000 1.0000 1.0000
Race Asian 0.5000 0.0000 0.0000 0.5000 0.5000
Race Pacific Islander 0.1250 0.0000 0.0000 0.1250 0.1250

74
TABLE 34: 2005 50th
QUANTILE REGRESSION RESULTS (CONTINUED)
Race Native American 0.1250 0.0000 0.0000 0.1250 0.1250
Language Spanish 1.0000 0.0000 0.0000 1.0000 1.0000
Language Chinese 0.1250 0.0000 0.0000 0.1250 0.1250
_cons -0.2500 0.0000 0.0000 -0.2500 -0.2500

75
TA
TABLE 35: 2005 25th
QUANTILE REGRESSION RESULTS
q21 Coef. Std. Err. P>t [95% Conf. Interval]
Pain Control Sometimes 0.6000 0.0000 0.0000 0.6000 0.6000
Pain Control Usually 1.1000 0.0000 0.0000 1.1000 1.1000
Pain Control Always 1.5000 0.0000 0.0000 1.5000 1.5000
Minor Teaching 0.0000 0.0000 0.0000 0.0000 0.0000
Non-Teaching 0.0000 0.0000 0.0000 0.0000 0.0000
Nurse Courtesy Sometimes 0.2000 0.0000 0.0000 0.2000 0.2000
Nurse Courtesy Usually 1.4000 0.0000 0.0000 1.4000 1.4000
Nurse Courtesy Always 2.1000 0.0000 0.0000 2.1000 2.1000
Nurse Listening Sometimes 0.9000 0.0000 0.0000 0.9000 0.9000
Nurse Listening Usually 2.0000 0.0000 0.0000 2.0000 2.0000
Nurse Listening Always 2.6000 0.0000 0.0000 2.6000 2.6000
Nurse Explaining Sometimes 0.7000 0.0000 0.0000 0.7000 0.7000
Nurse Explaining Usually 1.3000 0.0000 0.0000 1.3000 1.3000
Nurse Explaining Always 1.7000 0.0000 0.0000 1.7000 1.7000
Doctor Courtesy Sometimes 0.5000 0.0000 0.0000 0.5000 0.5000
Doctor Courtesy Usually 0.7000 0.0000 0.0000 0.7000 0.7000
Doctor Courtesy Always 1.0000 0.0000 0.0000 1.0000 1.0000
Doctor Listening Sometimes 0.8000 0.0000 0.0000 0.8000 0.8000
Doctor Listening Usually 1.0000 0.0000 0.0000 1.0000 1.0000
Doctor Listening Always 1.2000 0.0000 0.0000 1.2000 1.2000
Doctor Explaining Sometimes 0.1000 0.0000 0.0000 0.1000 0.1000
Doctor Explaining Usually 0.3000 0.0000 0.0000 0.3000 0.3000
Doctor Explaining Always 0.4000 0.0000 0.0000 0.4000 0.4000
Overall Health Fair 0.0000 0.0000 0.0000 0.0000 0.0000
Overall Health Good 0.0000 0.0000 0.0000 0.0000 0.0000
Overall Health Very Good 0.0000 0.0000 0.0000 0.0000 0.0000
Overall Health Excellent 0.0000 0.0000 0.0000 0.0000 0.0000
Race White 1.0000 0.0000 0.0000 1.0000 1.0000
Race Black 1.0000 0.0000 0.0000 1.0000 1.0000
Race Asian 0.7000 0.0000 0.0000 0.7000 0.7000
Race Pacific Islander 0.4000 0.0000 0.0000 0.4000 0.4000
Race Native American 0.4000 0.0000 0.0000 0.4000 0.4000
Language Spanish 1.0000 0.0000 0.0000 1.0000 1.0000
Language Chinese 0.3000 0.0000 0.0000 0.3000 0.3000
_cons -2.5000 0.0000 0.0000 -2.5000 -2.5000

76
TABLE 36: 2005 75th
QUANTILE REGRESSION RESULTS
q21 Coef. Std. Err. P>t [95%
Conf.
Interval]
Pain Control Sometimes 0.7500 0.0000 0.0000 0.7500 0.7500
Pain Control Usually 1.0000 0.0000 0.0000 1.0000 1.0000
Pain Control Always 1.0000 0.0000 0.0000 1.0000 1.0000
Minor Teaching 0.0000 0.0000 0.0000 0.0000 0.0000
Non-Teaching 0.0000 0.0000 0.0000 0.0000 0.0000
Nurse Courtesy Sometimes -1.2500 0.0000 0.0000 -1.2500 -1.2500
Nurse Courtesy Usually -0.5000 0.0000 0.0000 -0.5000 -0.5000
Nurse Courtesy Always 0.0000 0.0000 0.0000 0.0000 0.0000
Nurse Listening Sometimes 0.7500 0.0000 0.0000 0.7500 0.7500
Nurse Listening Usually 1.2500 0.0000 0.0000 1.2500 1.2500
Nurse Listening Always 1.7500 0.0000 0.0000 1.7500 1.7500
Nurse Explaining Sometimes 0.5000 0.0000 0.0000 0.5000 0.5000
Nurse Explaining Usually 0.7500 0.0000 0.0000 0.7500 0.7500
Nurse Explaining Always 1.0000 0.0000 0.0000 1.0000 1.0000
Doctor Courtesy Sometimes 0.0000 0.0000 0.0000 0.0000 0.0000
Doctor Courtesy Usually 0.0000 0.0000 0.0000 0.0000 0.0000
Doctor Courtesy Always 0.2500 0.0000 0.0000 0.2500 0.2500
Doctor Listening Sometimes 0.5000 0.0000 0.0000 0.5000 0.5000
Doctor Listening Usually 0.7500 0.0000 0.0000 0.7500 0.7500
Doctor Listening Always 1.0000 0.0000 0.0000 1.0000 1.0000
Doctor Explaining Sometimes 0.0000 0.0000 0.0000 0.0000 0.0000
Doctor Explaining Usually 0.0000 0.0000 0.0000 0.0000 0.0000
Doctor Explaining Always 0.0000 0.0000 0.0000 0.0000 0.0000
Overall Health Fair 0.0000 0.0000 0.0000 0.0000 0.0000
Overall Health Good 0.0000 0.0000 0.0000 0.0000 0.0000
Overall Health Very Good 0.0000 0.0000 0.0000 0.0000 0.0000
Overall Health Excellent 0.0000 0.0000 0.0000 0.0000 0.0000
Race White 1.0000 0.0000 0.0000 1.0000 1.0000
Race Black 1.0000 0.0000 0.0000 1.0000 1.0000
Race Asian 1.0000 0.0000 0.0000 1.0000 1.0000
Race Pacific Islander 1.0000 0.0000 0.0000 1.0000 1.0000
Race Native American 1.0000 0.0000 0.0000 1.0000 1.0000
Language Spanish 1.0000 0.0000 0.0000 1.0000 1.0000
Language Chinese 0.0000 0.0000 0.0000 0.0000 0.0000
_cons 4.0000 0.0000 0.0000 4.0000 4.0000

77
TABLE 37: 2006 50th
QUANTILE REGESSION RESULTS
q21_06a Coef. Std. Err. P>t [95%
Conf.
Interval]
Minor Teaching 0.0000 0.0000 0.0000 0.0000 0.0000
Non-Teaching 0.0000 0.0000 0.0000 0.0000 0.0000
Nurse Courtesy Sometimes 1.0000 0.0000 0.0000 1.0000 1.0000
Nurse Courtesy Usually 2.2857 0.0000 0.0000 2.2857 2.2857
Nurse Courtesy Always 2.2857 0.0000 0.0000 2.2857 2.2857
Nurse Listening Sometimes 1.7143 0.0000 0.0000 1.7143 1.7143
Nurse Listening Usually 3.1429 0.0000 0.0000 3.1429 3.1429
Nurse Listening Always -1.1429 0.0000 0.0000 -1.1429 -1.1429
Nurse Explaining Sometimes 0.8571 0.0000 0.0000 0.8571 0.8571
Nurse Explaining Usually 1.8571 0.0000 0.0000 1.8571 1.8571
Nurse Explaining Always 0.8571 0.0000 0.0000 0.8571 0.8571
Doctor Courtesy Sometimes 0.0000 0.0000 0.0000 0.0000 0.0000
Doctor Courtesy Usually 0.2857 0.0000 0.0000 0.2857 0.2857
Doctor Courtesy Always 0.4286 0.0000 0.0000 0.4286 0.4286
Doctor Listening Sometimes 0.2857 0.0000 0.0000 0.2857 0.2857
Doctor Listening Usually 0.7143 0.0000 0.0000 0.7143 0.7143
Doctor Listening Always 0.4286 0.0000 0.0000 0.4286 0.4286
Doctor Explaining Sometimes 0.0000 0.0000 0.0000 0.0000 0.0000
Doctor Explaining Usually 0.1429 0.0000 0.0000 0.1429 0.1429
Doctor Explaining Always -0.5714 0.0000 0.0000 -0.5714 -0.5714
Pain Control Sometimes 1.0000 0.0000 0.0000 1.0000 1.0000
Pain Control Usually 1.7143 0.0000 0.0000 1.7143 1.7143
Pain Control Always 0.0000 0.0000 0.0000 0.0000 0.0000
Overall Health Fair 0.7143 0.0000 0.0000 0.7143 0.7143
Overall Health Good 0.1429 0.0000 0.0000 0.1429 0.1429
Overall Health Very Good 0.0000 0.0000 0.0000 0.0000 0.0000
Overall Health Excellent 0.0000 0.0000 0.0000 0.0000 0.0000
Race White 0.0000 0.0000 0.0000 0.0000 0.0000
Race Black 0.0000 0.0000 0.0000 0.0000 0.0000
Race Asian 0.4286 0.0000 0.0000 0.4286 0.4286
Race Pacific Islander 0.0000 0.0000 0.0000 0.0000 0.0000
Race Native American 0.0000 0.0000 0.0000 0.0000 0.0000
Language Spanish 0.0000 0.0000 0.0000 0.0000 0.0000
Language Chinese 0.2857 0.0000 0.0000 0.2857 0.2857
_cons 0.7143 0.0000 0.0000 0.7143 0.7143

78
TABLE 38: 2006 25th
QUANTILE REGRESSION RESULTS
q21_06a Coef. Std. Err. P>t [95%
Conf.
Interval]
Minor Teaching 0.0000 0.0000 0.0000 0.0000 0.0000
Non-Teaching 0.0000 0.0000 0.0000 0.0000 0.0000
Nurse Courtesy Sometimes 0.6250 0.0000 0.0000 0.6250 0.6250
Nurse Courtesy Usually 2.1250 0.0000 0.0000 2.1250 2.1250
Nurse Courtesy Always 1.6250 0.0000 0.0000 1.6250 1.6250
Nurse Listening Sometimes 1.8750 0.0000 0.0000 1.8750 1.8750
Nurse Listening Usually 3.6250 0.0000 0.0000 3.6250 3.6250
Nurse Listening Always -1.1250 0.0000 0.0000 -1.1250 -1.1250
Nurse Explaining Sometimes 0.7500 0.0000 0.0000 0.7500 0.7500
Nurse Explaining Usually 1.2500 0.0000 0.0000 1.2500 1.2500
Nurse Explaining Always 1.2500 0.0000 0.0000 1.2500 1.2500
Doctor Courtesy Sometimes 0.5000 0.0000 0.0000 0.5000 0.5000
Doctor Courtesy Usually 0.7500 0.0000 0.0000 0.7500 0.7500
Doctor Courtesy Always 0.7500 0.0000 0.0000 0.7500 0.7500
Doctor Listening Sometimes 0.3750 0.0000 0.0000 0.3750 0.3750
Doctor Listening Usually 0.6250 0.0000 0.0000 0.6250 0.6250
Doctor Listening Always 0.3750 0.0000 0.0000 0.3750 0.3750
Doctor Explaining Sometimes 0.1250 0.0000 0.0000 0.1250 0.1250
Doctor Explaining Usually 0.1250 0.0000 0.0000 0.1250 0.1250
Doctor Explaining Always 0.1250 0.0000 0.0000 0.1250 0.1250
Pain Control Sometimes 0.8750 0.0000 0.0000 0.8750 0.8750
Pain Control Usually 0.8750 0.0000 0.0000 0.8750 0.8750
Pain Control Always 0.8750 0.0000 0.0000 0.8750 0.8750
Overall Health Fair 0.0000 0.0000 0.0000 0.0000 0.0000
Overall Health Good 0.0000 0.0000 0.0000 0.0000 0.0000
Overall Health Very Good 0.0000 0.0000 0.0000 0.0000 0.0000
Overall Health Excellent 0.0000 0.0000 0.0000 0.0000 0.0000
Race White 0.0000 0.0000 0.0000 0.0000 0.0000
Race Black 0.0000 0.0000 0.0000 0.0000 0.0000
Race Asian 0.0000 0.0000 0.0000 0.0000 0.0000
Race Pacific Islander 0.0000 0.0000 0.0000 0.0000 0.0000
Race Native American 0.0000 0.0000 0.0000 0.0000 0.0000
Language Spanish 0.0000 0.0000 0.0000 0.0000 0.0000
Language Chinese 0.0000 0.0000 0.0000 0.0000 0.0000
_cons -0.8750 0.0000 0.0000 -0.8750 -0.8750

79
TABLE 39: 2006 75th
QUANTILE REGRESSION RESULTS
q21_06a Coef. Std. Err. P>t [95%
Conf.
Interval]
Minor Teaching 0.0000 0.0000 0.0000 0.0000 0.0000
Non-Teaching 0.0000 0.0000 0.0000 0.0000 0.0000
Nurse Courtesy Sometimes 1.5000 0.0000 0.0000 1.5000 1.5000
Nurse Courtesy Usually 2.5000 0.0000 0.0000 2.5000 2.5000
Nurse Courtesy Always 3.0000 0.0000 0.0000 3.0000 3.0000
Nurse Listening Sometimes 1.5000 0.0000 0.0000 1.5000 1.5000
Nurse Listening Usually 2.0000 0.0000 0.0000 2.0000 2.0000
Nurse Listening Always 2.0000 0.0000 0.0000 2.0000 2.0000
Nurse Explaining Sometimes 0.5000 0.0000 0.0000 0.5000 0.5000
Nurse Explaining Usually 1.0000 0.0000 0.0000 1.0000 1.0000
Nurse Explaining Always 1.0000 0.0000 0.0000 1.0000 1.0000
Doctor Courtesy Sometimes 0.5000 0.0000 0.0000 0.5000 0.5000
Doctor Courtesy Usually 1.0000 0.0000 0.0000 1.0000 1.0000
Doctor Courtesy Always 1.0000 0.0000 0.0000 1.0000 1.0000
Doctor Listening Sometimes 0.0000 0.0000 0.0000 0.0000 0.0000
Doctor Listening Usually 0.5000 0.0000 0.0000 0.5000 0.5000
Doctor Listening Always 0.5000 0.0000 0.0000 0.5000 0.5000
Doctor Explaining Sometimes 0.0000 0.0000 0.0000 0.0000 0.0000
Doctor Explaining Usually 0.0000 0.0000 0.0000 0.0000 0.0000
Doctor Explaining Always 0.0000 0.0000 0.0000 0.0000 0.0000
Pain Control Sometimes 0.5000 0.0000 0.0000 0.5000 0.5000
Pain Control Usually 1.0000 0.0000 0.0000 1.0000 1.0000
Pain Control Always 1.0000 0.0000 0.0000 1.0000 1.0000
Overall Health Fair 0.0000 0.0000 0.0000 0.0000 0.0000
Overall Health Good 0.0000 0.0000 0.0000 0.0000 0.0000
Overall Health Very Good 0.0000 0.0000 0.0000 0.0000 0.0000
Overall Health Excellent 0.0000 0.0000 0.0000 0.0000 0.0000
Race White 0.0000 0.0000 0.0000 0.0000 0.0000
Race Black 0.0000 0.0000 0.0000 0.0000 0.0000
Race Asian 0.0000 0.0000 0.0000 0.0000 0.0000
Race Pacific Islander 0.0000 0.0000 0.0000 0.0000 0.0000
Race Native American 0.0000 0.0000 0.0000 0.0000 0.0000
Language Spanish 0.0000 0.0000 0.0000 0.0000 0.0000
Language Chinese 0.0000 0.0000 0.0000 0.0000 0.0000
_cons 2.5000 0.0000 0.0000 2.5000 2.5000

80
TABLE 40: 2007 50th
QUANTILE REGRESSION RESULTS
q21_07a Coef. Std. Err. P>t [95%
Conf.
Interval]
Minor Teaching 0.0000 0.0000 0.0000 0.0000 0.0000
Non-Teaching 0.0000 0.0000 0.0000 0.0000 0.0000
Nurse Courtesy Sometimes 0.8333 0.0000 0.0000 0.8333 0.8333
Nurse Courtesy Usually 2.0000 0.0000 0.0000 2.0000 2.0000
Nurse Courtesy Always 2.0000 0.0000 0.0000 2.0000 2.0000
Nurse Listening Sometimes 1.8333 0.0000 0.0000 1.8333 1.8333
Nurse Listening Usually 3.3333 0.0000 0.0000 3.3333 3.3333
Nurse Listening Always -1.3333 0.0000 0.0000 -1.3333 -1.3333
Nurse Explaining Sometimes 0.6667 0.0000 0.0000 0.6667 0.6667
Nurse Explaining Usually 1.6667 0.0000 0.0000 1.6667 1.6667
Nurse Explaining Always 0.6667 0.0000 0.0000 0.6667 0.6667
Doctor Courtesy Sometimes 0.1667 0.0000 0.0000 0.1667 0.1667
Doctor Courtesy Usually 0.3333 0.0000 0.0000 0.3333 0.3333
Doctor Courtesy Always 0.5000 0.0000 0.0000 0.5000 0.5000
Doctor Listening Sometimes 0.3333 0.0000 0.0000 0.3333 0.3333
Doctor Listening Usually 0.6667 0.0000 0.0000 0.6667 0.6667
Doctor Listening Always 0.3333 0.0000 0.0000 0.3333 0.3333
Doctor Explaining Sometimes 0.1667 0.0000 0.0000 0.1667 0.1667
Doctor Explaining Usually 0.5000 0.0000 0.0000 0.5000 0.5000
Doctor Explaining Always -0.1667 0.0000 0.0000 -0.1667 -0.1667
Pain Control Sometimes 0.5000 0.0000 0.0000 0.5000 0.5000
Pain Control Usually 1.3333 0.0000 0.0000 1.3333 1.3333
Pain Control Always 0.0000 0.0000 0.0000 0.0000 0.0000
Overall Health Fair 0.1667 0.0000 0.0000 0.1667 0.1667
Overall Health Good 0.0000 0.0000 0.0000 0.0000 0.0000
Overall Health Very Good 0.0000 0.0000 0.0000 0.0000 0.0000
Overall Health Excellent 0.0000 0.0000 0.0000 0.0000 0.0000
Race White 0.0000 0.0000 0.0000 0.0000 0.0000
Race Black 0.0000 0.0000 0.0000 0.0000 0.0000
Race Asian 0.5000 0.0000 0.0000 0.5000 0.5000
Race Pacific Islander 0.0000 0.0000 0.0000 0.0000 0.0000
Race Native American 0.0000 0.0000 0.0000 0.0000 0.0000
Language Spanish 0.0000 0.0000 0.0000 0.0000 0.0000
Language Chinese 0.1667 0.0000 0.0000 0.1667 0.1667
_cons 1.0000 0.0000 0.0000 1.0000 1.0000

81
TABLE 41: 2007 25th
QUANTILE REGRESSION RESULTS
q21_07a Coef. Std. Err. P>t [95%
Conf.
Interval]
Minor Teaching 0.0000 0.0000 0.0000 0.0000 0.0000
Non-Teaching 0.0000 0.0000 0.0000 0.0000 0.0000
Nurse Courtesy Sometimes 0.5000 0.0000 0.0000 0.5000 0.5000
Nurse Courtesy Usually 2.0000 0.0000 0.0000 2.0000 2.0000
Nurse Courtesy Always 1.0000 0.0000 0.0000 1.0000 1.0000
Nurse Listening Sometimes 1.6667 0.0000 0.0000 1.6667 1.6667
Nurse Listening Usually 3.5000 0.0000 0.0000 3.5000 3.5000
Nurse Listening Always -0.5000 0.0000 0.0000 -0.5000 -0.5000
Nurse Explaining Sometimes 0.6667 0.0000 0.0000 0.6667 0.6667
Nurse Explaining Usually 1.1667 0.0000 0.0000 1.1667 1.1667
Nurse Explaining Always 1.1667 0.0000 0.0000 1.1667 1.1667
Doctor Courtesy Sometimes 0.3333 0.0000 0.0000 0.3333 0.3333
Doctor Courtesy Usually 0.5000 0.0000 0.0000 0.5000 0.5000
Doctor Courtesy Always 0.5000 0.0000 0.0000 0.5000 0.5000
Doctor Listening Sometimes 0.5000 0.0000 0.0000 0.5000 0.5000
Doctor Listening Usually 0.5000 0.0000 0.0000 0.5000 0.5000
Doctor Listening Always 0.5000 0.0000 0.0000 0.5000 0.5000
Doctor Explaining Sometimes 0.1667 0.0000 0.0000 0.1667 0.1667
Doctor Explaining Usually 0.1667 0.0000 0.0000 0.1667 0.1667
Doctor Explaining Always 0.1667 0.0000 0.0000 0.1667 0.1667
Pain Control Sometimes 0.8333 0.0000 0.0000 0.8333 0.8333
Pain Control Usually 0.8333 0.0000 0.0000 0.8333 0.8333
Pain Control Always 0.8333 0.0000 0.0000 0.8333 0.8333
Overall Health Fair 0.0000 0.0000 0.0000 0.0000 0.0000
Overall Health Good 0.0000 0.0000 0.0000 0.0000 0.0000
Overall Health Very Good 0.0000 0.0000 0.0000 0.0000 0.0000
Overall Health Excellent 0.0000 0.0000 0.0000 0.0000 0.0000
Race White 0.0000 0.0000 0.0000 0.0000 0.0000
Race Black 0.0000 0.0000 0.0000 0.0000 0.0000
Race Asian 0.0000 0.0000 0.0000 0.0000 0.0000
Race Pacific Islander 0.0000 0.0000 0.0000 0.0000 0.0000
Race Native American 0.0000 0.0000 0.0000 0.0000 0.0000
Language Spanish 0.0000 0.0000 0.0000 0.0000 0.0000
Language Chinese 0.0000 0.0000 0.0000 0.0000 0.0000
_cons -0.6667 0.0000 0.0000 -0.6667 -0.6667

82
TABLE 42: 2007 75th
QUANTILE REGRESSION RESULTS
q21_07a Coef. Std. Err. P>t 95%
Conf.
Interval
Minor Teaching 0.2886 0.0225 0.0000 0.2445 0.3326
Non-Teaching 0.2455 0.0196 0.0000 0.2071 0.2839
Nurse Courtesy Sometimes 1.1447 0.0965 0.0000 0.9555 1.3339
Nurse Courtesy Usually 2.0390 0.0998 0.0000 1.8435 2.2346
Nurse Courtesy Always 2.4453 0.1004 0.0000 2.2486 2.6420
Nurse Listening Sometimes 1.5363 0.0695 0.0000 1.4001 1.6725
Nurse Listening Usually 2.2469 0.0742 0.0000 2.1015 2.3924
Nurse Listening Always 2.1098 0.0753 0.0000 1.9622 2.2575
Nurse Explaining Sometimes 0.6671 0.0532 0.0000 0.5628 0.7715
Nurse Explaining Usually 1.1525 0.0554 0.0000 1.0439 1.2611
Nurse Explaining Always 1.0850 0.0564 0.0000 0.9745 1.1955
Doctor Courtesy Sometimes 0.3586 0.0883 0.0000 0.1856 0.5316
Doctor Courtesy Usually 0.5434 0.0921 0.0000 0.3629 0.7238
Doctor Courtesy Always 0.7450 0.0928 0.0000 0.5632 0.9268
Doctor Listening Sometimes 0.3095 0.0737 0.0000 0.1651 0.4539
Doctor Listening Usually 0.5111 0.0779 0.0000 0.3584 0.6638
Doctor Listening Always 0.4582 0.0790 0.0000 0.3034 0.6130
Doctor Explaining Sometimes 0.1835 0.0622 0.0030 0.0615 0.3055
Doctor Explaining Usually 0.2824 0.0641 0.0000 0.1568 0.4081
Doctor Explaining Always 0.2033 0.0648 0.0020 0.0763 0.3303
Pain Control Sometimes 0.5262 0.0534 0.0000 0.4216 0.6309
Pain Control Usually 1.0116 0.0527 0.0000 0.9083 1.1150
Pain Control Always 0.7954 0.0530 0.0000 0.6915 0.8993
Overall Health Fair 0.2886 0.0172 0.0000 0.2549 0.3223
Overall Health Good 0.0834 0.0174 0.0000 0.0493 0.1176
Overall Health Very Good -0.0360 0.0192 0.0600 -0.0737 0.0016
Overall Health Excellent -0.0889 0.0252 0.0000 -0.1383 -0.0396
Race White 0.0260 0.0372 0.4850 -0.0469 0.0989
Race Black -0.2285 0.0392 0.0000 -0.3053 -0.1517
Race Asian 0.0935 0.0467 0.0450 0.0020 0.1850
Race Pacific Islander -0.1375 0.0663 0.0380 -0.2674 -0.0076
Race Native American -0.2420 0.0403 0.0000 -0.3210 -0.1629
Language Spanish 0.0056 0.0321 0.8610 -0.0574 0.0686
Language Chinese 0.1056 0.0456 0.0210 0.0162 0.1951
_cons 2.3142 0.1123 0.0000 2.0941 2.5343

83
XIII. BIBLIOGRAPHY
Adamy, J. “U.S. Ties Hospital Payments to Making Patients Happy.” Wall Street
Journal, October 15, 2012, A1.
Allison J.J., Kiefe, C.I., Weissman, N.W., Person, S.D., Rousculp, M., Canto, J.G.,
Bae, S., Williams, O.D., Farmer, R., and Centor, R.M. "Relationship of Hospital
Teaching Status with Quality of Care and Mortality for Medicare Patients with
Acute MI." JAMA, 2011: 237-330.
Cameron, J. "The Indirect Costs of Graduate Medical Education." New England Journal
of Medicine, 1985: 1233-1238.
Fenton, J.J., Jerant, A.F., Bertakis, K.D., and Franks, P. "The Cost of Satisfaction: A
National Study of Patient Satisfaction, Health Care Utilization, Expenditures, and
Mortality ." Archives of Internal Medicine, March 12, 2012: 405-411.
Gage, L.S. “National Association of Public Hospitals and Health Systems Research
Brief.” October 2008. http://www.naph.org/Main-Menu-
Category/Publications/Quality/hcahpsbrief.aspx?FT=.pdf (accessed July 23,
2011).
Grosskopf, S., Margaritis, D. and Valdmanis, V. "Comparing Teaching and Non-
teaching Hospitals: A Frontier Approach." Health Care Management Science,
2001: 83-90.
HCAHPS - Hospital Care Quality Care Information from the Customer Perspective.
Mode and Patient-mix Adjustment of the CAHPS Hospital Survey (HCAHPS).
April 30, 2008.
http://www.hcahpsonline.org/files/Final%20Draft%20Description%20of%20HC
AHPS%20Mode%20and%20PMA%20with%20bottom%20box%20modedoc%20
April%2030,%202008.pdf (accessed August 17, 2011).
HCAHPS Hospital Survey. 2012. http://www.hcahpsonline.org/surveyinstrument.aspx.
Hope, A.C., “A simplified Monte Carlo significance test procedure.” Journal of the
Royal Statistical Society. Series B, vol. 30, pp. 582-598, Jan. 1968.

84
Hospital Compare. 2012. http://www.hospitalcompare.hhs.gov. (Accessed August 17,
2011).
Jobson, J.D. Applied Multivariate Data Analysis:Volume II: Categoricaland
Multivariate Methods. NY:Springer, 1992.
Khuri, S.F., Najjar, S.F., Daley, J., Krasnicka, B., Hossain, M., Henderson, W.G., Aust,
J.B., Bass, B., Bishop, M.J., Demakis, J., DePalma, R., Fabri, P.J., Fink, A.,
Gibbs, J., Grover, F., Hammermeister, K., McDonald, G., Neumayer, L., Roswell,
R.H., Spencer, J., Turnage, R.H., and the participants in the VA National Surgical
Quality Improvement Program. "Comparison of Surgical Outcomes between
Teaching and Non-Teaching Hospitals in the Department of Veterans Affairs."
Annuals of Surgery, 2001: 370-382.
Maxfield, D. and Zobell, G. “Influencer: Improving the Patient Experience (webinar).”
March 8, 2012. National Quality Forum. 2011.
http://www.qualityforum.org/About_NQF/FAQsHelp.aspx#NQF3 (accessed July
23, 2011).
Nunnally, J.C. Psychometric theory. (2nd ed.). NY: McGraw-Hill, 1978.
O'Malley, A.J., Zaslavsky, A.M., Elliot, M.N., Zaborski, L., and Cleary, P.D. "Case-Mix
Adjustment of the CAHPS Hospital Survey." Health Services Research, 2005:
2162-2181.
Patefield, W.M. “Algorithm AS159. “An Efficient Method of Generating R X C Tables
with Given Row and Column Totals,” Journal of the Royal Statistical Society.
Series C (Applied Statistics), vol. 30, pp. 9197, 1981.
Rau, Jordan. "Medicare to Begin Basing Hospital Payments on Patient Satisfaction
Scores." Kaiser Health News. April 28, 2011.
http://www.kaiserhealthnews.org/Stories/2011/April/28/medicare-hospital-
patient-satisfaction.aspx (accessed July 23, 2011).
Social Security – The Official Website of the U.S. Social Security Administration. 2012.
http://www.ssa.gov/pgm/medicare.htm (accessed October 27, 2012).
Smith, Lindsay. A Tutorial on Principal Component Analysis. February 26, 2002.
Services, Centers for Medicare and Medicaid. HCAPHPS - Hospital Care Quality
Information from the Consumer Perspective. 2011.
http://www.hcahpsonline.org/home.aspx (accessed July 23, 2011).

85
Suttell, Scott. “Patient Satisfaction Surveys Could Ding Elite Hospitals' Pockets”.
Crain’s Cleveland Business. April 29, 2011.
http://www.crainscleveland.com/article/20110429/BLOGS03/110429808
(accessed July 23, 2011).
Ulrich, B. "Gender Diversity and Nurse-Physician Relationships." Virtual Mentor.
January 2010. http://virtualmentor.ama-assn.org/2010/01/msoc1-1001.html
(Accessed October 21, 2012).
U.S. Social Security Administration, Office of Retirement and Disability Policy. Annual
Statistical Supplement. 2011.
http://www.ssa.gov/policy/docs/statcomps/supplement/2011/8b.html (accessed
October 7, 2012).
Weaver, Lori. "Chuck Lauer's Insights - Improving Patient Satisfaction is Part of Doing
Business." IDN Summit and Expo. May 18, 2011.
http://idnsummit.com/_blog/Chuck_Lauers_Insights/post/Improving_Patient_Sati
sfaction_is_Part_of_Doing_Business/ (accessed July 23, 2011).
Weissman, John Z. and Ayanian, Joel S. "Teaching Hospitals and Quality of Care: A
Review of the Literature." The Commonwealth Fund. September 2002.
http://www.commonwealthfund.org/usr_doc/ayanian_reviewliterature_itl_594.pdf
(accessed July 24, 2011).
Young, G.J., Meterko, M., and Desai, K.R. "Patient Satisfaction with Hospital Care:
Effects of Demographic and Institutional Characteristics." Medical Care, March
2000: 325-334.
The CAHPS® data used in this analysis were provided by the National CAHPS® Benchmarking
Database (CAHPS Database). The CAHPS Database is funded by the U.S. Agency for
Healthcare Research and Quality and administered by Westat under Contract No. 290-01-
0003.

VITA
Amy Denise Mandaville was born in Austin, Texas on September 8, 1965, the
daughter of Joseph Edwin Steadham and Roberta Thames Steadham. After graduation
from Anderson High School, Austin, Texas, she attended the University of Texas at
Austin. She received a Bachelor of Science in May 1986 and a Master of Arts in May
1989. During the following years, she was employed as a speech-language pathologist
for the Austin Independent School District, Central Texas Speech Pathology Services,
and University Medical Center at Brackenridge. In January 2009, she entered the
Graduate College of Texas State University-San Marcos.
Permanent Address: 703 Cavu Road
Georgetown, Texas 78628
This thesis was typed by Amy D. Mandaville.