2018-10 Star Ratings Tech Notes - hcahpsonline.org · HCAHPS Measures Receiving HCAHPS Stars ....
12
1 HCAHPS Star Ratings Technical Notes. http://www.hcahpsonline.org Centers for Medicare & Medicaid Services, Baltimore, MD. Originally posted July 26, 2018. Technical Notes for HCAHPS Star Ratings (Revised for October 2018 Public Reporting) Announcement: Beginning with the July 2018 Public Report, CMS will no longer report the HCAHPS Pain Management composite measure. Overview of HCAHPS Star Ratings As part of the initiative to add five-star quality ratings to its Compare Web sites, the Centers for Medicare & Medicaid Services (CMS) publish HCAHPS Star Ratings on its Hospital Compare Web site. Star Ratings make it easier for consumers to use the information on the Compare Web sites and spotlight excellence in healthcare quality. Eleven HCAHPS Star Ratings appear on Hospital Compare: one for each of the 10 publicly reported HCAHPS measures, plus an HCAHPS Summary Star Rating. CMS updates the HCAHPS Star Ratings each quarter. HCAHPS Star Ratings are based on the same data that are used to create the HCAHPS measures reported on the Hospital Compare Web site. In this document we explain, through a series of steps, how the HCAHPS Star Ratings are created and provide an extended example to illustrate each step of the process. A set of Appendices (A, B and C) contain the current measure values for the adjustment and assignment of HCAHPS Star Ratings. Appendix D briefly describes the clustering algorithm. The public reporting of the HCAHPS Star Ratings in October 2018 will be based on patients discharged between January 1, 2017 and December 31, 2017. HCAHPS Measures Receiving HCAHPS Stars HCAHPS Star Ratings are applied to each of the 10 publicly reported HCAHPS measure. Measures are created from specific questions (also referred to as items) on the HCAHPS Survey, as follows: HCAHPS Composite Measures 1. Communication with Nurses (Q1, Q2, Q3) 2. Communication with Doctors (Q5, Q6, Q7) 3. Responsiveness of Hospital Staff (Q4, Q11) 4. Communication about Medicines (Q16, Q17) 5. Discharge Information (Q19, Q20) 6. Care Transition (Q23, Q24, Q25) HCAHPS Individual Items 7. Cleanliness of Hospital Environment (Q8) 8. Quietness of Hospital Environment (Q9) HCAHPS Global Items 9. Hospital Rating (Q21) 10. Recommend the Hospital (Q22) 100 Survey Minimum for HCAHPS Star Ratings Hospitals must have at least 100 completed HCAHPS surveys over a given four-quarter period in order to receive HCAHPS Star Ratings. In addition, hospitals must be eligible for public reporting of HCAHPS measures. Hospitals with fewer than 100 completed HCAHPS surveys do not receive Star Ratings; however their HCAHPS measure scores are publicly reported on Hospital Compare.
Transcript of 2018-10 Star Ratings Tech Notes - hcahpsonline.org · HCAHPS Measures Receiving HCAHPS Stars ....
1
HCAHPS Star Ratings Technical Notes. http://www.hcahpsonline.org Centers for Medicare & Medicaid Services, Baltimore, MD. Originally posted July 26, 2018.
Technical Notes for HCAHPS Star Ratings (Revised for October 2018 Public Reporting)
Announcement: Beginning with the July 2018 Public Report, CMS will no longer report the HCAHPS Pain Management composite measure.
Overview of HCAHPS Star Ratings As part of the initiative to add five-star quality ratings to its Compare Web sites, the Centers for Medicare & Medicaid Services (CMS) publish HCAHPS Star Ratings on its Hospital Compare Web site. Star Ratings make it easier for consumers to use the information on the Compare Web sites and spotlight excellence in healthcare quality. Eleven HCAHPS Star Ratings appear on Hospital Compare: one for each of the 10 publicly reported HCAHPS measures, plus an HCAHPS Summary Star Rating. CMS updates the HCAHPS Star Ratings each quarter. HCAHPS Star Ratings are based on the same data that are used to create the HCAHPS measures reported on the Hospital Compare Web site.
In this document we explain, through a series of steps, how the HCAHPS Star Ratings are created and provide an extended example to illustrate each step of the process. A set of Appendices (A, B and C) contain the current measure values for the adjustment and assignment of HCAHPS Star Ratings. Appendix D briefly describes the clustering algorithm.
The public reporting of the HCAHPS Star Ratings in October 2018 will be based on patients discharged between January 1, 2017 and December 31, 2017.
HCAHPS Measures Receiving HCAHPS Stars HCAHPS Star Ratings are applied to each of the 10 publicly reported HCAHPS measure. Measures are created from specific questions (also referred to as items) on the HCAHPS Survey, as follows:
HCAHPS Composite Measures1. Communication with Nurses (Q1, Q2, Q3)2. Communication with Doctors (Q5, Q6, Q7)3. Responsiveness of Hospital Staff (Q4, Q11)4. Communication about Medicines (Q16, Q17)5. Discharge Information (Q19, Q20)6. Care Transition (Q23, Q24, Q25)
HCAHPS Individual Items7. Cleanliness of Hospital Environment (Q8)8. Quietness of Hospital Environment (Q9)
HCAHPS Global Items9. Hospital Rating (Q21)10. Recommend the Hospital (Q22)
100 Survey Minimum for HCAHPS Star Ratings Hospitals must have at least 100 completed HCAHPS surveys over a given four-quarter period in order to receive HCAHPS Star Ratings. In addition, hospitals must be eligible for public reporting of HCAHPS measures. Hospitals with fewer than 100 completed HCAHPS surveys do not receive Star Ratings; however their HCAHPS measure scores are publicly reported on Hospital Compare.

2
HCAHPS Star Ratings Technical Notes. http://www.hcahpsonline.org Centers for Medicare & Medicaid Services, Baltimore, MD. Originally posted July 26, 2018.
Construction and Adjustment of HCAHPS Linear Scores CMS employs all survey responses in the construction of the HCAHPS Star Ratings. The responses to the survey items used in each HCAHPS measure (shown below) are scored linearly, adjusted, rescaled, averaged across quarters, and rounded to produce a 0-100 linear-scaled score (“Linear Score”). The five steps occur as follows: One: Linear scoring The Linear Score used in HCAHPS Star Ratings is closely related to the “top-box,” “middle-box” and “bottom-box” scores publicly reported on the Hospital Compare Web site. Individual responses to the HCAHPS Survey are scored as follows: For items 1-9, 11, and 16-17:
”Never” = 1; “Sometimes” = 2; “Usually” = 3; and “Always” = 4 For items 19 and 20:
“No” = 0; and “Yes” = 1 For item 21:
Hospital Rating “0” = 0; Hospital Rating “1” = 1; Hospital Rating “2” = 2 … Hospital Rating “10” = 10 For item 22:
”Definitely No” = 1; ”Probably No” = 2; ”Probably Yes” = 3; and ”Definitely Yes” = 4 For items 23, 24, and 25:
“Strongly Disagree” = 1; “Disagree” = 2; “Agree” = 3; and “Strongly Agree” = 4
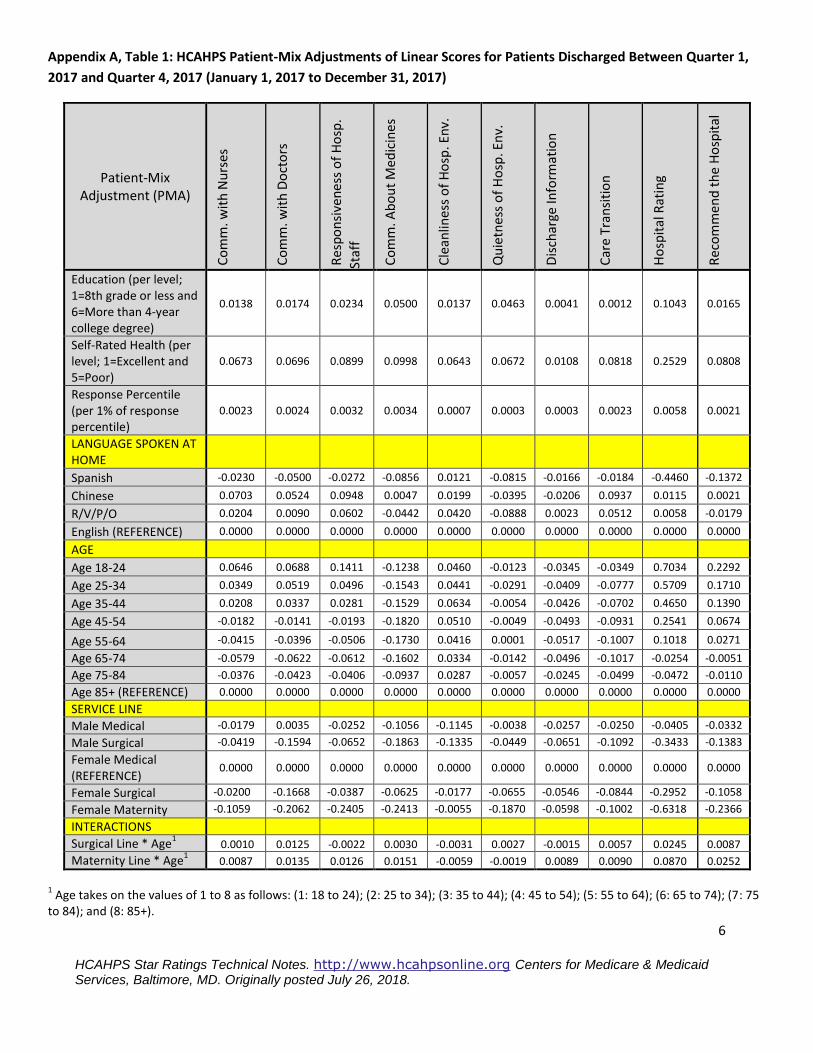
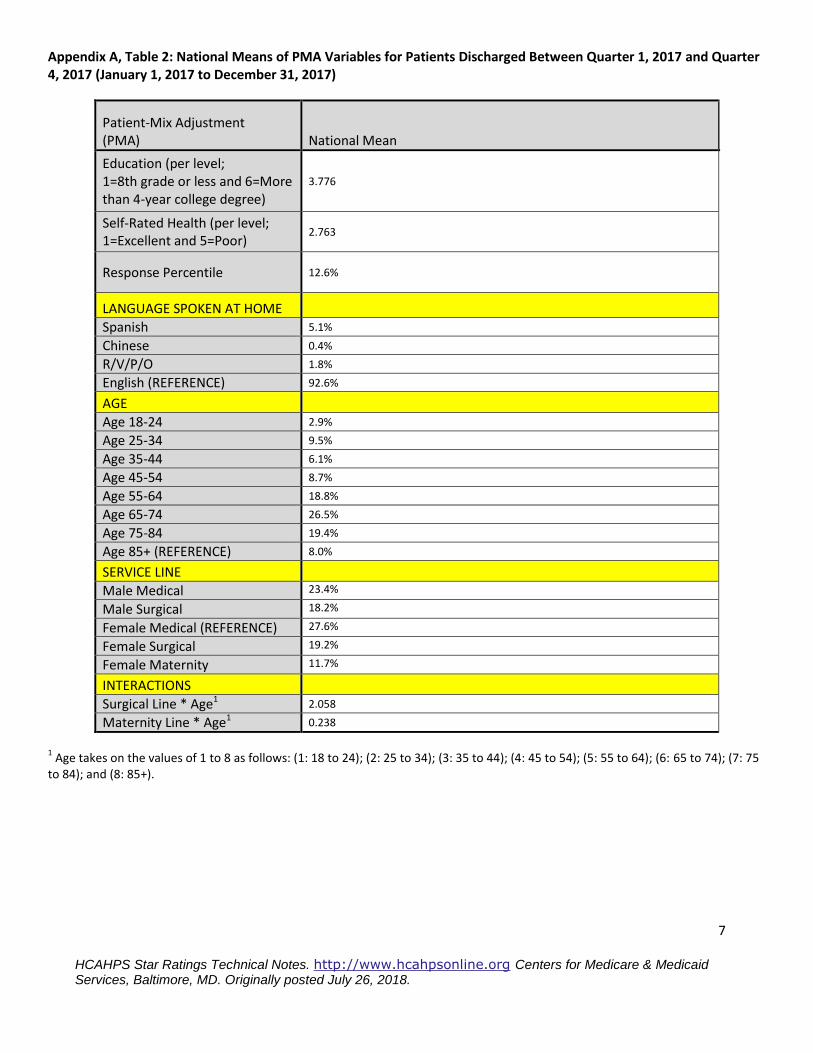
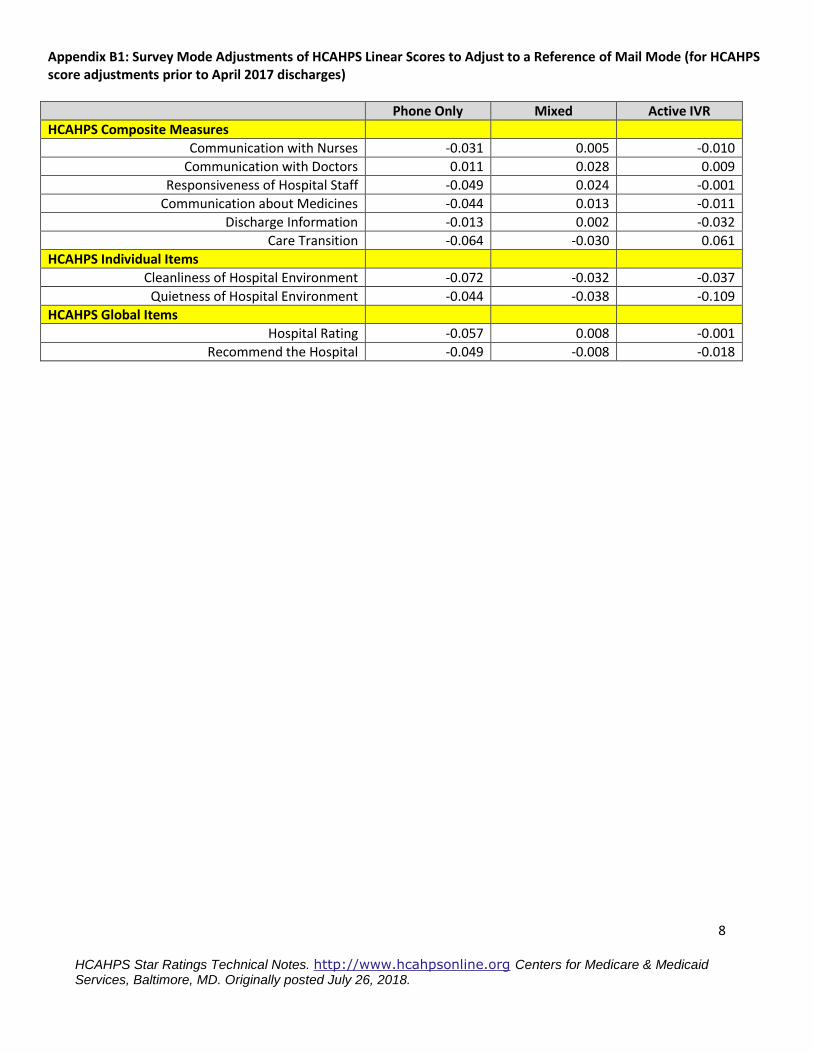
The item responses are averaged at the hospital level to form the hospital-level mean for each measure. Two: Adjustment of HCAHPS linear scores CMS applies adjustments for the effects of patient mix, survey mode, and quarterly weighting through a series of steps, as follows. First, CMS applies patient-mix adjustment (PMA) to quarterly HCAHPS scores to account for the tendency of certain patient sub-groups to respond more positively or negatively to the HCAHPS Survey. PMA enables fair comparisons across hospitals by adjusting hospital scores as if all hospitals had an identical mix of patient characteristics. The patient-mix adjustment table can be found in Appendix A (Table 1). Appendix A (Table 2) also contains the national means for patient-mix variables. These adjustments are applied to HCAHPS scores on the scale shown above. These values are shown for each answer option on the survey instrument. Additional information about the application of the HCAHPS patient-mix adjustments, including the definition of the PMA factors, can be found in the documents on the HCAHPS On-Line Web site, www.hcahpsonline.org, under the “Mode & Patient-Mix Adj” button. Second, HCAHPS quarterly scores are adjusted for the effect of mode of survey administration (mail, telephone, mixed mode or Interactive Voice Response). CMS derived the survey mode adjustments from a large-scale, randomized mode experiment. The mode adjustments are included in Appendix B. Similar to PMA, these adjustment are applied on the original scale shown on the HCAHPS survey instrument for each measure. For detailed information about the mode experiment and survey mode adjustment, please see www.hcahpsonline.org. If the measure is a multi-item composite, averaging of items within composites takes place at this point. Three: Rescaling of HCAHPS linear adjusted scores Each adjusted HCAHPS linear measure score on the original scale (shown above) is then transformed into a 0-100 linear-scaled score using the following conversion:
3
HCAHPS Star Ratings Technical Notes. http://www.hcahpsonline.org Centers for Medicare & Medicaid Services, Baltimore, MD. Originally posted July 26, 2018.
The PMA- and mode-adjusted hospital-level measure mean, M, minus the lowest possible response to the measure, R, divided by the highest possible response to the measure, K, minus the lowest response, R. An example follows:
100 ∗𝑀 − 𝑅
𝐾 − 𝑅
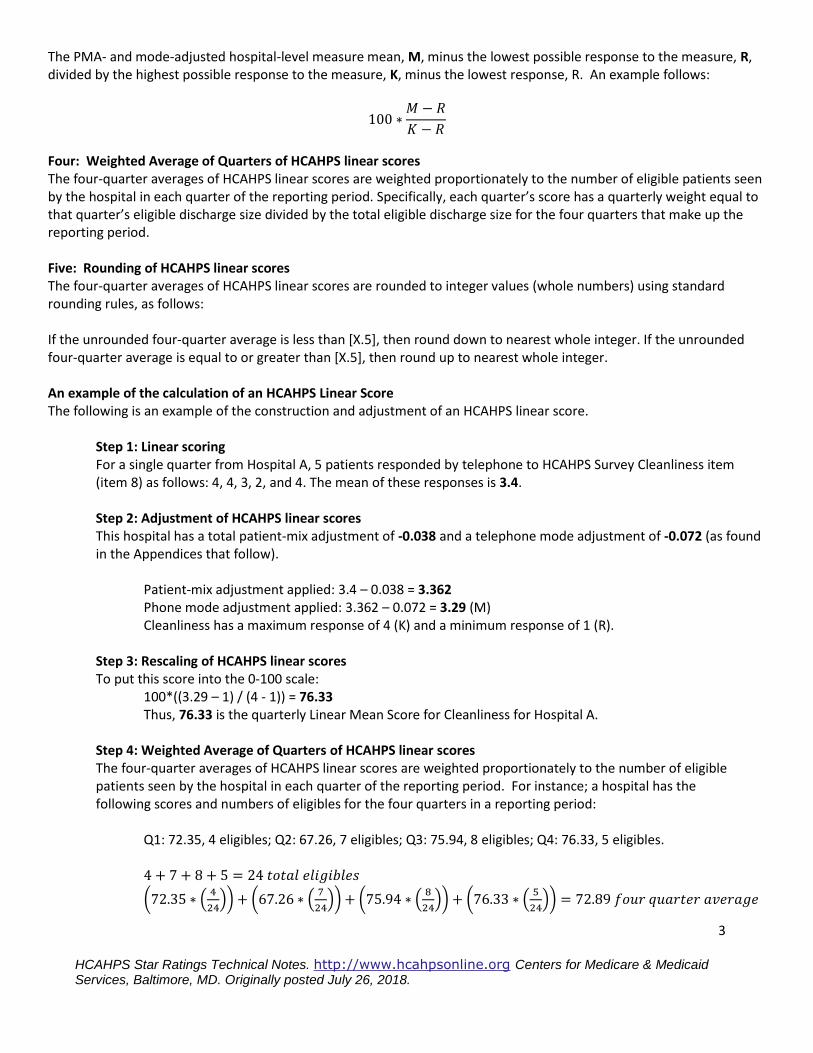
Four: Weighted Average of Quarters of HCAHPS linear scores The four-quarter averages of HCAHPS linear scores are weighted proportionately to the number of eligible patients seen by the hospital in each quarter of the reporting period. Specifically, each quarter’s score has a quarterly weight equal to that quarter’s eligible discharge size divided by the total eligible discharge size for the four quarters that make up the reporting period. Five: Rounding of HCAHPS linear scores The four-quarter averages of HCAHPS linear scores are rounded to integer values (whole numbers) using standard rounding rules, as follows: If the unrounded four-quarter average is less than [X.5], then round down to nearest whole integer. If the unrounded four-quarter average is equal to or greater than [X.5], then round up to nearest whole integer. An example of the calculation of an HCAHPS Linear Score The following is an example of the construction and adjustment of an HCAHPS linear score.
Step 1: Linear scoring For a single quarter from Hospital A, 5 patients responded by telephone to HCAHPS Survey Cleanliness item (item 8) as follows: 4, 4, 3, 2, and 4. The mean of these responses is 3.4.
Step 2: Adjustment of HCAHPS linear scores This hospital has a total patient-mix adjustment of -0.038 and a telephone mode adjustment of -0.072 (as found in the Appendices that follow).
Patient-mix adjustment applied: 3.4 – 0.038 = 3.362 Phone mode adjustment applied: 3.362 – 0.072 = 3.29 (M) Cleanliness has a maximum response of 4 (K) and a minimum response of 1 (R).
Step 3: Rescaling of HCAHPS linear scores To put this score into the 0-100 scale:
100*((3.29 – 1) / (4 - 1)) = 76.33 Thus, 76.33 is the quarterly Linear Mean Score for Cleanliness for Hospital A.
Step 4: Weighted Average of Quarters of HCAHPS linear scores The four-quarter averages of HCAHPS linear scores are weighted proportionately to the number of eligible patients seen by the hospital in each quarter of the reporting period. For instance; a hospital has the following scores and numbers of eligibles for the four quarters in a reporting period:
Q1: 72.35, 4 eligibles; Q2: 67.26, 7 eligibles; Q3: 75.94, 8 eligibles; Q4: 76.33, 5 eligibles. 4 + 7 + 8 + 5 = 24 𝑡𝑜𝑡𝑎𝑙 𝑒𝑙𝑖𝑔𝑖𝑏𝑙𝑒𝑠
(72.35 ∗ (4
24)) + (67.26 ∗ (
7
24)) + (75.94 ∗ (
8
24)) + (76.33 ∗ (
5
24)) = 72.89 𝑓𝑜𝑢𝑟 𝑞𝑢𝑎𝑟𝑡𝑒𝑟 𝑎𝑣𝑒𝑟𝑎𝑔𝑒
4
HCAHPS Star Ratings Technical Notes. http://www.hcahpsonline.org Centers for Medicare & Medicaid Services, Baltimore, MD. Originally posted July 26, 2018.
Step 5: Rounding of HCAHPS linear scores Four-quarter averages of HCAHPS linear scores are rounded to integer values using standard rounding rules, as follows: 72.89: .89 is greater than .5; so the linear score is rounded up to the next integer, 73.
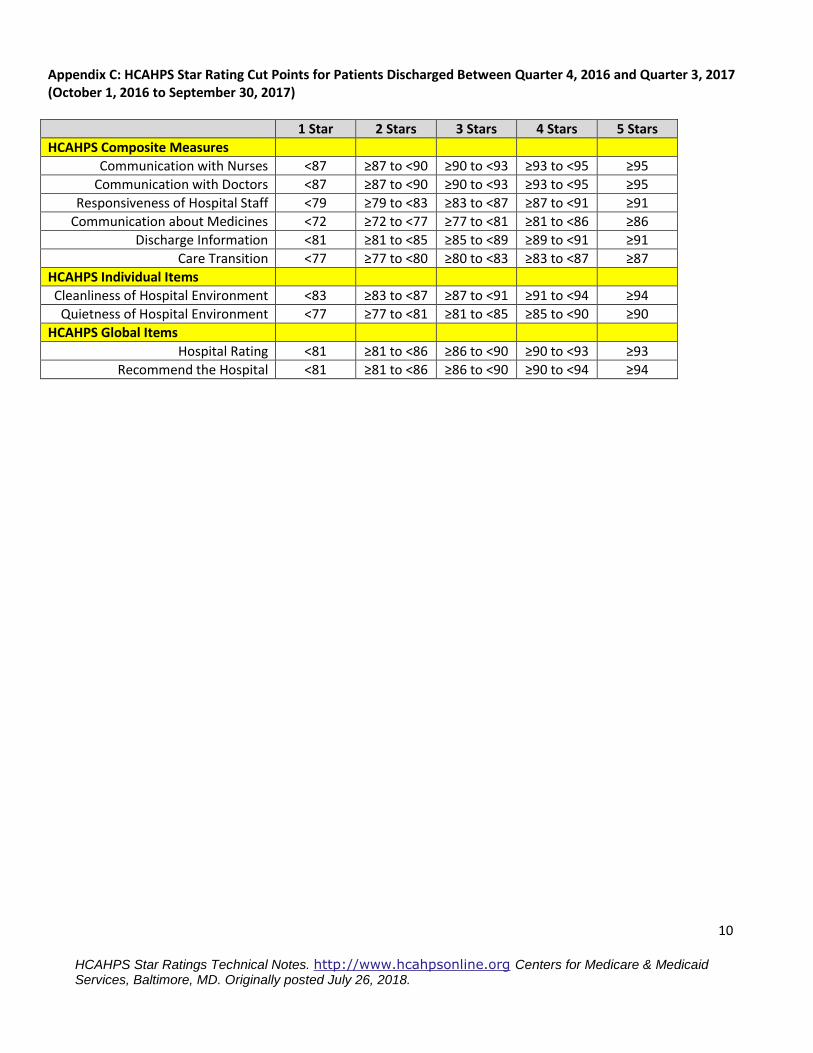
Conversion of Linear Scores into HCAHPS Star Ratings for the 11 HCAHPS Measures Next, CMS assigns 1, 2, 3, 4, or 5 whole stars (only whole stars are assigned; partial stars are not used) for each HCAHPS measure by applying statistical methods that utilize relative distribution and clustering. The Star Rating for each of the 10 HCAHPS measures is determined by applying a clustering algorithm to the individual measure scores. Conceptually, the clustering algorithm identifies the ‘gaps’ in the data and creates five categories (one for each star rating) such that scores of hospitals in the same score category (star rating) are as similar as possible, and scores of hospitals in different categories are as different as possible. This clustering algorithm is the same one employed by CMS to determine Medicare Part C and Part D Star Ratings. The variance in measure scores is separated into within-cluster and between-cluster sum of squares components. The algorithm develops clusters that minimize the variance of measure scores within the clusters. More specifically, the clustering algorithm minimizes the within-cluster sum of squares for each of the Star Ratings levels. The cut points (boundaries) for star assignments are derived from the range of individual measure Star Ratings per cluster. The star levels associated with each cluster are determined by ordering the means of each cluster. The cut points for the current HCAHPS Star Ratings are shown in Appendix C. Additional information about the clustering method can be found in Appendix D. The HCAHPS Summary Star Rating In addition to Star Ratings for the 10 HCAHPS measures, CMS introduced a new metric, the HCAHPS Summary Star Rating, which is the average of all of the Star Ratings of the HCAHPS measures. The HCAHPS Summary Star Rating is constructed from the following components:
The Star Ratings from each of the 6 HCAHPS Composite Measures o Communication with Nurses, Communication with Doctors, Responsiveness of Hospital Staff,
Communication about Medicines, Discharge Information, and Care Transition. A single Star Rating for the HCAHPS Individual Items
o The average of the Star Ratings assigned to Cleanliness of Hospital Environment and Quietness of Hospital Environment.
A single Star Rating for the HCAHPS Global Items o The average of the Star Ratings assigned to Hospital Rating and Recommend the Hospital.
The 8 Star Ratings (6 Composite Measure Star Ratings + Star Rating for Individual Items + Star Rating for Global Items) are combined as a simple average to form the HCAHPS Summary Star Rating. In the final step, normal rounding rules are applied to the 8-measure average to arrive at the HCAHPS Summary Star Rating (1, 2, 3, 4, or 5 stars).
5
HCAHPS Star Ratings Technical Notes. http://www.hcahpsonline.org Centers for Medicare & Medicaid Services, Baltimore, MD. Originally posted July 26, 2018.
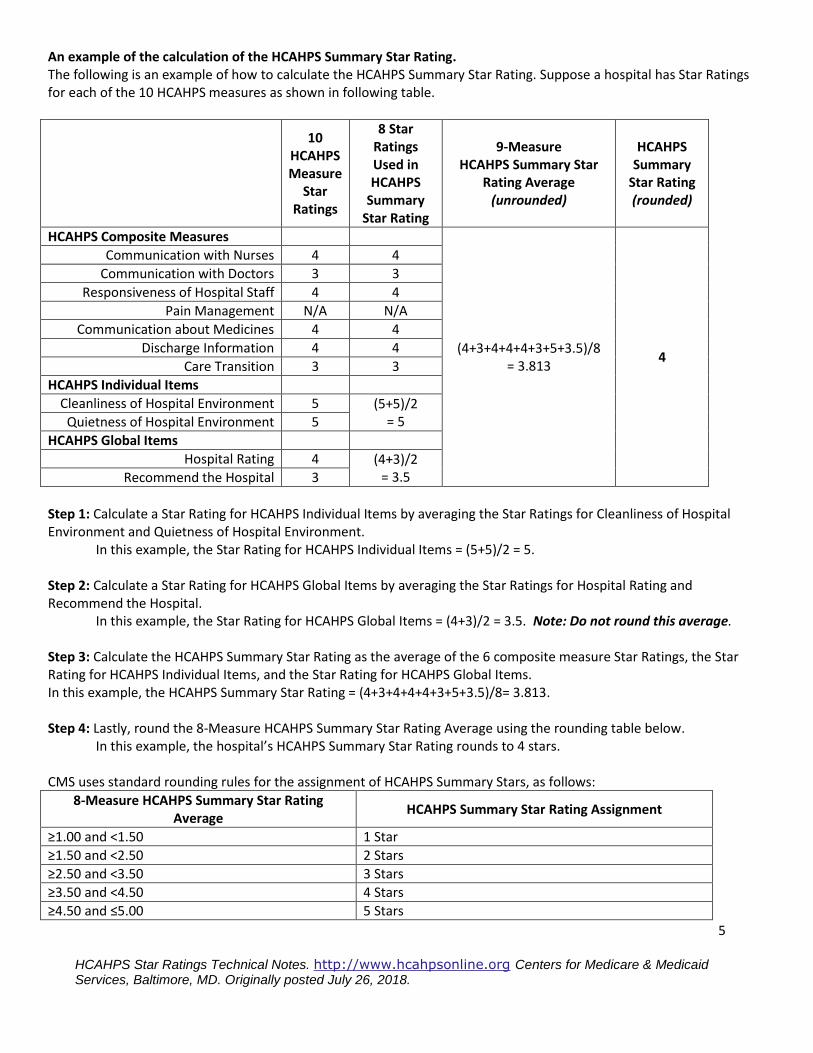
An example of the calculation of the HCAHPS Summary Star Rating. The following is an example of how to calculate the HCAHPS Summary Star Rating. Suppose a hospital has Star Ratings for each of the 10 HCAHPS measures as shown in following table.
10
HCAHPS Measure
Star Ratings
8 Star Ratings Used in HCAHPS
Summary Star Rating
9-Measure HCAHPS Summary Star
Rating Average (unrounded)
HCAHPS Summary
Star Rating (rounded)
HCAHPS Composite Measures
(4+3+4+4+4+3+5+3.5)/8 = 3.813
4
Communication with Nurses 4 4
Communication with Doctors 3 3
Responsiveness of Hospital Staff 4 4
Pain Management N/A N/A
Communication about Medicines 4 4
Discharge Information 4 4
Care Transition 3 3
HCAHPS Individual Items
Cleanliness of Hospital Environment 5 (5+5)/2 = 5 Quietness of Hospital Environment 5
HCAHPS Global Items
Hospital Rating 4 (4+3)/2 = 3.5 Recommend the Hospital 3
Step 1: Calculate a Star Rating for HCAHPS Individual Items by averaging the Star Ratings for Cleanliness of Hospital Environment and Quietness of Hospital Environment.
In this example, the Star Rating for HCAHPS Individual Items = (5+5)/2 = 5. Step 2: Calculate a Star Rating for HCAHPS Global Items by averaging the Star Ratings for Hospital Rating and Recommend the Hospital.
In this example, the Star Rating for HCAHPS Global Items = (4+3)/2 = 3.5. Note: Do not round this average. Step 3: Calculate the HCAHPS Summary Star Rating as the average of the 6 composite measure Star Ratings, the Star Rating for HCAHPS Individual Items, and the Star Rating for HCAHPS Global Items. In this example, the HCAHPS Summary Star Rating = (4+3+4+4+4+3+5+3.5)/8= 3.813. Step 4: Lastly, round the 8-Measure HCAHPS Summary Star Rating Average using the rounding table below.
In this example, the hospital’s HCAHPS Summary Star Rating rounds to 4 stars. CMS uses standard rounding rules for the assignment of HCAHPS Summary Stars, as follows:
8-Measure HCAHPS Summary Star Rating Average
HCAHPS Summary Star Rating Assignment
≥1.00 and <1.50 1 Star
≥1.50 and <2.50 2 Stars
≥2.50 and <3.50 3 Stars
≥3.50 and <4.50 4 Stars
≥4.50 and ≤5.00 5 Stars
6
HCAHPS Star Ratings Technical Notes. http://www.hcahpsonline.org Centers for Medicare & Medicaid Services, Baltimore, MD. Originally posted July 26, 2018.
Appendix A, Table 1: HCAHPS Patient-Mix Adjustments of Linear Scores for Patients Discharged Between Quarter 1,
2017 and Quarter 4, 2017 (January 1, 2017 to December 31, 2017)
Patient-Mix Adjustment (PMA)
Co
mm
. wit
h N
urs
es
Co
mm
. wit
h D
oct
ors
Res
po
nsi
ven
ess
of
Ho
sp.
Staf
f
Co
mm
. Ab
ou
t M
edic
ines
Cle
anlin
ess
of
Ho
sp. E
nv.
Qu
ietn
ess
of
Ho
sp. E
nv.
Dis
char
ge In
form
atio
n
Car
e Tr
ansi
tio
n
Ho
spit
al R
atin
g
Rec
om
men
d t
he
Ho
spit
al
Education (per level; 1=8th grade or less and 6=More than 4-year college degree)
0.0138 0.0174 0.0234 0.0500 0.0137 0.0463 0.0041 0.0012 0.1043 0.0165
Self-Rated Health (per level; 1=Excellent and 5=Poor)
0.0673 0.0696 0.0899 0.0998 0.0643 0.0672 0.0108 0.0818 0.2529 0.0808
Response Percentile (per 1% of response percentile)
0.0023 0.0024 0.0032 0.0034 0.0007 0.0003 0.0003 0.0023 0.0058 0.0021
LANGUAGE SPOKEN AT HOME
Spanish -0.0230 -0.0500 -0.0272 -0.0856 0.0121 -0.0815 -0.0166 -0.0184 -0.4460 -0.1372
Chinese 0.0703 0.0524 0.0948 0.0047 0.0199 -0.0395 -0.0206 0.0937 0.0115 0.0021
R/V/P/O 0.0204 0.0090 0.0602 -0.0442 0.0420 -0.0888 0.0023 0.0512 0.0058 -0.0179
English (REFERENCE) 0.0000 0.0000 0.0000 0.0000 0.0000 0.0000 0.0000 0.0000 0.0000 0.0000
AGE
Age 18-24 0.0646 0.0688 0.1411 -0.1238 0.0460 -0.0123 -0.0345 -0.0349 0.7034 0.2292
Age 25-34 0.0349 0.0519 0.0496 -0.1543 0.0441 -0.0291 -0.0409 -0.0777 0.5709 0.1710
Age 35-44 0.0208 0.0337 0.0281 -0.1529 0.0634 -0.0054 -0.0426 -0.0702 0.4650 0.1390
Age 45-54 -0.0182 -0.0141 -0.0193 -0.1820 0.0510 -0.0049 -0.0493 -0.0931 0.2541 0.0674
Age 55-64 -0.0415 -0.0396 -0.0506 -0.1730 0.0416 0.0001 -0.0517 -0.1007 0.1018 0.0271
Age 65-74 -0.0579 -0.0622 -0.0612 -0.1602 0.0334 -0.0142 -0.0496 -0.1017 -0.0254 -0.0051
Age 75-84 -0.0376 -0.0423 -0.0406 -0.0937 0.0287 -0.0057 -0.0245 -0.0499 -0.0472 -0.0110
Age 85+ (REFERENCE) 0.0000 0.0000 0.0000 0.0000 0.0000 0.0000 0.0000 0.0000 0.0000 0.0000
SERVICE LINE
Male Medical -0.0179 0.0035 -0.0252 -0.1056 -0.1145 -0.0038 -0.0257 -0.0250 -0.0405 -0.0332
Male Surgical -0.0419 -0.1594 -0.0652 -0.1863 -0.1335 -0.0449 -0.0651 -0.1092 -0.3433 -0.1383
Female Medical (REFERENCE)
0.0000 0.0000 0.0000 0.0000 0.0000 0.0000 0.0000 0.0000 0.0000 0.0000
Female Surgical -0.0200 -0.1668 -0.0387 -0.0625 -0.0177 -0.0655 -0.0546 -0.0844 -0.2952 -0.1058
Female Maternity -0.1059 -0.2062 -0.2405 -0.2413 -0.0055 -0.1870 -0.0598 -0.1002 -0.6318 -0.2366
INTERACTIONS
Surgical Line * Age1 0.0010 0.0125 -0.0022 0.0030 -0.0031 0.0027 -0.0015 0.0057 0.0245 0.0087
Maternity Line * Age1 0.0087 0.0135 0.0126 0.0151 -0.0059 -0.0019 0.0089 0.0090 0.0870 0.0252
1 Age takes on the values of 1 to 8 as follows: (1: 18 to 24); (2: 25 to 34); (3: 35 to 44); (4: 45 to 54); (5: 55 to 64); (6: 65 to 74); (7: 75
to 84); and (8: 85+).
7
HCAHPS Star Ratings Technical Notes. http://www.hcahpsonline.org Centers for Medicare & Medicaid Services, Baltimore, MD. Originally posted July 26, 2018.
Appendix A, Table 2: National Means of PMA Variables for Patients Discharged Between Quarter 1, 2017 and Quarter 4, 2017 (January 1, 2017 to December 31, 2017)
Patient-Mix Adjustment (PMA) National Mean
Education (per level; 1=8th grade or less and 6=More than 4-year college degree)
3.776
Self-Rated Health (per level; 1=Excellent and 5=Poor)
2.763
Response Percentile 12.6%
LANGUAGE SPOKEN AT HOME
Spanish 5.1%
Chinese 0.4%
R/V/P/O 1.8%
English (REFERENCE) 92.6%
AGE
Age 18-24 2.9%
Age 25-34 9.5%
Age 35-44 6.1%
Age 45-54 8.7%
Age 55-64 18.8%
Age 65-74 26.5%
Age 75-84 19.4%
Age 85+ (REFERENCE) 8.0%
SERVICE LINE
Male Medical 23.4%
Male Surgical 18.2%
Female Medical (REFERENCE) 27.6%
Female Surgical 19.2%
Female Maternity 11.7%
INTERACTIONS
Surgical Line * Age1 2.058
Maternity Line * Age1 0.238
1 Age takes on the values of 1 to 8 as follows: (1: 18 to 24); (2: 25 to 34); (3: 35 to 44); (4: 45 to 54); (5: 55 to 64); (6: 65 to 74); (7: 75
to 84); and (8: 85+).
8
HCAHPS Star Ratings Technical Notes. http://www.hcahpsonline.org Centers for Medicare & Medicaid Services, Baltimore, MD. Originally posted July 26, 2018.
Appendix B1: Survey Mode Adjustments of HCAHPS Linear Scores to Adjust to a Reference of Mail Mode (for HCAHPS score adjustments prior to April 2017 discharges)
Phone Only Mixed Active IVR
HCAHPS Composite Measures
Communication with Nurses -0.031 0.005 -0.010
Communication with Doctors 0.011 0.028 0.009
Responsiveness of Hospital Staff -0.049 0.024 -0.001
Communication about Medicines -0.044 0.013 -0.011
Discharge Information -0.013 0.002 -0.032
Care Transition -0.064 -0.030 0.061
HCAHPS Individual Items
Cleanliness of Hospital Environment -0.072 -0.032 -0.037
Quietness of Hospital Environment -0.044 -0.038 -0.109
HCAHPS Global Items
Hospital Rating -0.057 0.008 -0.001
Recommend the Hospital -0.049 -0.008 -0.018

9
HCAHPS Star Ratings Technical Notes. http://www.hcahpsonline.org Centers for Medicare & Medicaid Services, Baltimore, MD. Originally posted July 26, 2018.
Appendix B2: Survey Mode Adjustments of HCAHPS Linear Scores to Adjust to a Reference of Mail Mode (for HCAHPS score adjustments beginning with April 2017 discharges)
Phone Only Mixed Active IVR
HCAHPS Composite Measures
Communication with Nurses -0.043 -0.049 0.013
Communication with Doctors -0.020 -0.008 0.036
Responsiveness of Hospital Staff -0.010 -0.055 0.042
Communication about Medicines -0.011 -0.004 0.023
Discharge Information -0.017 -0.012 -0.016
Care Transition -0.024 -0.028 0.009
HCAHPS Individual Items
Cleanliness of Hospital Environment -0.018 -0.046 0.019
Quietness of Hospital Environment -0.105 -0.080 -0.056
HCAHPS Global Items
Hospital Rating -0.166 -0.142 0.079
Recommend the Hospital -0.043 -0.035 0.030
10
HCAHPS Star Ratings Technical Notes. http://www.hcahpsonline.org Centers for Medicare & Medicaid Services, Baltimore, MD. Originally posted July 26, 2018.
Appendix C: HCAHPS Star Rating Cut Points for Patients Discharged Between Quarter 4, 2016 and Quarter 3, 2017 (October 1, 2016 to September 30, 2017)
1 Star 2 Stars 3 Stars 4 Stars 5 Stars
HCAHPS Composite Measures
Communication with Nurses <87 ≥87 to <90 ≥90 to <93 ≥93 to <95 ≥95
Communication with Doctors <87 ≥87 to <90 ≥90 to <93 ≥93 to <95 ≥95
Responsiveness of Hospital Staff <79 ≥79 to <83 ≥83 to <87 ≥87 to <91 ≥91
Communication about Medicines <72 ≥72 to <77 ≥77 to <81 ≥81 to <86 ≥86
Discharge Information <81 ≥81 to <85 ≥85 to <89 ≥89 to <91 ≥91
Care Transition <77 ≥77 to <80 ≥80 to <83 ≥83 to <87 ≥87
HCAHPS Individual Items
Cleanliness of Hospital Environment <83 ≥83 to <87 ≥87 to <91 ≥91 to <94 ≥94
Quietness of Hospital Environment <77 ≥77 to <81 ≥81 to <85 ≥85 to <90 ≥90
HCAHPS Global Items
Hospital Rating <81 ≥81 to <86 ≥86 to <90 ≥90 to <93 ≥93
Recommend the Hospital <81 ≥81 to <86 ≥86 to <90 ≥90 to <94 ≥94

11
HCAHPS Star Ratings Technical Notes. http://www.hcahpsonline.org Centers for Medicare & Medicaid Services, Baltimore, MD. Originally posted July 26, 2018.
Appendix D: Individual Measure Star Assignment Process
Below are detailed steps of the clustering method to develop individual measure stars. For each measure, the clustering method does the following:
1. Produces the individual measure distance matrix.
2. Groups the measure scores into an initial set of clusters.
3. Selects the final set of clusters.
1. Produce the individual measure distance matrix.For each pair of hospital j and k (j>=k) among the n hospitals with measure score data, compute the Euclidian distance of their measure scores (e.g., the absolute value of the difference between the two measure scores). Enter this distance in row j and column k of a distance matrix with n rows and n columns. This matrix can be produced using the DISTANCE procedure in SAS as follows:
proc distance data=inclusterdat out=distancedat method=Euclid; var interval(measure_score);
id CCN; run;
In the above code, the input data set, inclusterdat, is the list of hospitals with scores for a particular measure. Each record has a unique identifier, CCN. The option method=Euclid specifies that distances between hospital measure scores should be based on Euclidean distance. The input data contain a variable called measure_score. In the var call, the parentheses around measure_score indicate that measure_score is considered to be an interval or numeric variable. The distances computed by this code are stored to an output data set called distancedat.
2. Create a tree of cluster assignments.The distance matrix calculated in Step 1 is the input to the clustering procedure. The stored distance algorithm is implemented to compute cluster assignments. The following process is implemented by using the CLUSTER procedure in SAS:
a. The input measure score distances are squared.
b. The clusters are initialized by assigning each hospital to its own cluster.
c. In order to determine which pair of clusters to merge, Ward’s minimum variance method is used to separate the
variance of the measure scores into within-cluster and between-cluster sum of squares components.
d. From the existing clusters, two clusters will be selected for merging to minimize the within-cluster sum of
squares over all possible sets of clusters that might result from a merge.
e. Steps b and c are repeated to reduce the number of clusters by one until a single cluster containing all hospitals
results.
The result is a data set that contains a tree-like structure of cluster assignments, from which any number of clusters between 1 and the number of hospital measure scores could be computed. The SAS code for implementing these steps is:
proc cluster data=distancedat method=ward outtree=treedat noprint; id CCN; run;
12
HCAHPS Star Ratings Technical Notes. http://www.hcahpsonline.org Centers for Medicare & Medicaid Services, Baltimore, MD. Originally posted July 26, 2018.
The distancedat data set containing the Euclidian distances was created in Step 1. The option method=ward indicates that Ward’s minimum variance method should be used to group clusters. The output data set is denoted with the outtree option and is called treedat.
3. Select the final set of clusters from the tree of cluster assignments.The process outlined in Step 2 will produce a tree of cluster assignments, from which the final number of clusters is selected using the TREE procedure in SAS as follows:
proc tree data=treedat ncl=NSTARS horizontal out=outclusterdat noprint; id CCN; run;
The input data set, treedat, is created in Step 2 above. The syntax, ncl=NSTARS, denotes the desired final number of clusters (or star levels). NSTARS equals 5.
Final Threshold and Star Creation The cluster assignments produced by the above approach have cluster labels that are unordered. The final step after applying the above steps to all hospital measure scores is to order the cluster labels so that the 5-star category reflects the cluster with the best performance and the 1-star category reflects the cluster with the worst performance. The measure thresholds are defined by examining the range of measure scores within each of the final clusters.