ACN 007 596 018 For personal use only · Adelaide Brighton Ltd ACN 007 596 018 Telephone (08) 8223...
28
Level 1 157 Grenfell Street Adelaide SA 5000 GPO Box 2155 Adelaide SA 5001 Adelaide Brighton Ltd ACN 007 596 018 Telephone (08) 8223 8000 International +618 8223 8000 Facsimile (08) 8215 0030 www.adbri.com.au 20 August 2015 The Manager Market Announcements Australian Securities Exchange Limited 20 Bridge Street SYDNEY NSW 2000 Dear Sir/Madam Results for announcement to the market – half year ended 30 June 2015 We attach Appendix 4D Half Year Report in accordance with Listing Rule 4.2A and management discussion covering the half year ended 30 June 2015 for release to the market. Yours faithfully MRD Clayton Company Secretary For further information please contact: Luba Alexander Group Corporate Affairs Adviser Telephone 0418 535 636 Email [email protected] For personal use only
Transcript of ACN 007 596 018 For personal use only · Adelaide Brighton Ltd ACN 007 596 018 Telephone (08) 8223...

Level 1
157 Grenfell Street
Adelaide SA 5000
GPO Box 2155
Adelaide SA 5001 Adelaide Brighton Ltd
ACN 007 596 018
Telephone (08) 8223 8000
International +618 8223 8000
Facsimile (08) 8215 0030
www.adbri.com.au
20 August 2015 The Manager Market Announcements Australian Securities Exchange Limited 20 Bridge Street SYDNEY NSW 2000 Dear Sir/Madam Results for announcement to the market – half year ended 30 June 2015 We attach Appendix 4D Half Year Report in accordance with Listing Rule 4.2A and management discussion covering the half year ended 30 June 2015 for release to the market. Yours faithfully MRD Clayton Company Secretary For further information please contact:
Luba Alexander Group Corporate Affairs Adviser Telephone 0418 535 636 Email [email protected] F
or p
erso
nal u
se o
nly

1
Adelaide Brighton Limited
Appendix 4D Half year ended 30 June 2015
Results for announcement to the market
Company name: Adelaide Brighton Limited
ABN: 15 007 596 018
Reporting period: Half year ended 30 June 2015
Previous corresponding period: Half year ended 30 June 2014
Release date: 20 August 2015
A$m
Revenue from continuing operations up 12.6% to 678.1
Earnings before interest and tax up 49.2% to 116.8
Net profit for the period attributable to members up 61.3% to 82.6
Dividend Amount per security Franked amount per security
Current period Previous
corresponding period
Interim ordinary dividend 8.0¢ 7.5¢ 100%
Interim special dividend 4.0¢ - 100%
Record date for determining entitlements to the interim dividend 7 September 2015
Payment date for interim dividend 9 October 2015
30 June 2015 30 June 2014
Net tangible asset backing per ordinary share $1.39 $1.33
Dividend Reinvestment Plan
The Adelaide Brighton Limited Board advises that the Company’s Dividend Reinvestment Plan remains suspended until further notice.
For
per
sona
l use
onl
y

Adelaide Brighton Ltd Interim results summary – half year ended 30 June 2015
2
KEY POINTS
Revenue of $678.1 million – an increase of 12.6% over the previous corresponding period (pcp)
Earnings before interest and tax (EBIT) increased by 49.2% to $116.8 million
Underlying1 EBIT of $117.3 million – increased 26.8% over the pcp
Profit before tax (PBT) of $110.3 million – up 55.1% over the pcp
Net profit attributable to members (NPAT) of $82.6 million – up 61.3% over the pcp
Underlying NPAT of $83.0 million – up 35.6% over the pcp
Underlying NPAT includes $12 million from property transactions
Interim ordinary dividend of 8.0 cents per share, franked to 100% and special dividend of 4.0 cents per share, franked to 100% (interim ordinary 7.5 cents, 100% franked in the pcp)
Basic earnings per share of 12.8 cents – up 58.8% from the pcp
Operating cash flow of $83.8 million – up 224.8% over the pcp
Gearing2 at 29.8% (32.1% at the pcp)
FINANCIAL SUMMARY – Statutory basis 6 months ended 30 June
($million) 2015 2014 % change pcp
Revenue 678.1 602.0 12.6
Depreciation, amortisation and impairments (37.9) (36.7) 3.3
Earnings before interest and tax (“EBIT”) 116.8 78.3 49.2
Net finance cost3 (6.5) (7.2) (9.7)
Profit before tax 110.3 71.1 55.1
Tax expense (27.7) (19.9) 39.2
Net profit after tax 82.6 51.2 61.3
Non-controlling interests - - -
Net profit attributable to members (“NPAT”) 82.6 51.2 61.3
Basic earnings per share (EPS) (cents) 12.8 8.0 58.8
Ordinary dividends per share – fully franked (cents) 8.0 7.5
Special dividends per share – fully franked (cents) 4.0 -
Net debt4 ($ million) 346.1 333.0
Gearing (%)2 29.8% 32.1% 1
Underlying results have been adjusted for significant items. An explanation of the adjustments and reconciliation to statutory results is provided on page 10.
2 Net debt/equity.
3 Net finance cost is the net of finance costs shown gross in the Income Statement with interest income included in revenue.
4 Net debt is calculated as total borrowings less cash and cash equivalents.
For
per
sona
l use
onl
y

Adelaide Brighton Ltd Interim results summary – half year ended 30 June 2015
3
FINANCIAL SUMMARY – Underlying basis1 6 months ended 30 June
($million) 2015 2014 % change pcp
Revenue 678.1 602.0 12.6
Underlying depreciation and amortisation (37.9) (34.7) 9.2
Underlying earnings before interest and tax 117.3 92.5 26.8
Net finance cost (6.5) (7.2) (9.7)
Underlying profit before tax 110.8 85.3 29.9
Underlying tax expense (27.8) (24.1) 15.4
Underlying net profit after tax 83.0 61.2 35.6
Non-controlling interests - - -
Underlying net profit attributable to members 83.0 61.2 35.6
Underlying basic earnings per share (cents) 12.8 9.6 33.3 1 Underlying results have been adjusted for significant items. An explanation of the adjustments and
reconciliation to statutory results is provided on page 10.
Summary of Results
Adelaide Brighton Limited reported net profit after tax (NPAT) for the half year ended 30 June 2015 of $82.6 million, an increase of 61.3% compared to the previous corresponding period (pcp). Adjusted for significant items, underlying NPAT of $83.0 million was 35.6% higher than the pcp. Property transactions contributed $12 million to NPAT.
Revenue of $678.1 million was 12.6% higher than the pcp supported by higher cement and lime volumes, improved prices, property revenue and the contribution from acquisitions completed in the second half of 2014.
Earnings before interest and tax (EBIT) increased 49.2% to $116.8 million. EBIT was constrained in the pcp by significant items totalling $14.2 million, including the rationalisation of clinker production at Munster, acquisition expenses and corporate restructuring costs.
Underlying EBIT of $117.3 million increased 26.8% on the pcp, supported by $13 million pre-tax profit (pcp $1 million) from property transactions. Excluding property, underlying EBIT increased 14% on pcp, which was approximately in line with revenue growth. The underlying EBIT margin improved to 17.3% from 15.4% in the pcp. Excluding property earnings, the underlying EBIT margin was 15.4% up slightly from 15.2% in the pcp.
The geographic mix of cement sales, lower earnings from joint ventures and rising import costs due to the weaker Australian dollar, all adversely impacted margins. However, these pressures were more than offset by increased volumes, and like-for-like selling prices and rationalisation benefits, allowing modest margin expansion (excluding property earnings).
Net finance cost was marginally higher than the prior year. While average borrowings were up following the 2014 acquisitions, interest rates were lower.
An interim ordinary dividend of 8.0 cents per share and a special dividend of 4.0 cents per share have been declared, both franked to 100% (ordinary dividend of 7.5 cents, 100% franked in the pcp).
The special dividend takes into consideration Adelaide Brighton’s strong cash flows, lower gearing, capital expenditure outlook and franking credits. The Record Date for the dividend is 7 September 2015 and it will be paid on 9 October 2015.
For
per
sona
l use
onl
y

Adelaide Brighton Ltd Interim results summary – half year ended 30 June 2015
4
Review of Operations
Cement and Clinker
Sales – Improved demand led by the residential sector
Total cement and clinker sales volumes increased versus the pcp. Demand growth on the east coast of Australia, led by strength in the residential sector more than compensated for lower sales volumes in South Australia. Demand from the resources sector was stable.
Recovering demand in Victoria was encouraging, supported by growth in both the residential and non-residential segments.
South Australia was affected by the loss of some contracted volume as previously advised to the market, a decline in the non-residential sector due to the completion of major projects and a pause in sales of back fill binder to some mining operations, while the residential sector was stable versus pcp. There is currently a lull in major projects in South Australia, ahead of the start of several major infrastructure projects slated for 2016 and beyond.
The New South Wales, Queensland and Western Australian markets were supported by growth in residential construction. Sales volume of cement to major resource projects in Western Australia and the Northern Territory were in line with the previous corresponding period, albeit with the Northern Territory modestly affected by an extended wet season.
Selling price increases were achieved in the majority of markets during the first half, however the average realised cement and clinker price was lower, reflecting a change in sales mix toward lower priced markets.
Import volumes continued to grow as the Company took advantage of competitive offshore supply to meet domestic demand growth while rationalising domestic manufacture. The volume of imported cementitious material is on track to exceed 2.1 million tonnes on an annualised basis in 2015, representing more than 20% of estimated industry demand.
Operations – Benefits from clinker rationalisation and cost reduction programs
Excluding property transactions, underlying cement margins improved versus the first half of 2014, supported by higher sales volumes, improved Birkenhead production performance, benefits from the rationalisation of clinker production in Western Australia, lower energy costs and other cost reduction initiatives.
With a more consistent operating performance, clinker production from the Birkenhead plant, South Australia, recovered from the operational issues that affected the previous corresponding period. The annual maintenance shutdown was successfully completed in May 2015.
Clinker production largely ceased at the Munster site in Western Australia at the end of 2014. Demand is being supplied by imported clinker, which is ground into cement at Munster for the local market. Cost savings from the rationalisation are on track to meet the full year target of $5 million pre-tax.
Import profitability was adversely impacted by approximately $2 million before tax versus the pcp due to the decline in the Australian dollar and subsequent rise in the cost of imported product. First half 2015 earnings included a mark-to-market gain on foreign currency contracts of $0.3 million compared to a loss of $0.5 million in the pcp.
Further strengthening of demand in Victoria has supported the utilisation of Birkenhead milling capacity upgraded at a cost of $60 million in 2012 to supply the Victorian market.
For
per
sona
l use
onl
y

Adelaide Brighton Ltd Interim results summary – half year ended 30 June 2015
5
Lime
Sales – Improved volumes
Lime sales volumes increased by approximately 5% on pcp, supported by improved demand from the non-alumina sector and the resumption of production at a major customer whose operations had been suspended in the prior period.
Average selling prices increased. The devaluation of the Australian dollar increased the cost of competing imported products. However, the threat of lime imports remains.
Operations – Improved profit
Lime profit improved versus pcp due to the resumption of sales to a major customer in the Northern Territory, improved volumes and pricing. The lime operations continue to benefit from the significant investment in environmental performance completed in the first half of 2013, which also had important cost and capacity benefits.
Concrete and Aggregates
Sales – Improved demand across all markets
In 2014, Adelaide Brighton completed three acquisitions in South Australia and north Queensland, in line with its strategy to further develop the vertical integration of its businesses. Excluding the newly acquired businesses, concrete and aggregates demand was higher across all relevant markets supported by rising demand from residential construction and commercial projects.
Average selling prices for concrete improved by more than CPI compared to the prior half year, while aggregates selling prices improved by significantly more than CPI.
Acquisitions – Performing to expectations
Acquisitions completed in 2014 in South Australia and north Queensland added approximately 9% to Group revenue versus pcp. Earnings from these acquisitions were overall in line with expectations. Aggregates prices have been better than expected offset by slightly lower volumes in South Australia compared to initial expectations. Synergies have been delivered on an accelerated program in line with prior guidance with significant benefits realised at the Penrice quarry.
The initial period of ownership of the assets has confirmed the Company’s view that the acquired businesses offer highly valuable and strategic long term positions. The operations are well positioned for growth in infrastructure activity expected in the medium term.
Concrete Products
Sales – Demand improvement
Revenue increased 8.2% on pcp in the Concrete Products business, assisted by stronger demand in most markets from the residential and commercial construction segments. Selling prices increased in line with CPI.
Operations – Production investment and restructuring benefits
Rationalisation of production facilities and restructuring undertaken over the last few years has delivered benefits as market demand improved. Along with the improvement in demand and pricing, these benefits contributed to a $1.2 million increase in Concrete Products’ EBIT compared to the pcp.
For
per
sona
l use
onl
y

Adelaide Brighton Ltd Interim results summary – half year ended 30 June 2015
6
Joint Arrangements and Associates
Independent Cement and Lime Pty Ltd (ICL) (50%)
ICL is a specialist supplier of cement and cement blended products to a wide variety of industries and retail outlets throughout Victoria and New South Wales. Demand improved in Victoria from the slow start experienced in the pcp, while the high level of demand in New South Wales was maintained. However, price increases did not cover higher input costs under long term supply agreements, resulting in lower margins. ICL reported a lower contribution to Group net profit of $3.0 million, down from $5.1 million in the pcp. A decline in input costs and price increases of approximately 2.5% effective May 2015 are expected to assist margins in the second half.
Sunstate Cement Limited (Sunstate) (50%)
Sunstate is a joint venture with a cement milling, storage and distribution facility at Fisherman Islands, Port Brisbane. Demand in south east Queensland supported stronger volumes. While the market remained competitive, improved volumes in the half and price increases effective from February 2015 saw earnings from Sunstate increase by $1.0 million on pcp to $4.4 million.
Mawson Group (Mawsons) (50%)
Mawsons is the largest premixed concrete and quarry operator in northern regional Victoria, and also operates in southern regional New South Wales. Mawsons is a significant aggregates producer in the region, holding number one and number two positions in the markets it serves. Earnings from the joint venture declined slightly from strong levels due to a slowdown in major projects, weaker residential and competitive pressures across markets.
Aalborg Portland Malaysia (APM) (30%)
Aalborg Portland Malaysia manufactures and sells white cement and clinker for the domestic Malaysian markets and exports to Australia and markets throughout south east Asia.
Equity accounted earnings for APM declined due to the slower than anticipated commissioning of the plant’s capacity expansion. Earnings are expected to improve in the second half with the plant’s expansion now commissioned. Deliveries of white clinker to Adelaide Brighton commenced from late 2014 as part of the rationalisation of the Group’s clinker production at Munster, Western Australia.
Strategic Developments
Adelaide Brighton continues a successful long term strategy to grow shareholder returns through investment in three key areas:
1. Cost reduction and continuous improvement across the Company;
2. Growth of the lime business to supply the resources sector in WA, SA and NT; and
3. Focused and relevant vertical integration into downstream aggregates, concrete, logistics and masonry businesses.
Adelaide Brighton undertook a number of initiatives in 2014 to progress its strategy, including:
the investment in downstream concrete and aggregates businesses;
rationalisation of clinker capacity; and
a corporate restructure.
The focus in 2015 has been on maximising the benefit to shareholders from these initiatives. These initiatives have supported returns in the first half and are expected to provide further benefits over the remainder of the year and in the long term.
For
per
sona
l use
onl
y

Adelaide Brighton Ltd Interim results summary – half year ended 30 June 2015
7
In 2015, Adelaide Brighton continues to explore alternatives to grow shareholder value through the execution of its long term strategy. The operating efficiency of production facilities remains a key priority in the medium term. While the lime operations are already among the most efficient in the world, the ongoing focus is on continual improvement to maximise the efficiency of supply to the resources sector and underpin long term growth in shareholder returns.
In logistics and imports, the Company continues to examine ways to further enhance the scale and efficiency of its operations in a range of markets and leverage industry leading infrastructure and competitive long term supply arrangements.
In the downstream businesses, total aggregate sales including through joint ventures is expected to exceed 6 million tonnes in 2015. A measured approach to building on these highly strategic aggregates positions remains a focus.
Industry consolidation remains a powerful long term trend influencing returns at the local, national and international level. This trend is expected to continue and Adelaide Brighton, as always, will look to participate where it adds value for shareholders.
1 Cost reduction and continuous improvement
2014 operational improvement initiatives deliver
Adelaide Brighton took significant steps in 2014 to lower costs and is on track to deliver $7 million in pre-tax savings for the full 2015 year compared to 2014.
Rationalisation of clinker manufacture at Munster, Western Australia
The rationalisation of clinker production at Munster was largely completed in December 2014. The rationalisation leveraged Adelaide Brighton’s industry leading import position and the investment in APM for white clinker production and supply. EBIT benefits of $5 million were realised in 2014, with full year savings on target for an additional $5 million in 2015.
Corporate restructure
A Group wide review of operational, human resources, information technology and administration functions resulted in a restructuring of these areas. Following $4 million of pre-tax benefits in 2014, a further $2 million is expected for the full year 2015. Adelaide Brighton continually assesses its operations to drive efficiency and to adapt to changes in the operating environment as new challenges emerge.
Import strategy delivers competitive supply into key markets
Adelaide Brighton is Australia’s largest importer of cementitious materials (cement, clinker and blast furnace slag) utilising more than two million tonnes of imported product in 2014.
This industry leading position underpins supply chain efficiency in procurement, transport, storage and distribution. The use of imported materials allows the supply of competitively priced product into a range of markets where demand exceeds the Company’s manufacturing capacity.
The import strategy is supported by long term agreements with two Japanese suppliers for grey clinker, Aalborg Portland Malaysia Sdn. Bhd. for white clinker and a major Japanese trading house for the supply of granulated blast furnace slag.
Energy
Adelaide Brighton continues to be focused on managing its energy costs. During 2015, the use of alternative fuels will be doubled at the Birkenhead plant. Savings in energy costs in Western Australia from 2016, due to declining gas costs, are expected to fully offset increasing gas costs elsewhere, including South Australia.
For
per
sona
l use
onl
y

Adelaide Brighton Ltd Interim results summary – half year ended 30 June 2015
8
Progression of land sales to realise capital
Proceeds from the property program are $32 million since the beginning of 2013, including property transactions in the first half of 2015 that realised $16.2 million in proceeds and $12 million NPAT. In the second half property transactions are expected to deliver additional cash proceeds of $32 million and NPAT of $20 million.
Adelaide Brighton has been actively engaged in selling and preparing for sale properties released by the rationalisation and improvement program. Including expected H2 2015 property transactions, the portfolio of properties targeted for sale could realise in excess of an additional $100 million in proceeds over the medium to long term.
2 Lime growth
Efficient operations with strong competitive position
The Munster, Western Australia, lime business, which is operating at 80% of capacity, is well positioned to benefit from future growth in lime sales volumes, through its low cost position. As a result of a reduction in gas costs, operating margins are expected to improve in 2016.
3 Downstream integration
Acquisitions delivering value
The 2014 investment in concrete and aggregate operations in South Australia and north Queensland for an enterprise value of $172 million is delivering in line with expectations. This investment provided access to strategically located assets across important markets for the Group, increasing exposure to concrete and quarrying operations.
Operational performance has met expectations and synergies are being delivered. The overall investment represented a 7.8 times EBITDA multiple after synergies. Adelaide Brighton will continue to pursue its strategy of acquiring quality downstream acquisitions that deliver shareholder value.
For
per
sona
l use
onl
y
Adelaide Brighton Ltd Interim results summary – half year ended 30 June 2015
9
Financial Review
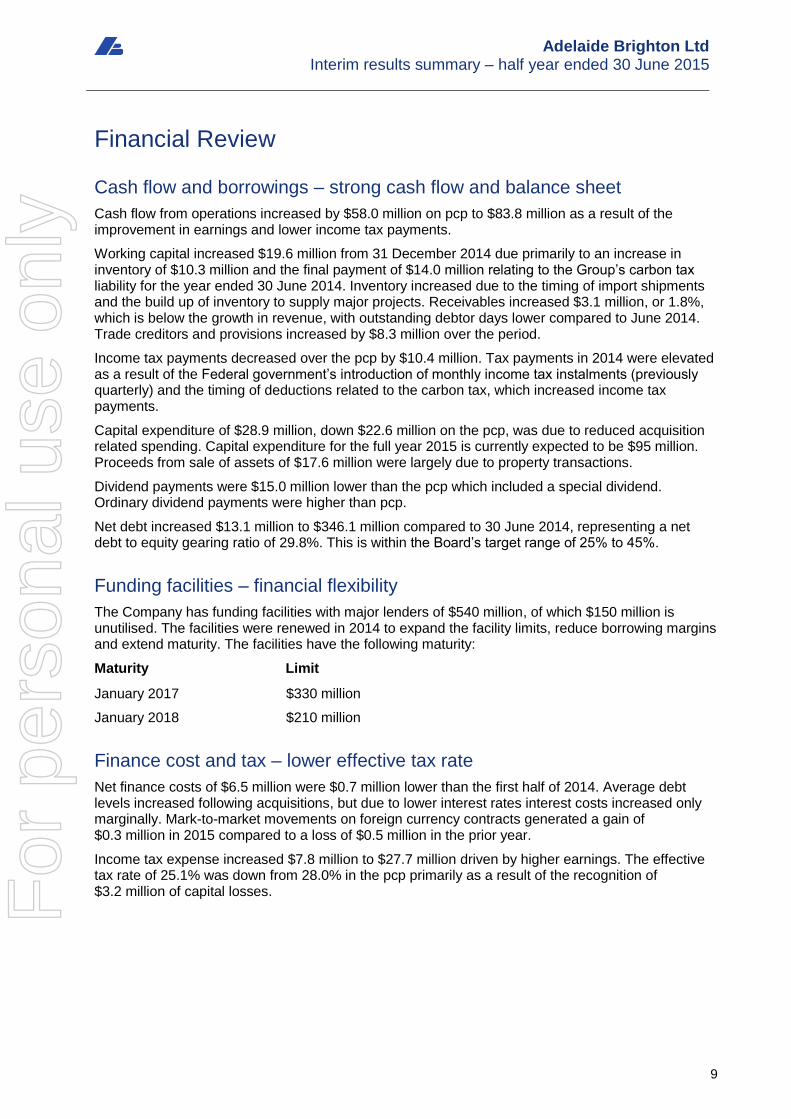
Cash flow and borrowings – strong cash flow and balance sheet
Cash flow from operations increased by $58.0 million on pcp to $83.8 million as a result of the improvement in earnings and lower income tax payments.
Working capital increased $19.6 million from 31 December 2014 due primarily to an increase in inventory of $10.3 million and the final payment of $14.0 million relating to the Group’s carbon tax liability for the year ended 30 June 2014. Inventory increased due to the timing of import shipments and the build up of inventory to supply major projects. Receivables increased $3.1 million, or 1.8%, which is below the growth in revenue, with outstanding debtor days lower compared to June 2014. Trade creditors and provisions increased by $8.3 million over the period.
Income tax payments decreased over the pcp by $10.4 million. Tax payments in 2014 were elevated as a result of the Federal government’s introduction of monthly income tax instalments (previously quarterly) and the timing of deductions related to the carbon tax, which increased income tax payments.
Capital expenditure of $28.9 million, down $22.6 million on the pcp, was due to reduced acquisition related spending. Capital expenditure for the full year 2015 is currently expected to be $95 million. Proceeds from sale of assets of $17.6 million were largely due to property transactions.
Dividend payments were $15.0 million lower than the pcp which included a special dividend. Ordinary dividend payments were higher than pcp.
Net debt increased $13.1 million to $346.1 million compared to 30 June 2014, representing a net debt to equity gearing ratio of 29.8%. This is within the Board’s target range of 25% to 45%.
Funding facilities – financial flexibility
The Company has funding facilities with major lenders of $540 million, of which $150 million is unutilised. The facilities were renewed in 2014 to expand the facility limits, reduce borrowing margins and extend maturity. The facilities have the following maturity:
Maturity Limit
January 2017 $330 million
January 2018 $210 million
Finance cost and tax – lower effective tax rate
Net finance costs of $6.5 million were $0.7 million lower than the first half of 2014. Average debt levels increased following acquisitions, but due to lower interest rates interest costs increased only marginally. Mark-to-market movements on foreign currency contracts generated a gain of $0.3 million in 2015 compared to a loss of $0.5 million in the prior year.
Income tax expense increased $7.8 million to $27.7 million driven by higher earnings. The effective tax rate of 25.1% was down from 28.0% in the pcp primarily as a result of the recognition of $3.2 million of capital losses.
For
per
sona
l use
onl
y

Adelaide Brighton Ltd Interim results summary – half year ended 30 June 2015
10
Dividends
The Board has declared an interim ordinary dividend of 8.0 cents per share (7.5 cents pcp) and a special dividend of 4.0 cents per share (0 cents pcp), both franked to 100%. The ordinary dividend payout ratio is 62.5%, compared to the Board’s target range of 65% to 75%.
The special dividend reflects Adelaide Brighton’s consistent strategy to distribute surplus capital to shareholders, where prudent to do so, while maintaining an efficient and resilient capital structure.
The successful integration of the 2014 acquisitions, healthy operating environment, strong cash flow and declining debt has allowed Adelaide Brighton to deliver strong fully franked shareholder returns through a half year special dividend without hindering the ability to invest for long term growth.
The record date for determining eligibility to the interim dividend is 7 September 2015 and the payment date is 9 October 2015.
Reconciliation of underlying profit
“Underlying” measures of profit exclude significant items of revenue and expenses, such as the costs related to restructuring, rationalisation and acquisitions, in order to highlight the underlying financial performance across reporting periods. In the first half of 2015 underlying net profit was essentially in line with reported profit given significant items were not material. Profits from the Company’s long term restructuring and land sales program are included in underlying profit despite the timing being difficult to predict. Land transactions contributed $13 million pre-tax and $12 million after tax to underlying profit during the first half of 2015.
The following table reconciles underlying earnings measures to statutory results.
Half year ended 30 June $ million
2015
2014
Profit before
tax
Income tax
Profit after tax
Profit before
tax
Income tax
Profit after tax
Statutory profit 110.3 (27.7) 82.6 71.1 (19.9) 51.2 Rationalisation of clinker production - - - 7.4 (2.2) 5.2 Corporate restructuring costs 0.5 (0.1) 0.4 4.8 (1.4) 3.4 Acquisition expenses - - - 2.0 (0.6) 1.4
Underlying profit 110.8 (27.8) 83.0 85.3 (24.1) 61.2
Rationalisation of clinker production
All costs associated with the rationalisation of clinker production at the Munster site were recognised in 2014. As part of the rationalisation, employee redundancy costs totalled $5.4 million and asset impairment charges were $2.0 million.
Corporate restructuring costs
Redundancies and one-off employment costs were $0.5 million (2014: $4.8 million) for the period. These costs result from staff restructuring within the Group, with the prior year also impacted by the retirement of the previous Managing Director.
Acquisition expenses
The costs associated with acquisitions, including stamp duty, legal and other consulting costs, fluctuate with transaction activity. No external costs relating to acquisitions and potential acquisitions were incurred during the half year (2014: $2.0 million).
For
per
sona
l use
onl
y

Adelaide Brighton Ltd Interim results summary – half year ended 30 June 2015
11
Outlook
Adelaide Brighton expects 2015 total cement and clinker volumes to be slightly higher than 2014.
A decline in South Australian sales volumes, largely driven by the previously announced loss of a major customer, is expected to be more than offset by improved volumes in other markets, particularly Victoria and New South Wales. Sales of cement to major resource projects are expected to represent approximately 4% (2014: 5%) of total cement and clinker volumes for the full year.
Lime sales volumes for 2015 are anticipated to be slightly higher than 2014 due to rising non-alumina demand and the return to normal operations of a major customer in the Northern Territory.
Small scale lime imports into Western Australia and the Northern Territory have continued, however the deterioration of the Australian dollar has reduced the competitiveness of imports.
On a like-for-like basis, construction materials prices are expected to increase in 2015 on pcp. However, average realised prices for cement are expected to be lower due to an increased portion of cement sales into lower priced markets.
Earnings in both Concrete and Aggregates and Concrete Products are expected to improve over the full year supported by higher prices and volumes and augmented by the 2014 acquisitions.
Higher import costs from a lower Australian dollar are expected to reduce full year pre-tax profit by $7 million versus 2014.
The decrease in fuel prices compared to the prior year is anticipated to provide a pre-tax benefit of $4 million in 2015.
Incremental cost savings from the 2014 restructure are expected to be $7 million pre-tax in 2015, which consist of a further: $5 million from the Munster clinker rationalisation and $2 million from corporate restructuring.
Subject to necessary approvals, two further property transactions are expected in the second half of 2015 for cash consideration of circa $32 million and after tax earnings of approximately $20 million. If realised, this would take full year 2015 property earnings to approximately $32 million after tax.
Adelaide Brighton expects 2015 full year underlying net profit after tax will be in the range of $200 million to $215 million, including profit from property transactions totalling $32 million.
Martin Brydon
Chief Executive Officer 20 August 2015
For further information:
Luba Alexander, Group Corporate Affairs Adviser Mobile: 0418 535 636 Email: [email protected]
For
per
sona
l use
onl
y
Adelaide Brighton Ltd Interim results summary – half year ended 30 June 2015
12
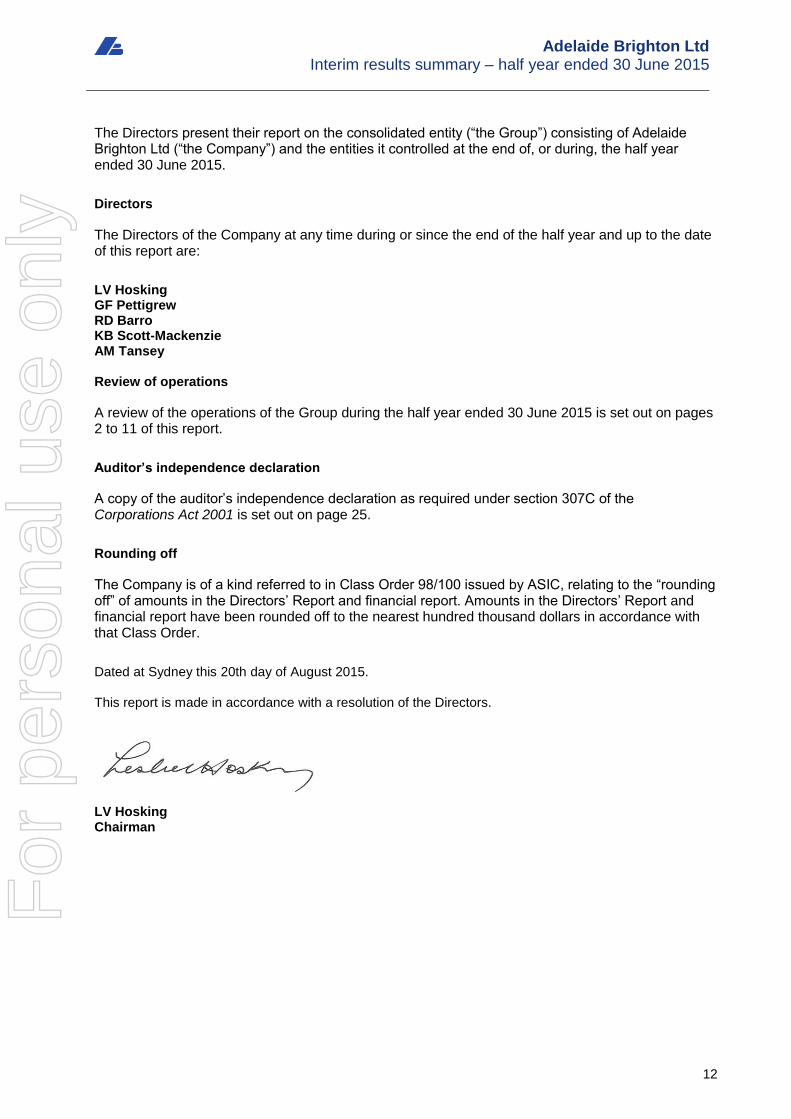
The Directors present their report on the consolidated entity (“the Group”) consisting of Adelaide Brighton Ltd (“the Company”) and the entities it controlled at the end of, or during, the half year ended 30 June 2015.
Directors
The Directors of the Company at any time during or since the end of the half year and up to the date of this report are:
LV Hosking GF Pettigrew RD Barro KB Scott-Mackenzie AM Tansey Review of operations
A review of the operations of the Group during the half year ended 30 June 2015 is set out on pages 2 to 11 of this report.
Auditor’s independence declaration
A copy of the auditor’s independence declaration as required under section 307C of the Corporations Act 2001 is set out on page 25.
Rounding off
The Company is of a kind referred to in Class Order 98/100 issued by ASIC, relating to the “rounding off” of amounts in the Directors’ Report and financial report. Amounts in the Directors’ Report and financial report have been rounded off to the nearest hundred thousand dollars in accordance with that Class Order.
Dated at Sydney this 20th day of August 2015. This report is made in accordance with a resolution of the Directors.
LV Hosking Chairman
For
per
sona
l use
onl
y

Adelaide Brighton Ltd Interim results summary – half year ended 30 June 2015
13
Consolidated income statement For the half year ended 30 June 2015
Notes 2015 $m
2014 $m
Revenue from continuing operations 3 678.1 602.0 Cost of sales Freight and distribution costs
(432.9) (107.9)
(393.9) (93.8)
Gross profit 137.3 114.3 Other income
3
16.1
2.0
Marketing costs (10.3) (9.6) Administration costs Finance costs Share of net profits of joint venture and associate entities
6
(34.1) (7.3) 8.6
(37.9) (8.0) 10.3
Profit before income tax
110.3
71.1
Income tax expense (27.7) (19.9)
Net profit for the half year
82.6
51.2
Net profit attributable to:
Equity holders of the Company 82.6 51.2 Non-controlling interests - -
82.6 51.2
Cents Cents
Earnings per share for profit from continuing operations attributable to the ordinary equity holders of the Company:
Basic earnings per share 12.8 8.0
Diluted earnings per share 12.7 8.0
The above consolidated income statement should be read in conjunction with the accompanying notes.
For
per
sona
l use
onl
y

Adelaide Brighton Ltd Interim results summary – half year ended 30 June 2015
14
Consolidated statement of comprehensive income For the half year ended 30 June 2015 2015 2014 $m $m Net profit for the half year 82.6 51.2 Other comprehensive income Items that may be reclassified to profit or loss Exchange differences on translation of foreign operations - (0.6) Income tax associated with these items - - Items that will not be reclassified to profit or loss Actuarial gain / (losses) on retirement benefit obligation 5.4 (1.0) Income tax associated with these items (1.6) 0.3
Other comprehensive income for the half year, net of tax 3.8 (1.3) Total comprehensive income for the half year 86.4 49.9
Total comprehensive income for the half year is attributable to: Equity holders of the Company 86.4 49.9 Non-controlling interests - - Total comprehensive income for the half year 86.4 49.9
The above consolidated statement of comprehensive income should be read in conjunction with the accompanying notes.
For
per
sona
l use
onl
y

Adelaide Brighton Ltd Interim results summary – half year ended 30 June 2015
15
Consolidated balance sheet
As at 30 June 2015
Notes
30 June 2015 $m
31 December 2014 $m
Current assets
Cash and cash equivalents 44.9 31.7
Trade and other receivables 202.9 199.3
Inventories 164.9 154.7
Current tax prepayment 1.9 -
414.6 385.7
Assets classified as held for sale 7.9 1.5
Total current assets 422.5 387.2
Non-current assets
Receivables 32.4 32.7
Retirement benefit asset 2.5 - Joint arrangements and associate 141.3 139.9 Property, plant and equipment 972.6 989.6
Intangible assets 263.0 263.9
Total non-current assets 1,411.8 1,426.1
Total assets 1,834.3 1,813.3
Current liabilities
Trade and other payables 130.2 120.4
Borrowings 1.1 1.4
Current tax liabilities - 1.3
Provisions 26.3 24.7
Provision for carbon emissions - 14.0
Other liabilities 4.6 4.2
Total current liabilities 162.2 166.0
Non-current liabilities
Borrowings 389.9 390.1
Deferred tax liabilities 79.0 76.8
Provisions 40.4 41.4
Retirement benefit obligations - 2.2
Other liabilities 0.1 0.1
Total non-current liabilities 509.4 510.6
Total liabilities 671.6 676.6
Net assets 1,162.7 1,136.7
Equity
Contributed equity 729.1 727.9
Reserves 3.3 3.3
Retained profits 427.6 402.8
Total equity attributable to equity holders of the Company 1,160.0 1,134.0
Non-controlling interests 2.7 2.7
Total equity 1,162.7 1,136.7
The above consolidated balance sheet should be read in conjunction with the accompanying notes.
For
per
sona
l use
onl
y

Adelaide Brighton Ltd Interim results summary – half year ended 30 June 2015
16
Consolidated statement of changes in equity For the half year ended 30 June 2015
Attributable to owners
of Adelaide Brighton Ltd
Non- controlling interests
Total equity
Contributed equity
Reserves Retained earnings
Total
$m $m $m $m $m $m
Balance at 1 January 2015 727.9 3.3 402.8 1,134.0 2.7 1136.7 Profit for the half year - - 82.6 82.6 - 82.6 Other comprehensive income for the half year
-
-
3.8
3.8
-
3.8
Total comprehensive income for the half year
-
-
86.4
86.4
-
86.4
Transactions with owners in their capacity as owners:
Dividends provided for or paid - - (61.6) (61.6) - (61.6) Executive Performance Share Plan
1.2
-
-
1.2
-
1.2
1.2 - (61.6) (60.4) - (60.4)
Balance at 30 June 2015 729.1 3.3 427.6 1,160.0 2.7 1,162.7
Balance at 1 January 2014 699.1 4.3 355.6 1,059.0 2.8 1,061.8 Profit for the half year - - 51.2 51.2 - 51.2 Other comprehensive income for the half year
-
(0.6)
(0.7)
(1.3)
-
(1.3)
Total comprehensive income for the half year
-
(0.6)
50.5
49.9
-
49.9
Transactions with owners in their capacity as owners:
Dividends provided for or paid - - (76.6) (76.6) - (76.6) Executive Performance Share Plan
4.2
(2.5)
-
1.7
-
1.7
4.2 (2.5) (76.6) (74.9) - (74.9)
Balance at 30 June 2014 703.3 1.2 329.5 1,034.0 2.8 1,036.8
The above consolidated statement of changes in equity should be read in conjunction with the accompanying notes.
For
per
sona
l use
onl
y

Adelaide Brighton Ltd Interim results summary – half year ended 30 June 2015
17
Consolidated statement of cash flows For the half year ended 30 June 2015 Notes 2015
$m 2014 $m
Cash flows from operating activities Receipts from customers (inclusive of goods and services tax) 741.9 647.6 Payments to suppliers and employees (inclusive of goods and services tax) (631.8) (587.4) Joint venture distributions received 7.1 7.0 Interest received 0.8 0.8 Interest paid (7.1) (6.9) Other income and receipts 2.8 5.0 Income taxes paid (29.9) (40.3)
Net cash inflow from operating activities 83.8 25.8
Cash flows from investing activities
Payments for property, plant, equipment and intangibles (28.9) (29.8) Payments for acquisition of business, net of cash acquired - (21.7) Proceeds from sale of property, plant and equipment 17.6 9.1 Loans to joint ventures and other related parties - - Repayment of loans from other parties 0.2 0.3
Net cash (outflow) from investing activities (11.1) (42.1)
Cash flows from financing activities
Proceeds from issue of shares 2.8 8.1 Proceeds from borrowings - 120.0 Repayment of borrowings (0.8) - Dividends paid to Company’s shareholders 4 (61.6) (76.6)
Net cash (outflow)/inflow from financing activities (59.6) 51.5
Net increase in cash and cash equivalents held 13.1 35.2 Cash and cash equivalents at the beginning of the half year 31.7 11.1 Net impact of foreign exchange on cash 0.1 -
Cash and cash equivalents at the end of the half year 44.9 46.3
The above consolidated statement of cash flows should be read in conjunction with the accompanying notes.
For
per
sona
l use
onl
y

Adelaide Brighton Ltd Interim results summary – half year ended 30 June 2015
18
Notes to the financial statements For the half year ended 30 June 2015
1 Basis of preparation of half year report This condensed consolidated interim financial report for the half year reporting period ended 30 June 2015 has been prepared in accordance with Accounting Standard AASB 134 Interim Financial Reporting and the Corporations Act 2001. This condensed consolidated interim financial report does not include all the notes of the type normally included in an annual financial report. Accordingly, this report is to be read in conjunction with the annual report for the year ended 31 December 2014 and any public announcements made by Adelaide Brighton Ltd during the interim reporting period in accordance with continuous disclosure requirements of the Corporations Act 2001. The accounting policies adopted are consistent with those of the previous financial year and corresponding interim reporting period.
2 Segment reporting (a) Description of segments
Management has determined the operating segments based on the reports reviewed by the Chief Executive Officer. These reports are evaluated regularly in deciding how to allocate resources and in assessing performance.
The two reportable segments have been identified as follows:
Cement, Lime, Concrete and Aggregates
Concrete Products
The operating segments, Cement, Lime, Concrete and Aggregates individually meet the quantitative thresholds required by AASB 8 as well as meeting the aggregation criteria allowing them to be reported as one segment. Concrete Products meets the quantitative threshold and is therefore reported as a separate segment. Joint arrangements and associates related to the reportable segments form part of the above two reportable segments.
The major end use markets of Adelaide Brighton's products include residential and non-residential construction, engineering construction, alumina and steel production and mining.
For
per
sona
l use
onl
y

Adelaide Brighton Ltd Interim results summary – half year ended 30 June 2015
19
Notes to the financial statements For the half year ended 30 June 2015
2 Segment reporting (continued) (b) Segment information provided to the Chief Executive Officer
The segment information provided to the Chief Executive Officer for the reportable segments is as follows:
Half year 2015 Cement, Lime, Concrete and Aggregates
Concrete Products
Unallocated Total
$m $m $m $m Total segment operating revenue 735.4 67.3 - 802.7 Inter-segment revenue (31.0) - - (31.0)
Revenue from external customers 704.4 67.3 - 771.7 Depreciation and amortisation (32.0) (4.1) (2.0) (38.1) EBIT 131.3 3.2 (17.7) 116.8 Share of net profits of joint venture and
associate entities
8.6 -
-
8.6
Half year 2014 Total segment operating revenue 637.1 62.2 - 699.3 Inter-segment revenue (14.7) - - (14.7)
Revenue from external customers 622.4 62.2 - 684.6 Depreciation and amortisation (29.5) (3.7) (1.5) (34.7) Impairment (2.0) - - (2.0) EBIT 93.6 2.0 (17.3) 78.3 Share of net profits of joint venture and
associate entities
10.3 -
-
10.3
Sales between segments are carried out at arms length and are eliminated on consolidation.
The operating revenue assessed by the Chief Executive Officer includes revenue from external customers and a share of revenue from the joint ventures and associate in proportion to the Group’s ownership interest, excluding freight, interest and royalty revenue. A reconciliation of segment operating revenue to revenue from continuing operations is provided as follows: Consolidated
2015 $m
2014 $m
Total segment operating revenue 802.7 699.3 Inter-segment revenue elimination (31.0) (14.7) Freight revenue 66.7 61.9 Interest revenue 0.8 0.8 Royalties 0.3 0.3 Elimination of joint venture and associate revenue (161.4) (145.6)
Revenue from continuing operations 678.1 602.0
For
per
sona
l use
onl
y

Adelaide Brighton Ltd Interim results summary – half year ended 30 June 2015
20
Notes to the financial statements For the half year ended 30 June 2015
2 Segment reporting (continued)
(b) Segment information provided to the Chief Executive Officer (continued)
The Chief Executive Officer assesses the performance of the operating segments based on a measure of EBIT. This measurement basis excludes the effect of net interest. A reconciliation of the EBIT to operating profit before income tax is provided as follows:
Consolidated 2015 2014 $m $m EBIT 116.8 78.3 Net finance cost (6.5) (7.2)
Profit before income tax 110.3 71.1
Revenue from continuing operations Sale of goods 677.0 600.9 Interest revenue 0.8 0.8 Royalties 0.3 0.3
678.1 602.0
Other income Net gain related to sale of property, plant and equipment 13.3 1.0 Rental income 1.4 0.6 Miscellaneous income 1.4 0.4
Total other income 16.1 2.0 Revenue and other income 694.2 604.0
Finance cost
Interest and finance charges 7.5 7.0 Unwinding of the discount on restoration provisions and retirement benefit obligation
0.4
0.6
Exchange (gain)/loss on foreign exchange contracts (0.3) 0.5
Gross finance cost 7.6 8.1 Interest capitalised in respect of qualifying assets (0.3) (0.1)
Total finance cost recognised in the income statement 7.3 8.0 Less interest revenue (0.8) (0.8)
Net finance cost 6.5 7.2
Impairment No impairment charge has been recognised in the current reporting period. In the prior reporting period an impairment charge against plant and equipment of $2.0 million was recognised in cost of sales in the income statement for the year relating to the cement segment of the Group. As a result of the rationalisation of clinker production at the Munster site in 2014, an impairment charge was recognised for the excess of the written down value compared to the recoverable amount of the assets impacted by the rationalisation.
3 Operating profit
For
per
sona
l use
onl
y

Adelaide Brighton Ltd Interim results summary – half year ended 30 June 2015
21
Notes to the financial statements For the half year ended 30 June 2015
4 Dividends 2015
$m 2014 $m
Dividends provided or paid during the half year
2014 final dividend of 12.5 cents (2013 – 12.0 cents) per fully paid ordinary share, franked at 100% (2013 – 100%) paid on 16 April 2015
61.6
76.6
Total dividends paid in cash 61.6 76.6
Dividends not recognised at the end of the half year Since the end of the half year the Directors have recommended the payment of an interim ordinary dividend of 8.0 cents and special dividend of 4.0 cents (June 2014 – ordinary dividend 7.5 cents, special divided nil) per fully paid ordinary share per fully paid ordinary share franked at 100% (June 2014 – 100%). The aggregate amount of the proposed dividend expected to be paid on 9 October 2015, not recognised as a liability at the end of the half year, is
77.9
48.0
5 Equity Securities issued – Issue of ordinary shares during the half year
2015 Shares
2014 Shares
2015 $m
2014 $m
Shares issued under the Adelaide Brighton Ltd Executive Performance Share Plan
618,080 2,078,332 1.2 4.2
For
per
sona
l use
onl
y

Adelaide Brighton Ltd Interim results summary – half year ended 30 June 2015
22
Notes to the financial statements For the year half year ended 30 June 2015
6 Investments in joint arrangements and associate Investments in joint arrangements are classified into Joint Ventures, which are accounted for in the consolidated financial statements using the equity method of accounting, and Joint Operations, which are accounted for using the proportional consolidation method. Associates are accounted for using the equity method.
Ownership interest
Name of joint arrangement / associate Nature of relationship 2015 %
2014 %
Aalborg Portland Malaysia Sdn Bhd Associate 30 30 Batesford Quarry Joint operation 50 50 Burrell Mining Services JV Joint operation 50 50 EB Mawson & Sons Pty Ltd Joint venture 50 50 Independent Cement & Lime Pty Ltd Joint venture 50 50 Lake Boga Quarries Pty Ltd Joint venture 50 50 Peninsula Concrete Pty Ltd Joint venture 50 - Sunstate Cement Ltd Joint venture 50 50 Contribution to net profit
2015 2014 $m $m
Sunstate Cement Ltd 4.4 3.4 Independent Cement & Lime Pty Ltd 3.0 5.1 Other joint ventures and associates 1.2 1.8 Share of net profits of joint venture and associate entities 8.6 10.3 Profit from joint operations 1.2 1.2 Total profit from joint arrangements and associates 9.8 11.5
7 Contingencies Details and estimates of maximum amounts of contingent liabilities are as follows:
Guarantees
Bank guarantees 23.0 17.8
No material losses are anticipated in respect of the above contingent liabilities.
For
per
sona
l use
onl
y

Adelaide Brighton Ltd Interim results summary – half year ended 30 June 2015
23
Notes to the financial statements For the half year ended 30 June 2015
8 Events occurring after reporting date No matter or circumstance has arisen since 30 June 2015 that has significantly affected, or may significantly affect: (a) The Group’s (consolidated entity) operations in future financial years, or (b) The results of those operations in future financial years, or (c) The Group’s state of affairs in future financial years.
For
per
sona
l use
onl
y
Adelaide Brighton Ltd Interim results summary – half year ended 30 June 2015
24
In the Directors’ opinion: (a) The financial statements and notes set out on pages 12 to 23 are in accordance with the
Corporations Act 2001, including: (i) complying with Accounting Standards, the Corporations Regulations 2001 and other
mandatory professional reporting requirements; and (ii) giving a true and fair view of the Group’s financial position as at 30 June 2015 and of its
performance for the half year ended on that date; and
(b) There are reasonable grounds to believe that the Company will be able to pay its debts as and when they become due and payable; and
This declaration is made in accordance with a resolution of the Directors.
LV Hosking Chairman Dated at Sydney on the 20th
day of August 2015
For
per
sona
l use
onl
y

PricewaterhouseCoopers, ABN 52 780 433 757Level 11, 70 Franklin Street, ADELAIDE SA 5000, GPO Box 418, ADELAIDE SA 5001T: +61 8 8218 7000, F: +61 8 8218 7999, www.pwc.com.au
Liability limited by a scheme approved under Professional Standards Legislation.
Auditor’s Independence Declaration
As lead auditor for the review of Adelaide Brighton Limited for the half-year ended 30 June 2015, Ideclare that to the best of my knowledge and belief, there have been:
a) no contraventions of the auditor independence requirements of the Corporations Act 2001 inrelation to the review; and
b) no contraventions of any applicable code of professional conduct in relation to the review.
This declaration is in respect of Adelaide Brighton Limited and the entities it controlled during theperiod.
Kevin Reid AdelaidePartnerPricewaterhouseCoopers
20 August 2015
For
per
sona
l use
onl
y

PricewaterhouseCoopers, ABN 52 780 433 757Level 11, 70 Franklin Street, ADELAIDE SA 5000, GPO Box 418, ADELAIDE SA 5001T: +61 8 8218 7000, F: +61 8 8218 7999, www.pwc.com.au
Liability limited by a scheme approved under Professional Standards Legislation.
Independent auditor’s review report to the members ofAdelaide Brighton Limited
Report on the Half-Year Financial ReportWe have reviewed the accompanying half-year financial report of Adelaide Brighton Limited (theCompany) and Adelaide Brighton Group (the consolidated entity), which comprises the consolidatedbalance sheet as at 30 June 2015, the consolidated income statement, consolidated statement ofcomprehensive income, consolidated statement of changes in equity and consolidated statement ofcash flows for the half-year ended on that date, selected explanatory notes and the directors'declaration for the consolidated entity. The consolidated entity comprises the company and theentities it controlled during that half-year.
Directors' responsibility for the half-year financial reportThe directors of the Company are responsible for the preparation of the half-year financial report thatgives a true and fair view in accordance with Australian Accounting Standards (including theAustralian Accounting Interpretations) and the Corporations Act 2001 and for such internal control asthe directors determine is necessary to enable the preparation of the half-year financial report that isfree from material misstatement whether due to fraud or error.
Auditor’s responsibilityOur responsibility is to express a conclusion on the half-year financial report based on our review. Weconducted our review in accordance with Australian Auditing Standard on Review Engagements ASRE2410 Review of a Financial Report Performed by the Independent Auditor of the Entity, in order tostate whether, on the basis of the procedures described, we have become aware of any matter thatmakes us believe that the financial report is not in accordance with the Corporations Act 2001including: giving a true and fair view of the consolidated entity’s financial position as at 30 June 2015and its performance for the half-year ended on that date; and complying with Accounting StandardAASB 134 Interim Financial Reporting and the Corporations Regulations 2001. As the auditor ofAdelaide Brighton Limited, ASRE 2410 requires that we comply with the ethical requirements relevantto the audit of the annual financial report.
A review of a half-year financial report consists of making enquiries, primarily of persons responsiblefor financial and accounting matters, and applying analytical and other review procedures. A review issubstantially less in scope than an audit conducted in accordance with Australian Auditing Standardsand consequently does not enable us to obtain assurance that we would become aware of all significantmatters that might be identified in an audit. Accordingly, we do not express an audit opinion.
IndependenceIn conducting our review, we have complied with the independence requirements of the CorporationsAct 2001.
For
per
sona
l use
onl
y

ConclusionBased on our review, which is not an audit, we have not become aware of any matter that makes usbelieve that the half-year financial report of Adelaide Brighton Limited is not in accordance with theCorporations Act 2001 including:
a) giving a true and fair view of the consolidated entity’s financial position as at 30 June 2015 and ofits performance for the half-year ended on that date;
b) complying with Accounting Standard AASB 134 Interim Financial Reporting and the CorporationsRegulations 2001.
PricewaterhouseCoopers
Kevin Reid AdelaidePartner 20 August 2015
For
per
sona
l use
onl
y