Acknowledgement of Contributing Authorshphomeview.com/zipfiles/activities.pdf · PORTABLE DATALAB...
82
PORTABLE DATAL AB ACTIVITIES SOURCEBOOK FIRMWARE SYSTEMS, INC. i Acknowledgement of Contributing Authors Alan Cadby, Math Teacher Hale School Wembley Downs Perth West Australia Colin Croft, Math Teacher St Hilda's A.S.G Mosman Park, West Australia Tom Dick, Math Professor Oregon State University Corvallis Oregon Kris Warloe, Math Teacher Cheldelin Middle School Corvallis Oregon Gary Young, Math Teacher Hale School Wembley Downs Perth West Australia Robyn Binder Firmware Systems, Inc. Corvallis Oregon Chris Coffin Grapevine Publications Corvallis Oregon
Transcript of Acknowledgement of Contributing Authorshphomeview.com/zipfiles/activities.pdf · PORTABLE DATALAB...

PORTABLE DATALAB ACTIVITIES SOURCEBOOK FIRMWARE SYSTEMS, INC. i
Acknowledgement of Contributing Authors
Alan Cadby, Math TeacherHale SchoolWembley DownsPerth West Australia
Colin Croft, Math TeacherSt Hilda's A.S.GMosman Park,West Australia
Tom Dick, Math ProfessorOregon State UniversityCorvallis Oregon
Kris Warloe, Math TeacherCheldelin Middle SchoolCorvallis Oregon
Gary Young, Math TeacherHale SchoolWembley DownsPerth West Australia
Robyn BinderFirmware Systems, Inc.Corvallis Oregon
Chris CoffinGrapevine PublicationsCorvallis Oregon


PORTABLE DATALAB ACTIVITIES SOURCEBOOK FIRMWARE SYSTEMS, INC. iii
Table of Contents
DATALAB MATH ACTIVITIES - SECTION 1.........................................................3
Descartes with One Wheel ...........................................................................................3(Pythagorean Theorem I)................................................................................................................... 3
The Horse and Descartes ..............................................................................................9(Pythagorean Theorem II) ................................................................................................................. 9
Light and Squares.......................................................................................................13(Inverse Square Law) ...................................................................................................................... 13
The Train that Left Chicago .......................................................................................19(Velocity) ....................................................................................................................................... 19
Why do Animals Huddle? ..........................................................................................23(Temperature) ................................................................................................................................. 23
DATALAB PHYSICS ACTIVITIES - SECTION 2 ..................................................29
Ben Franklin Plays Carnegie Hall...............................................................................29(Musical Notes) .............................................................................................................................. 29
Body and Sol..............................................................................................................33(Solar Energy)................................................................................................................................. 33
Doing the Wave .........................................................................................................37(Simple Harmonic Motion) ............................................................................................................. 37
Full Speed Ahead .......................................................................................................43(Acceleration)................................................................................................................................. 43
Weight Swings...........................................................................................................51(Pendulum)..................................................................................................................................... 51
DATALAB CHEMISTRY ACTIVITIES - SECTION 3 ...........................................57
Under Pressure...........................................................................................................57(Boyle’s Law) ................................................................................................................................. 57
Cold as Ice .................................................................................................................61(Freezing and Melting).................................................................................................................... 61
Is There a Warming Model? .......................................................................................65(Rate of Warming) .......................................................................................................................... 65
pHun with pH.............................................................................................................71
Pressure Cooker .........................................................................................................75(Pressure and Temperature)............................................................................................................. 75


PORTABLE DATALAB ACTIVITIES SOURCEBOOK FIRMWARE SYSTEMS, INC. 1
Introduction
This book contains classroom activities that involve the use of the Portable DataLab inconjunction with a graphing calculator. The activities are organized by subject: Math,Physics, and Chemistry. Many of the activities, however, may be used for more than onesubject.
The activities in this book provide basic information on how to set up experiments. Moredetailed instructions on how to conduct the experiments using specific calculator modelscan be found in the DataLab Companion user manuals.
Please refer to the Portable DataLab reference manual for important information on theappropriate use and safe handling of this electronic device.
For more information on educational materials for the Portable DataLab, contact:
Firmware Systems626 NW 4th StreetCorvallis, OR 97330
Phone (541)753-3617Fax (541)753-9250
www.firmwaresystems.com
Activities Source Book version 1.01 October 1999

PORTABLE DATALAB ACTIVITIES SOURCEBOOK FIRMWARE SYSTEMS, INC. 3
DATALAB MATH ACTIVITIES - SECTION 1
Date: Name: ____________________________
Descartes with One Wheel
(Pythagorean Theorem I)
Introduction
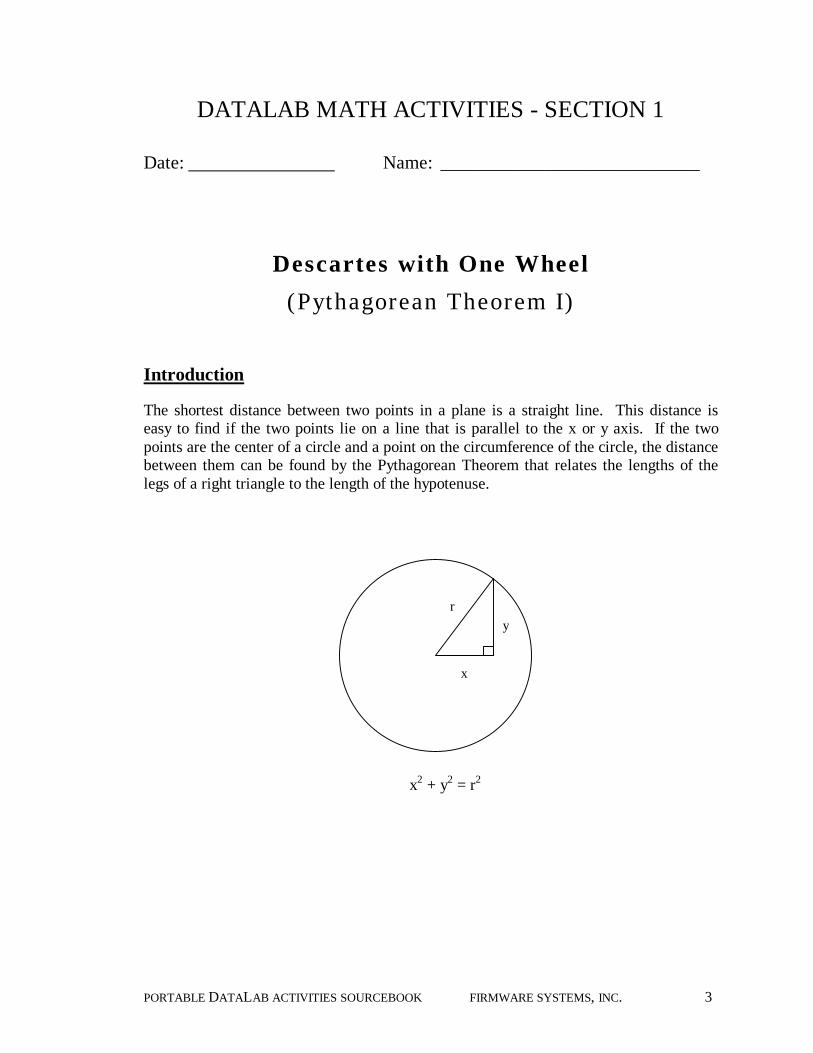
The shortest distance between two points in a plane is a straight line. This distance iseasy to find if the two points lie on a line that is parallel to the x or y axis. If the twopoints are the center of a circle and a point on the circumference of the circle, the distancebetween them can be found by the Pythagorean Theorem that relates the lengths of thelegs of a right triangle to the length of the hypotenuse.
x2 + y2 = r2
ry
x

4 PORTABLE DATALAB ACTIVITIES SOURCEBOOK FIRMWARE SYSTEMS, INC.
Equipment Required
2 Portable DataLabs*
2 motion detectors*
2 graphing calculators*, with DataLab Companion software, cable and instructions
1 metric ruler
1 dowel rod, 1/2 inch (13 mm) diameter, 18 inches (0.5 m) long
1 30 cm diameter circle made from cardboard
* If 2 sets are not available, the experiment can be done using 1 set. See ExperimentProcedure.
Experiment Setup
50 cm
MotionDetector
y
50 cmMotion
Detectorx
30 cm
Calc
Calc
DataLab
DataLab

PORTABLE DATALAB ACTIVITIES SOURCEBOOK FIRMWARE SYSTEMS, INC. 5
1. Connect the motion detectors to the DataLab(s).
2. Connect the DataLab(s) to the graphing calculator(s).
3. Place the cardboard circle 50 cm from each motion detector.
4. Set up experiment to collect displacement data in calculator.
Experiment Procedure
In this experiment the dowel rod represents Descartes' cart. Start the dowel at a pointdirectly opposite the x motion detector. The cart will follow the path of thecircumference of the circle making one complete revolution. The motion detectors willrecord the x and y coordinates of points along the path. It is important that the dowel rodbe maintained in a vertical position relative to the tabletop and move along the pathdescribed. It is suggested that the circle be placed on the floor and the motion detector(s)be placed on the edge of a table 50 cm away.
If two DataLabs, graphing calculators, and motion detectors are not available, use one setto take measurements as described above. When done collecting this first set of data (x),rotate either the circle or the DataLab set up 90 degrees and collect a second set of data(y).
Analysis and Interpretation
1. Display the data in a table using the graphing calculator. Identify the minimum andmaximum value and determine the graph scale. Enter the data points in the chartbelow.
2. What is the total length of the path followed by Descartes' cart?

6 PORTABLE DATALAB ACTIVITIES SOURCEBOOK FIRMWARE SYSTEMS, INC.
3. What do you think each of the ordered (x,y) pairs in your collected data are tellingyou? Measure the horizontal and vertical distances from each of the motion detectorsto a point on the circumference of the circle. How do these distances relate to the(x,y) coordinates for these points?
4. Change the data so that each ordered pair gives the (x,y) coordinate of a point on thecircumference of the circle so that the circle would be centered at the origin (0,0). Todo this, measure the distance from the motion detector to the center of the circle.Using the table functions in the graphing calculator, derive columns of new x and yvalues that result when the distance value is subtracted from each x and y value ofeach ordered pair. Graph the new data. How does the new graph compare with theoriginal graph?

PORTABLE DATALAB ACTIVITIES SOURCEBOOK FIRMWARE SYSTEMS, INC. 7
5. In this experiment we have adjusted the data to keep the distance from the originat 15 cm for every coordinate pair (x,y). Use the distance formula d = √((x− 0)2 +(y− 0)2) to verify that this holds true for your data. Use the power of yourcalculator to help you do this. (Put into a new column: √ (x value2 + (y value)2).

8 PORTABLE DATALAB ACTIVITIES SOURCEBOOK FIRMWARE SYSTEMS, INC.

PORTABLE DATALAB ACTIVITIES SOURCEBOOK FIRMWARE SYSTEMS, INC. 9
Date: Name: ____________________________
The Horse and Descartes
(Pythagorean Theorem II)
Introduction
The shortest distance between two points in a plane is a straight line. This distance iseasy to find if the two points lie on a line that is parallel to the x or y axis. If the twopoints, A and B, are located anyplace in the plane the distance between them can befound by applying the Pythagorean Theorem that relates the lengths of the legs of a righttriangle to the length of the hypotenuse.
The distance from C to A is x2-x1 and the distance from C to B is y2-y1. The distancefrom A to B is:
This is known as the distance formula.
B
CA
(x2, y2)
(x1, y1)
212
212 )()( yyxx −+−

10 PORTABLE DATALAB ACTIVITIES SOURCEBOOK FIRMWARE SYSTEMS, INC.
Equipment Required
2 Portable DataLabs*
2 motion detectors*
2 graphing calculators*, with DataLab Companion software, cable and instructions
1 metric ruler
1 dowel rod, 1/2 inch (13 mm) diameter, 18 inches (0.5 m) long
1 right triangle made from cardboard
* If 2 sets are not available, the experiment can be done using 1 set. See ExperimentProcedure.
Experiment Setup
A C
B
50 cm
50 cmMotionDetector
x
MotionDetector
y Calc
Calc
DataLab
DataLab

PORTABLE DATALAB ACTIVITIES SOURCEBOOK FIRMWARE SYSTEMS, INC. 11
1. Connect the motion detectors to the DataLab(s).
2. Connect the DataLabs to the graphing calculator(s).
3. Place the cardboard triangle 50 cm from each motion detector.
4. Set up experiment to collect displacement data in calculator.
Experiment Procedure
In this experiment the dowel rod represents Descartes' horse. Descartes will lead hishorse along a path that will travel from point A to point C. He will then turn 90 degreesto his left and travel from point C to point B. From point B he will turn to his left andtravel in a straight line back to point A. The motion detectors will record the x and ycoordinates of points along the trip. It is important that the dowel rod be maintained in avertical position relative to the tabletop and moved along the path described. It issuggested that the triangle be placed on the floor and the motion detector(s) be placed onthe edge of a table 50 cm away.
If two DataLabs, graphing calculators, and motion detectors are not available, use one setto take measurements as described above. When done collecting this first set of data (x),rotate either the triangle or the DataLab set up 90 degrees and collect a second set of data(y).
Analysis And Interpretation
1. Display the data in a table using the graphing calculator. Identify the minimum andmaximum value and determine the graph scale. Enter the data points in the chartbelow.
2. Use your data and the distance formula to determine the distance that Descartes ledhis horse. Measure each of the distances with a meter stick and round each distanceto the nearest tenth of a centimeter. Find the difference between the distances you

12 PORTABLE DATALAB ACTIVITIES SOURCEBOOK FIRMWARE SYSTEMS, INC.
calculated using the distance formula and the distances you measured with the meterstick. Determine the percent difference relative to the calculated distances. Howwould you describe your results?
Segment Length using dataand distance formula
Length measuringwith a meter stick
Difference PercentDifference
AC
CB
AB
3. What is the total length of the path followed by Descartes and his horse?
4. What do you think each of the ordered (x,y) pairs in your collected data are tellingyou? Measure the horizontal and vertical distances from each of the motion detectorsto points A, B, and C. How do these distances relate to the (x,y) coordinates for thesepoints?
5. Pick two points that are on the plane and are 20 cm apart but are not both on ahorizontal or vertical line and label them points A and B. Using the DataLab and thedistance formula, help Descartes determine the coordinates of a point where he couldmake his 90 degree turn. Measure the distances from Point A and Point B to the pointwhere he will make his turn to the nearest tenth of a centimeter and use thePythagorean Theorem to see how close your coordinates are to creating a righttriangle. If you do not have a right triangle, make adjustments and try again.

PORTABLE DATALAB ACTIVITIES SOURCEBOOK FIRMWARE SYSTEMS, INC. 13
Date: Name: ____________________________
Light and Squares
(Inverse Square Law)
Introduction
In this experiment we are going to derive a relationship between the intensity of lightfrom a constant source and the distance away from the light. We will also explore theinverse square law.
Equipment Required
1 Portable DataLab
1 graphing calculator, with DataLab Companion software, cable and instructions
1 light probe
1 flashlight
1 metric ruler
1 darkened pipe or dark colored posterboard (1 - 2 meters long)
1 piece of string (~ 2 meters long)
1 small toy car or similar object with wheels

14 PORTABLE DATALAB ACTIVITIES SOURCEBOOK FIRMWARE SYSTEMS, INC.
Experiment Setup
1. Connect the DataLab to the graphing calculator.
2. Set up experiment to collect displacement data in calculator.
3. Attach the flashlight to one end of the car.
4. Attach the string to the other end of the car.
Child’s Truck String
Light Probe Torch
1 – 2 m
Lined Stormwater Pipe
DataLab
Calc
PORTABLE DATALAB ACTIVITIES SOURCEBOOK FIRMWARE SYSTEMS, INC. 15
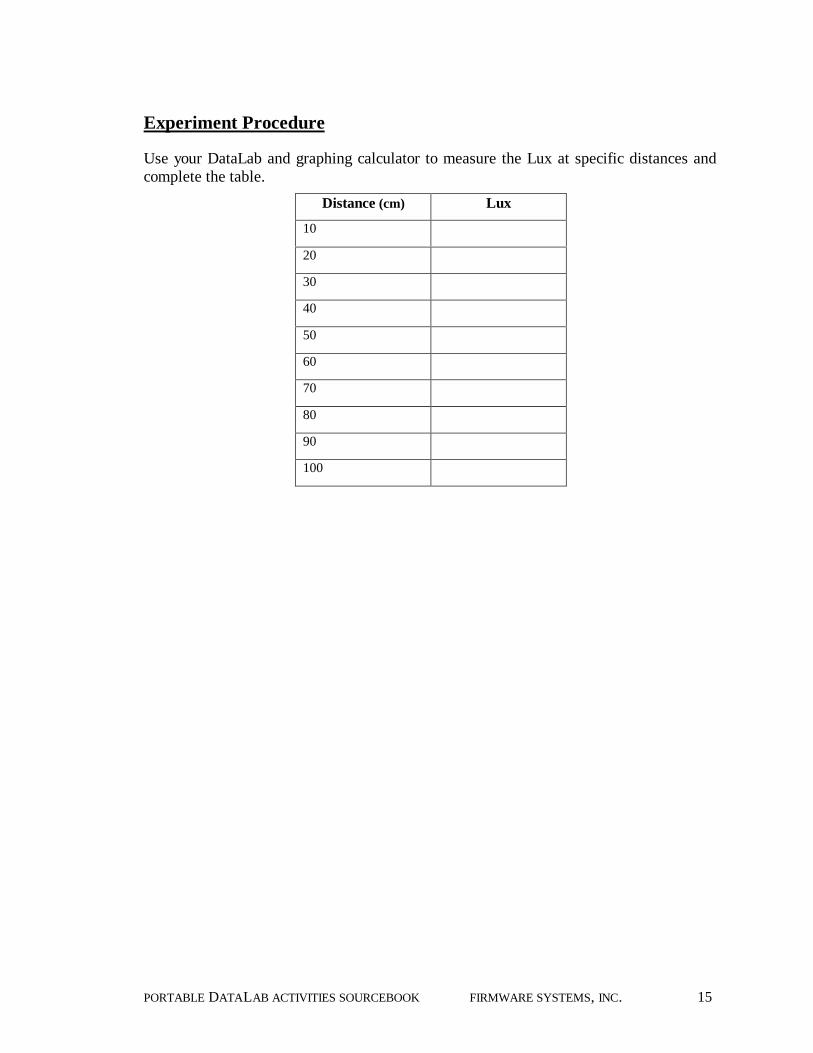
Experiment Procedure
Use your DataLab and graphing calculator to measure the Lux at specific distances andcomplete the table.
Distance (cm) Lux
10
20
30
40
50
60
70
80
90
100

16 PORTABLE DATALAB ACTIVITIES SOURCEBOOK FIRMWARE SYSTEMS, INC.
2d
CI =
Analysis and Interpretation
1. Sketch the graph of the data below and state the nature of the function(s).
2. Use your graphing calculator to find the equation that best fits the data.
The relationship we should derive is known as the Inverse Square Law:
where C is the constant luminosity, d is the distance from the light source and I the flux(intensity of light-apparent brightness).
From the function or table you should find that if the distance is doubled, the observed
intensity of light is decreased by of its original value.
Flux
distance 10 20 30 40 50 60 70 80 90 100
412
21 =

PORTABLE DATALAB ACTIVITIES SOURCEBOOK FIRMWARE SYSTEMS, INC. 17
Here is sample data:
While the fit was reasonable, it was suggested that there is likely to be an error when thelight source is too close and too far away. Following this advice, we treated the 10 cm,140 cm and the 200 cm as outliers and discounted them during the fit process. Theresulting function was a better match to our theoretical model than the first function.
Distance Lux10 68515 38220 21525 14730 10350 4060 2570 18100 8140 1200 0.5
Lux and Distance
y = 302812x-2.4007
R2 = 0.9597
0
200
400
600
800
1000
1200
1400
0 50 100 150 200 250
Distance Lux15 38220 21525 14730 10350 4060 2570 18100 8
Lux and distance
y = 93499x-2.013
R2 = 0.9976
0
50
100
150
200
250
300
350
400
450
0 20 40 60 80 100 120

18 PORTABLE DATALAB ACTIVITIES SOURCEBOOK FIRMWARE SYSTEMS, INC.
The Solar System and the Inverse Square Law
The average distance from the Earth to the Sun (149,597,870.70 km) is defined as 1Astronomical Unit (1 AV). Similarly, the average amount of solar energy per unit areareaching the Earth could be defined as 1 solar constant. Given what you have observedabout light intensity and its relation to the distance from its source, complete the tablebelow considering other planets and their distances from the Sun and answer thefollowing questions.
Source: Educator’s Guide to the Inverse Square Law( http://www.uni-geochem.gwdg.de/solar/edu/invsquar.htm)
3. How much brighter is the Sun as viewed from the planet Mercury as compared toEarth?
4. How much fainter is it at Pluto?
PLANET Distance(km) Distance(AU) Solar Energy (Solar Constants)
Mercury 57894375.95 0.387Venus 108159260.5 0.723Earth 149597870.7 1 1Mars 227837557 1.523
Jupiter 778208123.2 5.202Saturn 1426864490 9.538Uranus 2869436757 19.181Neptune 4496463198 30.057
Pluto (min) 4441560780 29.69Pluto (avg) 5900140019 39.44Pluto (max) 7358719258 49.19
A Cen 4.06906E+13 272000

PORTABLE DATALAB ACTIVITIES SOURCEBOOK FIRMWARE SYSTEMS, INC. 19
Date: Name: ____________________________
The Train that Left Chicago
(Velocity)
IntroductionThe velocity of a particle is defined as the rate at which its position changes with time.Stated mathematically:
Velocity = change in positionchange in time
The definition of velocity can be extended to the definition of the slope of a function,which is as follows (where m = slope; y2 and y1 are points on the y-axis; and x2 and x1 arepoints on the x-axis):
In this experiment we will investigate the slope of a function by relating it to the motionof a walking student.
Equipment Required
1 Portable DataLab
1 motion detector
1 graphing calculator, with DataLab Companion software, cable and instructions
12
12
xxyym
−−=

20 PORTABLE DATALAB ACTIVITIES SOURCEBOOK FIRMWARE SYSTEMS, INC.
Experiment Setup
1. Connect the motion detector to the DataLab.
2. Connect the DataLab to the calculator.
3. Set up experiment to collect displacement data in calculator.
4. Place the motion detector on a table so that there is enough room for a student to walkaway from it.
Experiment Procedure
1. Make sure that the motion detector sits flat on the table and that it is perpendicular tothe motion of the walker.
2. Position one student so that he/she is about 2 feet (0.6 m) away from the motiondetector. Make sure not to start walking fewer than 1.5 feet (0.5 m) from the detectorbecause it cannot detect motion closer than that distance.
3. When ready, start the DataLab program and have the student begin walking at aconstant rate, perpendicular to and away from the detector.
4. A graph of Distance vs. Time will be generated while the student is walking.
Repeat steps 1 to 4 but have the student walk at a non-constant rate (for example, speedup or slow down over time).
Motion Detector
DataLab
Graphing calculator
> 1.5 ft(> 0.5 m)

PORTABLE DATALAB ACTIVITIES SOURCEBOOK FIRMWARE SYSTEMS, INC. 21
Analysis and InterpretationBased on the two graphs that were generated, answer the following questions.
1. What were the total distances traveled and time spent walking during each of the twowalks? Fill in the table below.
Walk # 1 Walk # 2
Total Distance (meters)
Total Time (sec)
2. Determine the average velocity for each of the two walks.
3. What was the velocity of the walker at time = 3 seconds during the first walk?
4. How does this compare to the velocity at time = 3 seconds for the second walk?
5. The Distance vs. Time graph for the first walk (constant rate) should have been a linewith a positive slope. Describe how the student would have to walk to produce a linewith a negative slope.
6. Describe how the student would have to walk to produce a plot of a parabola.


PORTABLE DATALAB ACTIVITIES SOURCEBOOK FIRMWARE SYSTEMS, INC. 23
Date: Name: ____________________________
Why do Animals Huddle?
(Temperature)
Introduction
When it is cold many kinds of animals prefer to huddle together in a tightly knit group.Why do they do this?
Your task is to use the temperature probes and the graphing calculator to test thehypothesis that huddling together keeps animals warmer or why we should place all ofour frozen groceries bought from the supermarket together.
Equipment Required
1 Portable DataLab
3 temperature probes
1 graphing calculator, with DataLab Companion software, cable and instructions
8 test tubes
2 beakers to hold test tubes
2 or 3 rubber bands
warm tap water (approximately 37 °C to simulate body temperature)

24 PORTABLE DATALAB ACTIVITIES SOURCEBOOK FIRMWARE SYSTEMS, INC.
Data Logger
Lone animal
outeranimal
central animal
temperature probe
elastic bands
Experiment Setup
1. Connect the three temperature probes to the DataLab.
2. Connect the DataLab to the graphing calculator.
3. Set up experiment to collect temperature data in calculator.
4. Secure seven of the test tubes with the rubber bands so that one of the test tubes is inthe center and place them in one of the beakers.
5. Place the remaining test tube in the other beaker.
6. Place one temperature probe in the lone test tube, another in the center tube, andanother in one of the outer test tubes. Keep track of which channel each probe isconnected to.
Experiment Procedure
1. Fill each test tube with warm water.
2. Collect temperature data from each of the 3 temperature probes. Collect 25 samplesat 2 minute intervals (50 samples total).

PORTABLE DATALAB ACTIVITIES SOURCEBOOK FIRMWARE SYSTEMS, INC. 25
f(t)
t 30 60 90 120 150
10
20
30
40
Analysis and InterpretationFrom the data collected, answer the following questions. In your responses you will needto use the collected data as supporting evidence.
1. From your results plot 4 suitable data points to show the general shape of the threecooling situations.
2. What type of function best describes the shape of the three graphs?
3. What does the graph tell you about the temperature of the lone animal?
4. What does the graph tell you about the temperature of the huddling animals?
26 PORTABLE DATALAB ACTIVITIES SOURCEBOOK FIRMWARE SYSTEMS, INC.
5. How does each graph show which animal cooled fastest?
6. Does huddling keep an animal warmer? If so, explain why you think this happens.
7. Describe the difference between the cooling of the lone animal with that of theoutside animal.
8. Find an equation that best fits the three groups of data.
9. Predict the temperatures for the three situations at t = 71 and t = 140 minutes.
10. At what times will the temperature be 17.001ºC?

PORTABLE DATALAB ACTIVITIES SOURCEBOOK FIRMWARE SYSTEMS, INC. 27


PORTABLE DATALAB ACTIVITIES SOURCEBOOK FIRMWARE SYSTEMS, INC. 29
DATALAB PHYSICS ACTIVITIES - SECTION 2
Date: Name: ____________________________
Ben Franklin Plays Carnegie Hall
(Musical Notes)
IntroductionMany simple tunes can be played within an octave. Some familiar tunes are Row RowRow your boat, Three Blind Mice, or Happy Birthday to You. This experiment allowsyou to explore sound waves produced by musical notes. Your goal is to replicate the 8notes in a major scale octave and play a musical tune.
Equipment Required
1 Portable DataLab
1 graphing calculator, with DataLab Companion software, cable and instructions
1 tuning fork for middle C or A (440cps) and a rubber hammer
Table of frequencies for notes Middle C to C:C-261.626D-293.183E-329.628F-349.228G-391.995A-440B-493.883C-523.251
8 soda pop bottles (twelve to sixteen ounce) and straws, or 8 water goblets
4 liters water

30 PORTABLE DATALAB ACTIVITIES SOURCEBOOK FIRMWARE SYSTEMS, INC.
Experiment Setup
1. Connect the Portable DataLab to the graphing calculator.
2. Set up experiment to collect sound wave data in calculator. Make sure that thesample interval is 0.01 sec or lower.
3. Strike the tuning fork with the rubber hammer and hold the vibrating fork close to themicrophone. Immediately start the DataLab to collect sound wave data.
4. Determine the period of the wave and record it. Also record the frequency listed onthe tuning fork.
5. Arrange eight 12-16 oz soda pop bottles or water goblets on a table.
Experiment Procedure
1. Partially fill one bottle/goblet with water.
2. Create a tone by gently blowing air through a straw across the top of the bottle orrubbing a wet finger around the rim of the top of the goblet.
3. Run the program to collect the data to determine the frequency of the note.
4. Compare the frequency with the desired frequency from the frequency table andadjust the amount of water in the bottle/goblet until the desired frequency is obtained.

PORTABLE DATALAB ACTIVITIES SOURCEBOOK FIRMWARE SYSTEMS, INC. 31
Sample Data
The distance between any two consecutive maximum or minimum values is the time forone period. The frequency is periods per second so 1/time for one period equals thefrequency. In this example the difference between two consecutive maximum values is.00145 and the frequency is 1/.00145 or about 690 periods per second.
Analysis and Interpretation1. Describe the relationship between period and frequency as determined by the
tuning fork experiment.
2. Two notes harmonize producing a pleasing sound when the ratio of theirfrequencies is an integer or a rational number. Determine if pairs of your notes

32 PORTABLE DATALAB ACTIVITIES SOURCEBOOK FIRMWARE SYSTEMS, INC.
produce a pleasing sound when played at the same time and determine the ratio ofthe frequencies.
3. Create a frequency vs. period graph. Based on this graph, describe therelationship between frequency and period.
4. Measure and graph the height of the air column compared to its frequency foreach note. What does the graph look like?

PORTABLE DATALAB ACTIVITIES SOURCEBOOK FIRMWARE SYSTEMS, INC. 33
Date: Name: ____________________________
Body and Sol
(Solar Energy)
Introduction
Solar energy and making use of the sun to heat homes has been a topic of discussionduring the last half of the 20th century. Heating our homes with the rays of the sun wouldcertainly be a good use of a natural resource. We need, however, a means of storing theenergy from the sun. What resources do we have to capture this energy and prolong itseffectiveness for the greatest amount of time?
This experiment will allow you to determine the heat retention of collectors of solarenergy. This experiment involves constructing a building that is capable of capturingsolar rays, selecting suitable energy collectors and collecting temperature data over time.
Equipment Required
1 Portable DataLab
1 temperature probe and cable
1 graphing calculator, with DataLab Companion software, cable and instructions
2 or more solar collectors
1 heat lamp
building

34 PORTABLE DATALAB ACTIVITIES SOURCEBOOK FIRMWARE SYSTEMS, INC.
Experiment Setup
1. Solar collectors may be made with white PVC or black PBS plastic pipe 5 to 8 cm indiameter and filled with liquid or solid material. The pipe should be capped at bothends with plastic caps using the appropriate glue. All of the collectors should havethe same volume to compare their effectiveness.
2. The building should be designed so that it has a volume of three to four cubic feet(.08 to .1 cubic meters), an insulation factor, windows to allow the solar energyaccess to the collector and a means of closing and insulating the windows to theinterior of the building.
3. Place the solar collector in the building.
4. Place the heat lamp so that the heat will radiate into the building and onto the solarcollector.
5. Place the temperature probe in the building and connect the probe to the DataLab.
6. Set up experiment to collect temperature data in calculator.
Experiment Procedure
1. Record the initial temperature in the interior of the building and the exteriortemperature.
2. Apply heat to the closed building through the windows with the heat lamp for 30minutes.
3. Cover the windows of the building as if closing the drapes.
4. Record the new interior temperature and the heat gain.
5. Run the program to collect temperatures at one minute intervals for 60 minutes
6. Repeat this procedure using a different solar collector.

PORTABLE DATALAB ACTIVITIES SOURCEBOOK FIRMWARE SYSTEMS, INC. 35
Sample Data
Analysis and Interpretation1. Create a scatter plot comparing temperature to time for each collector. Describe
the shape of each graph.
2. Describe how the rate of heat loss changes over time for each collector.
3. Describe how the color of the collector affects its effectiveness in collecting andretaining heat.

36 PORTABLE DATALAB ACTIVITIES SOURCEBOOK FIRMWARE SYSTEMS, INC.
4. Develop a mathematical model that fits the data in each graph.
5. Based on your observations and data, which factors influence the effectiveness ofthe heat collectors you created?
6. Based on your observations and data, which collector would you recommend to aprospective purchaser and why?
PORTABLE DATALAB ACTIVITIES SOURCEBOOK FIRMWARE SYSTEMS, INC. 37
Date: Name: ____________________________
Doing the Wave
(Simple Harmonic Motion)
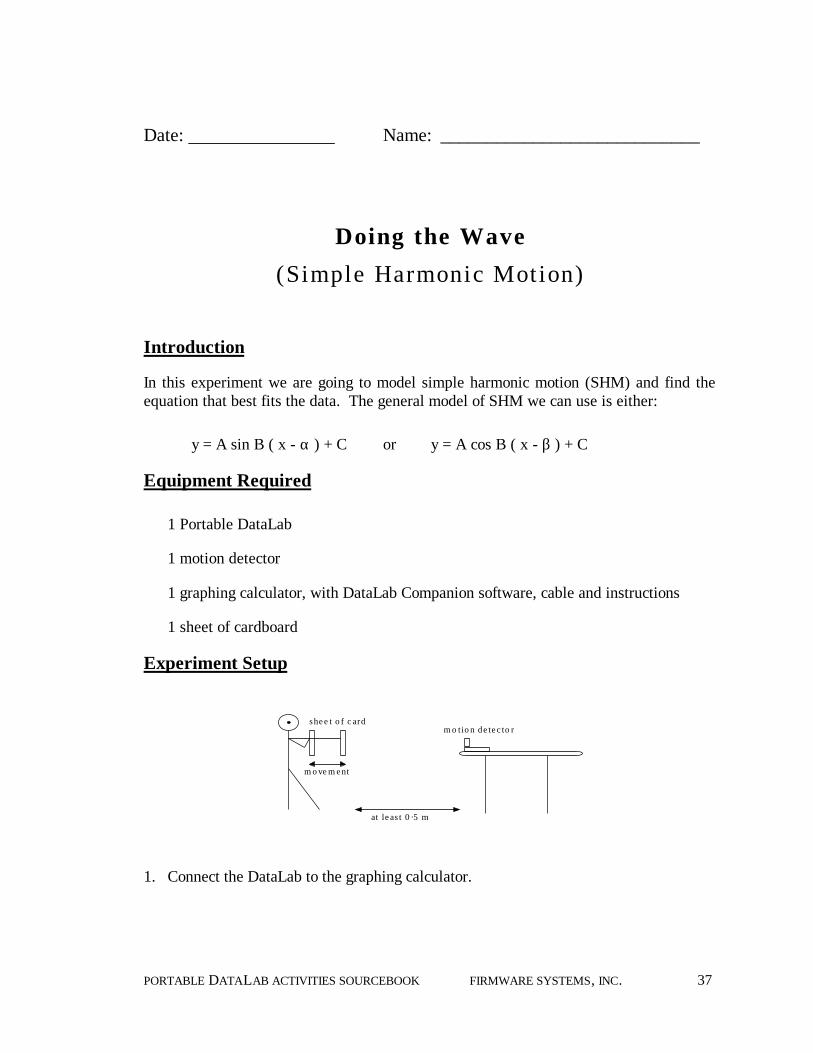
Introduction
In this experiment we are going to model simple harmonic motion (SHM) and find theequation that best fits the data. The general model of SHM we can use is either:
y = A sin B ( x - α ) + C or y = A cos B ( x - β ) + C
Equipment Required
1 Portable DataLab
1 motion detector
1 graphing calculator, with DataLab Companion software, cable and instructions
1 sheet of cardboard
Experiment Setup
m o tio n de te c to rshee t o f c ard
m o ve m ent
at le as t 0 ·5 m
1. Connect the DataLab to the graphing calculator.
38 PORTABLE DATALAB ACTIVITIES SOURCEBOOK FIRMWARE SYSTEMS, INC.
Connect the motion detector to the DataLab.
Set up experiment to collect displacement data in calculator.
Experiment Procedure
A student standing at least 0.5 meters from the motion detector with arms fully extendedin front of them will create the motion. The student will extend the arms, letting themdrop (swing) downward and then back up again at a regular pace to simulate the motionof a pendulum/spring. It is suggested that records be taken for 5 seconds at every 0.05-second, that is 100 records.
After plotting and saving the graph of the motion data you are in a position to answer thefollowing questions.
Analysis and Interpretation
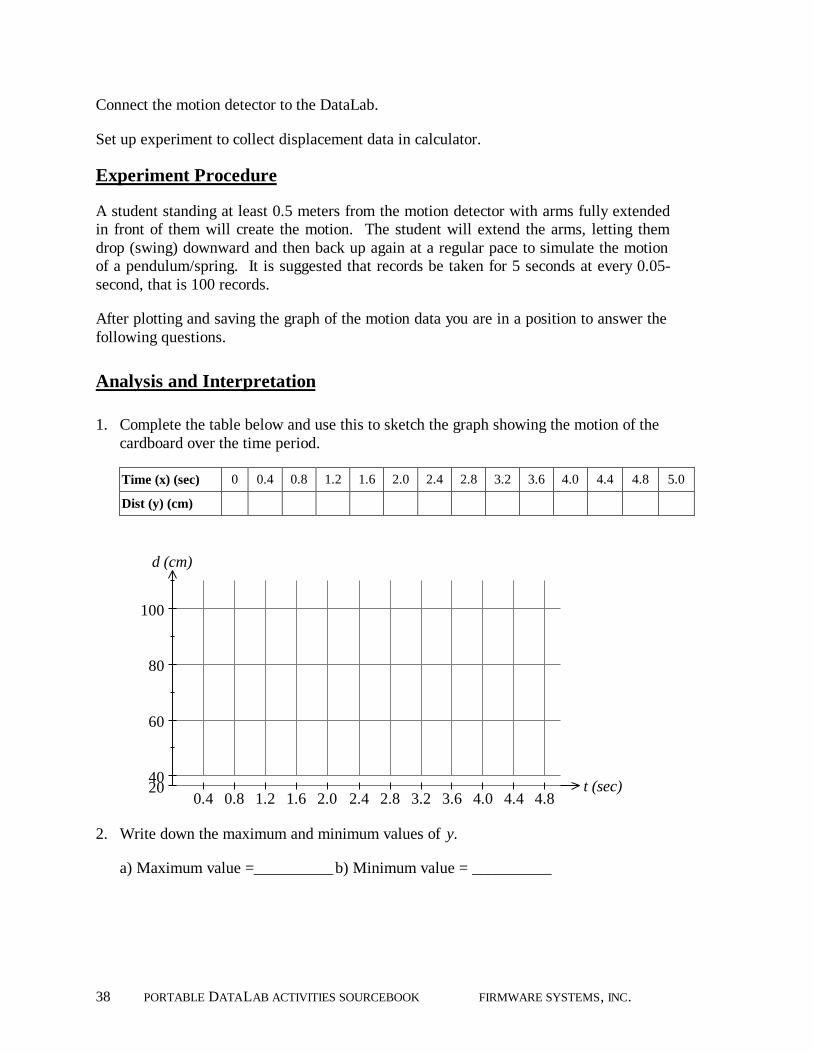
1. Complete the table below and use this to sketch the graph showing the motion of thecardboard over the time period.
Time (x) (sec) 0 0.4 0.8 1.2 1.6 2.0 2.4 2.8 3.2 3.6 4.0 4.4 4.8 5.0
Dist (y) (cm)
d (cm)
t (sec)0.4 0.8 1.2 1.6 2.0 2.4 2.8 3.2 3.6 4.0 4.4 4.8
20 40
60
80
100
2. Write down the maximum and minimum values of y.
a) Maximum value =__________b) Minimum value = __________

PORTABLE DATALAB ACTIVITIES SOURCEBOOK FIRMWARE SYSTEMS, INC. 39
3. What do these two values represent in the experiment?
4. The amplitude of the motion, A, can be calculated by finding half of the differencebetween the maximum and minimum values of y.
A = 0.5 (maxvalue - minvalue) ∴ A =_____________
5. The value of C, the vertical shift, can be found by subtracting A from the maximumvalue of y. (or adding A to the minimum value)
C = maxvalue – A ∴ C=______________
6. The value of B is related to the period, P, of the motion by the equation.
B2
Pπ= or
B28.6
P =
Write down the value of the period ____________________
Write down the value of B ____________________
7. The value of α is known as the phase shift and it is related to the movement left orright of the function. It is calculated by finding the distance particular points havebeen moved left or right. Use the maximum points to find the value of the movement.An example is given on the following page:

40 PORTABLE DATALAB ACTIVITIES SOURCEBOOK FIRMWARE SYSTEMS, INC.
y
x1 2 3 4 5
10
20
30
40
50
60
70
80
90
100
phase shiftof -1·2
y= 40sin 2x +60 y = 40 sin 2(x - 1·2) +60
A sin graph showing a phase shift of -1·2
8. Draw the function y = A sin Bx + C using your values of A, B and C. Use the cursorkeys to find the distance this function has to be moved to the right to match the traceof the motion. This distance is the value of α.
α = ___________________
9. Use all your values to write down the equation of motion in the form
y = A sin B ( x - α ) + C
y = _________________________________
10. Place the above function into your calculator’s curve-fitting tool and compare it withthe collected data. Comment on any similarities or differences.
11. In an earlier experiment David produced the following graph.
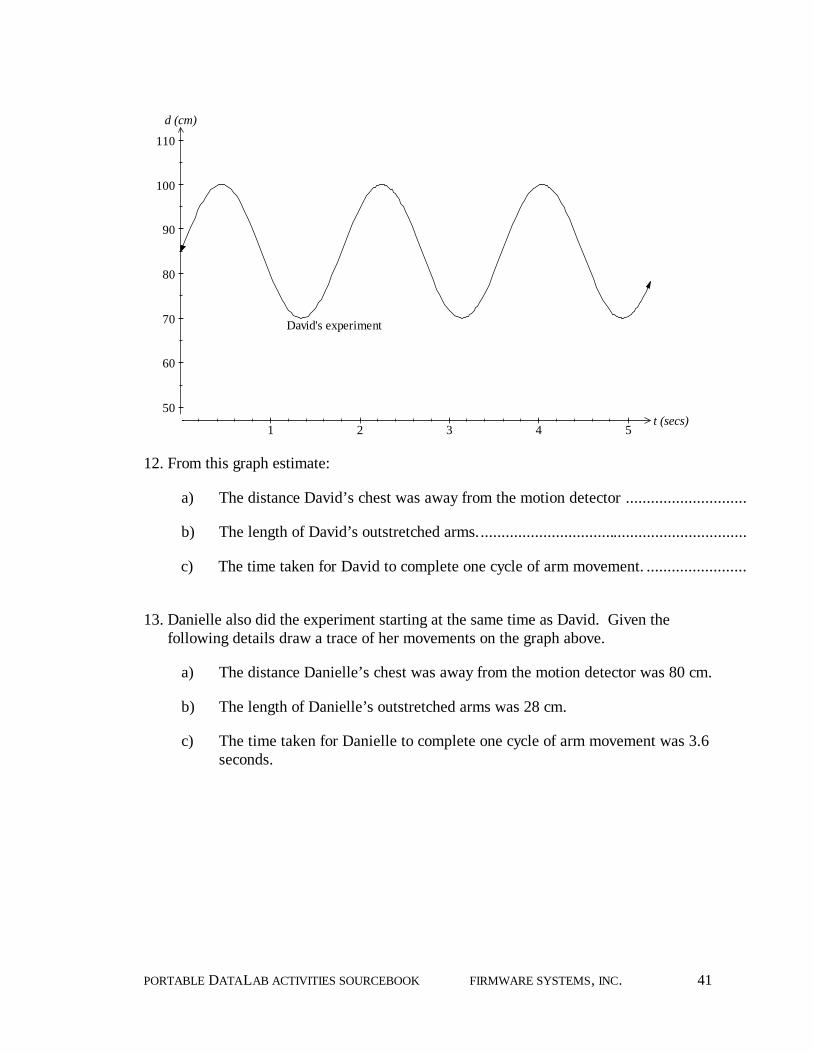
PORTABLE DATALAB ACTIVITIES SOURCEBOOK FIRMWARE SYSTEMS, INC. 41
d (cm)
t (secs)1 2 3 4 5
10 20 30 40 50
60
70
80
90
100
110
David's experiment
12. From this graph estimate:
a) The distance David’s chest was away from the motion detector .............................
b) The length of David’s outstretched arms.................................................................
c) The time taken for David to complete one cycle of arm movement. ........................
13. Danielle also did the experiment starting at the same time as David. Given thefollowing details draw a trace of her movements on the graph above.
a) The distance Danielle’s chest was away from the motion detector was 80 cm.
b) The length of Danielle’s outstretched arms was 28 cm.
c) The time taken for Danielle to complete one cycle of arm movement was 3.6seconds.


PORTABLE DATALAB ACTIVITIES SOURCEBOOK FIRMWARE SYSTEMS, INC. 43
Date: Name: ____________________________
Full Speed Ahead
(Acceleration)
Introduction
Acceleration is defined as the rate of change of velocity, i.e. tva
∆∆= .
Velocity is measured in meters per second (ms-1), therefore acceleration is measured in
sms 1−
or meters per second per second (ms-2). An acceleration of 4 ms-2 means that an
object's velocity changes by 4ms-1 for every second it undergoes that acceleration.
If an object's initial velocity is 10 ms-1 and it undergoes a constant acceleration of 4ms -2
then its velocity will change from 10 ms-1 to 14ms-1 in the first second, 14 ms-1 to 18 ms-
1
in the second second and so on.
This experiment looks at the motion of an object undergoing constant acceleration. Theobject is allowed to roll down an incline and its displacement is recorded using a motiondetector. The data collected is modeled by an algebraic function linking displacement (s)and time (t).
44 PORTABLE DATALAB ACTIVITIES SOURCEBOOK FIRMWARE SYSTEMS, INC.
Equipment Required
1 Portable DataLab
1 motion sensor
1 graphing calculator, with DataLab Companion software, cable and instructions
1 small toy car or similar object with wheels
1 flat board (ramp)
1 block or brick to elevate the ramp
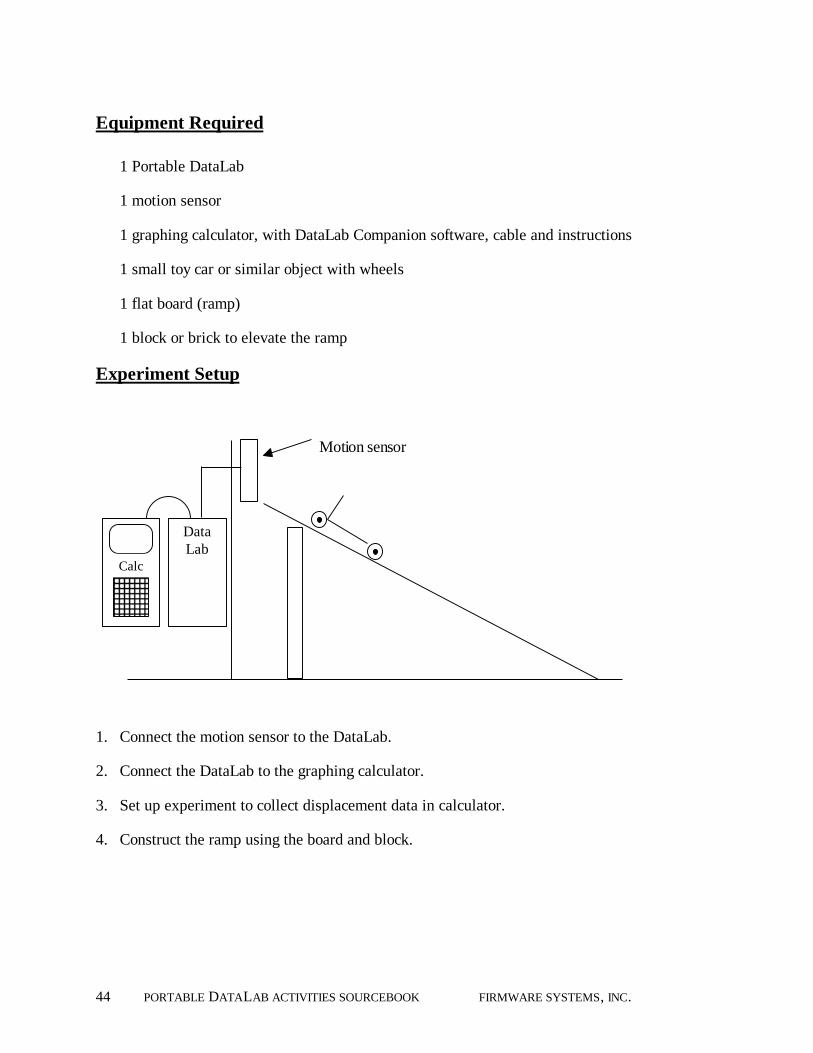
Experiment Setup
Motion sensor
DataLoggerCalc.
1. Connect the motion sensor to the DataLab.
2. Connect the DataLab to the graphing calculator.
3. Set up experiment to collect displacement data in calculator.
4. Construct the ramp using the board and block.
Calc
DataLab
PORTABLE DATALAB ACTIVITIES SOURCEBOOK FIRMWARE SYSTEMS, INC. 45
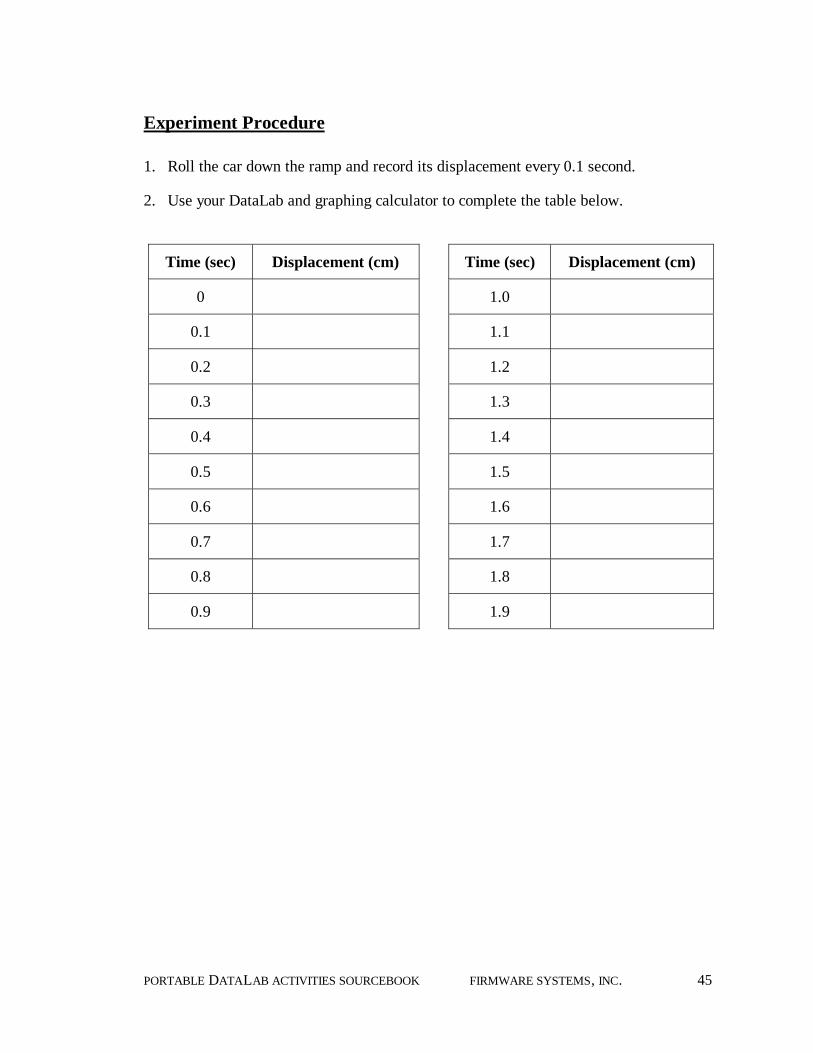
Experiment Procedure
1. Roll the car down the ramp and record its displacement every 0.1 second.
2. Use your DataLab and graphing calculator to complete the table below.
Time (sec) Displacement (cm) Time (sec) Displacement (cm)
0 1.0
0.1 1.1
0.2 1.2
0.3 1.3
0.4 1.4
0.5 1.5
0.6 1.6
0.7 1.7
0.8 1.8
0.9 1.9

46 PORTABLE DATALAB ACTIVITIES SOURCEBOOK FIRMWARE SYSTEMS, INC.
From your table sketch the resulting graph on the axes below.
Analysis and Interpretation
1. Consider the shape of the graph and state the nature of the function(s) this graphcould represent. It may be necessary to delete some of the data at the beginning whenthe object was being released and at the end when it had stopped.
Displacement
Time0.5 1.0 1.5 2.0 2.5
50
100
150
200
250

PORTABLE DATALAB ACTIVITIES SOURCEBOOK FIRMWARE SYSTEMS, INC. 47
2. The data could be modeled by a quadratic function where s = At2 + Bt + C. Fit aquadratic function to the data.
3. Explain what C represents.
4. This quadratic function links displacement and time, that is s = f(t). How do we findan equation that links velocity and time? What is this equation?
5. The function obtained in question 4 links velocity with time, is linear and of the formv = 2At + B. What does B represent?
6. Why is the initial velocity not zero?

48 PORTABLE DATALAB ACTIVITIES SOURCEBOOK FIRMWARE SYSTEMS, INC.
7. How is acceleration found from the equation linking velocity and time? Find anexpression for the acceleration.
8. What is the constant acceleration undergone by the object rolling down the incline?
9. Write an expression for displacement (s) in terms of the initial velocity (u),acceleration (a), time (t) and the initial displacement (s0).
10. If we wanted to adjust the data to have the initial velocity equal zero, what wouldhave to be done to the data?
PORTABLE DATALAB ACTIVITIES SOURCEBOOK FIRMWARE SYSTEMS, INC. 49
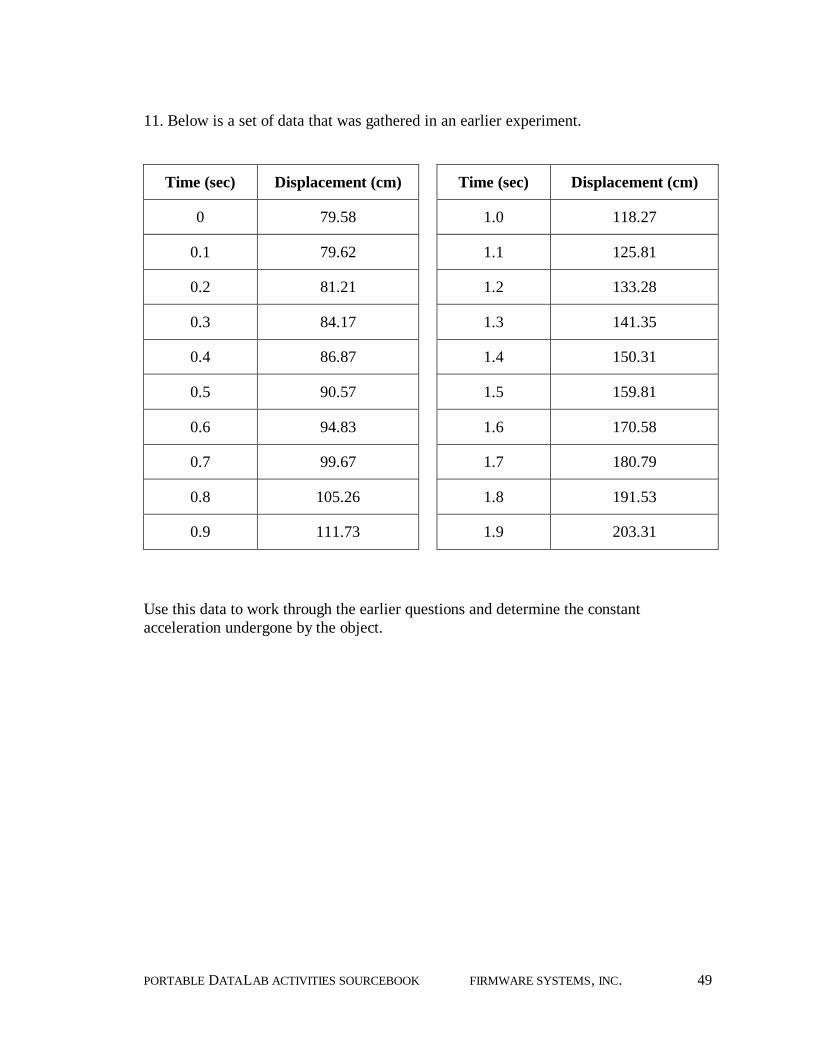
11. Below is a set of data that was gathered in an earlier experiment.
Time (sec) Displacement (cm) Time (sec) Displacement (cm)
0 79.58 1.0 118.27
0.1 79.62 1.1 125.81
0.2 81.21 1.2 133.28
0.3 84.17 1.3 141.35
0.4 86.87 1.4 150.31
0.5 90.57 1.5 159.81
0.6 94.83 1.6 170.58
0.7 99.67 1.7 180.79
0.8 105.26 1.8 191.53
0.9 111.73 1.9 203.31
Use this data to work through the earlier questions and determine the constantacceleration undergone by the object.

50 PORTABLE DATALAB ACTIVITIES SOURCEBOOK FIRMWARE SYSTEMS, INC.
PORTABLE DATALAB ACTIVITIES SOURCEBOOK FIRMWARE SYSTEMS, INC. 51
Date: Name: ____________________________
Weight Swings
(Pendulum)
IntroductionA pendulum at rest exerts a normal force equal to its weight. When a pendulum is inmotion, the normal force varies with the swing of the pendulum. In this experiment, youwill investigate the normal force as a function of time, the angle the pendulum travelsthrough, and the length of the pendulum.
Equipment Required
1 Portable DataLab
1 Vernier force detector, with stand
1 graphing calculator, with DataLab Companion software, cable and instructions
1 pendulum: a 50-cm string with a 50-gm weight
1 protractor
52 PORTABLE DATALAB ACTIVITIES SOURCEBOOK FIRMWARE SYSTEMS, INC.
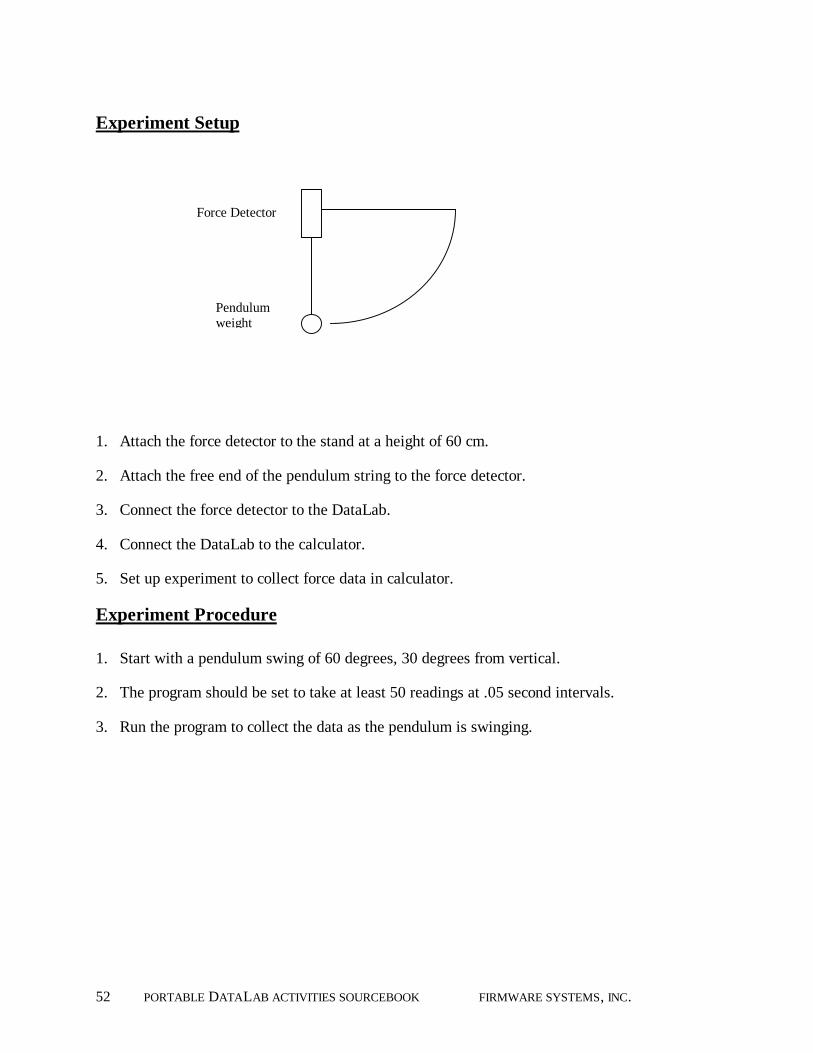
Experiment Setup
1. Attach the force detector to the stand at a height of 60 cm.
2. Attach the free end of the pendulum string to the force detector.
3. Connect the force detector to the DataLab.
4. Connect the DataLab to the calculator.
5. Set up experiment to collect force data in calculator.
Experiment Procedure
1. Start with a pendulum swing of 60 degrees, 30 degrees from vertical.
2. The program should be set to take at least 50 readings at .05 second intervals.
3. Run the program to collect the data as the pendulum is swinging.
Force Detector
Pendulumweight
PORTABLE DATALAB ACTIVITIES SOURCEBOOK FIRMWARE SYSTEMS, INC. 53
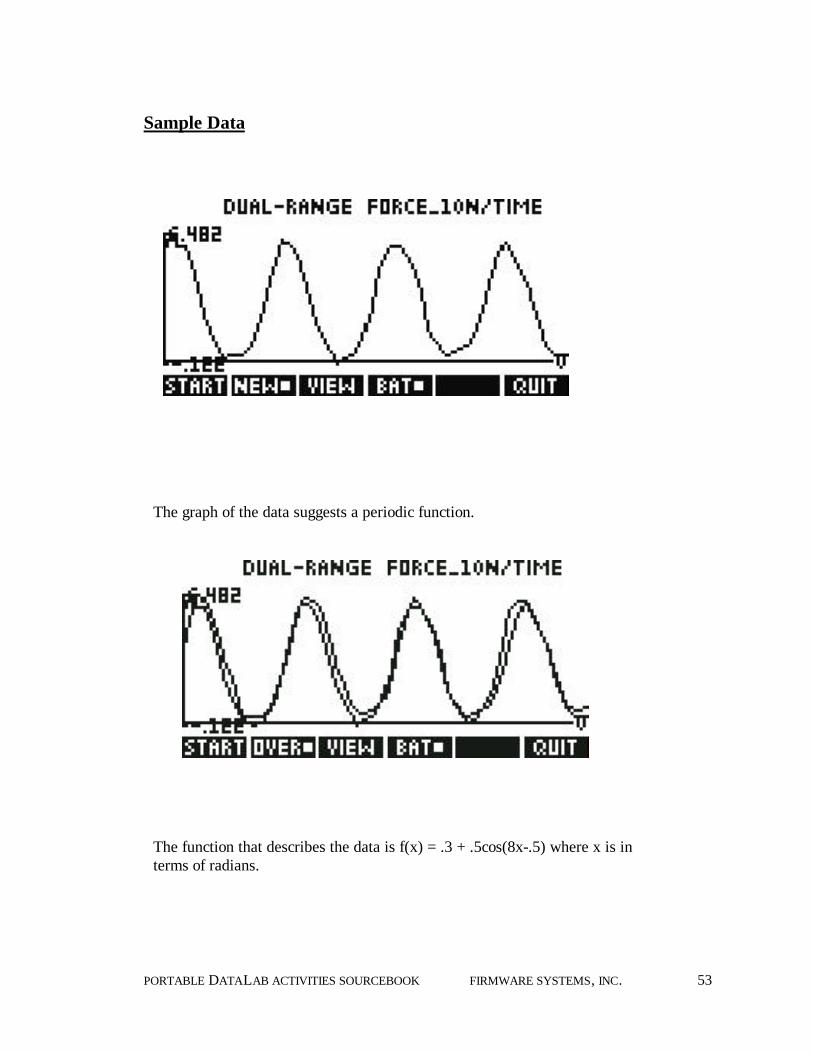
Sample Data
The graph of the data suggests a periodic function.
The function that describes the data is f(x) = .3 + .5cos(8x-.5) where x is interms of radians.

54 PORTABLE DATALAB ACTIVITIES SOURCEBOOK FIRMWARE SYSTEMS, INC.
Analysis and Interpretation
1. Where in the swing does the normal force reach a minimum?
2. Where in the swing does the normal force reach a maximum?
3. Define a function that matches the data.
4. Develop a table that shows the magnitude of the normal force relative to the angleof the pendulum throughout the swing phase of the pendulum.

PORTABLE DATALAB ACTIVITIES SOURCEBOOK FIRMWARE SYSTEMS, INC. 55
5. Develop a table that shows the magnitude of the normal force at various anglepositions of the pendulum throughout its swing.
Position (°)off vertical
Normal force(g)
Position (°)off vertical
Normal force(g)
Position (°)off vertical
Normal force(g)
6. What function describing the pendulum motion matches your data?


PORTABLE DATALAB ACTIVITIES SOURCEBOOK FIRMWARE SYSTEMS, INC. 57
DATALAB CHEMISTRY ACTIVITIES - SECTION 3
Date: Name: ____________________________
Under Pressure
(Boyle’s Law)
Introduction
This experiment looks at the relationship between pressure and volume. Boyle’s Lawstates that, at constant temperature, the volume of a given mass of gas is inverselyproportional to the pressure upon the gas. Stated mathematically, Boyle's law takes thefollowing form:
Where V = volume, P = pressure and k = a constant.
Equipment Required1 Portable DataLab
1 Vernier pressure sensor
1 graphing calculator, with DataLab Companion software, cable and instructions
1 syringe with a capacity of 20 cc (cm3) or greater
PkV 1×=
58 PORTABLE DATALAB ACTIVITIES SOURCEBOOK FIRMWARE SYSTEMS, INC.
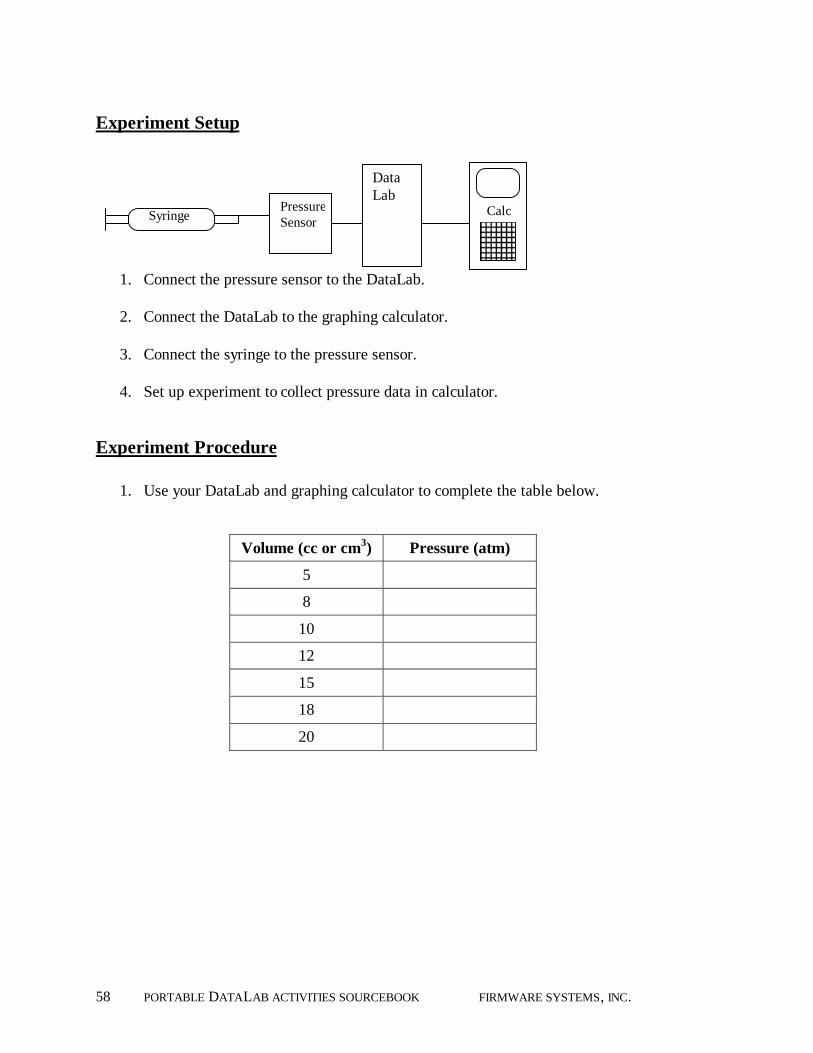
CalcSyringePressureSensor
DataLab
Experiment Setup
1. Connect the pressure sensor to the DataLab.
2. Connect the DataLab to the graphing calculator.
3. Connect the syringe to the pressure sensor.
4. Set up experiment to collect pressure data in calculator.
Experiment Procedure
1. Use your DataLab and graphing calculator to complete the table below.
Volume (cc or cm3) Pressure (atm)
5
8
10
12
15
18
20

PORTABLE DATALAB ACTIVITIES SOURCEBOOK FIRMWARE SYSTEMS, INC. 59
2. From your table sketch the resulting graph on the axes below.
Analysis and Interpretation
1. By consideration of the shape of the graph, state the nature of the function(s) thisgraph could represent.
2. Find the equation of f(x). Does it follow the pattern of Boyle's Law?
Pressure
Volume 5 10 15 20 25
5
10
15
20
25
30
35
40
45
50
55
60
60 PORTABLE DATALAB ACTIVITIES SOURCEBOOK FIRMWARE SYSTEMS, INC.
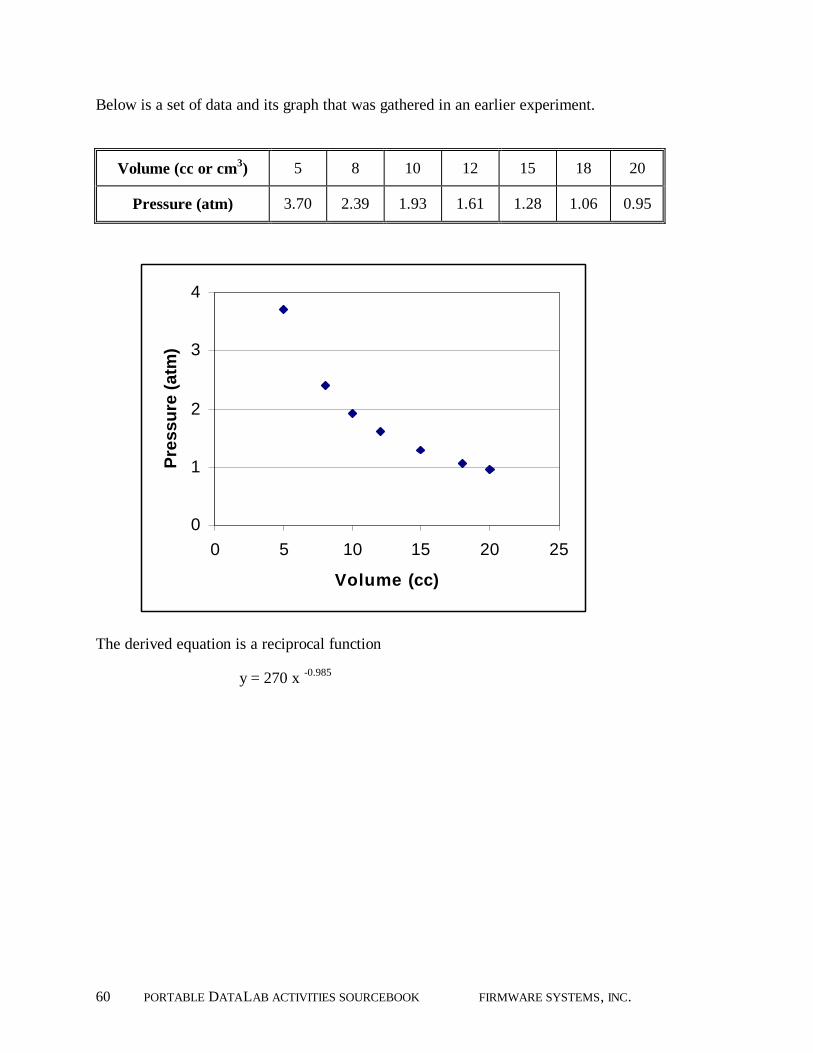
Below is a set of data and its graph that was gathered in an earlier experiment.
Volume (cc or cm3) 5 8 10 12 15 18 20
Pressure (atm) 3.70 2.39 1.93 1.61 1.28 1.06 0.95
The derived equation is a reciprocal function
y = 270 x -0.985
0
1
2
3
4
0 5 10 15 20 25
Volume (cc)
Pre
ssur
e (a
tm)

PORTABLE DATALAB ACTIVITIES SOURCEBOOK FIRMWARE SYSTEMS, INC. 61
Date: Name: ____________________________
Cold as Ice
(Freezing and Melting)
Introduction
The freezing and melting temperatures of substances are defining physical characteristics.The state in which a substance exists is largely dependent on the balance between thekinetic energies of its particles and the bonding forces of its particles.
Kinetic energy tends to keep the particles moving, whereas bonding forces tend to pullthem together. With decreasing temperature, particles move more slowly. If thetemperature keeps decreasing, eventually the bonding forces may exceed the kineticenergies of the particles and a liquid becomes a solid (or a gas becomes a liquid).Conversely, with increasing temperature, kinetic energy may eventually exceed thebonding forces and a solid becomes a liquid (or a liquid becomes a gas).
In this experiment you will monitor the temperature of a sample of water as it is frozenand then melted. The freezing and melting temperatures of water will be determinedfrom the collected data.
Equipment Required1 Portable DataLab
1 temperature probe and cable
1 graphing calculator, with DataLab Companion software, cable and instructions
1 ring stand and utility clamp
1 500 ml beaker and 1 graduated cylinder
1 stirring rod

62 PORTABLE DATALAB ACTIVITIES SOURCEBOOK FIRMWARE SYSTEMS, INC.
1 test tube
water, salt, ice
Experiment Setup
1. Connect the temperature probe to the DataLab.
2. Connect the DataLab to the graphing calculator.
3. Set up experiment to collect temperature data in calculator.
Experiment Procedure
A. Freezing Point
1. Put about 100 ml of tap water and 4-6 ice cubes into the 500 ml beaker. Place thebeaker on the ring stand.
2. Using the graduated cylinder, measure 5 ml of tap water and transfer it into thetest tube. Position the test tube above the beaker and clamp it onto the ring stand.
Temperature Probe - Tochannel 1

PORTABLE DATALAB ACTIVITIES SOURCEBOOK FIRMWARE SYSTEMS, INC. 63
3. Place the temperature probe in the test tube so that its tip is in the water. Thenconnect the temperature probe to the DataLab.
4. Load the DataLab Companion software and turn on the DataLab. Immediatelylower the test tube into the ice bath.
5. Record the temperature of the water in the test tube every 10 seconds for 15minutes (90 readings).
6. Right after lowering the test tube into the beaker, add 4-5 spoons of salt to thebeaker and mix with the stirring rod.
7. Continue stirring during the data collection and replace any melted ice with freshcubes. After about 10 minutes, the water in the test tube should begin to freeze.At this point, do not move the temperature probe; allow it to freeze in the ice.
8. View the plot of temperature vs. time on the graphing calculator. The region onthe plot that is flat is the freezing temperature of the water. Record this value.
B. Melting Point
1. Start the DataLab again and begin collecting data.
2. Immediately raise the test tube up out of the beaker and re-secure it to the ringstand.
3. Pour out the saltwater mixture from the beaker and replace with 300 ml of warmtap water. After 72 records have been collected (12 minutes have passed), lowerthe test tube into the beaker containing the warm water. Continue to collect datafor another 36 minutes.
4. View the plot of temperature vs. time on the graphing calculator. The region onthe plot that is flat is the melting temperature of the water. Record this value.
Analysis and Interpretation
1. The freezing point of the water was °C.
The melting point of the water was °C.

64 PORTABLE DATALAB ACTIVITIES SOURCEBOOK FIRMWARE SYSTEMS, INC.
2. Explain the relationship between the freezing point and the melting point values.
3. Why do you think this relationship exists?

PORTABLE DATALAB ACTIVITIES SOURCEBOOK FIRMWARE SYSTEMS, INC. 65
Date: Name: ____________________________
Is There a Warming Model?
(Rate of Warming)
Introduction
Most of us have heard of Newton’s Law of Cooling, but is there a Newton’s Law ofWarming? In this experiment we are going to measure the rate of warming of cooledwater which is contained in a polystyrene calorimeter.
During the experiment the room temperature needs to be monitored and if possible thisshould be maintained at a constant temperature.
Equipment Required
1 Portable DataLab
2 temperature probes
1 graphing calculator, with DataLab Companion software, cable and instructions
1 polystyrene calorimeter
ice water

66 PORTABLE DATALAB ACTIVITIES SOURCEBOOK FIRMWARE SYSTEMS, INC.
PolystyreneCalorimeter
Temperature Probes
Calc
DataLab
Experiment Setup
1. Connect the two temperature probes to the DataLab.
2. Connect the DataLab to the graphing calculator.
3. Set up experiment to collect temperature data in calculator.
4. Fill the calorimeter with ice water and place one of the temperature probes in it.

PORTABLE DATALAB ACTIVITIES SOURCEBOOK FIRMWARE SYSTEMS, INC. 67
Experiment Procedure
1. Record the room temperature.
2. Use your DataLab and graphing calculator to complete the table below for thetemperature in the calorimeter.
Time (min) Temperature (°C) Time (min) Temperature (°C)0 655 7010 7515 8020 8525 9030 9535 10040 10545 11050 11555 12060 125

68 PORTABLE DATALAB ACTIVITIES SOURCEBOOK FIRMWARE SYSTEMS, INC.
3. From your table sketch the resulting graph on the axes below:
Analysis and Intrepretation
1. By consideration of the shape of the graph, state the nature of the function(s) thisgraph could represent.
2. If we let the function be represented by f (x) what transformation would we need tomake to match the rate of cooling function?
3. Find the equation of f (x) and state whether it follows the pattern associated withNewton’s Law of Cooling.
Temperature
5 minute intervals 5 10 15 20 25 30
5
10
15
20
25
30
Time

PORTABLE DATALAB ACTIVITIES SOURCEBOOK FIRMWARE SYSTEMS, INC. 69
4. Below is a set of data and its graph that was gathered in an earlier experiment
Time(min)
WaterTemp(C)
Time(min)
WaterTemp(C)
0 4.4 73 13
5 4.9 78 13.8
10 5.4 83 13.9
15 6.3 87 14.4
19 6.8 92 15.1
24 7.8 97 15.3
29 8.4 102 15.4
34 9.2 107 15.8
39 9.5 112 16.6
44 10.1 117 16.5
49 10.4 121 17.1
53 11.3 126 17.2
58 11.7 131 17.8
63 12.3 136 18.2
68 12.3
We then considered a transformation of this graph which will enable us to use the in-builtfunction y = aekx of the graphics calculator.
Let the warming function be f (x) then the transformed equation will be room temperature(28) minus f (x). I.e., g (x) = 28 – f(x).
Transform the data and find the function that best fits the transformed data.
0
2
4
6
8
10
12
14
16
18
20
0 20 40 60 80 100 120 140 160
Time (min)
Wat
er T
emp
(C)


PORTABLE DATALAB ACTIVITIES SOURCEBOOK FIRMWARE SYSTEMS, INC. 71
Date: Name: ____________________________
pHun with pH
Introduction
The measure of a solution's acidity or basicity (alkalinity) is its pH. A pH value indicatesthe concentration of hydrogen ions in the solution. Since the concentrations of hydrogenions in most solutions are often very small numbers, a more convenient way forexpressing pH (that does not involve using very small numbers) has been devised. Theexpression used is defined below:
The log transformation of the hydrogen ion concentration results in a pH scale that rangesfor most solutions from 1 to 14. Solutions with a pH of less than 7 are considered acidicand solutions with a pH of greater than 7 are considered basic. A pH value of 7 isconsidered neutral. In this experiment you will evaluate the pH for a number ofsolutions.
Equipment Required
1 Portable DataLab
1 Vernier pH sensor
1 graphing calculator, with DataLab Companion software, cable and instructions
1/2 cup each of a variety of fluids (tap water, distilled water, lemon juice, etc.)
1 250 ml beaker
1 stir plate and 1 magnetic stir bar (optional)
Where [H+] is the hydrogen ion concentration.[ ] [ ]++ =−=
HHpH 1loglog

72 PORTABLE DATALAB ACTIVITIES SOURCEBOOK FIRMWARE SYSTEMS, INC.
Experiment Setup
1. Connect the pH sensor to channel 1 on the DataLab.
2. Connect the graphing calculator to the Portable DataLab.
3. Set up experiment to collect pH data in calculator.
Experiment Procedure1. Calibrate the pH sensor.
2. Pour about one-half cup of one of the liquids into the beaker.
3. Place the pH sensor in the liquid and record the pH.
4. Repeat measurement for a variety of different liquids (rinse the beaker with tapwater in between measurements).
5. Measure the pH of a mixture of two of the liquids (use equal volumes of eachliquid).
Stir plate
pH sensor
To channel 1
pH sensor
Stir plate

PORTABLE DATALAB ACTIVITIES SOURCEBOOK FIRMWARE SYSTEMS, INC. 73
Name of liquid pH
Analysis and Interpretation
1. Which liquid was most acidic?
2. Which was most basic?
3. Explain what happened to the pH in the mixture.

74 PORTABLE DATALAB ACTIVITIES SOURCEBOOK FIRMWARE SYSTEMS, INC.

PORTABLE DATALAB ACTIVITIES SOURCEBOOK FIRMWARE SYSTEMS, INC. 75
Date: Name: ____________________________
Pressure Cooker
(Pressure and Temperature)
Introduction
As a gas is heated, it expands, and as it is cooled it contracts. For example, a balloon thatis left in direct sunlight for a long time may burst. Why does this happen? As thetemperature rises, the air in the balloon expands. Eventually, its maximum volume isreached, and as the temperature keeps increasing, the increasing pressure causes it toburst. In this experiment you will investigate the relationship between pressure andtemperature.
Equipment Required
1 Portable DataLab
1 Vernier Pressure sensor
1 temperature probe and cable
1 graphing calculator, with DataLab Companion software, cable and instructions
2 one-liter beakers
ice
a source of near boiling water
1 conical flask with a one-hole stopper fitted with a glass tube leading to plastictubing of a suitable size to attach to the pressure sensor

76 PORTABLE DATALAB ACTIVITIES SOURCEBOOK FIRMWARE SYSTEMS, INC.
PressureSensor
TemperatureProbe
Calc
DataLab
Experiment Setup
1. Connect the cables from the temperature and pressure probes to channels 1 and 2 onthe DataLab.
2. Connect the graphing calculator to the DataLab.
3. Set up experiment to collect temperature and pressure data in calculator.
4. Fully open the relief valve on the pressure sensor to equalize pressures. Now closethe valve fully and re-open it one complete turn counterclockwise. This will open theside valve which connects to the pressure sensor.
Experiment Procedure
Place the ice into one of the beakers and fill it with about 500 ml cool tap water. Put this
beaker aside to allow the ice to melt and the temperature to stabilize.
1. Lower the conical flask into the beaker that does not contain ice water and placethe temperature probe in this beaker. Fill the beaker about two-thirds full withnear boiling water. When the pressure and temperature values for this beakerseem to be stable, save a pair of pressure/temperature readings.
2. Empty about half of the near boiling water from the beaker and replace it with tapwater. Wait again while the pressure and temperature readings stabilize and thensave another data pair.
3. Empty the beaker completely and refill it with tap water. Wait again while thepressure and temperature readings stabilize and then save another data pair.

PORTABLE DATALAB ACTIVITIES SOURCEBOOK FIRMWARE SYSTEMS, INC. 77
4. Now place the flask into the beaker that you previously filled one-half full withice water. Wait again while the pressure and temperature readings stabilize andthen collect a data pair.
5. Stop recording and turn off the DataLab.
6. Obtain a plot on the graphing calculator of the pressure and temperature valuesthat you collected. You should notice a linear relationship.
7. Convert the temperature values that you collected from Celsius to Kelvin byadding 273 to them. Look at the plot again.
Analysis and Interpretation
1. For each of the pressure/temperature data pairs, calculate a value for pressuredivided by temperature by filling in the table below.
Type of Water Pressure/Temperature
boiling water
half boiling water/half tap water
tap water
ice water
2. What do you notice about the pressure/temperature values that you calculatedabove?

78 PORTABLE DATALAB ACTIVITIES SOURCEBOOK FIRMWARE SYSTEMS, INC.
3. Predict what the pressure will be when the temperature is 200 K.
4. Describe the relationship between pressure and temperature