A multi gene sequence-based phylogeny of the Musaceae (banana
13
RESEARCH ARTICLE Open Access A multi gene sequence-based phylogeny of the Musaceae (banana) family Pavla Christelová 1 , Miroslav Valárik 1 , Eva Hřibová 1 , Edmond De Langhe 2 and Jaroslav Doležel 1* Abstract Background: The classification of the Musaceae (banana) family species and their phylogenetic inter-relationships remain controversial, in part due to limited nucleotide information to complement the morphological and physiological characters. In this work the evolutionary relationships within the Musaceae family were studied using 13 species and DNA sequences obtained from a set of 19 unlinked nuclear genes. Results: The 19 gene sequences represented a sample of ~16 kb of genome sequence (~73% intronic). The sequence data were also used to obtain estimates for the divergence times of the Musaceae genera and Musa sections. Nucleotide variation within the sample confirmed the close relationship of Australimusa and Callimusa sections and showed that Eumusa and Rhodochlamys sections are not reciprocally monophyletic, which supports the previous claims for the merger between the two latter sections. Divergence time analysis supported the previous dating of the Musaceae crown age to the Cretaceous/Tertiary boundary (~ 69 Mya), and the evolution of Musa to ~50 Mya. The first estimates for the divergence times of the four Musa sections were also obtained. Conclusions: The gene sequence-based phylogeny presented here provides a substantial insight into the course of speciation within the Musaceae. An understanding of the main phylogenetic relationships between banana species will help to fine-tune the taxonomy of Musaceae. Background The global annual production of bananas and plantains (Musa spp.) amounts to > 120 Mt [1], making this spe- cies one of the world’ s most important fruit crops. As well as their prominence as a dessert fruit, they provide a vital source of carbohydrates to many inhabitants of the humid tropics. Musa production, like that of all crop species, is endangered by a range of pests and dis- eases, affecting both the yield and quality of the fruit. While the large-scale commercial plantations can secure production by frequent applications of fungicide and pesticide, this form of crop management is increasingly recognized as environmentally irresponsible. Meanwhile, smallholders, who together account for at least 85% of world production, can seldom afford the expense of che- mical control, and their crop remains vulnerable to dis- eases and pests. Improvement of cultivated banana via breeding is hampered by the absence of sexual repro- duction and narrow genetic basis. As a result, attention has turned to non-cultivated wild relatives as sources of new genes for banana improvement. This, underlines a renewed interest to analyze and conserve genetic diver- sity within Musa spp., which in turn has raised a num- ber of questions related to their taxonomy. The banana family (Musaceae) has been assigned to the order Zingiberales in the clade commelinids in the monocots [2] and has been conventionally divided into the three genera Musa, Ensete and Musella. The genus Musa is characterized by a set of morphological descrip- tors, and has a basic chromosome number (x) of 9, 10 or 11. The genus has been sub-divided into the four sec- tions Eumusa (x = 11; comprising most of the cultivated species), Rhodochlamys (x= 11), Australimusa (x = 10) and Callimusa (x = 9, 10) [3,4]. More recently, Argent [5] added a fifth section, Ingentimusa (x = 7), containing just a single species M. ingens. However, since this one species (x = 7) grows within the Australimusa region (New Guinea), its section-status is not evident when compared to M. beccarii (x = 9), which grows in the * Correspondence: [email protected] 1 Centre of the Region Haná for Biotechnological and Agricultural Research, Institute of Experimental Botany, Sokolovská 6, 772 00 Olomouc, Czech Republic Full list of author information is available at the end of the article Christelová et al. BMC Evolutionary Biology 2011, 11:103 http://www.biomedcentral.com/1471-2148/11/103 © 2011 Christelová et al; licensee BioMed Central Ltd. This is an Open Access article distributed under the terms of the Creative Commons Attribution License (http://creativecommons.org/licenses/by/2.0), which permits unrestricted use, distribution, and reproduction in any medium, provided the original work is properly cited.
Transcript of A multi gene sequence-based phylogeny of the Musaceae (banana
RESEARCH ARTICLE Open Access
A multi gene sequence-based phylogeny of theMusaceae (banana) familyPavla Christelová1, Miroslav Valárik1, Eva Hřibová1, Edmond De Langhe2 and Jaroslav Doležel1*
Abstract
Background: The classification of the Musaceae (banana) family species and their phylogenetic inter-relationshipsremain controversial, in part due to limited nucleotide information to complement the morphological andphysiological characters. In this work the evolutionary relationships within the Musaceae family were studied using13 species and DNA sequences obtained from a set of 19 unlinked nuclear genes.
Results: The 19 gene sequences represented a sample of ~16 kb of genome sequence (~73% intronic). Thesequence data were also used to obtain estimates for the divergence times of the Musaceae genera and Musasections. Nucleotide variation within the sample confirmed the close relationship of Australimusa and Callimusasections and showed that Eumusa and Rhodochlamys sections are not reciprocally monophyletic, which supportsthe previous claims for the merger between the two latter sections. Divergence time analysis supported theprevious dating of the Musaceae crown age to the Cretaceous/Tertiary boundary (~ 69 Mya), and the evolution ofMusa to ~50 Mya. The first estimates for the divergence times of the four Musa sections were also obtained.
Conclusions: The gene sequence-based phylogeny presented here provides a substantial insight into the courseof speciation within the Musaceae. An understanding of the main phylogenetic relationships between bananaspecies will help to fine-tune the taxonomy of Musaceae.
BackgroundThe global annual production of bananas and plantains(Musa spp.) amounts to > 120 Mt [1], making this spe-cies one of the world’s most important fruit crops. Aswell as their prominence as a dessert fruit, they providea vital source of carbohydrates to many inhabitants ofthe humid tropics. Musa production, like that of allcrop species, is endangered by a range of pests and dis-eases, affecting both the yield and quality of the fruit.While the large-scale commercial plantations can secureproduction by frequent applications of fungicide andpesticide, this form of crop management is increasinglyrecognized as environmentally irresponsible. Meanwhile,smallholders, who together account for at least 85% ofworld production, can seldom afford the expense of che-mical control, and their crop remains vulnerable to dis-eases and pests. Improvement of cultivated banana via
breeding is hampered by the absence of sexual repro-duction and narrow genetic basis. As a result, attentionhas turned to non-cultivated wild relatives as sources ofnew genes for banana improvement. This, underlines arenewed interest to analyze and conserve genetic diver-sity within Musa spp., which in turn has raised a num-ber of questions related to their taxonomy.The banana family (Musaceae) has been assigned to
the order Zingiberales in the clade commelinids in themonocots [2] and has been conventionally divided intothe three genera Musa, Ensete and Musella. The genusMusa is characterized by a set of morphological descrip-tors, and has a basic chromosome number (x) of 9, 10or 11. The genus has been sub-divided into the four sec-tions Eumusa (x = 11; comprising most of the cultivatedspecies), Rhodochlamys (x = 11), Australimusa (x = 10)and Callimusa (x = 9, 10) [3,4]. More recently, Argent[5] added a fifth section, Ingentimusa (x = 7), containingjust a single species M. ingens. However, since this onespecies (x = 7) grows within the Australimusa region(New Guinea), its section-status is not evident whencompared to M. beccarii (x = 9), which grows in the
* Correspondence: [email protected] of the Region Haná for Biotechnological and Agricultural Research,Institute of Experimental Botany, Sokolovská 6, 772 00 Olomouc, CzechRepublicFull list of author information is available at the end of the article
Christelová et al. BMC Evolutionary Biology 2011, 11:103http://www.biomedcentral.com/1471-2148/11/103
© 2011 Christelová et al; licensee BioMed Central Ltd. This is an Open Access article distributed under the terms of the CreativeCommons Attribution License (http://creativecommons.org/licenses/by/2.0), which permits unrestricted use, distribution, andreproduction in any medium, provided the original work is properly cited.
Callimusa region (Borneo) and remains classified as aCallimusa.With the application of DNA-based tools, this conven-
tionally-based taxonomy has become increasingly diffi-cult to justify. Thus, based on RFLP genotyping, Gawelet al. [6] proposed a merger between Eumusa and Rho-dochlamys, a suggestion consistent with nuclear genomesizes and the distribution of rDNA loci [7], as well aswith the phylogenetic analysis based on the ITS andorganellar DNA [8]. Jarret and Gawel [9] further pro-posed combining Australimusa and Callimusa into asingle section, a suggestion supported by AFLP geno-types acquired by Wong et al. [10]. However, the resultsof AFLP genotyping led Ude et al. [11] to argue that theconventional taxonomy of Musa was in fact tenable.The ease of DNA sequencing has revolutionized phy-
logenetic methodology. The most frequent targets forthis type of analysis have been extra-nuclear DNA i.e.chloroplast and mitochondrial genes [12-16] and theinternal transcribed spacers (ITS) separating the tandemorganized ribosomal genes in the 45S rDNA locus[17-19]. The prevalently uniparental mode of inheritanceof the chloroplast and mitochondrion limits to someextent the usefulness of extra-nuclear sequences, andmoreover, it has been established that this DNA tendsto evolve more slowly than do the nuclear genes, whichpresents difficulties in employing it for phylogeneticpurposes [20]. Concerted evolution [21], a bias due toanalyzing a single locus and hidden paralogy all militateagainst relying solely on ITS variation for molecular sys-tematics and evolutionary analysis [22,23].Single and low copy nuclear gene sequences are
thought to provide a higher level of discrimination thaneither extra-nuclear genes or ribosomal spacers [24-26].The lower frequency of informative sites within thesesequences can, however, prevent their use for the reso-lution of phylogeny both at lower taxonomic levels andamong rapidly diversifying lineages. The greater resol-ving power of low copy nuclear sequence has beenrecently demonstrated in rice [27]. Low copy nucleargenes also suffer less homoplasy than does ITS [22] andare seldom subjected to concerted evolution. Intronicsequence is particularly useful, since the level of selec-tion pressure on its non-coding DNA is relaxed [28].The major drawback to the use of low copy sequence isthe need to distinguish between paralogs and orthologs.As yet in the Musaceae family, however, all publishedsequence-based phylogenetic studies have targetedextra-nuclear and/or ribosomal DNA sequence.The phylogeny of the Musaceae remains controversial.
Typing via organellar and ribosomal DNA has beenemployed by Boonruangrod et al. [29,30]. Li et al. [8]and Liu et al. [31] applied sequence analysis of riboso-mal ITS coupled with the chloroplast gene evidence.
More generally, evolutionary relationships within themonocotyledonous species [32-34] and in the Zingiber-ales in particular [35,36], have produced date estimatesfor the divergence of the Musaceae (61-110 Mya) andthe genus Musa (51 Mya). Based on a study of genomeduplication, Paterson et al. [37] suggested that the diver-gence of Musa occurred 142 Mya, although this esti-mate was conceded to require further sequenceinformation before it could be accepted. Clearly, a morerobust picture of banana phylogeny and divergence timerequires a systematic sampling of gene sequences dis-tributed throughout the genome. Thus, we set out toclarify main frame of evolutionary relationships withinthe Musaceae, and to date the divergence of particularMusa sections, using a set of single or low copy nucleargene sequences.
MethodsTaxon samplingThe sample of Musaceae species included representa-tives of Musella, Ensete and each of the four Musa sec-tions (Table 1). Strelitzia nicolai Regel et Koern (familyStrelitziaceae, order Zingiberales) was chosen to serve asan outgroup due to its relatively close relationship tothe Musaceae family and the highest efficiency of ampli-fication of selected gene markers. Sampling of additionaloutgroup species was abandoned after a series of preli-minary tests, which revealed major difficulties with theamplification of selected genes (data not shown). Invitro rooted M. balbisiana ’PKW’ plants were donatedby François Côte (CIRAD, Guadeloupe, French WestIndies) and Musella lasiocarpa plants were purchasedfrom a commercial nursery. The other entries wereobtained from International Transit Centre (ITC, Catho-lic University, Leuven, Belgium) in the form of in vitrorooted plants. All plant materials were maintained in agreenhouse after their transfer to soil. Leaf tissue of S.nicolai was provided by Dr. M. Dančák (Palacký Univer-sity, Olomouc, Czech Republic). Genomic DNA wasextracted from young leaf tissues using Invisorb® SpinPlant Mini kit (Invitek, Berlin, Germany), following themanufacturer’s instructions.
Target gene selection and primer designThe gene sequences targeted for phylogenetic analysiswere selected from the collection of banana ESTs depos-ited in GenBank as of March 30, 2009. The threefoldbasis for the choice of genes was that they were singlecopy, that their genomic locations spanned the entiregenome and that they contained at least one intron.Genes belonging to the same gene family were avoided.These criteria were applied by reference to their riceorthologs, which were identified by BLAST analysis [38],using a threshold of e-10. To maximize dispersion across
Christelová et al. BMC Evolutionary Biology 2011, 11:103http://www.biomedcentral.com/1471-2148/11/103
Page 2 of 13
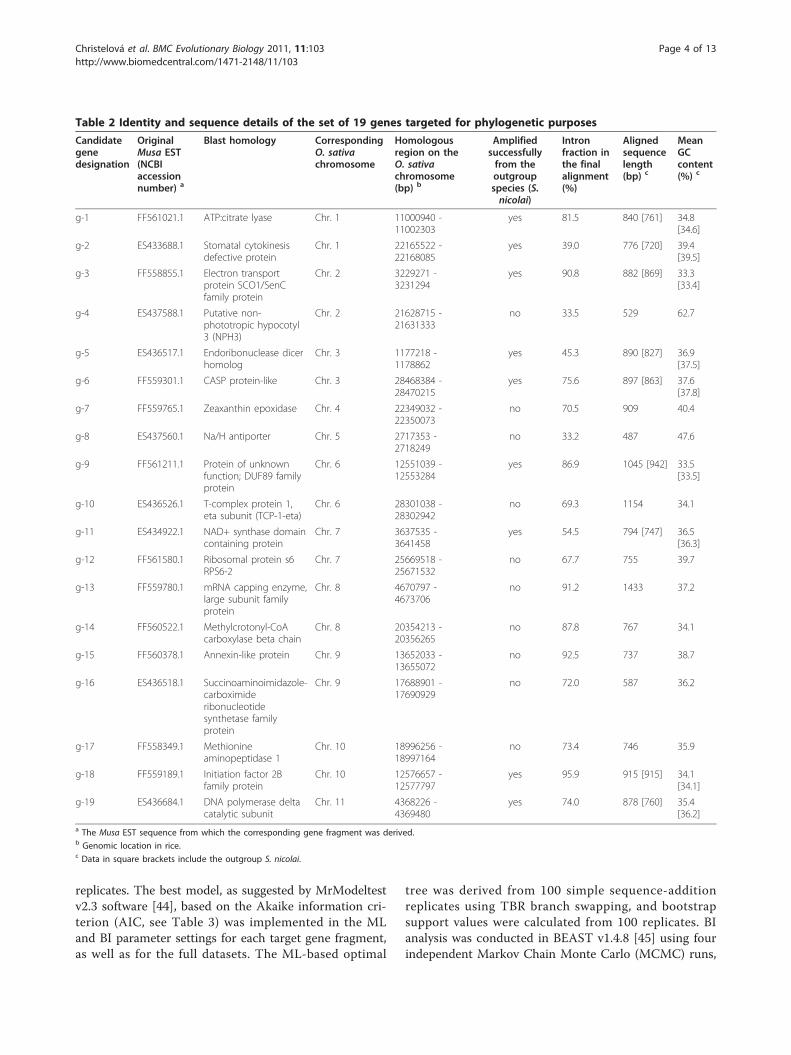
the banana genome, we chose genes whose rice ortho-logs mapped to different chromosome arms. Gene struc-ture in banana was assumed to be identical to that inrice. Primers (see Additional File 1) were designed toamplify intron-spanning gene fragments in the panel ofMusaceae species and S. nicolai, following Lessa [39].Primers which either failed to amplify or amplified mul-tiple fragments from any one of the 13 Musaceae entrieswere discarded. The final set comprised 19 genes (Table2), sampling each of the rice chromosome arms exceptthe long arms of chromosomes 4, 5, 11 and 12, and theshort arm of chromosome 12. Nine of the 19 primerpairs (Table 2) amplified successfully from S. nicolaitemplate.
Gene fragment amplification, cloning and seqeuncingA standard amplification protocol was applied to each ofthe 19 primer pairs. Each reaction contained 40 ng tem-plate, with the PCR program composed of an initialdenaturation step (94°C/5 min), followed by 35 cycles of94°C/30 s, 57°C/30 s and 72°C/35 s, and ending with anextension step of 72°C/10 min. Amplicons were treatedwith exonuclease/alkaline phosphatase (ExoSAP-IT®,USB, Cleveland, OH, USA) and then either sequenceddirectly, or first cloned into the TOPO vector (Invitro-gen, Carlsbad, USA) before sequencing. Cycle sequen-cing was performed on three independent amplicons pergene target, using a BigDye® Terminator v3.1 CycleSequencing kit (Applied Biosystems, Foster City, USA),following the manufacturer’s instructions. Sequencingreaction products were purified using a CleanSEQ kit
(Agencourt Bioscience Corp., Beckman Coulter, Beverly,USA), and then separated on an ABI 3730Xl DNA ana-lyzer (Applied Biosystems). All the resulting sequenceshave been deposited within GenBank [GenBank:HM118565-HM118820]. Raw sequence data wereassembled and edited using DNA Baser v2 software[40]. Consensus sequences were aligned by ClustalW[41] using default parameters, as implemented in theMEGA4 software package [42]. Multiple DNA sequencealignments were inspected and any ambiguously alignedsegments were removed prior to phylogenetic analysis.
Phylogenetic reconstructionMaximum likelihood (ML), maximum parsimony (MP)and Bayesian inference (BI) methods were applied toinfer phylogenetic relationships. Sequence gaps weretreated as missing data. Two datasets were considered -the first (dataset A) consisted of all 19 gene fragmentsacross the 13 Musaceae entries, but not S. nicolai, andthe second (dataset B) comprised nine gene fragmentsacross all the entries. Exonic and intronic sequenceswere analyzed separately in a similar fashion. MP andML analyses were performed using PAUP* v4.0b soft-ware [43]. The most parsimonious tree for each datasetwas found by a heuristic search of 1,000 randomsequence-addition replicates by means of a tree-bisec-tion-reconnection (TBR) branch swapping algorithm.The strict consensus tree was rooted by S. nicolai as anoutgroup or, where no sequence was obtainable fromthis species, by E. ventricosum. Statistical support forindividual nodes was estimated from 1,000 bootstrap
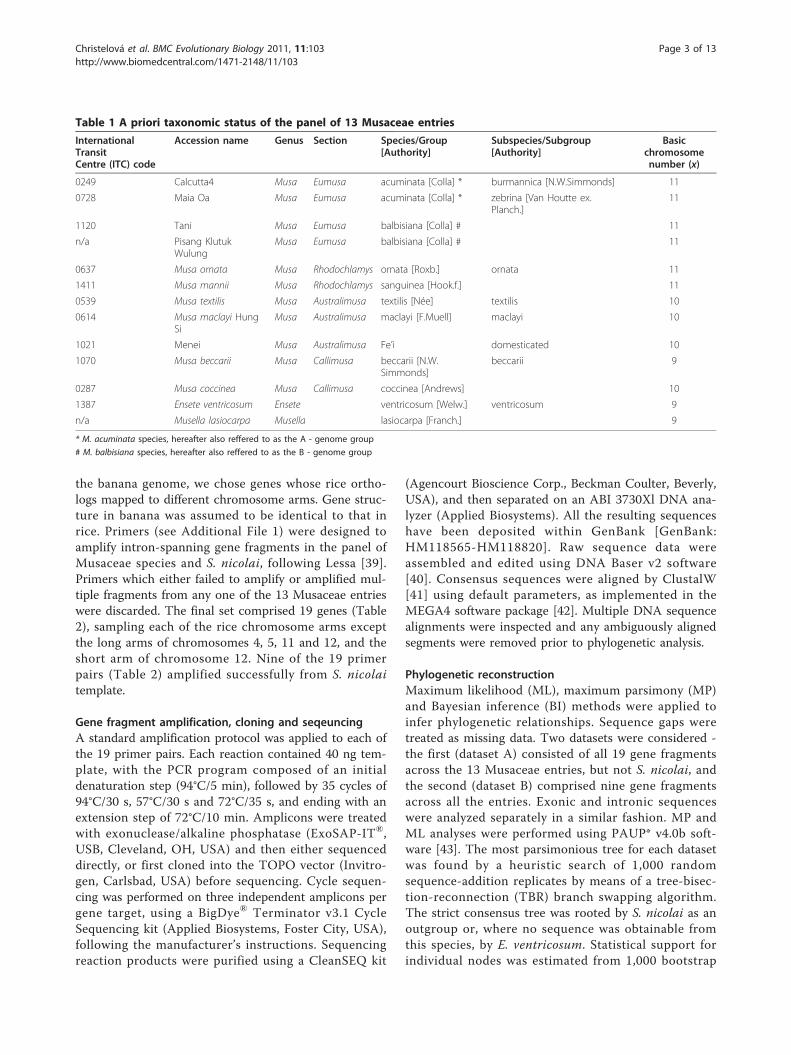
Table 1 A priori taxonomic status of the panel of 13 Musaceae entries
InternationalTransitCentre (ITC) code
Accession name Genus Section Species/Group[Authority]
Subspecies/Subgroup[Authority]
Basicchromosomenumber (x)
0249 Calcutta4 Musa Eumusa acuminata [Colla] * burmannica [N.W.Simmonds] 11
0728 Maia Oa Musa Eumusa acuminata [Colla] * zebrina [Van Houtte ex.Planch.]
11
1120 Tani Musa Eumusa balbisiana [Colla] # 11
n/a Pisang KlutukWulung
Musa Eumusa balbisiana [Colla] # 11
0637 Musa ornata Musa Rhodochlamys ornata [Roxb.] ornata 11
1411 Musa mannii Musa Rhodochlamys sanguinea [Hook.f.] 11
0539 Musa textilis Musa Australimusa textilis [Née] textilis 10
0614 Musa maclayi HungSi
Musa Australimusa maclayi [F.Muell] maclayi 10
1021 Menei Musa Australimusa Fe’i domesticated 10
1070 Musa beccarii Musa Callimusa beccarii [N.W.Simmonds]
beccarii 9
0287 Musa coccinea Musa Callimusa coccinea [Andrews] 10
1387 Ensete ventricosum Ensete ventricosum [Welw.] ventricosum 9
n/a Musella lasiocarpa Musella lasiocarpa [Franch.] 9
* M. acuminata species, hereafter also reffered to as the A - genome group
# M. balbisiana species, hereafter also reffered to as the B - genome group
Christelová et al. BMC Evolutionary Biology 2011, 11:103http://www.biomedcentral.com/1471-2148/11/103
Page 3 of 13
replicates. The best model, as suggested by MrModeltestv2.3 software [44], based on the Akaike information cri-terion (AIC, see Table 3) was implemented in the MLand BI parameter settings for each target gene fragment,as well as for the full datasets. The ML-based optimal
tree was derived from 100 simple sequence-additionreplicates using TBR branch swapping, and bootstrapsupport values were calculated from 100 replicates. BIanalysis was conducted in BEAST v1.4.8 [45] using fourindependent Markov Chain Monte Carlo (MCMC) runs,
Table 2 Identity and sequence details of the set of 19 genes targeted for phylogenetic purposes
Candidategenedesignation
OriginalMusa EST(NCBIaccessionnumber) a
Blast homology CorrespondingO. sativachromosome
Homologousregion on theO. sativachromosome(bp) b
Amplifiedsuccessfullyfrom theoutgroupspecies (S.nicolai)
Intronfraction inthe finalalignment(%)
Alignedsequencelength(bp) c
MeanGCcontent(%) c
g-1 FF561021.1 ATP:citrate lyase Chr. 1 11000940 -11002303
yes 81.5 840 [761] 34.8[34.6]
g-2 ES433688.1 Stomatal cytokinesisdefective protein
Chr. 1 22165522 -22168085
yes 39.0 776 [720] 39.4[39.5]
g-3 FF558855.1 Electron transportprotein SCO1/SenCfamily protein
Chr. 2 3229271 -3231294
yes 90.8 882 [869] 33.3[33.4]
g-4 ES437588.1 Putative non-phototropic hypocotyl3 (NPH3)
Chr. 2 21628715 -21631333
no 33.5 529 62.7
g-5 ES436517.1 Endoribonuclease dicerhomolog
Chr. 3 1177218 -1178862
yes 45.3 890 [827] 36.9[37.5]
g-6 FF559301.1 CASP protein-like Chr. 3 28468384 -28470215
yes 75.6 897 [863] 37.6[37.8]
g-7 FF559765.1 Zeaxanthin epoxidase Chr. 4 22349032 -22350073
no 70.5 909 40.4
g-8 ES437560.1 Na/H antiporter Chr. 5 2717353 -2718249
no 33.2 487 47.6
g-9 FF561211.1 Protein of unknownfunction; DUF89 familyprotein
Chr. 6 12551039 -12553284
yes 86.9 1045 [942] 33.5[33.5]
g-10 ES436526.1 T-complex protein 1,eta subunit (TCP-1-eta)
Chr. 6 28301038 -28302942
no 69.3 1154 34.1
g-11 ES434922.1 NAD+ synthase domaincontaining protein
Chr. 7 3637535 -3641458
yes 54.5 794 [747] 36.5[36.3]
g-12 FF561580.1 Ribosomal protein s6RPS6-2
Chr. 7 25669518 -25671532
no 67.7 755 39.7
g-13 FF559780.1 mRNA capping enzyme,large subunit familyprotein
Chr. 8 4670797 -4673706
no 91.2 1433 37.2
g-14 FF560522.1 Methylcrotonyl-CoAcarboxylase beta chain
Chr. 8 20354213 -20356265
no 87.8 767 34.1
g-15 FF560378.1 Annexin-like protein Chr. 9 13652033 -13655072
no 92.5 737 38.7
g-16 ES436518.1 Succinoaminoimidazole-carboximideribonucleotidesynthetase familyprotein
Chr. 9 17688901 -17690929
no 72.0 587 36.2
g-17 FF558349.1 Methionineaminopeptidase 1
Chr. 10 18996256 -18997164
no 73.4 746 35.9
g-18 FF559189.1 Initiation factor 2Bfamily protein
Chr. 10 12576657 -12577797
yes 95.9 915 [915] 34.1[34.1]
g-19 ES436684.1 DNA polymerase deltacatalytic subunit
Chr. 11 4368226 -4369480
yes 74.0 878 [760] 35.4[36.2]
a The Musa EST sequence from which the corresponding gene fragment was derived.b Genomic location in rice.c Data in square brackets include the outgroup S. nicolai.
Christelová et al. BMC Evolutionary Biology 2011, 11:103http://www.biomedcentral.com/1471-2148/11/103
Page 4 of 13
starting from a randomly chosen topology, and run for1,000,000 generations, with sampling every 1,000 gen-erations. Logfile outputs were inspected in Tracer [45]software to confirm convergence. Treefiles from indivi-dual runs were combined by LogCombiner [45] soft-ware. The maximum clade credibility tree andcorresponding posterior probabilities were calculatedusing TreeAnnotator [45] software, after removal of the25% burn-in samples. The phylogenetic trees generatedwere graphically adjusted in FigTree v1.3.1 software [46].
Systematic bias and congruence testingThe incongruence length difference (ILD) test [47](implemented in PAUP* v4.0b as the partition homoge-neity test) was applied to estimate the level of potential
incongruence in the data. The data set was partitionedinto individual genes and analyzed under heuristic searchwith 1000 replicates. A c2 test for base compositionhomogeneity across taxa was conducted in TREE-PUZ-ZLE v5.2 [48] software. The level of nucleotide substitu-tion saturation was evaluated in DAMBE [49] software byplotting transitions and transversions against pairwisegenetic distance. ML mapping using the quartet puzzlingmethod [50] was applied to investigate whether the phy-logenetic information content of the data was sufficientfor inference purposes. ML mapping was also performedwithin TREE-PUZZLE v5.2 software with all possiblequartets, applying the corresponding evolutionary modeland exact model parameter estimation settings.
Dating of nodesBEAST software v1.4.8 software was used to estimatethe divergence times for the major Musaceae clades.This approach has the advantage of simultaneous esti-mation of substitution model parameters, topology,branch lengths and fossil-based date calibration, usingthe Bayesian inference and MCMC method. Calibrationwas based on the carbon dating of Ensete oregonensefossil seeds, given as 43 Mya according to Manchesterand Kress [51]. The analysis was conducted over fourindependent MCMC runs, each consisting of 1,000,000generations under the relaxed clock model, with anuncorrelated lognormal distribution. The fossil calibra-tion was set as the most recent common ancestor(tMRCA) parametric tree prior. The results were retrievedafter combining the individual MCMC runs’ tree filesand the maximum clade credibility tree was constructedafter the initial 25% burn-in generations were discarded.
Results and DiscussionTaxon and gene samplingThe amount of available sequence information for Musaspecies is confined at present and hence the develop-ment of low-copy gene markers for phylogenetic studiesin this species has been laborious and time consuming.Despite this, we were able to develop 19 markers fromgene regions. Only single- or low copy genes wereselected with expected random distribution in the gen-ome of Musa to make sure that unlinked loci are com-pared. As the genome sequence of Musa is not yetavailable, the selection of random distributed lociassumed colinearity with the rice genome [52,53].The 19 gene-based markers [GenBank: HM118565-
HM118820] developed and used in the present studyrepresent until now by far the largest set of gene mar-kers ever used in the Musaceae. Ideally, a phylogeneticstudy should comprise all taxa and a high number ofunlinked DNA markers. However, from practical rea-sons these numbers are reduced and, in fact, may not
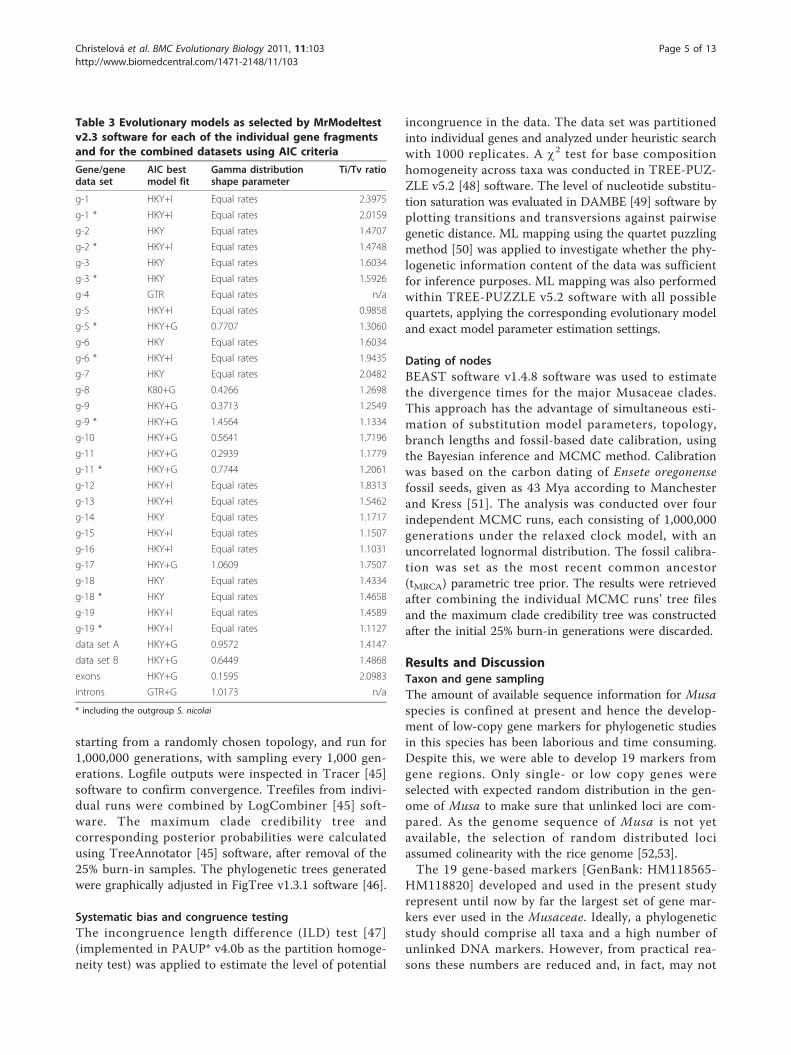
Table 3 Evolutionary models as selected by MrModeltestv2.3 software for each of the individual gene fragmentsand for the combined datasets using AIC criteria
Gene/genedata set
AIC bestmodel fit
Gamma distributionshape parameter
Ti/Tv ratio
g-1 HKY+I Equal rates 2.3975
g-1 * HKY+I Equal rates 2.0159
g-2 HKY Equal rates 1.4707
g-2 * HKY+I Equal rates 1.4748
g-3 HKY Equal rates 1.6034
g-3 * HKY Equal rates 1.5926
g-4 GTR Equal rates n/a
g-5 HKY+I Equal rates 0.9858
g-5 * HKY+G 0.7707 1.3060
g-6 HKY Equal rates 1.6034
g-6 * HKY+I Equal rates 1.9435
g-7 HKY Equal rates 2.0482
g-8 K80+G 0.4266 1.2698
g-9 HKY+G 0.3713 1.2549
g-9 * HKY+G 1.4564 1.1334
g-10 HKY+G 0.5641 1.7196
g-11 HKY+G 0.2939 1.1779
g-11 * HKY+G 0.7744 1.2061
g-12 HKY+I Equal rates 1.8313
g-13 HKY+I Equal rates 1.5462
g-14 HKY Equal rates 1.1717
g-15 HKY+I Equal rates 1.1507
g-16 HKY+I Equal rates 1.1031
g-17 HKY+G 1.0609 1.7507
g-18 HKY Equal rates 1.4334
g-18 * HKY Equal rates 1.4658
g-19 HKY+I Equal rates 1.4589
g-19 * HKY+I Equal rates 1.1127
data set A HKY+G 0.9572 1.4147
data set B HKY+G 0.6449 1.4868
exons HKY+G 0.1595 2.0983
introns GTR+G 1.0173 n/a
* including the outgroup S. nicolai
Christelová et al. BMC Evolutionary Biology 2011, 11:103http://www.biomedcentral.com/1471-2148/11/103
Page 5 of 13
be necessary. While some authors argue that incompletetaxon sampling has a negative impact on the phyloge-netic accuracy [54,55], other authors do not support thisview and prefer increasing the number of nucleotidecharacters sampled over the number of taxa in order toreveal the correct phylogeny without a major distortionof accuracy of the main evolution relationships [56-58].Here, we favored the latter approach with partial taxonsampling of representatives [stratified sampling; [59]],rather than analyzing a few genomic loci on a large setof species. However, if felt necessary, the marker setdeveloped in this work can be easily applied in otherspecies and subspecies of Musaceae.
Sequence data characterization and systematic biastestingThe 19 gene fragments covered a length of 16,012 bp, ofwhich 26.9% was exonic. The genic sequences were trea-ted independently as a single-gene data and in twomatrixed-modes according to the ability to amplify thegenes from the outgroup species S. nicolai (see Table 2for details); namely the dataset A (containing all 19 genesequences from 13 genotypes, excl. S. nicolai) and thedataset B (containing sequences of 9 genes from all 14genotypes, incl. the outgroup species S. nicolai). DatasetA (all 19 fragments from the 13 Musaceae entries) wasbased on 16,012 bp of sequence, of which 1,056 baseswere informative, while dataset B (nine gene fragmentsfrom the Musaceae entries plus S. nicolai) was based on7,404 bp of sequence, which included 492 informativesites. The c2 test used to detect heterogeneity in basecomposition indicates that there was no significant var-iation in the AT/GC content among species for indivi-dual genes (P = 0.382-1.000). The overall reducedproportion of GC in most of the sequences (see Table2) may be an artifact of the deliberate maximization ofintronic sequence in the sample, since plant intronicsequence has an AT bias [60]. The GC content of theintronic fraction was 34.6%, compared to 45.0% in theexonic fraction.Nucleotide sequences are considered to be phylogen-
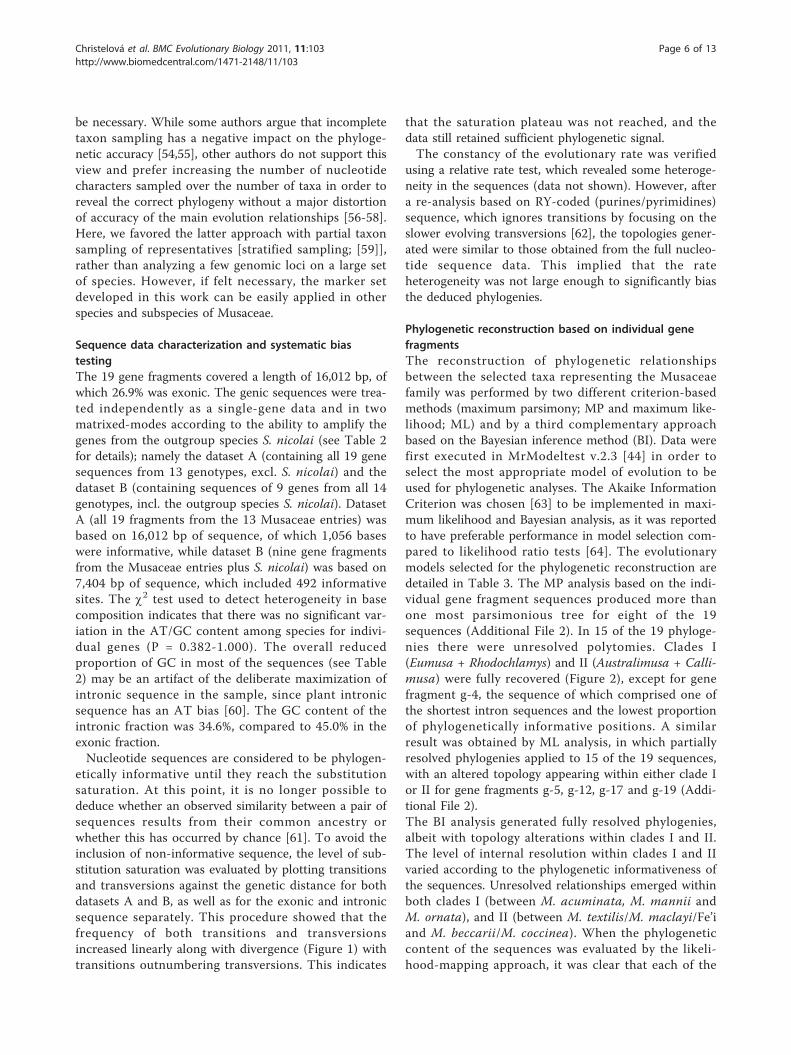
etically informative until they reach the substitutionsaturation. At this point, it is no longer possible todeduce whether an observed similarity between a pair ofsequences results from their common ancestry orwhether this has occurred by chance [61]. To avoid theinclusion of non-informative sequence, the level of sub-stitution saturation was evaluated by plotting transitionsand transversions against the genetic distance for bothdatasets A and B, as well as for the exonic and intronicsequence separately. This procedure showed that thefrequency of both transitions and transversionsincreased linearly along with divergence (Figure 1) withtransitions outnumbering transversions. This indicates
that the saturation plateau was not reached, and thedata still retained sufficient phylogenetic signal.The constancy of the evolutionary rate was verified
using a relative rate test, which revealed some heteroge-neity in the sequences (data not shown). However, aftera re-analysis based on RY-coded (purines/pyrimidines)sequence, which ignores transitions by focusing on theslower evolving transversions [62], the topologies gener-ated were similar to those obtained from the full nucleo-tide sequence data. This implied that the rateheterogeneity was not large enough to significantly biasthe deduced phylogenies.
Phylogenetic reconstruction based on individual genefragmentsThe reconstruction of phylogenetic relationshipsbetween the selected taxa representing the Musaceaefamily was performed by two different criterion-basedmethods (maximum parsimony; MP and maximum like-lihood; ML) and by a third complementary approachbased on the Bayesian inference method (BI). Data werefirst executed in MrModeltest v.2.3 [44] in order toselect the most appropriate model of evolution to beused for phylogenetic analyses. The Akaike InformationCriterion was chosen [63] to be implemented in maxi-mum likelihood and Bayesian analysis, as it was reportedto have preferable performance in model selection com-pared to likelihood ratio tests [64]. The evolutionarymodels selected for the phylogenetic reconstruction aredetailed in Table 3. The MP analysis based on the indi-vidual gene fragment sequences produced more thanone most parsimonious tree for eight of the 19sequences (Additional File 2). In 15 of the 19 phyloge-nies there were unresolved polytomies. Clades I(Eumusa + Rhodochlamys) and II (Australimusa + Calli-musa) were fully recovered (Figure 2), except for genefragment g-4, the sequence of which comprised one ofthe shortest intron sequences and the lowest proportionof phylogenetically informative positions. A similarresult was obtained by ML analysis, in which partiallyresolved phylogenies applied to 15 of the 19 sequences,with an altered topology appearing within either clade Ior II for gene fragments g-5, g-12, g-17 and g-19 (Addi-tional File 2).The BI analysis generated fully resolved phylogenies,albeit with topology alterations within clades I and II.The level of internal resolution within clades I and IIvaried according to the phylogenetic informativeness ofthe sequences. Unresolved relationships emerged withinboth clades I (between M. acuminata, M. mannii andM. ornata), and II (between M. textilis/M. maclayi/Fe’iand M. beccarii/M. coccinea). When the phylogeneticcontent of the sequences was evaluated by the likeli-hood-mapping approach, it was clear that each of the
Christelová et al. BMC Evolutionary Biology 2011, 11:103http://www.biomedcentral.com/1471-2148/11/103
Page 6 of 13
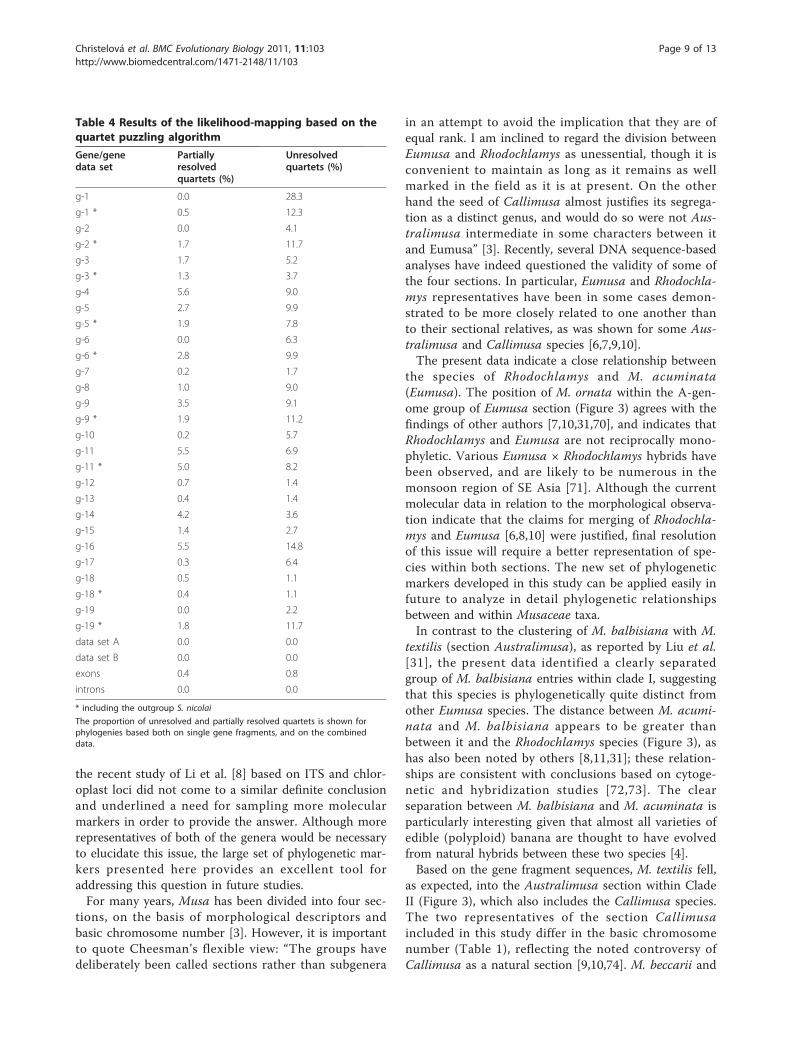
single gene fragment-based phylogenies contained a sig-nificant fraction of unresolved quartets (Table 4), show-ing that a single sequence is insufficient for makinginference regarding evolutionary relationships. However,for both of the combined datasets A and B, there wereno unresolved or partially resolved quartets and thus weinvestigated a possibility of combining individual genedata into a single data set for the phylogeneticreconstruction.Based on the ILD analysis, the individual gene frag-
ment partitions were highly incongruent (P < 0.001) andthus not directly combinable. However, it has been sug-gested that the ILD test should not be used as an exclu-sive measure of data partition combinability [65], as it isknown to be susceptible to both types I [false positives;[66]] and II [false negatives; [67]] error. When Rokas etal. [68] combined sequence data derived from a set ofdifferent genes, conflicting signals from individual genesequences were resolved and the resulting phylogenywas strongly supported. The joint use of a set of genesequences for phylogenetic inference depends largely on
nucleotide composition bias and substitution saturation[61]. Since the c2 test applied to the Musaceae sequencedata indicated the absence of any base composition bias,and substitution saturation of the aligned sequencescould be excluded (Figure 1), the combined set of genefragment sequences was then used for phylogeneticreconstruction.
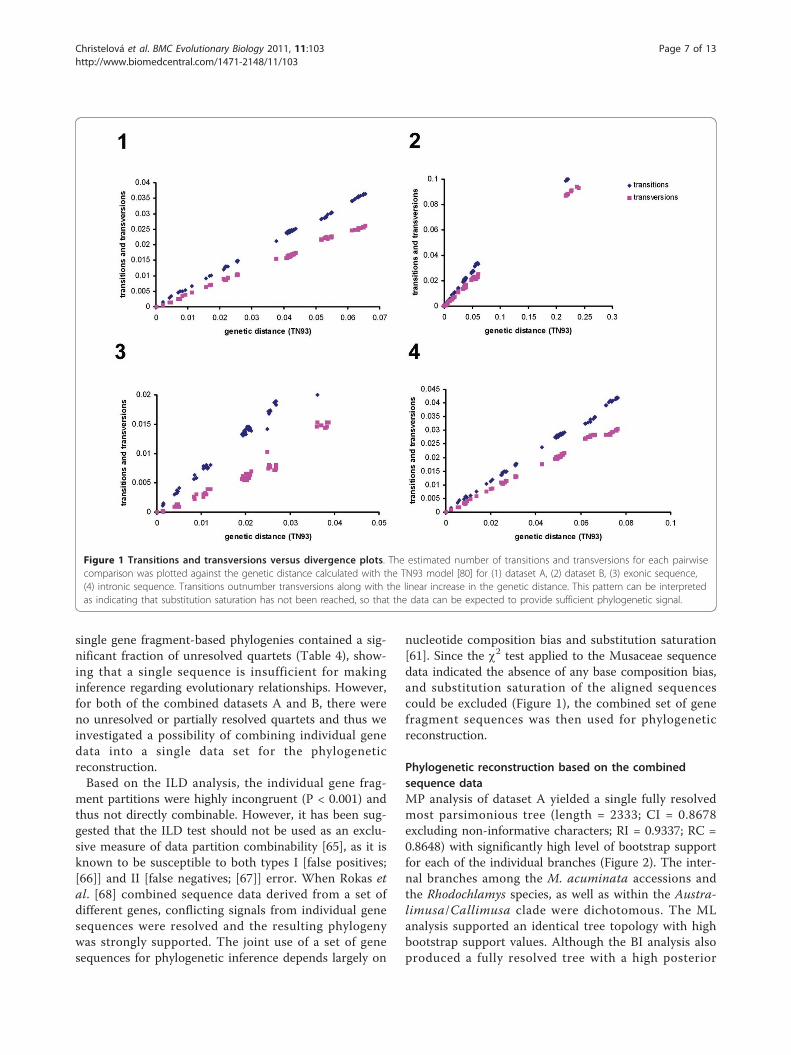
Phylogenetic reconstruction based on the combinedsequence dataMP analysis of dataset A yielded a single fully resolvedmost parsimonious tree (length = 2333; CI = 0.8678excluding non-informative characters; RI = 0.9337; RC =0.8648) with significantly high level of bootstrap supportfor each of the individual branches (Figure 2). The inter-nal branches among the M. acuminata accessions andthe Rhodochlamys species, as well as within the Austra-limusa/Callimusa clade were dichotomous. The MLanalysis supported an identical tree topology with highbootstrap support values. Although the BI analysis alsoproduced a fully resolved tree with a high posterior
Figure 1 Transitions and transversions versus divergence plots. The estimated number of transitions and transversions for each pairwisecomparison was plotted against the genetic distance calculated with the TN93 model [80] for (1) dataset A, (2) dataset B, (3) exonic sequence,(4) intronic sequence. Transitions outnumber transversions along with the linear increase in the genetic distance. This pattern can be interpretedas indicating that substitution saturation has not been reached, so that the data can be expected to provide sufficient phylogenetic signal.
Christelová et al. BMC Evolutionary Biology 2011, 11:103http://www.biomedcentral.com/1471-2148/11/103
Page 7 of 13
probability for all nodes (Additional File 3), the mono-phyly of Ensete and Musella at the genus level was notsupported. Due to the lack of an outgroup for dataset A,E. ventricosum was used as a surrogate, a choice whichprobably accounted for the MP and ML-based phyloge-nies. The fact that these phylogenies were likely artefac-tual was confirmed by the use of the midpoint rootingmethod, which generated the same topology as emergedfrom the BI analysis and from dataset B (see below).The MP analysis of dataset B also produced a single
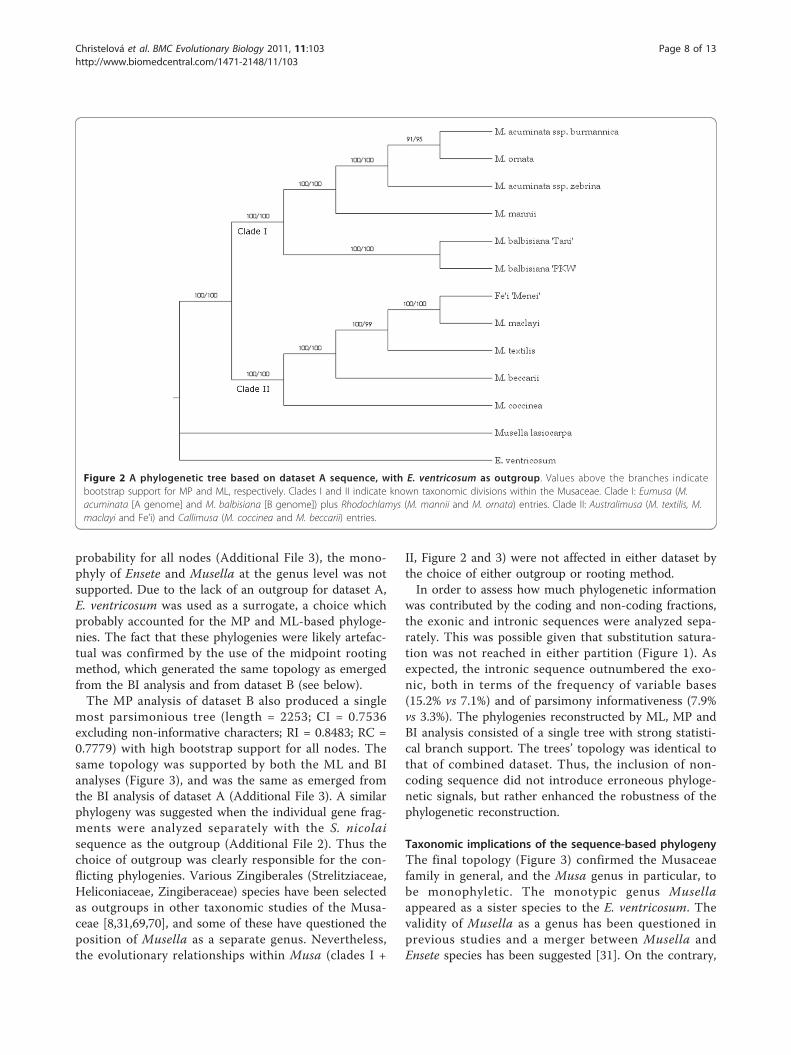
most parsimonious tree (length = 2253; CI = 0.7536excluding non-informative characters; RI = 0.8483; RC =0.7779) with high bootstrap support for all nodes. Thesame topology was supported by both the ML and BIanalyses (Figure 3), and was the same as emerged fromthe BI analysis of dataset A (Additional File 3). A similarphylogeny was suggested when the individual gene frag-ments were analyzed separately with the S. nicolaisequence as the outgroup (Additional File 2). Thus thechoice of outgroup was clearly responsible for the con-flicting phylogenies. Various Zingiberales (Strelitziaceae,Heliconiaceae, Zingiberaceae) species have been selectedas outgroups in other taxonomic studies of the Musa-ceae [8,31,69,70], and some of these have questioned theposition of Musella as a separate genus. Nevertheless,the evolutionary relationships within Musa (clades I +
II, Figure 2 and 3) were not affected in either dataset bythe choice of either outgroup or rooting method.In order to assess how much phylogenetic information
was contributed by the coding and non-coding fractions,the exonic and intronic sequences were analyzed sepa-rately. This was possible given that substitution satura-tion was not reached in either partition (Figure 1). Asexpected, the intronic sequence outnumbered the exo-nic, both in terms of the frequency of variable bases(15.2% vs 7.1%) and of parsimony informativeness (7.9%vs 3.3%). The phylogenies reconstructed by ML, MP andBI analysis consisted of a single tree with strong statisti-cal branch support. The trees’ topology was identical tothat of combined dataset. Thus, the inclusion of non-coding sequence did not introduce erroneous phyloge-netic signals, but rather enhanced the robustness of thephylogenetic reconstruction.
Taxonomic implications of the sequence-based phylogenyThe final topology (Figure 3) confirmed the Musaceaefamily in general, and the Musa genus in particular, tobe monophyletic. The monotypic genus Musellaappeared as a sister species to the E. ventricosum. Thevalidity of Musella as a genus has been questioned inprevious studies and a merger between Musella andEnsete species has been suggested [31]. On the contrary,
Figure 2 A phylogenetic tree based on dataset A sequence, with E. ventricosum as outgroup. Values above the branches indicatebootstrap support for MP and ML, respectively. Clades I and II indicate known taxonomic divisions within the Musaceae. Clade I: Eumusa (M.acuminata [A genome] and M. balbisiana [B genome]) plus Rhodochlamys (M. mannii and M. ornata) entries. Clade II: Australimusa (M. textilis, M.maclayi and Fe’i) and Callimusa (M. coccinea and M. beccarii) entries.
Christelová et al. BMC Evolutionary Biology 2011, 11:103http://www.biomedcentral.com/1471-2148/11/103
Page 8 of 13
the recent study of Li et al. [8] based on ITS and chlor-oplast loci did not come to a similar definite conclusionand underlined a need for sampling more molecularmarkers in order to provide the answer. Although morerepresentatives of both of the genera would be necessaryto elucidate this issue, the large set of phylogenetic mar-kers presented here provides an excellent tool foraddressing this question in future studies.For many years, Musa has been divided into four sec-
tions, on the basis of morphological descriptors andbasic chromosome number [3]. However, it is importantto quote Cheesman’s flexible view: “The groups havedeliberately been called sections rather than subgenera
in an attempt to avoid the implication that they are ofequal rank. I am inclined to regard the division betweenEumusa and Rhodochlamys as unessential, though it isconvenient to maintain as long as it remains as wellmarked in the field as it is at present. On the otherhand the seed of Callimusa almost justifies its segrega-tion as a distinct genus, and would do so were not Aus-tralimusa intermediate in some characters between itand Eumusa” [3]. Recently, several DNA sequence-basedanalyses have indeed questioned the validity of some ofthe four sections. In particular, Eumusa and Rhodochla-mys representatives have been in some cases demon-strated to be more closely related to one another thanto their sectional relatives, as was shown for some Aus-tralimusa and Callimusa species [6,7,9,10].The present data indicate a close relationship between
the species of Rhodochlamys and M. acuminata(Eumusa). The position of M. ornata within the A-gen-ome group of Eumusa section (Figure 3) agrees with thefindings of other authors [7,10,31,70], and indicates thatRhodochlamys and Eumusa are not reciprocally mono-phyletic. Various Eumusa × Rhodochlamys hybrids havebeen observed, and are likely to be numerous in themonsoon region of SE Asia [71]. Although the currentmolecular data in relation to the morphological observa-tion indicate that the claims for merging of Rhodochla-mys and Eumusa [6,8,10] were justified, final resolutionof this issue will require a better representation of spe-cies within both sections. The new set of phylogeneticmarkers developed in this study can be applied easily infuture to analyze in detail phylogenetic relationshipsbetween and within Musaceae taxa.In contrast to the clustering of M. balbisiana with M.
textilis (section Australimusa), as reported by Liu et al.[31], the present data identified a clearly separatedgroup of M. balbisiana entries within clade I, suggestingthat this species is phylogenetically quite distinct fromother Eumusa species. The distance between M. acumi-nata and M. balbisiana appears to be greater thanbetween it and the Rhodochlamys species (Figure 3), ashas also been noted by others [8,11,31]; these relation-ships are consistent with conclusions based on cytoge-netic and hybridization studies [72,73]. The clearseparation between M. balbisiana and M. acuminata isparticularly interesting given that almost all varieties ofedible (polyploid) banana are thought to have evolvedfrom natural hybrids between these two species [4].Based on the gene fragment sequences, M. textilis fell,
as expected, into the Australimusa section within CladeII (Figure 3), which also includes the Callimusa species.The two representatives of the section Callimusaincluded in this study differ in the basic chromosomenumber (Table 1), reflecting the noted controversy ofCallimusa as a natural section [9,10,74]. M. beccarii and
Table 4 Results of the likelihood-mapping based on thequartet puzzling algorithm
Gene/genedata set
Partiallyresolvedquartets (%)
Unresolvedquartets (%)
g-1 0.0 28.3
g-1 * 0.5 12.3
g-2 0.0 4.1
g-2 * 1.7 11.7
g-3 1.7 5.2
g-3 * 1.3 3.7
g-4 5.6 9.0
g-5 2.7 9.9
g-5 * 1.9 7.8
g-6 0.0 6.3
g-6 * 2.8 9.9
g-7 0.2 1.7
g-8 1.0 9.0
g-9 3.5 9.1
g-9 * 1.9 11.2
g-10 0.2 5.7
g-11 5.5 6.9
g-11 * 5.0 8.2
g-12 0.7 1.4
g-13 0.4 1.4
g-14 4.2 3.6
g-15 1.4 2.7
g-16 5.5 14.8
g-17 0.3 6.4
g-18 0.5 1.1
g-18 * 0.4 1.1
g-19 0.0 2.2
g-19 * 1.8 11.7
data set A 0.0 0.0
data set B 0.0 0.0
exons 0.4 0.8
introns 0.0 0.0
* including the outgroup S. nicolai
The proportion of unresolved and partially resolved quartets is shown forphylogenies based both on single gene fragments, and on the combineddata.
Christelová et al. BMC Evolutionary Biology 2011, 11:103http://www.biomedcentral.com/1471-2148/11/103
Page 9 of 13
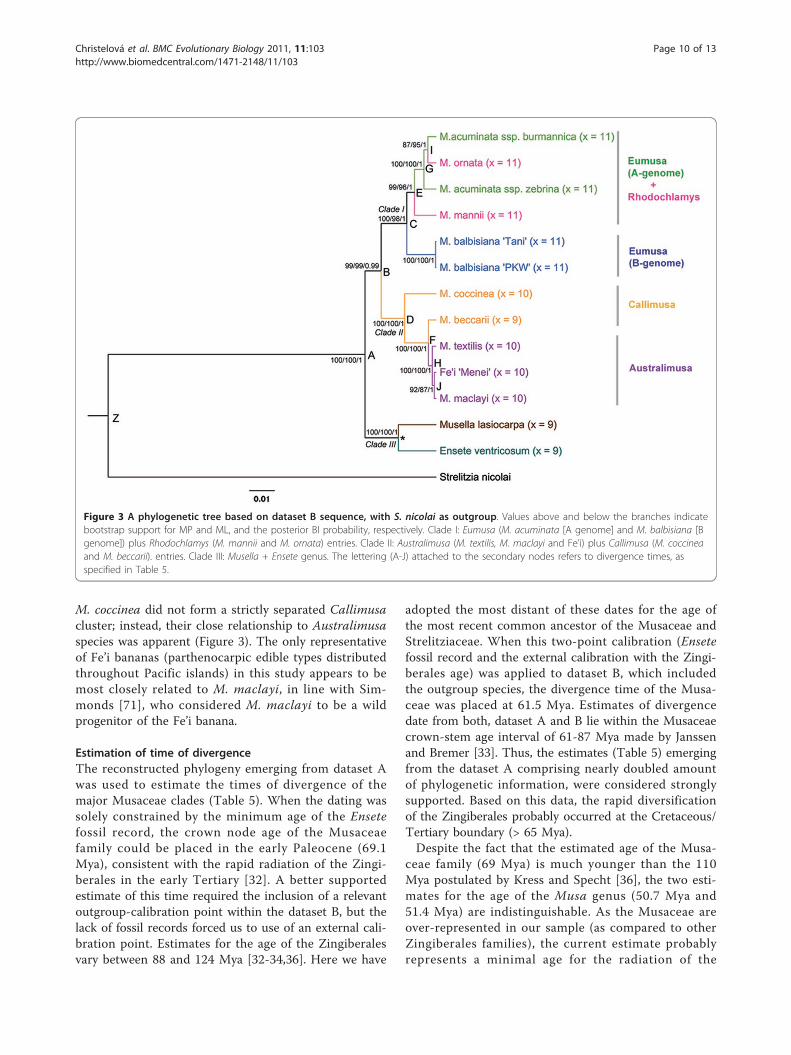
M. coccinea did not form a strictly separated Callimusacluster; instead, their close relationship to Australimusaspecies was apparent (Figure 3). The only representativeof Fe’i bananas (parthenocarpic edible types distributedthroughout Pacific islands) in this study appears to bemost closely related to M. maclayi, in line with Sim-monds [71], who considered M. maclayi to be a wildprogenitor of the Fe’i banana.
Estimation of time of divergenceThe reconstructed phylogeny emerging from dataset Awas used to estimate the times of divergence of themajor Musaceae clades (Table 5). When the dating wassolely constrained by the minimum age of the Ensetefossil record, the crown node age of the Musaceaefamily could be placed in the early Paleocene (69.1Mya), consistent with the rapid radiation of the Zingi-berales in the early Tertiary [32]. A better supportedestimate of this time required the inclusion of a relevantoutgroup-calibration point within the dataset B, but thelack of fossil records forced us to use of an external cali-bration point. Estimates for the age of the Zingiberalesvary between 88 and 124 Mya [32-34,36]. Here we have
adopted the most distant of these dates for the age ofthe most recent common ancestor of the Musaceae andStrelitziaceae. When this two-point calibration (Ensetefossil record and the external calibration with the Zingi-berales age) was applied to dataset B, which includedthe outgroup species, the divergence time of the Musa-ceae was placed at 61.5 Mya. Estimates of divergencedate from both, dataset A and B lie within the Musaceaecrown-stem age interval of 61-87 Mya made by Janssenand Bremer [33]. Thus, the estimates (Table 5) emergingfrom the dataset A comprising nearly doubled amountof phylogenetic information, were considered stronglysupported. Based on this data, the rapid diversificationof the Zingiberales probably occurred at the Cretaceous/Tertiary boundary (> 65 Mya).Despite the fact that the estimated age of the Musa-
ceae family (69 Mya) is much younger than the 110Mya postulated by Kress and Specht [36], the two esti-mates for the age of the Musa genus (50.7 Mya and51.4 Mya) are indistinguishable. As the Musaceae areover-represented in our sample (as compared to otherZingiberales families), the current estimate probablyrepresents a minimal age for the radiation of the
Figure 3 A phylogenetic tree based on dataset B sequence, with S. nicolai as outgroup. Values above and below the branches indicatebootstrap support for MP and ML, and the posterior BI probability, respectively. Clade I: Eumusa (M. acuminata [A genome] and M. balbisiana [Bgenome]) plus Rhodochlamys (M. mannii and M. ornata) entries. Clade II: Australimusa (M. textilis, M. maclayi and Fe’i) plus Callimusa (M. coccineaand M. beccarii). entries. Clade III: Musella + Ensete genus. The lettering (A-J) attached to the secondary nodes refers to divergence times, asspecified in Table 5.
Christelová et al. BMC Evolutionary Biology 2011, 11:103http://www.biomedcentral.com/1471-2148/11/103
Page 10 of 13

Musaceae. The present data can be used to date thespeciation events within both Australimusa/Callimusaand Rhodochlamys/Eumusa to some 28 Mya (Figure 3,nodes C, D). Within the Clade I, the B genome lineage(M. balbisiana species) was the first to diverge, followedby the M. mannii lineage, representing the Rhodochla-mys section, at 20 Mya. Speciation within the A genomelineage (M. acuminata species) began 11.4 Mya. Theminimum age of M. ornata, which appears to belong tothe A genome group within Eumusa section, is esti-mated to be 8.7 Mya (Figure 3; node I).Although M. mannii is an “imperfectly understood
small species up to 1.3 m high with purplish-red bractsthat do not curl back” [75], it undoubtedly belongs tosection Rhodochlamys, which is confined to the mon-soon-affected areas of Southeast Asia. Its characteristicdry-season die-back is presumably an adaptation todrought, and contrasts with the behavior of the Eumusaspecies endemic to the same geographical region, whichsurvive the dry season, although often in poor condition[71]. The monsoon regime was established following theformation of the Himalayas and the Tibetan plateau,and is thought to have stabilized in its current formaround 20-25 Mya [76]. The estimated divergence dateof M. mannii (20 Mya, Table 5) could therefore reflectan adaptation to climate change. The later divergencetime of the other Rhodochlamys member, M. ornata,could be explained by its probable derivation from ahybrid between M. velutina (section Rhodochlamys) andM. flaviflora, belonging to a taxon intermediate betweenRhodochlamys and Eumusa [73].The speciation of the Callimusa species can be dated
between 8.8 and 28.7 Mya, while the divergence of theAustralimusa species occurred ~5 Mya (Figure 3, nodesH, J). The relatively recent emergence of the section
Australimusa is consistent with its perception as an evolu-tionarily rather young group [77]. Shepherd [73] deter-mined that the “species” within this section behavegenetically as a single species, which he therefore desig-nated Musa textilis Née. The current phylogeny (Figure 3)supports this view, implying that M. textilis could well bethe founding species of the entire section. Numerical tax-onomy has placed M. textilis equidistant from the fourMusa sections [78]. In this context it is worth noting thatrobust and sterile diploid hybrids (’Canton’) between M.textilis (x = 10) and ‘Pacol’ (a form of M. balbisiana, x =11) are common in The Philippines.The divergence of M. coccinea appears to be rather
older than that of the members of the Australimusa sec-tion (Table 5). Unsuccessful attempts to cross two Calli-musa species M. coccinea and M. borneensis ledShepherd [79] to suggest that they differentiated fromone another long before the evolution of the Australi-musa species. The seed morphology of Callimusa spe-cies is very different from that of any of the other Musasections, being cylindrical, barrel- or top-shaped, andmarked externally by a transverse line or groove. Whenripe, they develop a large, empty chalazal (perisperm)chamber above the groove [10,77]. Although the mole-cular data alone indicate the paraphyletic position Calli-musa to Australimusa entries (Figure 3), given theabove mentioned morphological aspects and the flexibil-ity of the term “section” by Cheesman [3] we believethat merging the two Musa sections with x = 10, as pro-posed by Wong et al. [10] and indicated by Li et al. [8],is not tenable.
ConclusionsThe gene sequence-based phylogeny presented here pro-vides a substantial insight into the course of speciation
Table 5 Estimates of divergence time for species within the Musaceae family
Node description Nodedesignation(correspondsto Figure 3)
Divergencedate(mya)
HPD range a Reference
Ancestral split Z 124.0 n/a [36]
Calibration point (Ensete oregonense fossil record) * 43.0 n/a [51]
Musaceae A 69.1 57.8-80.5 present study
Musa B 50.7 40.4-61.5 present study
M. coccinea -remaining D 28.7 21.2-36.6 present study
Eumusa B genome-remaining C 27.9 21.5-34.4 present study
M. manni (Rhodochlamys)-remaining E 20.0 15.0-25.9 present study
Eumusa A genome G 11.4 8.6-14.7 present study
M. beccarii (Callimusa)-remaining F 8.8 6.1-11.4 present study
M. ornata I 8.8 6.2-11.8 present study
Australimusa section-remaining H 5.2 3.5-6.7 present study
Fe’i - M. maclayi J 2.5 1.4-3.6 present studya HPD range - the confidence interval of the BEAST analysis expressed as the highest posterior density (HPD) interval.
Christelová et al. BMC Evolutionary Biology 2011, 11:103http://www.biomedcentral.com/1471-2148/11/103
Page 11 of 13
within the Musaceae. The data tend to sustain the closerelationship of Rhodochlamys and Eumusa species, sup-porting the possibility of merging the two sections intoa single one. A greater number of species sampled couldgenerate an improved classification, and could help inclarifying the relationship between the species Rhodo-chlamys and M. acuminata, as well as to confirm thegeneric status of Musella and Ensete. Based on the lar-gest amount of nucleotide characters for Musaceaeobtained to date, this study provides the first estimatesof divergence times for individual Musa sections andgenome groups within the Musaceae. Although limitedby the number of species sampled from individual sec-tions and subgroups, we provide a plausible reconstruc-tion of speciation events within the Musaceae, a familywhich has given rise to one of mankind’s major crops.
Additional material
Additional file 1: Primer sequences used to amplify fragments ofthe 19 target genes.1476-072X-10-26Additional file 3: Phylogenybased on the Bayesian analysis of dataset A.
AcknowledgementsWe thank our colleagues Marie Seifertová, MSc. and Ms. Radka Tušková fortheir excellent technical assistance. We are grateful to Ir. Ines Van denHouwe for providing much of the plant material, François Côte for the giftof in vitro rooted plants of M. balbisiana ’PKW’ and Dr. Martin Dančák forsupplying leaves of S. nicolai. This research was jointly supported by theAcademy of Sciences of the Czech Republic (grant award IAA600380703),Internal Grant Agency of Palacký University (grant award no. Prf-2010-001)and by the Ministry of Education, Youth and Sports of the Czech Republicand the European Regional Development Fund (Operational ProgrammeResearch and Development for Innovations No. CZ.1.05/2.1.00/01.0007).
Author details1Centre of the Region Haná for Biotechnological and Agricultural Research,Institute of Experimental Botany, Sokolovská 6, 772 00 Olomouc, CzechRepublic. 2Laboratory of Tropical Crop Improvement, Katholieke UniversiteitLeuven, Kasteelpark Arenberg 13, Leuven, Belgium.
Authors’ contributionsPC carried out the experimental work, participated in the sequencealignment and phylogenetic analysis, and drafted the manuscript. MVparticipated in the design and coordination of the study, in thephylogenetic analysis and helped to compile the manuscript. EHparticipated in the sequence alignment and phylogenetic analysis. JDparticipated in the design and coordination of the study. EDL helped withthe taxonomic expertise. JD and EDL revised manuscript critically forimportant intellectual content. All authors read and approved the finalmanuscript.
Received: 6 October 2010 Accepted: 16 April 2011Published: 16 April 2011
References1. FAOStat. [http://faostat.fao.org/default.aspx].2. Angiosperm Phylogeny Group: An update of the Angiosperm Phylogeny
Group classification for the orders and families of flowering plants: APGIII. Bot J Linn Soc 2009, 161:105-121.
3. Cheesman EE: Classification of the bananas II. The genus Musa L. KewBulletin 1947, 2:106-117.
4. Simmonds NW, Shepherd K: The taxonomy and origins of cultivatedbananas. Bot J Linn Soc 1955, 55:302-312.
5. Argent GCG: The wild bananas of Papua New Guinea. Notes R Bot GardEdinburgh 1976, 35:77-114.
6. Gawel NJ, Jarret RL, Whittemore AP: Restriction fragment lengthpolymorphism (RFLP)-based phylogenetic analysis of Musa. Theor ApplGenet 1992, 84:286-290.
7. Bartoš J, Alkhimova O, Doleželová M, De Langhe E, Doležel J: Nucleargenome size and genomic distribution of ribosomal DNA in Musa andEnsete (Musaceae): taxonomic implications. Cytogenet Genome Res 2005,109:50-57.
8. Li LF, Häkkinen M, Yuan YM, Hao G, Ge XJ: Molecular phylogeny andsystematics of the banana family (Musaceae) inferred from multiplenuclear and chloroplast DNA fragments, with a special reference to thegenus Musa. Mol Phylogenet Evol 2010, 57:1-10.
9. Jarret RL, Gawel NJ: Molecular markers, genetic diversity and systematics.In Bananas and plantains. Edited by: Gowen S. London: Chapman and Hall;1995:67-83.
10. Wong C, Kiew R, Argent G, Set O, Lee SK, Gan YY: Assessment of the validityof the sections in Musa (Musaceae) using AFLP. Ann Bot 2002, 90:231-238.
11. Ude G, Pillay M, Nwakanma D, Tenkouano A: Analysis of genetic diversityand sectional relationships in Musa using AFLP markers. Theor Appl Genet2002, 104:1239-1245.
12. Olmstead RG, Palmer JD: A chloroplast DNA phylogeny of theSolanaceae: Subfamilial relationships and character evolution. AnnMissouri Bot Gard 1992, 79:346-360.
13. Doyle JJ, Doyle JL, Ballenger JA, Dickson EE, Kajita T, Ohashi H: Aphylogeny of the chloroplast gene rbcL in the Leguminosae: Taxonomiccorrelations and insights into the evolution of nodulation. Am J Bot 1997,84:541-554.
14. Beckert S, Steinhauser S, Muhle H, Knoop V: A molecular phylogeny ofbryophytes based on nucleotide sequence of the mitochondrial nad5gene. Plant Sys Evol 1999, 218:179-192.
15. Graham SW, Olmstead RG: Utility of 17 chloroplast genes for inferring thephylogeny of the basal angiosperms. Am J Bot 2000, 87:1712-1730.
16. Swangpol S, Volkaert H, Sotto RC, Seelanan T: Utility of selected non-coding chloroplast DNA sequences for lineage assessment of Musainterspecific hybrids. J Biochem Mol Biol 2007, 40:577-587.
17. Baldwin BG: Phylogenetic utility of the internal transcribed spacers ofnuclear ribosomal DNA in plants: An example from the Compositae. MolPhylogenet Evol 1992, 1:3-16.
18. Compton JA, Culham A, Gibbings JG, Jury SL: Phylogeny of Actaeaincluding Cimicifuga (Ranunculaceae) inferred from nrDNA ITS sequencevariation. Biochem Syst Ecol 1998, 26:185-197.
19. Kress WJ, Prince LM, Williams KJ: The phylogeny and a new classificationof the gingers (Zingiberaceae): Evidence from molecular data. Am J Bot2002, 89:1682-1696.
20. Eyre-Walker A, Gaut BS: Correlated rates of synonymous site evolutionacross plant genomes. Mol Biol Evol 1997, 14:455-460.
21. Dover G: Concerted evolution, molecular drive and natural selection. CurrBiol 1994, 4:1165-1166.
22. Álvarez I, Wendel JF: Ribosomal ITS sequences and plant phylogeneticinference. Mol Phylogenet Evol 2003, 29:417-434.
23. Feliner GN, Roselló JA: Better the devil we know? Guidelines for insightfulutilization of nrDNA ITS species-level evolutionary studies in plants. MolPhylogenet Evol 2007, 44:911-919.
24. Small RL, Ryburn JA, Cronn RC, Seelanan T, Wendel JF: The tortoise andthe hare: Choosing between noncoding plastome and nuclear ADHsequences for phylogeny reconstruction in a recently diverged plantgroup. Am J Bot 1998, 85:1301-1315.
25. Bailey CD, Doyle JJ: Potential phylogenetic utility of the low-copy nucleargene pistillata in dicotyledonous plants: Comparison to nrDNA ITS andtrnL intron in Sphaerocardamum and other Brassicaceae. Mol PhylogenetEvol 1999, 13:20-30.
26. Schulte K, Barfuss MHJ, Zizka G: Phylogeny of Bromelioideae(Bromeliaceae) inferred from nuclear and plastid DNA loci reveals theevolution of the tank habit within the subfamily. Mol Phylogenet Evol2009, 51:327-339.
27. Zou XH, Zhang FM, Zhang JG, Zang LL, Tang L, Wang J, Sang T, Ge S:Analysis of 142 genes resolves the rapid diversification of the ricegenus. Genome Biol 2008, 9:R49.
Christelová et al. BMC Evolutionary Biology 2011, 11:103http://www.biomedcentral.com/1471-2148/11/103
Page 12 of 13
28. Whittall JB, Medina-Marino A, Zimmer EA, Hodges SA: Generating single-copy nuclear gene data for a recent adaptive radiation. Mol PhylogenetEvol 2006, 39:124-134.
29. Boonruangrod R, Desai D, Fluch S, Berenyi M, Burg K: Identification ofcytoplasmic ancestor gene-pools of Musa acuminata Colla and Musabalbisiana Colla and their hybrids by chloroplast and mitochondrialhaplotyping. Theor Appl Genet 2008, 118:43-55.
30. Boonruangrod R, Fluch S, Burg K: Elucidation of origin of the present dayhybrid banana cultivars using the 5’ETS rDNA sequence information. MolBreeding 2009, 24:77-91.
31. Liu AZ, Kress WJ, Li DZ: Phylogenetic analyses of the banana family(Musaceae) based on nuclear ribosomal (ITS) and chloroplast (trnL-F)evidence. Taxon 2010, 59:20-28.
32. Bremer K: Early Cretaceous lineages of monocot flowering plants. ProcNatl Acad Sci USA 2000, 97:4707-4711.
33. Janssen T, Bremer K: The age of major monocot groups inferred from800+ rbcL sequences. Bot J Linn Soc 2004, 146:385-398.
34. Anderson CL, Janssen T: Monocots. In The timetree of life. Edited by: HedgesSB, Kumar S. New York: Oxford University Press; 2009:203-212.
35. Kress WJ, Prince LM, Hahn WJ, Zimmer E: Unraveling the evolutionaryradiation of the families of the Zingiberales using morphological andmolecular evidence. Syst Biol 2001, 50:926-944.
36. Kress WJ, Specht CD: The evolutionary and biogeographic origin anddiversification of the tropical monocot order Zingiberales. Aliso 2006,22:619-630.
37. Paterson AH, Bowers JE, Chapman BA: Ancient polyploidization predatingthe divergence of the cereals, and its consequences for comparativegenomics. Proc Natl Acad Sci USA 2004, 101:9903-9908.
38. Altschul SF, Gish W, Miller W, Myers EW, Lipman DJ: Basic local alignmentsearch tool. J Mol Biol 1990, 215:403-410.
39. Lessa EP: Rapid surveying of DNA sequence variation in naturalpopulations. Mol Biol Evol 1992, 9:323-330.
40. DNA Baser sequence assembly software. [http://www.dnabaser.com/].41. Thompson JD, Higgins DG, Gibson TJ: Clustal W: improving the sensitivity
of progressive multiple sequence alignment through sequenceweighting, position-specific gap penalties and weight matrix choice.Nucleic Acids Res 1994, 22:4673-4680.
42. Tamura K, Dudley J, Nei M, Kumar S: MEGA4: Molecular EvolutionaryGenetics Analysis (MEGA) software version 4.0. Mol Biol Evol 2007,24:1596-1599.
43. Swofford DL: PAUP*, Phylogenetic Analysis Using Parsimony (*and OtherMethods) v4.0b10. Sunderland: Sinauer Associates; 2003.
44. Nylander JAA: MrModeltest v2. Program distributed by the author.Uppsala: Evolutionary Biology Centre; 2004.
45. Drummond AJ, Rambaut A: BEAST: Bayesian evolutionary analysis bysampling trees. BMC Evol Biol 2007, 7:214.
46. Molecular evolution, phylogenetics and epidemiology software.[http://tree.bio.ed.ac.uk/software/figtree/].
47. Farris JS, Källersjö M, Kluge AG, Bult C: Testing significance ofincongruence. Cladistics 1994, 10:315-319.
48. Schmidt HA, Strimmer K, Vingron M, von Haeseler A: TREE-PUZZLE:maximum likelihood phylogenetic analysis using quartets and parallelcomputing. Bioinformatics 2002, 18:502-504.
49. Xia X, Xie Z: DAMBE: Software package for data analysis in molecularbiology and evolution. J Hered 2001, 92:371-373.
50. Strimmer K, Von Haeseler A: Likelihood mapping: A simple method tovisualize phylogenetic content of a sequence alignment. Proc Natl AcadSci USA 1997, 94:6815-6819.
51. Manchester SR, Kress WJ: Fossil bananas (Musaceae): Ensete oregonensesp. nov. from the Eocene of western North America and itsphytogeographic significance. Am J Bot 1993, 80:1264-1272.
52. Cheung F, Town CD: A BAC end view of the Musa acuminata genome.BMC Plant Biol 2007, 7:29.
53. Lescot M, Piffanelli P, Ciampi AY, Ruiz M, Blanc G, Leebens-Mack J, DaSilva FR, Santos CMR, D’Hont A, Garsmeur O, Vilarinhos AD, Kanamori H,Matsumoto T, Ronning CM, Cheung F, Haas BJ, Althoff R, Arbogast T,Hine E, Pappas GJ Jr, Sasaki T, Souza MT Jr, Miller RNG, Glaszmann JC,Town CD: Insights into the Musa genome: Syntenic relationships to riceand between Musa species. BMC Genomics 2008, 9:58.
54. Zwickl DJ, Hillis DM: Increased taxon sampling greatly reducesphylogenetic error. Syst Biol 2002, 51:588-598.
55. Hillis DM, Pollock DD, McGuire JA, Zwickl DJ: Is sparse taxon sampling aproblem for phylogenetic inference? Syst Biol 2003, 52:124-126.
56. Poe S, Swofford DL: Taxon sampling revisited. Nature 1999, 398:299-300.57. Rosenberg MS, Kumar S: Incomplete taxon sampling is not a problem for
phylogenetic inference. Proc Natl Acad Sci USA 2001, 98:10751-10756.58. Rosenberg MS, Kumar S: Taxon sampling, bioinformatics and
phylogenomics. Syst Biol 2003, 52:119-124.59. Hillis DM: Taxonomic sampling, phylogenetic accuracy, and investigator
bias. Syst Biol 1998, 47:3-8.60. Lorković ZJ, Wieczorek DA, Lambermon MHL, Filipowicz W: Pre-mRNA
splicing in higher plants. Trends Plant Sci 2000, 5:160-167.61. Jeffroy O, Brinkmann H, Delsuc F, Philippe H: Phylogenomics: the
beginning of incongruence? Trends Genet 2006, 22:225-231.62. Phillips MJ, Delsuc F, Penny D: Genome-scale phylogeny and the
detection of systematic biases. Mol Biol Evol 2004, 21:1455-1458.63. Akaike H: A new look at the statistical model identification. IEEE Trans
Autom Control 1974, 19:716-723.64. Posada D, Buckley TR: Model selection and model averaging in
phylogenetics: Advantages of Akaike information criterion and Bayesianapproaches over likelihood ratio tests. Syst Biol 2004, 53:793-808.
65. Yoder AD, Irwin JA, Payseur BA: Failure of the ILD to determine datacombinability for slow loris phylogeny. Syst Biol 2001, 50:408-424.
66. Planet PJ: Tree disagreement: Measuring and testing incongruence inphylogenies. J Biomed Inform 2006, 39:86-102.
67. Ramírez MJ: Further problems with the incongruence length differencetest: ‘’hypercongruence’’ effect and multiple comparisons. Cladistics 2006,22:289-295.
68. Rokas A, Williams BL, King N, Carroll SB: Genome-scale approaches toresolving incongruence in molecular phylogenies. Nature 2003,425:798-804.
69. Ruangsuttapha S, Eimert K, Schröder MB, Silayoi B, Denduangboripant J,Kanchanapoom K: Molecular phylogeny of banana cultivars fromThailand based on HAT-RAPD markers. Genet Resour Crop Evol 2007,54:1565-1572.
70. Hřibová E, Čížková J, Christelová P, Taudien S, De Langhe E, Doležel J: TheITS1-5.8S-ITS2 sequence region in the Musaceae: structure, diversity anduse in molecular phylogeny. Plos One 6:e17863.
71. Simmonds NW: Botanical results of the banana collecting expeditions,1954-5. Kew Bulletin 1956, 11:463-489.
72. Simmonds NW: Isolation in Musa, sections Eumusa and Rhodochlamys.Evolution 1954, 8:65-74.
73. Shepherd K: Cytogenetics of the genus Musa. Montpellier: INIBAP; 1999.74. Wong C, Kiew R, Ohn S, Lamb A, Lee SK, Gan LH, Gan YY: Sectional
placement of three Bornean species of Musa (Musaceae) based on AFLP.Gardens’ Bulletin Singapore 2001, 53:327-341.
75. Argent GCG: Musaceae. In The European Garden Flora. Volume II.Monocotyledons (Part 2): Juncaceae to Orchidaceae. Edited by: Walters SM,Brady A, Brickell CD, Cullen J, Green PS, Lewis J, Matthews VA, Webb, DA,Yeo PF, Alexander JCM. New York: Cambridge University Press;1984:117-119.
76. Harris N: The elevation history of the Tibetan Plateau and its implicationsfor the Asian monsoon. Palaeogeogr Palaeoclimatol Palaeoecol 2006,241:4-15.
77. Simmonds NW: The evolution of the bananas. London: Longman; 1962.78. De Langhe E: Diversity in the genus Musa: its significance and its
potential. Acta Hort 2000, 540:81-88.79. Shepherd K: Observations on Musa taxonomy. In Identification of genetic
diversity in the genus Musa: Proceedings of an international workshop held atlos Baños, Philippines, 5-10 September 1988. Edited by: Jarret RL. Montpellier:INIBAP; 1990:158-165.
80. Tamura K, Nei M: Estimation of the number of nucleotide substitutions inthe control region of mitochondrial DNA in humans and chimpanzees.Mol Biol Evol 1993, 10:512-526.
doi:10.1186/1471-2148-11-103Cite this article as: Christelová et al.: A multi gene sequence-basedphylogeny of the Musaceae (banana) family. BMC Evolutionary Biology2011 11:103.
Christelová et al. BMC Evolutionary Biology 2011, 11:103http://www.biomedcentral.com/1471-2148/11/103
Page 13 of 13