A Comparison of the Ratings of Black, Hispanic, And White Childrens' Academic Performance, Amos N....
138
INFORMATION TO USERS This manuscript has been reproduced from the microfilm master. UMI films the text directly from the original or copy submitted. Thus, some thesis and dissertation copies are in typewriter face, while others may be from any type of computer printer. The quality of this reproduction is dependent upon the quality of the copy submitted. Broken or indistinct print, colored or poor quality illustrations and photographs, print bleedthrough, substandard margins, and improper alignment can adversely affect reproduction. In the unlikely event that the author did not send UMI a complete manuscript and there are missing pages, these will be noted. Also, if unauthorized copyright material had to be removed, a note will indicate the deletion. Oversize materials (e.g., maps, drawings, charts) are reproduced by sectioning the original, beginning at the upper left-hand corner and continuing from left to right in equal sections with small overlaps. Each original is also photographed in one exposure and is included in reduced form at the back of the book. Photographs included in the original manuscript have been reproduced xerographically in this copy. Higher quality 6" x 9" black and white photographic prints are available for any photographs or illustrations appearing in this copy for an additional charge. Contact UMI directly to order. UMI University Microfilms International A Bell & Howell Information Company 300 North Zeeb Road Ann Arbor, Ml 48106-1346 USA 313/761-4700 800/521-0600
-
Upload
maridjata5 -
Category
Documents
-
view
278 -
download
2
Transcript of A Comparison of the Ratings of Black, Hispanic, And White Childrens' Academic Performance, Amos N....

INFORMATION TO USERS
This manuscript has been reproduced from the microfilm master. UMI films the text directly from the original or copy submitted. Thus, some thesis and dissertation copies are in typewriter face, while others may be from any type of computer printer.
The quality of this reproduction is dependent upon the quality of the copy submitted. Broken or indistinct print, colored or poor quality illustrations and photographs, print bleedthrough, substandard margins, and improper alignment can adversely affect reproduction.
In the unlikely event that the author did not send UMI a complete manuscript and there are missing pages, these will be noted. Also, if unauthorized copyright material had to be removed, a note will indicate the deletion.
Oversize materials (e.g., maps, drawings, charts) are reproduced by sectioning the original, beginning at the upper left-hand corner and continuing from left to right in equal sections with small overlaps. Each original is also photographed in one exposure and is included in reduced form at the back of the book.
Photographs included in the original manuscript have been reproduced xerographically in this copy. Higher quality 6" x 9" black and white photographic prints are available for any photographs or illustrations appearing in this copy for an additional charge. Contact UMI directly to order.
UMI University Microfilms International
A Bell & Howell Information Company 300 North Zeeb Road Ann Arbor, Ml 48106-1346 USA
313/761-4700 800/521-0600


Order Number 9215358
A comparison of the ratings of Black, Hispanic, and White childrens' academic performance and social adjustment as related to teachers' ethnocultural background
Wilson, Amos Nelson, Ph.D.
Fordham University, 1991
U-M-I 300N.ZeebRd. Ann Arbor, MI 48106


A COMPARISON OF THE RATINGS OF BLACK, HISPANIC, AND WHITE
CHILDRENS' ACADEMIC PERFORMANCE AND SOCIAL ADJUSTMENT AS
RELATED TO TEACHERS' ETHNOCULTURAL BACKGROUND
BY
Amos N. Wilson B.A., Morehouse College, 1963 M.A., Fordham University, 1986
DISSERTATION SUBMITTED IN PARTIAL FULFILLMENT OF THE REQUIREMENTS
FOR THE DEGREE OF DOCTOR OF PHILOSOPHY IN THE DEPARTMENT OF PSYCHOLOGY AT FORDHAM UNIVERSITY
NEW YORK December 1991
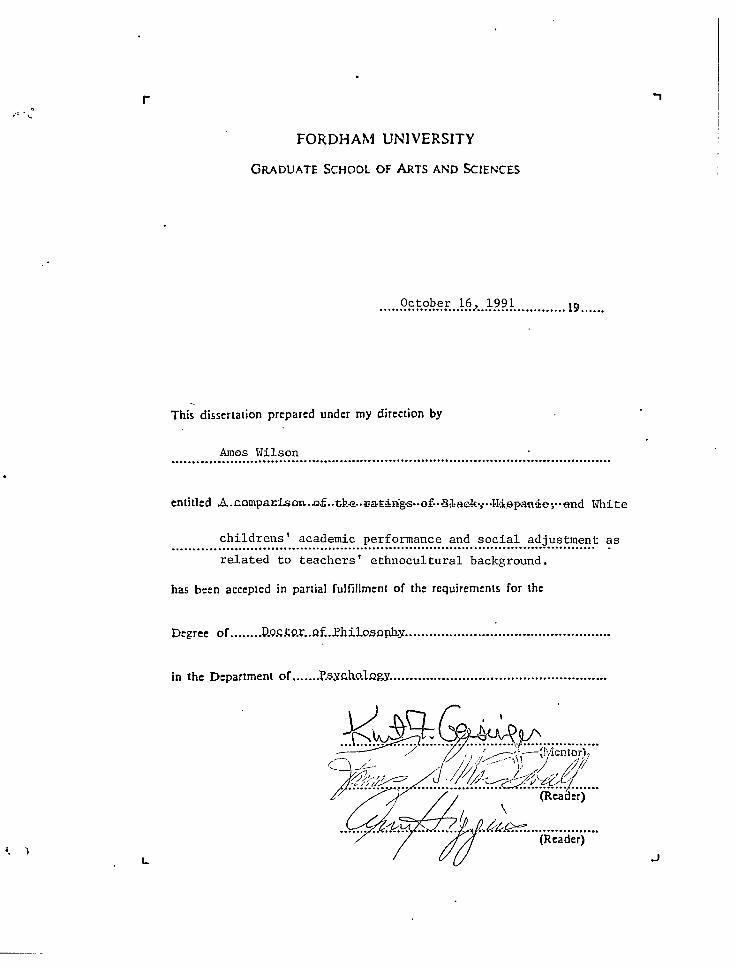
FORDHAM UNIVERSITY
GRADUATE SCHOOL OF ARTS AND SCIENCES
_ _0c tob e r _ _16 A _ 19 91 .19.
This dissertation prepared under my direction by
Amos Wilson
entitled A.comparison.«£..fcfo-e..£ating-S"Of--rBlackyH-i.epaniey-end White
childrens' academic performance and social adjustment as
related to teachers' ethnocultural background.
has been accepted in partial fuinilment of the requirements for the
Degree of P.oc£p.r..a£.Philosophy.,
in the Department of P.SXfiUolflgy..

TABLE OF CONTENTS
Chapter Page
LIST OF TABLES ii
I. INTRODUCTION 1
Literature Review 5
Conceptual Hypotheses 35
II. METHOD 37
Subjects 37
Instrument 38
Procedure 42
Operational Hypotheses 45
III. RESULTS 49
IV. DISCUSSION 74
V. SUMMARY 97
REFERENCES Ill
APPENDICES 117
A. Report to Parent Card 117
B. Consent Letter 118
C. Research Application Form 119
D. Eigenvalues of Correlation Matrix . . . . . . .120
E. Multiple Regression Analysis 121
ABSTRACT 122
VITA 123
i

LIST OF TABLES
Table Page
1. List of Dependent Variables 40
2. Demographic Characteristics of Samples 50
3. Overall Means and Standard Deviations of Combined Student Samples 50
4. Means and Standard Deviations Assigned by the Black Teacher Sub-sample 52
5. Means and Standard Deviations Assigned by the Hispanic Teacher Sub-sample 54
6. Means and Standard Deviations Assigned by
the White Teacher Sub-sample 56
7. Rotated Factor Pattern 59
8. Mean Reading and Math Scores and the Final Analysis of Variance 65
9. Mean Rating of Each Student Group and the Final Multivariate Analysis of Variance 66
10. The Comparative Mean Ratings of Student Performance by Each Teacher Group 73
ii

CHAPTER I
INTRODUCTION
In conjunction with parents, teachers are among the
most influential persons in children's lives, particularly
during the primary school years. It is during these years
that children are relatively deeply impressed by their
teachers' evaluations of and interactions with them
(Brookover & Erikson, 1969). There is a substantial body of
evidence which indicates that teacher preferences and
attitudes can affect teacher-student interaction patterns
resulting in the inhibition or facilitation of student
academic/intellectual, self-concept, and social skill
development (Brookover & Erikson, 1967; 1969; Crano & Mellon,
1978; Davidson & Lang, 1969; Dusek & O'Connell, 1973;
Glidewell, Kantor, Smith, & Stringer, 1966; Good & Brody,
1973; Parlardy, 1968; 1969; Phillips, 1965; Rist, 1970;
Seaver, 1973; Shore, 1973; Staines, 1958).
Teachers' expectations for students' classroom academic
performance and behavior are influenced by their perceptions
of different ethnic and social-class groups (Rosenfeld, 1973;
Rubovitz S Maehr, 1973; Washington, 1980, 1982; Whitehead &
Miller, 1972; Williams, Whitehead, & Miller, 1971; Woodworth
& Salzer, 1971). The communication of these expectations
through both verbal and nonverbal means is likely to act as a
1

subtle yet effective shaping mechanism for student behavior
(Brophy & Good, 1970; Good, 1970; Good, Brophy, & Mendosa,
1970; Jensen & Rosenfeld, 1974; Rosenshine, 1971; Rothbart,
1971; Rowe, 1974; Scott, 1980). This shaping or perception
of student behavior in terms of teacher expectations may, in
part, account for a large proportion of the differences in
educational attainment for different ethnic groups.
It is generally noted by educational theorists and
researchers that the academic performance, achievement
motivation, and self-perceptions of Black and Hispanic
students generally rank below that of their White
counterparts (Coleman, 1975; Gerard & Miller, 1975; National
Coalition of Advocates for Students, 1985; Weikart, 1984).
For example, Black students fail competency tests in larger
proportions than do their White or Asian counterparts, and in
some communities, than their Hispanic peers (National Urban
League, 1984). Evidence exists which indicates that there
are significant differences in grade-point average,
achievement test performance, drop-out rates, reading
levels, etc., attained by various ethnic groups (Blackwell,
1984; Coleman, 1966; College Board, 1985; Jensen, 1980;
National Urban League, 1985). This and related evidence have
demonstrated relationships between the above factors and such
factors as socioeconomic class, family, cultural, and ethnic
background. For example the College Board (1985) presented
evidence which suggests that "Overall... black students are
2

exposed to less-challenging educational program offerings
which are less likely to enhance the development of higher
order cognitive skills and abilities than are white
students." Black students are more likely to be enrolled in
remedial programs than in programs for the talented and
gifted, more likely to be in vocational education than in
college prep programs, and are likely to have taken fewer
courses in math, science, and social studies. The Board
concludes that these outcomes are to a measurable degree due
to teachers* partial perceptions of their students. Such
decisions, it was noted, are made during the elementary
school years. A similar situation exists in regard to
Hispanic students (National Commission on Secondary Schooling
for Hispanics, 1985).
A number of theorists and researchers have contended
that the relatively lower achievement and self-concept of
Black and Hispanic children may be, in part, due to lower
expectations for high performance and less positive attitudes
toward these students by their teachers (Banks & Grambs,
1972; Clark, 1964; Lanier & Wittmer, 1977; Rist, 1970;
Tucker, 1980). However, before this attitude-oriented
contention can be accepted,, it is necessary to demonstrate
that (1) teachers' different attitudes toward each of their
students affect the performance of those students; and that
(2) students' perceptions of themselves are related to their
teachers' perception of them. After evidence for these
3
latter assertions has been presented, it is necessary to
demonstrate that (3) teachers' expectations in regard to
students' academic performance are related to and reflective
of their students' ethnocultural, linguistic, and social
status backgrounds.
One major source of differing teacher attitudes toward
students of varying ethnocultural backgrounds may be the
ethnocultural background of the teachers themselves. It is
the purpose of the following review to present some of the
evidence which relates to the three propositions enumerated
above as well as the latter contention that teachers'
ethnocultural background may be a source of their attitudes
toward their students.
Presumably, according to the above research, if
teachers' observable evaluations and perceptions are based on
non-objective and negative ethnic, social class, and cultural
typification, students who are the targets of such attitudes
should evidence lower academic performance and social
adjustment than their counterparts not so targeted. Those
groups who are seen as possessing devalued status
characteristics, e.g., Blacks, Hispanics, would be accorded
lower academic and behavioral ratings (Jensen &. Rosenfeld,
1974) .
It may be concluded that relative to their apparent
influence on the academic achievement and social adjustment
of students, a determination of the relationship between
4

teacher attitudes and teacher evaluations of their students
is of critical importance. Also of importance is the
determination of the origins of teachers' attitudinal
orientations toward their students. A delineation of the
sources of such orientations is of primary importance if the
orientations are subject to bias and should be remediated.
LITERATURE REVIEW
Teacher Attitudes and Student Academic Performance
Dusek and O'Connell (1973) undertook a longitudinal
study of teacher expectancy effects on the achievement test
performance of elementary school pupils as measured by the
Stanford Achievement Tests (SAT). At the beginning of the
school year, SATs, disguised as tests to measure academic
potential, were administered to second and fourth graders.
During the first test session each teacher (without knowledge
of test results) was asked to predict her students' year-end
performance levels in language and arithmetic skills. Each
teacher was also asked to rank the students in her classroom
from 1 to N based on her expectations regarding their
overall year-end performance. The teachers were told that
testing would be conducted at the middle and end of the
school year and that the tests would be validated by
comparing the scores with school grades and teacher
attitudes toward individual students.
Dusek and O'Connell found strong, consistent effects on
5

student performance which appeared to be due to teacher
rankings. Children ranked higher by the teacher had higher
SAT scores on each testing than children ranked lower. These
results were interpreted as "expectancy effects" since the
rankings were based on the teachers* expectations regarding
the students' year-end performance. Of course, it is also
quite possible that the effects due to teacher rankings
reflected the teachers' accuracy in estimating the ability
levels of their students. That is, quite possibly the
children's academic potential determined the teachers'
expectation rather than the reverse.
A more direct study of the influence of teachers•
expectations on students' scholastic achievement was
undertaken by Palardy (1968, 1969). Specifically, he sought
to determine whether teachers' reported beliefs about first-
grade boys' probable success in reading had any effect on
their achievement in that area. To arrive at this
determination Palardy administered a questionnaire designed
to elicit teachers* beliefs concerning the probable success
of first-grade boys in learning to read.
At the beginning of the school year, five first-grade
teachers who reported that they believed that boys are as
successful as girls in learning to read (Group A) were
matched with five teachers who indicated that they believed
that boys are less successful than girls in learning to read
(Group B). It was found that in Group A the boys achieved as
6

well as the girls. In Group B the boys were less successful
than the girls.
Palardy's study seems to suggest that teachers' beliefs
and expectancies regarding their pupils' potential for
learning may affect their academic achievement. The quasi-
experimental design of the study makes such a conclusion
somewhat tentative, however.
Seaver (1973) obtained a sample of 79 pairs of siblings
from the class rosters of two elementary and junior high
schools in which they were enrolled. The sibling pairs
included in the sample were separated by no more than three
grade levels and had completed Grade 1 in the same school.
Younger siblings were classified according to whether their
older sibling had been a high or low performer in Grade 1.
It was hypothesized that pupils taught by the same teachers
as their older siblings (expectancy condition) would perform
better than those taught by a different teacher (control
condition) if their older siblings had been good students and
worse than the controls if their older siblings had performed
poorly.
The mean scores of the younger siblings as measured by
SAT subtests and their teacher - assigned Winter and Spring
grade-point averages were computed and compared. As
predicted, when the older siblings' performance was high, the
younger siblings taught by the same teachers scored higher (
than the control group on all variables. Conversely, when
7
the older siblings' performance was low, the expectancy group
(younger siblings taught by the same teachers) scored lower
than the controls.
The findings of Seaver's study suggest again that
student performance is influenced in a predictable direction
by teacher expectations. The findings are, however, only
suggestive due to the correlational nature of the study.
Objectively, it establishes a correlation between performance
of older and younger siblings for those with the same
teacher. Nevertheless, it is difficult to separate the
effects of home environment and student expectancies from
those of teacher expectancies. The obtained effects could be
attributed to the students as well as the their teachers. It
is quite likely, for example, that student expectancies were
derived in part from knowledge of their older siblings'
experiences with the same teacher which may in some
substantial way, have influenced their performance as much as
or more than did teacher expectancies. These factors suggest
that the results of Seaver's study while suggestive are
equivocal.
Sutherland and Goldschmid (1974) provide evidence that
low or negative teacher expectations may adversely affect the
performance of pupils with high academic potential. They
asked a group of elementary school teachers to use their own
subjective criteria to estimate each of their pupils'
academic ability. The students were rated according to the
8

following categories: (1) poor, (2) below average, (3)
average, (4) above average, and (5) superior. The students
were administered IQ tests individually with a pre- and
posttest interval of five months.
The results indicated that where the teacher ranked a
superior student, as defined by a high IQ, as "average" or
"below average" the IQs of those students decreased during
the test intervals. No significant positive or negative
changes in IQ occurred when the teacher ranked a superior
student as "above average" or "superior." No relationship
was found between teachers* expectations and IQ gain whether
or not original IQ values were partialled out. Thus, it
appears that intellectual development and functioning may be
adversely affected when a teacher expects less from a
superior student than he is capable of delivering. The
results also suggest that it may be easier to lower the
performance level of a child with relatively high academic
potential relative to his teacher's expectation than it would
to accomplish the reverse. Once again, other interpretations
are also possible.
A critical issue germane to the relationship between
teacher expectations and student achievement is that of
causation: Do children's characteristics and actions
determine teachers' expectations or are teachers'
expectations determined by children's academic and social
behavior? Crano and Mellon (1978) utilized the cross-lagged
9

panel correlational method (Campbell, 1963; Campbell &
Stanley, 1963; Pelz & Andrews, 1964) which permits causal as
opposed to purely correlational inferences, in an attempt to
answer this question.
Crano and Mellon utilized a sample of 4,300 beginning
elementary pupils. The students were tested at yearly
intervals for four years on a number of social, attitudinal,
and academic variables. Teachers* rankings of the children's
general classroom demeanor (e.g., the student's propensity to
disobey, to be orderly, etc.); reasoning or arithmetic
ability (two types of rating); and global or general
abilities, were obtained. In addition, the students were
administered achievement tests at the end of each of the four
years of the study.
Crano and Mello found positive differences in 62 of 84
possible comparisons indicative of the causal primacy of the
teachers' evaluations and expectations of the pupils' later
performance. While they did not deny that the pupils' early
performance influenced later teacher evaluations, they
concluded that the effect of early expectations and
evaluations made by the teachers far outweighed the impact of
early student performance and behavior on later esrpectations.
Conceptually, Crano and Mellon's study assessed two
different types of teacher expectancies. One type was
concerned primarily with the child's social skills or
conduct: Did the child have a positive attitude toward
10

school work, was he a pleasure to have in class, was he
obedient? The second type was concerned with the teacher's
evaluation of the child's academic status, as denoted by the
ratings of the child's reading and arithmetic and general
ability.
The most consistent result in favor of the expectancy
hypothesis was obtained from teachers' ratings of the
students' social skills rather than their academic
performance. This finding suggests that teachers'
expectations are not merely reflective of the pupils'
objectively determined academic skills. If this
interpretation were accurate it would be expected that the
academic expectancy measures would have been more predictive
of later performance than the social expectancy measures. It
should be noted that some of the social ratings items
utilized by Crano and Mellon, e.g., "positive attitude toward
school work" and "pleasure to have in class," could be
arguably classified as academic ratings. Thus, a teacher's
social evaluations and expectations of a child would appear
to have significant impact on that child's academic
performance.
Crano and Mellon's findings do not invalidate the
assumption that teachers * expectations are caused by student
performances. The results to a degree support that
assumption. However, the findings very strongly suggest that
teachers' expectations significantly influence the
11
{
performance of students. They further suggest that teachers'
expectations influence students' performances more than
students' performances influence teachers' expectations.
Collectively, the studies reviewed to this point
suggest that differential teacher attitudes regarding
students' academic behavior may well be actualized in the
students' achievement and growth.
Teacher Attitudes and Student Self-perceptions
There is a substantial body of evidence which suggests
that differential teacher attitudes may influence students•
self-concepts as well as their classroom performance. That
is, pupils' self-perceptions to a significant degree are
formed through interaction with their teachers (Banks &
Grambs, 1972; Brookover & Erikson, 1967; 1969; Davidson &
Lang, 1965; Foshay, 1953; Glidewell et al., 1966; Morse,
1964; Perkins, 1958; Slobetz & Lund, 1956; Staines, 1965;
Wattenberg & Clifford, 1962; Washburne & Heil, 1960;
Washington, 1979). Generally, these studies have found
strong relationships between children's self-concepts and
their academic achievement. Moreover, they further suggest
that the more positive students believe their teachers feel
about them, the better their academic performance.
In a representative study Davidson and Lang (1965)
attempted to determine if pupils' perception of their
teachers' feelings are related to their self-concept, school
achievement, and classroom behavior. They began by
12

administering a checklist of trait names used by respondents
to describe how people feel about them and how they feel
about themselves, to 203 fourth, fifth, and sixth graders in
a New York City public school. The list was administered
twice. During the first administration the pupils were
instructed to respond to the 35 adjectives comprising the
list in terms of "My teacher thinks I am ..." This list or
scale yields a measure of perceived teacher feelings,
referred to as the Index of Favorability. The second
administration of the checklist measured the students' self-
perceptions.
The teachers rated how well their pupils performed
academically on a four-point scale: Very Well, Adequately,
Below Average, and Very Poorly. At the same time, the
teacher also rated each child on 10 behavioral or personality
characteristics.
Correlational analyses of the results of the four
measurements just described indicated clearly that the
pupils who had a more favorable or positive self-concept
also perceived their teachers' feelings toward them to be
more favorable or positive. This finding supports the view
that a pupil's self assessment is related to his or her
perception of how "significant people" feel about him or her.
It was also found that while not necessarily causally
related, the more positive the pupil's perception of their
teachers' feelings, the better their academic achievement.
13

These findings are consistent with previous studies by
Ausubel (1954) and Jourard and Remy (1955) which indicated
that teachers are among the significant people believed to
affect children's feeling about themselves.
Finally, Davidson and Lang also found that the more
positive the children's perception of their teachers'
feelings, the better was their academic achievement and the
more desirable their classroom behavior as rated by the
teachers. The children who were rated by their teachers, as
being disorderly, defiant, unfriendly, or troublesome,
perceived their teachers' feelings toward them as being less
favorable than children not so rated. Furthermore, the mean
favorability index declined with decline in achievement level
and decline in social class.
Overall, the results of Davidson and Lang's study seem
to imply that a teacher's reaction to a child may be
influenced by his or her social status and other personal and
behavioral characteristics. The study does not lend itself
to the determination of causality. It does suggest, however,
that certain pupils* characteristics, such as self-
perception, perceived teacher feelings, achievement, and
behavior in school, are interrelated.
The preceding review of the literature was concerned
with evidence with seems to demonstrate a relationship
between teacher attitudes and the nature of students'
classroom behavior. The literature seems to support the
14

following contentions: teachers form differing attitudes
toward students' academic abilities and behaviors; and
students' self-perception and performance tend to reflect
their perceived teacher attitudes toward them.
Teachers' Attitudes and Perceived Student Characteristics
While it is important to determine whether teachers
hold differing attitudes toward their students and whether
these attitudes influence student academic performance, it is
equally important to determine the source or basis for such
attitudes. The source presumably may be located in two major
areas - the teachers' subjective reactions to certain
attributes of their students and the ethnocultural make-up of
the teachers themselves.
This section provides a brief look at some student
attributes which appear to elicit differentiating teacher
attitudes and interactions. Among the more salient student
attributes which have been shown to elicit differing teacher
attitudes are ethnicity, socioeconomic status, divergent
speech patterns and gender (Stern & Keislar, 1977). In
accordance with the central concern of this proposal only
those studies pertaining to student ethnicity and linguistic
orientations are reviewed here.
Student Ethnicity and Teachers' Attitudes. Research
indicates that disadvantaged, racial minority, and lower
class children are perceived differently by their teachers,
in contrast to their advantaged, racial majority, and middle
15

class counterparts. For example, Jensen and Rosenfeld (1974)
conducted an experiment wherein teachers were selected from a
randomly generated list of schools in a large southwestern
city. The teachers were asked to evaluate individual middle
and lower class Anglo, Chicano, and Black students on a set
of 15 semantic-differential scales dealing with teachers*
classroom evaluative criteria.
The teachers were placed into groups based upon mode of
stimulus presentation; audio (listening to speech without
visual cues), visual (seeing without vocal cues), and audio
visual (seeing and hearing stimuli simultaneously) and were
then exposed to videotapes of the students. The students
were recorded in interview situations in which they were
asked to discuss their favorite television shows and games.
The tapes contained edited portions of these interviews which
were approximately two minutes in duration. After exposure
to the stimulus tapes, the teachers rated each student on the
semantic scales. Overall, Jensen and Rosenfeld found that
Anglo students were regarded more favorably than either Black
and Chicano students, respectively. This preference was
generally the case in all modes of presentation.
Lov/er class anglo students were generally rated more
favorably than both middle- and lower-class Chicanos. These
findings are consistent with the results of similar studies
which dealt with the evaluation of various ethnic groups
based on vocal cues (Harms, 1961; Moe, 1972; Naremore, 1971;
16

Williams et al., 1971). These studies found that social
class made no significant difference in the ratings for
Chicano students, who were consistently rated at the lower
end of the scales.
Utilizing an interaction coding system to classify
teacher verbal behavior as related to student behavior,
Jackson and Cosca (1974) assessed teacher verbal behavior
with reference student ethnicity within schools of the
Southwest United States. Observers visited 494 classrooms
which were predominately Anglo and Chicano in student
composition. They found that the teachers observed, praised,
or encouraged Anglo students 35% more than they did Chicano
students. In addition, teachers accepted or used Anglo
students1 ideas 40% more than they did those of Chicano
students, and directed 21% more questions to Anglos than to
Chicanos. While this study does not specify whether its
findings applied irrespective of what the students said, it
suggests that teachers tend to interact with their students
in terms of the latter's ethnic characteristics.
Marwit, Marwit, and Walker (1978) executed a study of
the effects of student ethnicity on teacher judgment of the
severity of classroom misbehavior. They designed an
instrument consisting of fabricated "incident reports"
(descriptions of student behavioral transgressions in the
classroom) to 60 White student teachers. On page one of the
instrument appeared the picture of a fourth grade Black or
17

White child who had "perpetrated the incident." The second
page consisted of 15 statements regarding the severity of the
incident ("e.g., Compared to everyday classroom behaviors,
the misbehavior described is not serious"), disciplinary
action recommended ("e.g., I would normally recommend
suspension from school for such an incident."), or character
evaluation ("e.g., Considering the situation, it is likely
that the child will indulge in behavior similar to this in
the future."). Each statement was followed by a five-point
Likert-type scale ranging from "strongly agree" to "strongly
disagree." Page three consisted of the Pupil Control
Ideology Scale, a teacher authoritarianism scale developed by
Willower et al. (1973). This scale was included as a measure
of concurrent validity for the 15-item "incident" scale.
The instrument was administered to the student teachers
during orientation to student teaching and again 16 weeks
later at the conclusion of practice teaching. It was found
that no racial partiality was exhibited in the teachers'
responses to the fabricated reports, prior to student
teaching. That is, there was not a significant difference
between Black and White student pre-teaching evaluations.
Post-teaching ratings showed a significant increase in how
the teachers judged the severity of the Black children's
misbehaviors. No comparable change occurred in the ratings
of the White children. (
Teacher Attitudes and Student Speech Characteristics
18

The language or dialect spoken by the student is an
attribute which is frequently confounded with student
ethnicity and social class. Anisfeld et al. (1962), Buck
(1968), Naremore (1971), and Williams and Naremore (1971)
provide evidence that ethnic and social class
characteristics are transmitted paralinguistically, i.e.,
through the non-content, vocal properties of speech.
Cohen and Kimmerling (1971) in their review of 18
studies dealing with attitudes based on speech differences,
reported that race was correctly identified from hearing
alone 95% of the time. The speech patterns heard were
associated by their listeners with stereotypical attitudes
regarding the personal traits and abilities of the speakers.
Cohen and Kimmerling noted that without exception the
research literature indicates that linguistically based
attitudes and stereotypes affect teachers• perceptions of
their students. Interestingly, they also noted that if the
same linguistic performance is attributed to a White student
it is given a higher rating by White teachers. Furthermore,
nonstandard speakers are consistently rated low in education,
intelligence, socioeconomic status, and speaking ability.
A comprehensive series of studies carried out by
Williams et al. (1971), suggest that judgments based on
speech characteristics are generally predictive of how
children are both graded and assigned to classrooms.
Rosenfeld (1973) found that listening to speech with no
19

visual cues as to the race of the speaker, was the most
critical factor (as compared to visual and combined
audiovisual factors) in establishing the stereotypical
attitudes of teachers. Similarly, Gilberts, Guckin, & Leeds
(1972) found that while ethnicity, social class, and language
cues affect the ratings White teachers assign to students,
language and social class have far greater impact in
producing negative assessments.
In the foregoing sections of this review, evidence was
cited which suggests that teachers' attitudes toward
students may influence the level of their students' academic
performance and self-perceptions. This section of the review
presented evidence which indicates that teachers subjectively
react to certain attributes of students, e.g., their
perceived ethnicity, social class, and speech
characteristics. These subjective reactions may predispose
teachers to evaluate essentially similar abilities,
behaviors, and performances by students belonging to
different ethnic or linguistic groups differently. It is not
clear why these differences in ratings occur, that is, it is
not clear how or why such reactions are learned. In light of
the evidence presented in this section as well as in the
previous sections it seems that a proportion of lower-class
or ethnic minority children may fail to achieve at grade
level for reasons other than lack of ability or classroom
behavior.
20

Teacher Attitudes and Their Own Ethnocultural Background
We have examined evidence which supports the contention
that teachers hold differential attitudes toward students in
their classrooms. This evidence also suggests that
generally, teachers tend to perceive and evaluate their
students in accordance with their attitudes toward them.
Evidence was also presented which indicates that
students* ethnocultural and social class characteristics are
two major sources of differential teacher attitudes,
interactive and evaluative orientations. Student attributes
which elicit differentiated teacher attitudes are ethnicity,
socioeconomic class, divergent speech characteristics or
languages, level of ability or achievement performance, and
classroom behavior (Stern & Keislar, 1977). Consequently,
such differential teacher attitudes may predispose them to
behave differentially toward their students.
A second major, and perhaps primary, source of
teachers' differential attitudinal behaviors toward their
students may be the teachers* own personal and social
attributes. For example, teachers* ethnicity or
ethnocultural attributes, may also predispose them to behave
differentially toward their students. In this section
evidence is presented which suggests that a relationship
exists between teachers' evaluative behavior toward the
academic performance of their students and teachers'
ethnocultural background.
21

An ethnocultural group "is a collection of individuals
who have in common any of the following: (1) national
origin; (2) language and cultural traditions; (3) religion;
or (4) readily identifiable physical features" (Watson &
Johnson, 1972). Generally, an ethnoculture is a complex
whole which includes certain knowledge, beliefs, morals,
laws, customs, and other capabilities and habits acguired by
the members of an identifiable societal group (Wallace,
1970).
Members of an ethnic group may also exhibit
ethnocentric attitudes. Such attitudes are defined as
feelings and beliefs by one ethnic group that other ethnic
groups are inferior, less likeable, and amoral, etc. Less
formally stated, ethnocentrism refers to the tendency for
each ethnic group to believe in the superiority of its
culture (Horton & Hunt, 1982). Ethnocentrism is often the
central force behind intergroup and interpersonal conflict,
misperceptions, and prejudicial behavior (Green, 1968).
Ethnocentrism may conceivably be an operating and
determining factor relative to the nature of teachers1
attitudinal behaviors toward their students, especially when
the ethnocultural background of students and teachers differ
significantly. Under such circumstances it would be expected
that each ethnic category of teacher would exhibit more
favorable attitudinal behaviors toward students who belong to
his or her own ethnic group than toward students belonging to
22
other ethnic groups (other factors held constant). Studies
which have investigated the evaluative behavior of teachers
whose ethnocultural background is both the same as and
different from the ethnocultural background of their students
is the focus of this section. The central subject matter of
this investigation is the evaluative relationship of Black,
Hispanic, and White teachers to their students. Previous
studies which have specifically investigated this
relationship which include Hispanic teachers are extremely
rare. Studies of Black and White teacher evaluative
attitudes toward Black and White students are relatively more
numerous. It is for this reason that the studies reviewed in
the following sections pertain the evaluative attitudes of
Black and White teachers toward Black and White students.
However, some indications of teacher attitudes toward
Hispanic students as compared to Black and White (Anglo)
students were discussed previously (Jackson & Cosca, 1974;
Jensen & Rosenfeld, 1974). These studies suggested that
Hispanic students are less generally favorably perceived and
evaluated by teachers than are White and Black students,
respectively (no ethnic differentiation was made in regard to
the teachers).
Attitudes as Measured by Surveys. Gottlieb (1964),
utilizing an adjective checklist, investigated the
differences in attitudes of Black and White elementary
school teachers toward Black and White pupils from low-
23

income families. Each teacher was given a list containing 33
adjectives and asked to check those adjectives which come
closest to describing the outstanding characteristics of the
children with whom he or she was working. Of the 33
adjectives listed, the two groups of teachers differed
significantly on fifteen. The five items used most
frequently to describe all their students by White teachers
were: "Talkative," "Lazy," "Fun Loving," "High Strung," and
"Rebellious," respectively. The items most frequently
selected by Black teachers to describe all their students
were: "Fun Loving," "Happy," "Cooperative," "Energetic," and
"Ambitious." Generally, White teachers tended to avoid those
adjectives which reflect stability and the types of qualities
commonly desired of children in the formal classroom setting.
Black teachers tended to select those adjectives which seem
to be universal attributes of children (i.e., energetic, fun
loving, and happy) in addition to those which appear to be
related to successful learning experiences (i.e., ambitious
and cooperative). Overall, Gottlieb reported that the Black
teachers were less pessimistic in their evaluations of the
students than were the White teachers. It should be noted
that Gottlieb did not report the attitudes of the two groups
of teachers toward each group of students (i.e., Black and
White).
Washington (1980) identified twelve characteristics
"important for children in school." She listed six as
24

positive: brightest/high achiever; most cooperative; well-
adjusted to school; best all around student; physically
attractive; winning personality. The remaining six
characteristics were listed as negative: troublemaker/
defiant/uncooperative; has academic problems; immature/has
adjustment problems; destructive/gets into fights; lazy/
doesn't apply self; needs to improve physical appearance.
During individual interviews, teachers were asked to
designate two children to each one of the twelve
characteristics, i.e., two children who best exemplified the
relevant trait. These designations were later coded
according to the ethnicity of the teachers and students.
Overall, Black teachers selected more Black children to
positive categories (e.g., brightest/high achiever, most
cooperative) than did White teachers. Black teachers
selected 35 percent of the Black children to the positive
categories, whereas, White teachers designated only 22
percent of the Black children to the groups representing
positive characteristics. The attitudes of the two groups of
teachers toward the White students were not reported.
Relative to the characterization of Black children, this
study seems to suggest ethnocultural differences in the
perception of children does occur, particularly betx̂ een Black
and White teachers.
In a second study utilizing the same list described in
the previous paragraph, Washington (1982) interviewed Black
25

and White elementary school teachers. In this instance, both
Black and White teachers perceived White students more
positively than Black students. In contrast to this general
finding, however, a number of significant differences
relative to specific characterizations of students by the
teachers were found. For example, compared to Black
teachers, White teachers indicated that White students needed
to improve their personal appearance and that Black students
had academic problems. Conversely, Black teachers most often
indicated that Black students needed to improve their
personal appearance and that White students had academic
problems. Thus, in regard to academic problems,
Washington's findings suggest that some apparently
ethnocentric differences in the perception of children may
exist between Black and White teachers.
The studies cited above suggest that when specific
characterizations or evaluations of Black and White students
are noted, particularly those which are relevant to academic
performance, ethnocultural and perhaps ethnocentric
differences between Black and White teachers may exist. In
all three studies discussed in this section there are
indications that in selecting those pupils who seemed to
exhibit those characteristics relevant to successful learning
experiences (e.g., ambitious and cooperative, brightest/high
achiever, relative lack of academic problems), Black teachers
tended to view Black children more favorably than White
26

teachers did.
Attitudes as Measured by Simulation Studies. Scott and
Ntegeye (1978) assessed Black and White public school
teachers1 evaluations of four presumably distinctive
attitudes, values, motivational, and behavioral patterns
characteristic of their disadvantaged, inner-city students.
The patterns selected for this study represented personality
characteristics identified by Clift (1969) as basic to and
distinctive of disadvantaged minority students:
1. low-self-esteem; negative feelings of personal
worth; self-deprecatory reactions;
2. unrealistically high levels of aspirations, yet
low levels of aspiration when concrete action is
needed;
3. negative reaction to new situations; submissive
reactions in situations which the student does not
feel capable of mastering; problem-solving through
repeated withdrawal in threatening situations;
4. peer-orientation; attracted more to the values of
peers than to those of adults (p. 101).
The teachers were administered a "Situation Test"
consisting of eight story-situations depicting elementary
school children engaged in various class activities. In each
of the situations, the students exhibited a behavioral
sequence indicative of one of the four personality
characteristics listed above. For each situation, the
27

I.
teachers rated the students on a single behavior dimension:
a five-point scale ranging from (1) "most like to have
student in class" to (5) "least like to have student in
class." The higher the score, the higher the rejection
response. The mean rejection response of White teachers was
nearly twice that of Black teachers. This finding suggests
that Black teachers tend to express a greater preference for
and acceptance of students manifesting traits characteristic
of disadvantaged minority students than do White teachers.
This finding is consistent with those of the previous section
which suggest that teachers from different ethnocultural
backgrounds evaluate specific characteristics of students
differently.
Critical Overview
The review of the literature in the preceding sections
presented evidence which supports the following contentions:
(1) Teachers differ in their attitudes toward students*
academic behavior and these attitudes are related to student
performance; (2) Students* self-perceptions are related to
their teachers* perception of them; (3) Teachers'
expectations in regard to students' academic performance are
related to their students' ethnocultural,, linguistic, and
social status background.
In the last section of the review evidence was
presented which indicates that teacher attitudes are (
ethnoculturally and possibly ethnocentrically based. The
28

concept of ethnocultural orientation implies that members of
an ethnic group, despite national background,
denominational, social status, or individual differences
among them, do resemble one another in certain fundamental
patterns of cultural beliefs, attitudes, and conduct, more
than they resemble members of other ethnic and cultural
groups. Ethnocentric orientation refers to the view that
one's ethnic group is obviously superior to all others and
the view that other groups are less attractive, intelligent,
moral, etc., than one's own (Allport, 1935). Evidence was
cited which suggests that Black and White teachers tend to
differ in their attitude toward Black and White pupils,
particularly in areas related to the pupils' academic and
social functioning. The two groups of teachers differed in
their attitudes toward Black and White pupils in areas
related to the possession by the pupils of characteristics
which reflect stability and the types of qualities commonly
desired of children in the formal classroom setting, e.g.,
initiative or energy, ambitiousness, cooperativeness
(Gottlieb, 1964); brightness, achievement motivation,
attractiveness, lack of academic problems (Washington, 1980;
1982); self-esteem, level of aspiration, reactions to new
situations and problems, peer orientation (Scott & Ntegeye,
1978). In these areas Black teachers more favorably regarded
Black students than White students and White teachers more
favorably regarded White students than Black students. Thus,
29

it appears that relative to certain perceived academic and
personal traits, Black and White teachers differed in their
estimation of the degree to which such characteristics were
exhibited by their Black and White pupils. Since their
differences tended to follow ethnic lines such differences
could arguably be ethnocentrically and/or ethnoculturally
based.
However, conclusions based on studies reviewed in the
last section of this investigation must be drawn with
caution for a number critical reasons: (1) the extreme
paucity of truly relevant studies which can be viewed as
tests of the hypothesis in question - that teachers1
attitudes toward their students may be ethnoculturally or
ethnocentrically oriented; (2) inadequate sample sizes; (3)
lack of observational follow-ups (except Washington, 1980) to
determine whether teachers' classroom and evaluative
behaviors were in agreement with their expressed attitudes
toward certain groups of students; (4) the use of artificial,
simulated, paper-and-pencil situations which make realistic
extrapolations extremely risky.
However, taken altogether, the studies discussed in the
last section suggest that teachers, Black and White teachers
at least, hold ethnoculturally and perhaps ethnocentrically
based attitudes towards their student in regard to certain
specific abilities, behaviors, and traits. If teachers' (
evaluations of their students' behavior is congruent with
30

their attitudes, these studies further imply that such
evaluated student behavior would also to a degree, be
ethnoculturally and/or ethnocentrically oriented.
It was noted that the central focus of this study was to
investigate the relationship between the ethnocultural
background of teachers, i.e., Black, Hispanic and White
teachers, and the ways they evaluate the performance of their
students, also Black, Hispanic and White. Studies which
compare the evaluative behavior of these three groups of
teachers are simply not available. However, there is
evidence which suggests that when ethnicity of teachers is
not considered, Hispanic students are less favorably
perceived than are White and Black students.
Problem
While the research literature consistently and clearly
delineates several student characteristics which may serve as
stimuli that evoke non-objective teacher attitudinal
orientations, it has to a substantial extent not attempted to
delineate the origins of such tendencies relative to the
personality and other characteristics of teachers themselves.
In the latter section of the review studies were cited which
seem to suggest that some of the non-objective attitudes held
by teachers may be ethnoculturally and ethnocentrically
based. That is, teachers' ethnocultural background
experiences tend to influence their perceptions and
evaluations of their students. However, studies which have
31

investigated comparatively, the relationship between
teachers' ethnocultural background and their perceptions of
their students are very sparse. For example, only
Washington's studies (1980, 1982) speak directly to the
influence of teachers* ethnocultural backgrounds and
ethnocentric orientations on their perceptions of and
attitudes toward their students. A search of the relevant
literature failed to locate any studies which have
investigated the relationship between teachers• ethnocultural
background and their actual evaluation of their students*
academic and social performance, particularly when those
students belong to different ethnic groups. An important
question arises as to whether there can exist equal
educational opportunity and equal opportunity for
intellectual growth for certain ethnic group students if
their teachers evaluate them on the basis of potentially
unfair ethnocultural and ethnocentric orientations.
Attitudes and Behavior
An attitude is a learned predisposition to respond in a
specific way, negatively or positively, toward people,
ideas, or situations (Haber & Runyon, 1983). A major reason
for studying attitudes is the expectation by many social
scientists chat they may predict behavior. The assumption
that a person's attitudes determine his or her behavior is
deeply ingrained in social psychology (Allport, 1935). While
some attitude constructs frequently do predict behavior
32
(Dillehay, 1973; deFleur & Westie, 1952, Weitz, 1972), there
is evidence that there frequently is no one-to-one
correspondence between expressed attitude and subsequent
behavior (Azjen & Fishbein, 1980; Wicker, 1969).
In light of the foregoing discussion, there is a
question as to whether teachers* attitudes toward their
students' as indicated by the studies cited in the review,
can predict teachers' evaluations of their students*
performance under actual education conditions. None of the
studies cited in the review demonstrated that systematic
relationships exist between teachers' attitudes toward their
students and their evaluation of their students' academic
performance. Until studies which demonstrate such
relationships have been performed inferences regarding
teachers• attitudes and their related evaluations of their
students• academic performance must be viewed as tenuous or
of doubtful validity.
In summary, two major problems exist in the study of
the relationship between teachers' ethnocultural background
and their perception and evaluation of students. These
problems include: (1) the fact that few, if any, studies
have determined the relationship between ethnoculturallv
related teacher attitudes toward their students and their
actual academic and social evaluation of their students, and
(2) the fact that few, if any, studies have determined the
relationship between teachers' ethnocultural background and
33

their actual evaluation of their students* academic and
social performance. It is the latter problem which was the
focus of this investigation.
Purpose
The purpose of this was to investigate the above
problems (the first one indirectly) through an examination of
teachers• actual evaluation of their students * academic and
social performance as related to the ethnocultural
backgrounds of teachers and students. This study was
designed to determine if teachers, specifically, Black,
Hispanic, and White elementary school teachers, evaluate
their students• academic and social performance in ways
related to their ethnocultural backgrounds as well as those
of their students. Assuming, as was suggested by the last
section of the review, that teachers' attitudes toward their
students tend to be ethnoculturally related, this study also
proposed to determine if those attitudes are predictive of
teachers' actual evaluative performance.
Conceptual Hypotheses
Evidence presented in the last two sections of the
review suggested the following: (1) Teachers' attitudes
coward their students are related to and reflective of their
students* ethnocultural, linguistic, and social status
background. Specifically, studies were reviewed which
suggest that when ethnicity of teachers is not considered,
34

White students are more favorably perceived and evaluated
than are Black and Hispanic students, respectively. (2)
Teachers differentially evaluate their students' academically
related behavior and social/personal characteristics partly
in ways related to the teachers' own ethnocultural
backgrounds. (3) Teachers tend to evaluate the non-academic
and academically related behavior (i.e., students' personal
and behavioral characteristics which may influence their
academic performance, e.g., grades in specific subjects) of
students belonging to their own ethnic group more favorably
than those belonging to other ethnic groups.
In light of the above evidence it was hypothesized that:
1. In their ratings of their students' academic and
social performance, Black, Hispanic, and White
teachers as a whole, would rate the academic and
social performance of White students more
favorably than Black and Hispanic students,
respectively. Social performance includes
personal and social conduct, work habits,
homework, and health habits.
2. a. Black teachers would rate the academic and
academically related social performance of Black
students significantly higher than would White and
Hispanic teachers.
b. Black teachers would rate the academic and
social performance of Black students significantly
35

higher than that of White and Hispanic students,
producing a relative ranking of Black, White, and
Hispanic students.
a. Hispanic teachers would rate the academic and
social performance of Hispanic students
significantly higher than would Black and White
teachers.
b. Hispanic teachers would rate the academic and
social performance of Hispanic students
significantly higher than that of White and Black
students, producing a relative ranking of
Hispanic, White, and Black students.
a. White teachers would rate the academic and
social performance of White students significantly
higher than will Black and Hispanic teachers.
b. White teachers would rate the academic and
social performance of White students significantly
higher than that of Black and Hispanic students,
producing a relative ranking of White, Black, and
Hispanic students.
36

CHAPTER II
METHOD
Subjects
The subjects of this investigation were 45 Black,
Hispanic, and White elementary school teachers and 405 of
their Black, Hispanic, and White students who teach in and
attend schools located in New York City. The 45 teachers
included 15 subjects from each ethnocultural group. The 405
students [nine subjects per teacher] included three from each
ethnocultural group of students per teacher. Ethnicity of
students and teachers were identified through examination of
official records by the school principals. Ethnicity of
student subjects were identified by classroom teachers
according to their records.
The schools from which both the teacher and student
samples were chosen were located in areas of a large school
district of mixed ethnic residence. Though predominantly
Black and Hispanic in composition, the neighborhoods from
which the student samples were drawn contained large White
populations as well. On the whole, the target communities
may be described as containing a mixture of private
households and well-kept apartment dwellings. The
37

communities may be socioeconomiocally described as generally
lower-middle- and upper-working class.
The large majority of the students attending the schools
in the selected district were Black and Hispanic
[approximately 70 - 80%]. In contrast to the size and ethnic
composition of the district's student population, only a
minority of its teachers are Black and Hispanic
[approximately 20 - 25%]. These percentages of students and
teachers fairly typify the student-teacher composition of New
York City schools as a whole, though marked variations in
student and teacher population occur in many districts [New
York City Board of Education, 1989].
All of the schools utilized in this investigation,
except one, were headed by White principals and as stated
above, all of their teaching staffs were predominantly White.
The selected district's elementary schools ranked slightly
above average in reading and math achievement test score
averages compared to other elementary school districts in
New York City [New York City Board of Education, 1988].
Reading and math achievement test score averages varied
considerably within districts as they did within the system
as a whole [New York City Board of Education, 1988.]
Instrument
The "Report To Parents" or the "Student Progress
Report", commonly referred to as a "report card", is a
uniform report which is filled out by the teacher and sent to
38

parents at the end of three marking periods during the
academic year. (See Appendix A for a sample card). The
report card was utilized to abstract information relevant to
the goals of this investigation. The card consists of three
major sections. The first section records the student's
academic achievement in various subject areas. Achievement
is rated according to four categories: E = excellent; S =
satisfactory; N = needs improvement; U = unsatisfactory.
Specifically, the student's performance is evaluated in the
following subject matter areas; Reading, Oral Language,
Written Language, Mathematics, Social Studies, Science, Music
and Art.
The second section of the report card records the
teacher's evaluation of the pupil's achievement in [1]
Personal and Social Development; [2] Work Habits; [3]
Homework; [4] Health; and [5] Physical Education. Each of
these areas are further subdivided into specific categories.
These activity areas are also rated according to the same
four categories indicated above. A total of 38 categories
were utilized by this investigation. They are listed in
Table 1.
The third section provides space for the teacher's
comments to the parents concerning the student's deportment,
adjustment, and other pertinent matters. Space is also
provided for parental responses to the teacher.
Each category in the first and second sections were
39

assigned values to aid in computation and analysis: E = 4.0;
S = 3.0; N = 2.0; U = 1.0. The "E" category is used by
teachers to denote student performance which is judged to be
significantly above average or superior. Student performance
which is considered average is assigned to the "S" category.
The "N" category is used by teachers to indicate that the
student's performance is less than satisfactory but not
seriously problematic or low-average. It is also used to
indicate that the child's previously unsatisfactory behavior
is improving but not yet satisfactory or conversely, that
previously satisfactory behavior is deteriorating. Category
"U" denotes that the student's performance is well below
average or that the student failed or is failing to perform
on an acceptable level. In light of these factors the "N"
category can be considered to be of intermediate value
between the "S" and "U" categories.
Table 1
List of Variable Major Dependent Variables and Their Sub-Categories
COMMUNICATIONS ARTS VI Learns new words V2 Roads with understanding V3 Shows an interest in reading V4 Listens carefully V5 Employs standard English V6 Expresses thoughts clearly
( (Continued on next page)
40

Table 1 Continued
List of Variable Major Dependent Variables and Their Sub-Categories
WRITTEN LANGUAGE V7 Expresses thoughts clearly V8 Writes creatively V9 Uses correct sentence structure V10 Uses correct spelling Vll Writes legibly MATHEMATICS VI2 Knows number facts V13 Uses computation V14 Shows knowledge of other math concepts V15 Applies skills in problem solving & statistics V16 Demonstrates problem solving skills SOCIAL STUDIES V17 Understands & interprets information VI8 Is aware of current events V19 Understands map & globe skills V20 Learns use of reference material SCIENCE V21 Knows science facts & concepts V22 Understands & uses scientific method MUSIC V23 Participates in classroom & school music activities ART V24 Participates in classroom & school art activities HEALTH V25 Understands basic health concepts PHYSICAL EDUCATION V26 Participates in activities V27 Performs required skills WORK HABITS V28 Follows directions V29 Completes work on time V30 Shows initiative V31 Works neatly V32 Takes care of books & materials V33 Homework PERSONAL & SOCIAL DEVELOPMENT V34 Gets along well with others V35 Shows rocpcct V36 Carries out responsibilities V37 Obeys rules & regulations V38 Shows self-control
41

Procedures
In order to collect the data necessary to the completion
of this investigation permission to conduct research in the
elementary schools was obtained from the New York City Board
of Education, Office of Educational Assessment. [See
Appendices B and C]. The process of obtaining permission
from the New York City Board of Education involved writing of
two initial letters asking its authorization to conduct
research in its elementary schools and detailing the research
procedures to be utilized in collecting the data relevant to
this investigation.
In addition, the investigator agreed to the Office of
Educational Assessment's stipulations and restrictions which
included not identifying teachers, students, schools or other
personnel by names or in ways which would violate individual
and institutional privacy rights. After agreeing to these
stipulations the request for permission was reviewed and
passed by the Proposal Review Committee of the Office of
Educational Assessment. While permission was granted by the
Board of Education the participation in this investigation of
district superintendents, principals and teachers was
voluntary. Moreover, districts which contained the student
and teacher sample populations had to foe located and
persuaded by the investigator to participate in this
research.
Four school districts contacted did not contain the
42

requisite population samples though their superintendents
were cordially helpful to the research herein. Two district
superintendents whose schools contained the requisite
student and teacher sample populations refused requests to do
research in their districts because they or their local
boards of education expressed the fear that the ethnic focus
of the research might stimulate ethnic tensions and
sensitivies. Finally, the superintendent of the school
district utilized in this investigation responded favorably
to the request to perform the required data collection the
schools under his purview.
After permission to do research in the district by the
district superintendent was obtained, the office of the
deputy superintendent assisted this researcher by providing a
list of schools whose demographics fit the requirements of
this investigation. The deputy superintendent also made
initial contact with the school principals whose schools were
selected for study. These initial contacts were followed-up
by a visit to the schools by the investigator. The school
principals identified those teachers whose ethnicity and
classroom student ethnic composition met the demands of this
investigation. Additionally, the principals provided the
researcher with a letter of introduction explaining to the
teachers the purpose of his visit to their classrooms and
requesting their cooperation.
Specifically, the teachers were instructed to select
43

randomly the report cards of three students from each
student ethnic group. The teachers supplied the requisite
number of report cards to the investigator who took them to
the principal's office where the relevant data were recorded.
The cards were then returned to the teachers.
Reading and mathematics achievement test scores were
listed on student report cards as was the number of student
absences during the marking period. Student achievement in
reading was measured by the Degrees of Reading Power Test.
Student math achievement was measured by the mathematics
subtest of the Metropolitan Aptitude Test. Student
attendance records were checked to assure that the students
had spent a comparable amount of time in the classroom. It
should be noted that only forty percent (40%) of the reading
and mathematics achievement scores were collected due in part
to their unavailability at one school which contributed
approximately forty percent of the entire student sample for
this study. Furthermore, an additional twenty percent of the
scores were not collected as a result of their not being
recorded on the report cards by the teachers due to student
absenteeism at the time the tests were administered.
All the schools practiced ability grouping. Ability
grouping [or homogeneous grouping] refers to the practice of
placing students with comparable academic performance and/or
achievement test performance into the same classes. Hence,
the classes utilized by this investigation were rather
44

homogeneous in terms of previous achievement test performance
and past academic achievement. According to labor agreements
high to low achieving groups are rotated among teachers
yearly.
Operational Hypotheses
1. It was expected that the overall grade-point
averages of White students' academic and social performance
by the teachers as a whole would be statistically
significantly higher than the overall average performance in
these areas by Black and Hispanic students, respectively, as
measured by grades recorded on the Student Progress Report.
2a. It was expected that the overall grade-point
average ratings of Black students' academic and social
performance by Black teachers would be statistically
significantly higher than the overall grade-point average
ratings of Black students' performance in these areas, by
White and Hispanic teachers, respectively, as measured by
grade recorded on the Student Progress Report.
2b. It was expected that the overall grade-point
average ratings of Black students• academic and social
performance by Black teachers v/ould be statistically
significantly higher than the overall grade-point average
ratings of the performance of White and Hispanic students in
these areas, respectively, as measured by grades recorded on
the Student Progress Report.
45

3a. It was expected that the overall grade-point
averages ratings of Hispanic students' academic and social
performance by Hispanic teachers would be statistically
significantly higher than the overall grade-point average
ratings of Hispanic students* performance in these areas by
Black and White teachers, respectively, as measured by grades
recorded on the Student Progress Report.
3b. It was expected that the overall grade-point
averages ratings of Hispanic students' academic and social
performance by Hispanic teachers would be statistically
significantly higher than the overall grade-point average
ratings of the performance of White and Black students in
these areas, respectively, as measured by grades recorded on
the Student Progress Report.
4a. It was expected that the overall grade-point
averages ratings of White students' academic and social
performance by White teachers would be statistically
significantly higher than the overall grade-point average
ratings of White students' performance in these areas by
Black and Hispanic teachers, respectively, as measured by
grades recorded on the Student Progress Report.
4b. It was expected that the overall grade-point
averages ratings of White students' academic and social
performance by White teachers would be statistically
significantly higher than the overall grade-point average
ratings of the performance of Black and Hispanic students in
46

these areas, respectively, as measured by grades recorded on
the Student Progress Report.
Statistical Analyses
A single multivariate analysis of variance [MANOVA] was
performed to test all of the hypotheses. The factors of this
analysis [utilized as dependent variables] were Linguistics,
Math/Science, Adjustment, and Participation.
The first hypothesis, that the teachers as a whole would
rate the performance of White students more favorably than
that of Black and Hispanic students, was tested by the MANOVA
to determine the statistical significance of the differences
between the overall academic and social means of the three
student groups. Similarly, the predictions of Hypotheses 2a,
3a, 4a, that each teacher group would rate the performance of
its own student ethnic group more favorably than the other
two teacher group, was tested by the MANOVA to determine the
significance of the differences between the overall academic
and social means assigned to each student group by each
teacher group [teachers across students].
The predictions of Hypotheses 2b, 3b, 4b, that each
teacher group would rate the performance of its own student
ethnic group more favorably than the other two student
groups, was tested by the MANOVA to determine the
significance of the difference between the overall means of
each student group under each teacher group [students across
teachers]. Three-way interactions between the ethnicity of
47

the three teacher and student groups were also evaluated for
interpretive purposes.
Supplementary analyses were performed for preliminary
data preparation and to facilitate interpretation of the
student rating data. A principal components analysis, a
procedure which is analogous to factor analysis, was
performed in order to attain an economy of description and to
aid in the parsimonious evaluation of relatively large number
of variables. A series of one-way analyses of variance were
performed to test differences between student groups with
regard to reading and math achievement scores.
Supplemental, ancillary post-hoc analyses were performed
to determine which differences between the overall grade
point averages each group of teachers assigned the student
groups as a whole contributed to statistically significant F
ratios. These analyses permitted a systematic investigation
of the relationship between teacher ethnicity and overall
grade-point averages assigned "to students regardless of their
[students *] ethnicity.
48
CHAPTER III
RESULTS
Description of Samples
The samples of teachers included in this study consisted
of 15 elementary school teachers from each of three ethnic
backgrounds: Black, Hispanic and White. The total teacher
sample therefore consisted of 45 persons. The total student
sample included 405 3rd to 6th grade pupils. A total of 135
students from each of the three ethnic groups (Black,
Hispanic and White) were selected and utilized (three
students from each ethnic group per teacher). Academic
ratings and achievement test scores were taken directly from
the report cards of the three teacher and three student
samples as schematized in Table 2.
The results of this study are presented in two parts.
First, descriptive statistics of the total sample and each
subpopulation are given. Second, inferential statistics
using univariate and multivariate procedures are presented in
order for each of the hypotheses.
Descriptive Data
The overall means and standard deviations of the
academic and social ratings achieved by all three student
49

groups combined for each of the 38 variables are presented in
Table 3. Tables 4, 5, and 6 list the overall means and
standard deviations of the ratings given by each of the
teacher groups to their combined student groups across the 38
variables.
Table 2
Demographic Characteristics of Sample Groups
Group Category Number
Teachers Black 15
Hispanic 15
White 15
Students* Black 135
Hispanic 135
White 135
Note. *Nine students, three from each ethnic group, per teacher. N (Teachers) = 45. N (Students) = 405.
Table 3
Overall Mean Academic and Social Ratings and Standard
Deviations Achieved by Combined Student Samples for Each of
the Thirty-Eight Variables.
VARIABLE MEAN SD
COMMUNICATIONS ARTS VI Learns new words 2.87 .70
(Continued on next page)
50
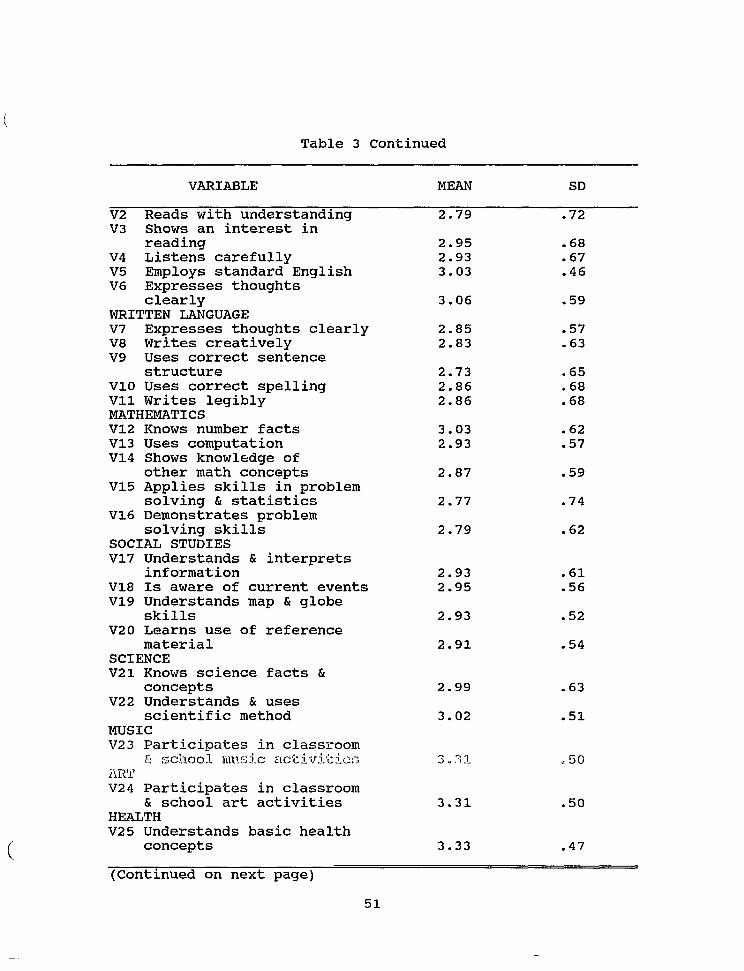
Table 3 Continued
VARIABLE MEAN SD
V2 Reads with understanding 2.79 .72 V3 Shows an interest in
reading V4 Listens carefully V5 Employs standard English V6 Expresses thoughts
clearly WRITTEN LANGUAGE V7 Expresses thoughts clearly V8 Writes creatively V9 Uses correct sentence
structure V10 Uses correct spelling Vll Writes legibly MATHEMATICS VI2 Knows number facts V13 Uses computation V14 Shows knowledge of
other math concepts V15 Applies skills in problem
solving & statistics V16 Demonstrates problem
solving skills SOCIAL STUDIES VI7 Understands & interprets
information V18 Is aware of current events V19 Understands map & globe
skills V20 Learns use of reference
material SCIENCE V21 Knows science facts &
concepts V22 Understands & uses
scientific method MUSIC V23 Participates in classroom
£ school music activities 3.31 .50 ART V24 Participates in classroom
& school art activities 3.31 .50 HEALTH V25 Understands basic health
concepts 3.33 .47
2 . 9 5 2 . 9 3 3 .03
3 .06
2 . 8 5 2 .83
2 . 7 3 2 .86 2 .86
3 .03 2 . 9 3
2 .87
2 .77
2 .79
2 .93 2 . 9 5
2 .93
2 . 9 1
2 .99
3.02
. 6 8
. 6 7
. 4 6
. 5 9
. 5 7
. 6 3
. 6 5
. 6 8
. 6 8
. 6 2
. 5 7
. 5 9
. 7 4
. 6 2
. 6 1
. 5 6
. 5 2
. 5 4
. 6 3
. 5 1
(Continued on next page)
51

Table 3 Continued
3 .28 3 . 2 0 3 .29 3 . 1 7
3 .22 3 . 2 1
3 .38 3 .42
3 .32 3 . 3 1 3 . 2 1
. 7 2
. 7 6
. 7 1
. 7 7
. 7 2
. 8 0
. 6 5
. 6 2
. 7 3
. 7 0
. 7 6
VARIABLE MEAN SD
PHYSICAL EDUCATION V26 Participates in
activities 3.34 .50 V27 Performs required
skills 3.37 .50 WORK HABITS V28 Follows directions V29 Completes work on time V30 Shows initiative V31 Works neatly V32 Takes care of books &
materials V33 Homework PERSONAL & SOCIAL DEVELOPMENT V34 Gets along well with
others V35 Shows respect V36 Carries out
responsibilities V37 Obeys rules & regulations V38 Shows self-control
Note. N = 405 in all cases.
Table 4
Overall Mean Ratings Given by the Black Teacher Sub-Sample to
Combined Student Groups and Related Standard Deviations
Across the Thirty-eight Variables
VARIABLE MEAN SD
COMMUNICATIONS ARTS VI Learns new word V2 Reads with understanding V3 Shows an interest in
reading V4 Listens carefully V5 Employs standard English
(Continued on next page)
2 . 0 0 2 . 7 7
2 . 9 1 2 .87 2 . 9 9
. 5 4
. 5 9
. 6 1
. 5 2
. 3 3
52

Table 4 Continued
VARIABLE MEAN SD
V6 Expresses thoughts clearly 3.03 .46
WRITTEN LANGUAGE V7 Expresses thoughts clearly V8 Writes creatively V9 Uses correct sentence
structure V10 Uses correct spelling Vll Writes legibly MATHEMATICS V12 Knows number facts V13 Uses computation V14 Shows knowledge of
other math concepts V15 Applies skills in problem
solving & statistics V16 Demonstrates problem
solving skills SOCIAL STUDIES VI7 Understands & interprets
information V18 Is aware of current events VI9 Understands map & globe
skills V20 Learns use of reference
material SCIENCE V21 Knows science facts &
concepts V22 Understands & uses
scientific method MUSIC V23 Participates in classroom
& school music activities 3.50 .50 ART V24 Participates in classroom
& school art activities 3.48 .50 HEALTH V25 Understands basic health
concepts 3.34 .49 PHYSICAL EDUCATION V26 Participates in
activities 3.37 .50 V27 Performs required
skills 3.40 .50
2 .82 2 . 7 1
2 . 6 3 2 . 6 5 2 . 8 3
2 . 9 7 2 .97
2 .77
2 . 7 0
2 . 7 3
2 .79 2 .82
2 .82
2 . 7 7
3 .04
3 .05
. 5 3
. 5 2
. 5 4
. 6 7
. 5 6
. 4 3
. 4 5
. 5 4
. 5 0
. 5 4
. 5 0
. 5 4
. 4 7
. 4 9
. 5 9
. 5 8
(Continued on next page)
53

(
Table 4 Continued
VARIABLE MEAN SD
WORK HABITS V28 Follows directions V29 Completes work on time V30 Shows initiative V31 Works neatly V32 Takes care of books &
materials V33 Homework PERSONAL & SOCIAL DEVELOPMENT V34 Gets along well with
others V35 Shows respect V36 Carries out
responsibilities V37 Obeys rules & regulations V38 Shows self-control
3.27 3.14 3.37 3.25
3.37 3.17
3.34 3.43
3.28 3.29 3.13
.65
.77
.67
.73
.64
.83
.60
.58
.71
.70
.78
Note. N = 135 in all cases.
Table 5
Overall Mean Ratings Given by the Hispanic Teacher Sub-Sample
to Combined Student Groups and Related Standard Deviations
Across Thirty-eight Variables.
VAP.IABLE MEAN SD
COMMUNICATIONS ARTS VI Learns new words V2 Reads with understanding V3 Shows an interest in
reading V4 Listens carefully V5 Employs Dcanclarcl Enylirjh V6 Expresses thoughts
clearly WRITTEN LANGUAGE V7 Expresses thoughts clearly V8 Writes creatively
(Continued on next page)
3.24 2.95
3.01 3.20 3.15
3.22
3.00 3.03
.57
.68
.77 = 68 .40
.64
.62
.70
54

Table 5 Continued
VARIABLE MEAN SD
V9 Uses correct sentence structure 2.90 .76
V10 Uses correct spelling 3.16 .63 Vll Writes legibly 3.02 .78 MATHEMATICS VI2 Knows number facts 3.37 .56 V13 Uses computation 3.16 .53 V14 Shows knowledge of
other math concepts 3.11 .62 V15 Applies skills in problem
solving & statistics 2.82 .59 VI6 Demonstrates problem
solving skills 2.96 .63 SOCIAL STUDIES V17 Understands & interprets
information 3.25 .61 V18 Is aware of current events 3.18 .54 V19 Understands map & globe
skills 3.16 .44 V20 Learns use of reference
material 3.11 .50 SCIENCE V21 Knows science facts &
concepts 3.18 .64 V22 Understands & uses
scientific method 3.13 .45 MUSIC V23 Participates in classroom
& school music activities 3.17 .46 ART V24 Participates in classroom
& school art activities 3.18 .49 HEALTH V25 Understands basic health concepts 3.46 .50 PHYSICAL EDUCATION V26 Participates in
activities 3.34 .53 V27 Performs required
skills 3.45 .51 WORK HABITS V28 Follows directions 3.35 .80 V29 Completes work on time 3.32 .72 V30 Shows initiative 3.33 .74 V31 Works neatly 3.14 .80
(Continued on next page)
55

Table 5 Continued
3.12 3 .29
3 .60 3 .58
3 .52 3 .47 3 . 5 1
. 7 9
. 7 6
. 5 2
. 5 2
. 5 9
. 6 0
. 5 4
VARIABLE MEAN SD
V32 Takes care of books & materials
V33 Homework PERSONAL & SOCIAL DEVELOPMENT V34 Gets along well with
others V35 Shows respect V36 Carries out
responsibilities V37 Obeys rules & regulations V38 Shows self-control
Note. N = 135 in all cases.
Table 6
Overall Means Ratings Given by the White Teacher Sub-Sample
to Combined Student Groups and Related Standard Deviations
Across Thirty-Eight Variables.
VARIABLE MEAN SD
COMMUNICATIONS ARTS VI Learns new words V2 Reads with understanding V3 Shows an interest in
reading V4 Listens carefully V5 Employs standard English V6 Expresses thoughts
clearly WRITTEN LANGUAGE V7 Expresses thoughts clearly V8 Writes creatively V9 Uses correct sentence
structure V10 Uses correct spelling VII Writes legibly MATHEMATICS
(Continued on next page)
56
2 .59 2 . 6 5
2 . 9 1 2 .74 2 . 9 6
2 . 9 1
2 .74 2 .74
2 . 6 5 2 .79 2 . 7 3
. 8 0
. 8 4
. 6 5
. 7 2
. 5 3
. 6 2
. 5 2
. 5 9
. 6 2
. 6 4
. 6 7

Table 6 Continued
VARIABLE MEAN SD
V12 Knows number facts 2.77 .67 V13 Uses computation 2.65 .61 V14 Shows knowledge of
other math concepts 2.74 .52 V15 Applies skills in problem
solving & statistics 2.80 .51 V16 Demonstrates problem
solving skills 2.69 .66 SOCIAL STUDIES V17 Understands & interprets
information 2.77 .59 V18 Is aware of current events 2.85 .52 V19 Understands map & globe
skills 2.82 .58 V20 Learns use of reference
material 2.84 .57 SCIENCE V21 Knows science facts &
concepts 2.76 .60 V22 Understands & uses
scientific method 2.87 .47 MUSIC V23 Participates in classroom
& school music activities 3.25 .48 ART V24 Participates in classroom
& school art activities 3.28 .48 HEALTH V25 Understands basic health
concepts 3.20 .40 PHYSICAL EDUCATION V26 Participates in
activities 3.29 .47 V27 Performs required
skills 3.25 .47 WORK HABITS V28 Follows directions 3.23 .70 V29 Completes work on tiiiio 3.15 .70 V30 Shows initiative 3.17 .71 V31 Works neatly 3.11 .78 V32 Takes care of books &
materials 3.17 .70 V33 Homework 3.17 .80
(Continued on next page)
57

Table 6 Continued
VARIABLE MEAN S D
PERSONAL & SOCIAL DEVELOPMENT V34 Gets along well with
others V35 Shows respect V36 Carries out
responsibilities V37 Obeys rules & regulations V38 Shows self-control
Note. N = 135 in all cases.
Principal Components Analysis
Because the number of variables employed in this study
was so large that it precluded careful review and analysis
of each variable, a reduction in the number of variables was
deemed appropriate. The reduction in variables was achieved
by the use of principal components analysis, a procedure
which is analogous to factor analysis.
Correlation coefficients were calculated for each of the
variables listed above. The matrix of the coefficients of
correlation are presented in Appendix B. The eigenvalues of
the correlation matrix derived by the principal components
factor method are presented in Appendix C.
Principal components analysis utilizing the varimax
rotational method was applied to yield a four factor
solution. This factor pattern is presented in Table 7.
From the factor loadings indicated in Table 7 and using
. 50 as the cutoff point for determining that a variable
loaded on a factor, four factor constructs or variable names
58
3.21 .76 3.26 .72
3.15 .81 3.18 .76 3.01 .83

were selected - Linguistics (comprised of variables 1 through
11) , Math/Science (comprised of variables 12 through 22) ,
Participation (comprised of variables 23 through 27) and
Adjustment (comprised of variables 28 through 38) . The
criterion of . 50 was chosen as the cutoff point because
inspection of the factor matrix indicates that use of this
criterion permitted the selection of four clusters which fill
into four distinct groups. Virtually all of the factor
loading of these groups were very substantial, ranging from
.50 to .80 in contrast to rather low or near .00 loading of
the factors in the same factor columns. On basis of .50
cutoff criterion each of the factors which compose the four
factor constructs though themselves substantially
intercorrelated, are not to any great extent correlated with
the constructs which compose the other factors variables.
Table 7
Rotated Factor Pattern Derived by The Varimax Rotation Method
Variable
COMMUNICATIONS ARTS VI Learns new words V2 Reads with understanding V3 Shown an xircerecc JU
reading V4 Listens carefully V5 Employs standard English V6 Expresses thoughts
clearly
Factorl
.71
.69
.65
.58
.63
.65
Factor2
.18
.22
.25
.33
.12
.10
Factor3
.25
.21
.20
.38
.27
.27
Factor4
.08
.03
.05
.10
.09
.05
(Continued on next page)
59

Table 7 Continued
Rotated Factor Pattern Derived by The Varimax Rotation Method
Variable Factorl Factor2 Factor3 Factor4
WRITTEN LANGUAGE V7 Expresses thoughts clearly .77 .04 .24 .01 V8 Writes creatively .79 .05 .17 .03 V9 Uses correct sentence
structure .73 .09 .26 .08 V10 Uses correct spelling .72 .14 .17 .06 Vll Writes legibly .61 .09 .32 .01 MATHEMATICS V12 Knows number facts .41 .24 .51 .01 V13 Uses computation .39 .15 .55 .17 V14 Shows knowledge of
other math concepts .39 .00 .70 .08 V15 Applies skills in problem
solving & statistics .25 .04 .69 .03 VI6 Demonstrates problem
solving skills .37 .14 .66 .03 SOCIAL STUDIES V17 Understands & interprets
information .30 .28 .67 .18 VI8 Is aware of current
events .36 .12 .59 .15 V19 Understands map & globe
skills .25 .14 .71 .09 V20 Learns use of reference
material .38 .11 .65 .13 SCIENCE V21 Knows science facts &
concepts .12 .22 .59 .10 V22 Understands & uses
scientific method .08 .12 .59 .14 MUSIC V23 Participates in classroom
& school music activities .02 .22 .05 .71 ART V24 Participates in classroom
& school art activities .02 .22 .05 .75 HEALTH V25 Understands basic health
concepts .10 .31 .06 .69 PHYSICAL EDUCATION V26 Participates in
activities .06 .29 .04 .80
(Continued on next page)
60

Table 7 continued
Rotated Factor Pattern Derived by The Varimax Rotation Method
Variable Factorl Factor2 Factor3 Factor4
V27 Performs required skills .03
WORK HABITS V28 Follows directions .16 V29 Completes work on time .14 V30 Shows initiative .28 V31 Works neatly .27 V32 Takes care of books &
materials .20 V33 Homework .10 PERSONAL & SOCIAL DEVELOPMENT V34 Gets along well with
others .09 V35 Shows respect .06 V36 Carries out
responsibilities .18 V37 Obeys rules &
regulations .10 V38 Shows self-control .17
Note. N = 405 in all cases.
Multivariate Analysis of Variance
To test the predictions of all the hypotheses relative
to each "factor" variable, a two-factor multivariate analysis
of variance (MANOVA) of the four factor variables
(Linguistics, Math/Sciences, Adjustment and Participation)
was performed. The multivariate analysis of variance was
utilized to analyze the differences between the teacher
groups and the student groups relative to each of the factor
variables.
.27
.75
.75
.65
.57
.49
.65
.68
.75
.85
.83
.79
.01
.16
.16
.14
.10
.06
.10
.23
.13
.10
.04
.13
.82
.24
.17
.34
.34
.47
.28
.21
.30
.11
.14
.07
61

The MANOVA was executed in spite of the fact that
initial student group mean differences on two pre-existing
variables (reading and math achievement test scores) might
have been theoretically responsible for the differences in
the mean ratings achieved by each ethnic student group. In
this instance, a multivariate analysis of covariance
(MANCOVA) would seem to have been more appropriate in order
to control statistically for initial group differences on the
covariates (reading and math achievement test scores) which,
could not be controlled experimentally. The MANOVA rather
than the MANCOVA was performed for the following reasons.
First, four one-way analyses of variance revealed no
statistically significant differences between the mean
reading and math achievement test scores attained by each
student group. Consequently, it seemed highly unlikely that
any statistically significant student group mean differences
on the factor variables could be attributed to initial
differences on the covariates, making a MANCOVA unnecessary.
The results of the one-way analyses of variance of the
overall mean reading and math achievement test scores
attained by each of the student groups is presented in Table
8. Second, except for Participation (R2=.ll, R=.33, 2,
120cb?, P<.01), Multiple reyj.-eysion analysis demonstrated no
significant correlations between the covariates and the
factor variables. A more detailed regression analysis was
( undertaken to determine the correlation, if any, between each
62

covariate with each factor variable. The analysis revealed
that there were no statistically significant correlations
between math achievement test scores and any of the four
factor variables (P<.05). There were no statistically
significant correlations (P<.05) between reading achievement
test scores and the traditionally academic variables,
Linguistics and Math/Science. However, there was a
statistically significant correlation but extremely modest
correlation between reading achievement and social adjustment
(R2=.03, R=18, 1, 125df, P<.05). Moreover, there was found
a statistically significant but modest positive correlation
between reading achievement and participation (R2=.12, R=.34,
1, 125df, P<.001). The latter two correlations suggest that
(1) there is a very modest if not negligible, correlation
between reading achievement and social adjustment, e.g., work
habits, personal and social competence; and (2) a rather
modest correlation between reading achievement and level of
participation in classroom activities pertaining to art,
music and physical education activities.
In light of the modest to very modest or negligible
correlation between reading achievement and adjustment and
participation respectively; the absence of significant
corralationo ha'cuacn math nchiovGiaGnt and any of the four
factor variables; the lack of significant correlations
between reading achievement and Linguistics and
Math/Sciences, it was concluded that adjusted values would
63

not differ significantly from unadjusted values. Results of
the relevant regression analyses are presented in Appendix C.
A multivariate analysis of variance utilizing the four
factor variables as dependent variables was performed for the
reasons discussed above. The results are presented in Table
9. Table 9 shows that for Linguistics, Math/Sciences, and
Participation at least one of the teacher groups evaluated
the mean performance of at least one of the student groups
significantly different from the others (P<.05).
Table 9 also presents the final multivariate analysis of
variance for each of the four factor variables. The lack of
statistically significant (P<.05) main effects for student
ethnicity indicates that the student groups did not differ
significantly across the factor variables. The absence of
statistically significant (P<.05) interaction effects between
the teacher and student ethnicity factors suggest that the
mean academic and social ratings received by either student
ethnic group were not related significantly to the ethnicity
of either of the teacher groups.
64

Table 8
Overall Means for Each Student Group's Reading and Math
Scores and the Final Analysis of Variance.
Student Groups Black Hispanic White
Group Mean (Reading) 55.30 59.85 57.49
Group Mean (Math) 56.75 61.67 56.94
Reading Scores
Source SS df ms F
Between Groups 531.74 2 265.87 .334
Within Groups 104997.25 132 795.43
Total 105528.99 134
Math Scores
Between Groups 695.94 2 347.97 .449
Within Groups 993307.35 128 775.84
Total 1000003.24 130
_____
65

Table 9
The Average Ratings Achieved by Black, Hispanic, and White
Students for Each Factor Variable as Determined by Teachers
as Separate Groups and Final Multivariate Analysis of
Variance Utilizing The Four Factor Variables as Dependent
Variables.
Student Groups
Black Linguistics Math/Sciences Adjustment Participation
Hispanic Linguistics Math/Sciences Adjustment Participation
White Linguistics Math/Sciences Adjustment Participation
Teacher Groups
Black Linguistics Math/Sciences Adjustment Participation
Hispanic Linguistics Math/Sciences Adjustment Participation
White Linguistics Math/Sciences Adjustment Participation
Black
2.73 2.73 3.14 3.26
2.74 2.76 3.14 3.31
2.85 2.86 3.23 3.23
Black
2.73 2.73 3.14 3.26
3.14 3.10 3.42 3.36
2 • 94 2.79 3.29 3.38
Teacher Groups Hispanic
3.14 3.10 3.42 3.36
3.09 3.11 3.40 3.27
3.04 3.20 3.36 3.36
Student Group Hispanic
2.74 2.76 3.14 3.31
3.09 3.11 3.40 3.27
2.77 2.92 3.26 3.44
White
2.94 2.79 3.29 3.38
2.77 2.92 3.26 3.44
2.77 2.98 3.30 3.47
s White
2.85 2.86 3.23 3.23
3.04 3.20 3.36 3.36
2.77 2.98 3.30 3.47
F
9.44*** 9.42*** 2.67 1.03
6.94*** 10.52*** 1.98 2.26
3.98* 12.12***
.69 3.97*
F
2.58 1.51 .07 .44
.53
.96
.20 1.01
.74 1.20 .28 .47
(Continued on next page)
66

Table 9 Continued
Source
Teachers Linguistics Math/Science Adjustment Participation
Students Linguistics Math/Science Adjustment Participation
Teachers X Students Linguistics Math/Science Adjustment Participation
Error Linguistics Math/Science Adjustment Participation
*P<.05 **P<.01
SS
933.74 1111.60 396.13 45.41
45.45 91.57 6.85 .62
(Ethnicity) 135.61 41.80 38.56 14.08
10471.37 7218.13
15430.22 1655.42
***P<.001
df
2 2 2 2
2 2 2 2
2 2 2 2
396 396 396 396
ms
466.87 555.80 198.06 22.70
22.22 45.78 3.42 .31
33.90 10.45 9.64 3.52
26.44 18.22 38.96 4.18
Z
17.65*** 30.49*** 5.08*** 5.43***
.84 2.51 .08 .07
1.28 .57 .24 .84
Analysis of Hypotheses
Analyses of Hypotheses 1 and of Hypotheses 2a. 3a. and 4a
Hypothesis 1 proposed that in their ratings of their
students* academic and social performance, teachers as a
whole, would rate the performance of White students more
favorably than Black and Hispanic students, respectively.
Social performance is herein defined as the students'
performance as evaluated by their teachers in the areas of
participatory activities, e.g., music, physical education,
group activities; work habits, e.g., homework, initiative;
67

personal and social development, e.g., self-control.
Hypotheses 2a, 3a, and 4a (herein referred to as the
first predictions of Hypotheses 2, 3, and 4) collectively
maintained that each teacher group would rate the performance
of the student group which belonged to its own ethnic group,
more favorably than the other teacher groups.
Hypothesis I: The Comparative Ratings of White Students by
Teachers As a Whole. As discussed previously, a MANOVA was
executed in order to test Hypothesis 1 and the first
predictions of Hypotheses 2, 3, and 4. The mean ratings
achieved by each student group across the four factor
variables under each teacher group (i.e., student groups
across teacher groups), and the mean ratings across these
same variables assigned each student group by each teacher
group (i.e., teacher groups across student groups) were
analyzed and tested for statistical significance. The
results of the MANOVA are presented in Table 9.
Table 9 shows that there were no statistically
significant differences between the means achieved by the
three student groups across all four factor variables. Table
9 also indicates no statistically main effects for student
ethnicity. That is, no student group was found to have
attained a statistically significantly (P<.05) higher overall
mean rating from the teachers in their entirety. Thus, the
first hypothesis that White students would receive a (
significantly higher overall average rating of their academic
68

and social performance by the teachers as a whole than would
Black and Hispanic students, respectively, was not supported
by the results of the present investigation.
Hypothesis 2a: The Performance of Black Students As
Evaluated by Black, Hispanic and White Teachers. Hypothesis
2a proposed that Black teachers would rate the overall
performance of Black students significantly higher than would
Hispanic and White teachers respectively. As outlined in
Table 9, Black teachers did not rate the performance of Black
students across any of the four factor variables
statistically higher than Hispanic and White teachers
respectively. Thus, hypothesis 2a was not supported by the
results of this investigation.
Hypothesis 3a: The Performance of Hispanic Students As
Evaluated by Black. Hispanic and White Teachers. Hypothesis
3a proposed that Hispanic teachers would rate the academic
and social performance of Hispanic students significantly
higher than would Black and White teachers, respectively.
Observation of Table 9 reveals that Hispanic teachers did
rate the Linguistic and Math/Sciences performance of Hispanic
students statistically significantly higher than did Black
and White teachers respectively. Thus, it appears that
Hispanic teachers raced the academic, but not the social
performance of Hispanic students significantly higher than
did Black and White teachers, respectively. These results
appear to support hypothesis 3a.
69
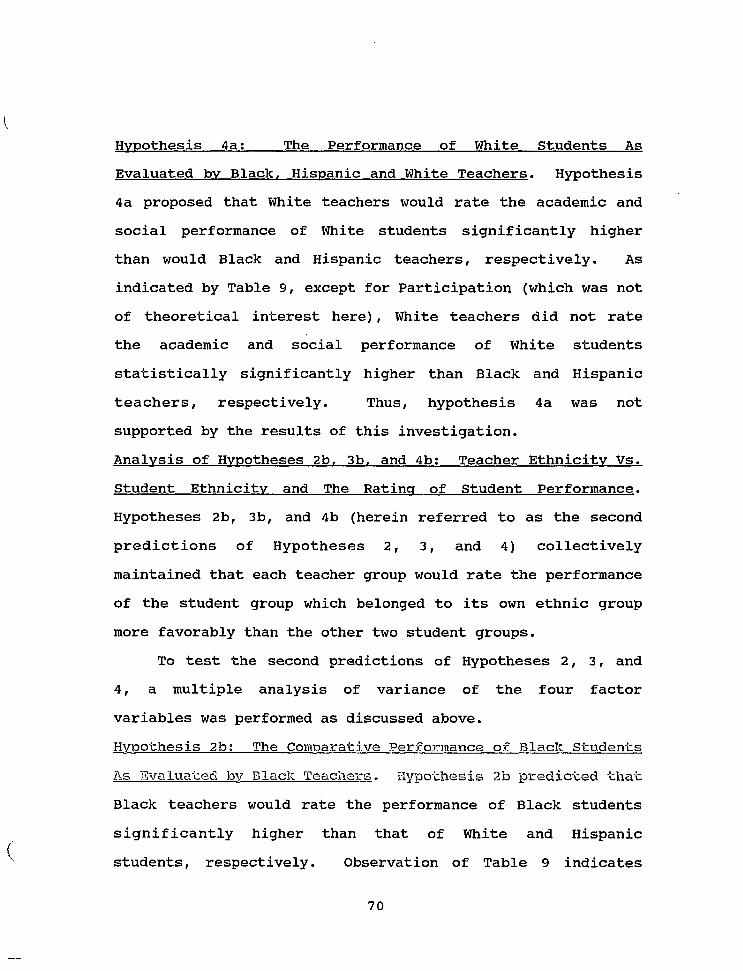
Hypothes i s 4a: The Performance of White Students As
Evaluated by Black. Hispanic and White Teachers. Hypothesis
4a proposed that White teachers would rate the academic and
social performance of White students significantly higher
than would Black and Hispanic teachers, respectively. As
indicated by Table 9, except for Participation (which was not
of theoretical interest here), White teachers did not rate
the academic and social performance of White students
statistically significantly higher than Black and Hispanic
teachers, respectively. Thus, hypothesis 4a was not
supported by the results of this investigation.
Analysis of Hypotheses 2b. 3b. and 4b: Teacher Ethnicity Vs.
Student Ethnicity and The Rating of Student Performance.
Hypotheses 2b, 3b, and 4b (herein referred to as the second
predictions of Hypotheses 2, 3, and 4) collectively
maintained that each teacher group would rate the performance
of the student group which belonged to its own ethnic group
more favorably than the other two student groups.
To test the second predictions of Hypotheses 2, 3, and
4, a multiple analysis of variance of the four factor
variables was performed as discussed above.
Hypothesis 2b: The Comparative Performance of Black Students
As Evaluated by Black Teachers. Hypothesis 2b predicted that
Black teachers would rate the performance of Black students
significantly higher than that of White and Hispanic
students, respectively. Observation of Table 9 indicates
70

that Black teachers did not rate the mean academic and social
performance of Black students under their tutelage across any
of the four factor variables statistically significantly
higher than they did Hispanic and White students. T h u s ,
hypothesis 2b was not supported by the data analysis.
Hypothesis 3b: The Comparative Performance of Hispanic
Students As Evaluated by Hispanic Teachers. Hypothesis 3b
predicted that Hispanic teachers would rate the overall
performance of Hispanic students significantly higher than
that of White and Black students, respectively. Table 9
shows that within their classrooms Hispanic teachers did not
rate the performance of Hispanic students in any area
statistically significantly higher than Black and White
students, respectively.
Thus, hypothesis 3b was not supported by the results of
this investigation.
Hypothesis 4b; The Comparative Performance of White Students
As Evaluated by White Teachers. Hypothesis 4b proposed that
White teachers would rate the overall performance of White
students significantly higher than that of Black and Hispanic
students, respectively. As was the case with the Black and
Hispanic teachers, Table 9 shows that within their
classrooms, White teachers did not rate the performance of
White students statistically significantly higher than they
did Black and Hispanic students, respectively.
Table 9 also indicates that in no case were there
71

statistically significant interaction effects with regard to
teacher and student ethnicity. Thus, none of the predictions
of hypotheses 2b, 3b, and 4b were supported by the relevant
data analysis.
Supplementary Analysis
A review of Table 9 suggests that relative to
Linguistics and Math/Sciences Hispanic teachers tended to
rate the performance of their students as a whole
significantly higher than did Black and White teachers,
respectively. The three teachers groups did not rate the
overall performance of the three student groups under their
tutelage significantly different. To determine statistically
which teacher group or groups of teachers contributed to the
significance of the mean teacher differences noted in Table 9
post hoc tests utilizing the Scheffe procedure were executed.
The results of the analyses of variance of the four factor
variables combined as academic (Linguistics and
Math/Sciences) and social (Adjustment and Participation)
ratings are presented in Table 10. Table 10 indicates that
relative to the evaluation of the academic performance of all
the student groups only the Hispanic teachers as a group
rated its students statistically significantly different from
the other teacher groups. Wo statistically significant
differences between the mean social ratings given by the
three teacher groups were revealed. Thus, in regard to their
mean academic ratings of their students Hispanic teachers
72

appear to have been the most liberal graders followed by
Black and White teachers, respectively. Though not
statistically significant, this trend was followed in regard
to the teachers' mean social ratings.
Table 10
The Comparative Mean Academic and Social Ratings Assigned to
Their Students without Regard to Their Ethnicity by Black,
Hispanic, and White Teachers and the Final Analysis of
Variance
Student Groups Black Hispanic White Overall Means
Source Main Effects Teachers Students Interaction Teacher Ethnicity X
Student Groups Black Hispanic White Overall Means
Source Main Effects Teachers Students Interaction Teacher Ethnicity X
Academic Ratinas
Black 2.92 2.90 2.88 2.90
SS 3754.47 3709.97 44.50
df 4 2 2
Student Ethnicity 161.70 4
Social Ratincrs
Black 3.30 3.29 3.33 3.31
SS 590.73 582.58 8.15
df A
2 2
Student Ethnicity 30.81 4
Teacher Hispanic 3.13* 3.10* 3.13* 3.12*
IDS
938.62 1854.99 22.25
40.43
Teacher Hispanic 3.42 3.40 3.38 3.40
us 147.68 291.29 4.08
7.70
Groups : White
2.78 2.80 2.89 2.83
F 11.94*** 23.60**
.28
.51
Groups : White
3.17 3.18 3.23 3.20
F 2.97-v 5.87** .08
.16
*P<.05 - Scheffe Procedure. **P<.01. ***P<.001.
73

/ /
CHAPTER IV
DISCUSSION
One of the fundamental doctrines of American education
is that all students should be treated with equality by their
teachers. If two students behave or perform in the same way,
teachers are expected to respond in the same way to both of
them. Realistically, however, as clearly indicated by the
review of the literature, teachers respond to their students
on a number of subjective levels. That is, teachers not only
respond to their students' performance per se, but to other
student characteristics such as ethnicity, socioeconomic
status, speech patterns and gender. As noted previously, a
review of the literature reveals that there exist relatively
few studies which have investigated teachers' personality and
other characteristics as possible origins of non-objective
teacher evaluational attitudes toward their students. Such
characteristics might include teachers' ethnocultural
backgrounds.
This study was designed to determine if the average
academic and social performance ratings attained by Black,
Hispanic, and White students were related to their teachers'
ethnocultural backgrounds. The teachers were also grouped
( according to ethnicity - Black, Hispanic, and White. Four
hypothesized relationships between the teachers' ethnicity
74

and that of their students were proposed. The first
hypothesis proposed that the teachers as a whole would rate
the performance of White students more favorably than Black
and Hispanic students, respectively. Hypotheses 2a through
4a each proposed that each ethnic group of teachers would
rate the performance of students belonging to its own ethnic
group higher than would the other two groups of teachers.
Hypotheses 2b through 4b proposed that each teacher ethnic
group would rate the performance of students who were members
of its ethnic group higher than that of students who were not
members.
Analysis of the relevant data failed to support the
predictions of the four hypotheses. The lack of statistical
support for the predictions of the four hypotheses suggests
that, in general, there may exist little or no significant
relationship between teachers* ethnicity and a tendency to
rate their students' performance ethnocentrically: a very
positive outcome indeed.
The purpose of this investigation as suggested by its
hypotheses, was to determine if students' ethnic
characteristics were influential in how their performance was
rated by teachers (Hypothesis 1) and to determine if
teachers' ethnocultural backgrounds, in interaction with
their students' ethnicity, might be one source of their
evaluation of their students' performance (Hypotheses 2
through 4) . Based on the review of the literature which
75

c suggested that teachers' attitudes toward their students
differ relative to their and their students' ethnic
characteristics, this investigation indirectly tested the
consistency between presumed teacher attitudes and their
evaluative behavior toward their students as represented by
their recorded ratings of their students' academic and social
performance.
Teachers Comparative Evaluation of White Students'
Performance
A frequent and consistent research finding is that
teachers hold more positive attitudes and expectations for
White students than they do for Black and Hispanic students
(Jensen & Rosenfeld, 1974, Harms, 1961, Moe, 1972, Naremore,
1971, Williams et al., 1971, Karlins, et al., 1969). To test
whether such attitudes and expectations were actually present
in the teacher sample population, Hypothesis 1 predicted that
White students would be more favorably rated by the teachers
as a whole than would Black and Hispanic students,
respectively. The results of this investigation indicated
that White students did not receive significantly higher
academic and social ratings than did Black and Hispanic
students. No particular student group achieved a
statistically significant higher overall grade-point average
than another.
The most parsimonious explanation of these results (
appears to be that the teachers as a whole were not
76

significantly racially or ethnically prejudiced toward either
of the three student groups and, therefore, did not evaluate
their performance in ethnically biased ways. If the teachers
did not prejudicially evaluate the students then the results
relevant to Hypothesis 1 suggest that the three student
groups performed essentially equally well or poorly and that
their performance was objectively and unbiasedly evaluated by
the teachers as a whole. As noted above, the schools
utilized in this investigation fully engaged in the practice
of "ability grouping" or "tracking", wherein, students are
subdivided into high, average, and low achieving classes
according to academic achievement test score averages and
previous achievement. If the criteria and methods for
selecting students to such groupings were valid, thereby,
resulting in rather homogeneous groupings then it would be
expected that their performance would be fairly homogeneous
as well. (This appears to have been the case since the
overall grade-point averages of the student groups were not
significantly different). Relatively unbiased evaluators,
e.g. the teachers, would then be expected to grade their
performance on the whole with a degree of equality.
No measurement of the teachers * racial attitudes was
taken in this investigation. Therefore, the teachers'
assessed attitudes were unknown. Consequently, another
possible explanation for the results related to Hypothesis 1
which proposed that White students would be more favorably
77

rated by teachers as an entirety than would Black and
Hispanic students, may be put forth. It may be contended
that while the teachers may have held more favorable
attitudes and expectations toward the White students, they
did not permit those attitudes to bias the evaluation of
student performance. That is, regardless of what may have
been their more favorable personal attitudes toward White
students, they chose not to grade this student group any more
favorably than the other student groups when their
performance was objectively the same.
The findings of this investigation provide no support
for the proposition that teachers, in general, hold more
positive attitudes and expectations for White students than
they do for other ethnic groups of students and that such
attitudes and expectations may be reflected in White students
generally receiving higher grades for the same performance
than do other ethnic groups of students. The findings of
this investigation relative to Hypothesis 1 are also not in
agreement with those studies which suggest that teachers in
general rate the academic performance of White students
higher than Black and Hispanic students (Harms, 1961; Jensen
and Rosenfeld, 1974,; Marwit, Marwit and Walker, 1978; More,
1972; Naremore, 1971; Williams, et al., 1971). These
studies, however, did not involve either naturalistic
observation or analysis of teachers' actual evaluations of
their students academic and related behavior, but found that
78
teachers as a whole evince significantly more positive
attitudes toward White students relative to Black and
Hispanic students, respectively.
It is possible the teachers' usually more favorable
attitudes and expectations toward White students as suggested
by the studies just cited, have been modified by additional
information and related expectations and training. Such
information in this instance would have included knowledge of
the fact that their students had been selected and matched
according to achievement test scores and prior academic
achievement. The related or implied expectation could have
been that, based on their selection criteria, regardless of
ethnicity these students would perform essentially at the
same level. Consequently, in light of such knowledge and
implied expectations, the teachers as a whole were motivated
to fulfill those expectations and did so by either (1)
restructuring previously differential expectations based on
student ethnicity toward egalitarian expectations; (2) by
suppressing their ethnically biased expectations and
expressing evaluative behavior in line with the egalitarian
expectations implied by the selection criteria (and perhaps
gaining approval of the school administration as well)
and/or; (3) by choosing to ignore prior or personally biased
expectations and to evaluate more objectively the performance
of student groups who actually performed on the whole equally
well or poorly. Thus, the findings of this investigation may
79

suggest that when other mitigating factors and circumstances
exist, e.g., ability groups, teachers' presumably more
positive attitudes and expectations of White students may
tend to be neutralized or attenuated and those students not
rewarded with significantly higher grades than non-white
students. Another possible explanation may include the
possibility that in contrast to the geographical locations of
previous studies, this investigation, having taken place in
New York City, a city with a long tradition of racially
mixed classrooms, may have tapped a more egalitarian teacher
sample population than was the case with the previous
research studies. Finally, it is also possible that some
biasing factors were present in the students selected to
participate in this study. For example, it is possible that
the teachers selected their academically most advanced
students from each student ethnic group as participants in
this study. Alternatively, they may have selected students
of reasonably equal ability. If the teachers used either of
these procedures then the academic performance of the student
groups may have been artifactually equalized.
The findings relative to Hypothesis 1 indicate that
White students were not more favorably rated than Blaclc and
Hispanic students. These findings also imply that attitudes
and expectations regarding the behavior of any group, whether
positive or negative, may not be actualized under all
circumstances.
80

Finally, the general lack of statistically significant
differences between the means for the student groups may have
been an indication of essentially equal performance by the
student groups as well as the teachers. However, that the
apparent equality of the student groups performance and
apparent egalitarian evaluation by the teachers, may have
been the result or artifact of the recording instrument,
(i.e., the report card itself). The four evaluative
categories utilized by the report cards are not clearly
defined and may be over-inclusive when compared with other
ratings scales. For example, the category E (excellent) may
include performance rated as A, A-, B+, B, and possibly B-
under a letter-point grading system or the grades from 80 to
100 under a number grading system. Hence, the evaluative
categories utilized in the report cards may be only sensitive
to the relatively more gross student performance differences.
Consequently, significant differences in the ratings of
student academic and social performance which would have been
observed under a letter-point or number grading system may
not be detected by the rating system utilized by the report
cards analyzed herein. Therefore, the evaluative categories
of the report cards may have helped to create a greater sense
of equality between groups and individuals than actually
existed. Ability grouping, uniformity of ratings scales, and
relative consensus regarding how student performance is
evaluated, may be seen as providing substantial internal
81

validity of the report card ratings system. However, that
system's relative lack of correspondence with other more
refined systems used by other school systems such as
letter-point, number grading or more detailed rating scales,
may put in question its external validity and the
generalizability of findings based on the statistical
analysis of its contents.
Teachers Comparative Evaluation of Each Student Group
Relative To Their Own Ethnicity
Surveys of Black and White teachers' attitudes toward
students in general and Black and White students in
particular (Gottlieb, 1964; Washington, 1980, 1982) suggested
that teachers' attitudes toward their students may have been
ethnoculturally related. In general, the surveys as
discussed in the literature review section of this
investigation suggested that in regard to those student
characteristics relevant to successful learning experiences,
(e.g., ambitious and cooperative, brightest/highest achiever,
relative lack of academic problems), Black teachers tended to
perceive Black students more favorably than did White
teachers. It was also noted that Scott and Ntegeye (1978)
found that Black teachers, relative to White teachers,
demonstrated a significantly greater preference for and
acceptance of students manifesting traits characteristic of
minority students. The findings of the aforementioned
studies together seem to suggest that teachers, particularly
82

Black and White teachers, evaluate specific characteristics,
(e.g., academic and social potential), of students
differently and in accord with their ethnocultural
backgrounds. In general, Black teachers tended to view Black
students relatively more favorably than did White teachers.
(Studies comparing the attitudes of Black, Hispanic and White
teachers were not located.)
Research which has investigated the attitudes and
behavioral characteristics of Hispanic teachers compared to
Black, White and other teachers is virtually non-existent.
The situation may be in part due to the relatively small
percentage of Hispanic teachers working in the United States
(Gifford, 1986) . The size, distribution, historical
evolution, and socio-dynamics of the Black population in the
United States may have been such that research interests in
regard to ethnic relations, attitudes, etc., have been
heavily weighted toward the study of Black-White ethnic
interactions.
Studies cited above in our discussion of Hypothesis 2
(Gottlieb, 1964; Scott & Ntegeye, 1978; Washington, 1980;
1982) generally indicated that Black teachers held more
favorable attitudes toward Blade students compared to White
students. These studies also indicated that White teachers
generally held more positive attitudes and expectations for
White students than they did for Black students. Royer
(1984), in a survey of studies of teachers* expectations
83

about students relative to their sex, socioeconomic status,
ethnicity, and physical attractiveness, noted that "in many
instances even Black students who are performing well are
held in lower esteem than White students" by White teachers.
More specifically, studies dealing with attitudes related to
student ethnicity utilizing teachers samples which were
presumably predominantly White in composition consistently
rated Hispanic students less favorably than White and Black
students (Harms, 1961; Jackson & Cosca, 1974; Jensen &
Rosenfeld, 1974; Moe, 1972; Naremore, 1971; Williams, et al.,
1971).
Hypotheses 2 through 4. Based on the reviews above
Hypotheses 2 through 4 together predicted that, relative to
each other, each of the three teacher groups would rate the
academic and social performance of students who were members
of their own ethnocultural group significantly higher than
would the other two teacher groups. The hypotheses further
proposed that in their classrooms each of the teacher groups
would rate the academic and social performance of students
who were members of their own ethnocultural group
significantly higher than would students who were not members
of the relevant group.
However, as discussed in the Results chapter of this
investigation, only in one instance were the predictions of
the proposed hypotheses statistically supported. In this
case the first prediction of Hypothesis 3, that Hispanic
84

teachers would rate the academic and social performance of
Hispanic students significantly higher than would Black and
White teachers, respectively, appeared to have gained
statistical support. Table 10 shows that Hispanic teachers
did rate the overall performance of Hispanic students
significantly higher than did Black and White teachers,
respectively. This finding does provide prima facie evidence
which supports the first prediction of Hypothesis 3.
However, to interpret this finding as suggesting that
Hispanic teachers ethnocentrically favored Hispanic students
relative to Black and White students by rewarding Hispanic
students with higher grades for performance not objectively
superior to the other student groups, is unwarranted for the
following reasons: Hispanic teachers as a whole consistently
rated the performance of all the student groups significantly
higher than did the other two teacher groups. One
implication of this observation is that Hispanic teachers may
tend for reasons other than ethnic bias, rate student
performance, including the performance of Hispanic students,
higher than Black and White teachers in general. Therefore,
their significantly higher rating of Hispanic student
performance in this instance essentially reflects their
tendency to rate the performance of all student groups more
highly than do Black and White teachers, even the performance
of Black and White students, respectively. Additionally, in
their classes Hispanic teachers did not rate the performance
85
of Hispanic students significantly higher than that of Black
and White students. While not statistically significant,
Hispanic teachers tended to rate the performance of one or
the other of the two student groups slightly higher than that
of the Hispanic students. It would not be expected that this
tendency would be the case if Hispanic teachers rated the
performance of the student groups ethnocentrically. Finally,
in none of the analyses were significant teacher ethnicity x
student ethnicity interactions found. This finding suggests
that the ethnocentric rating of student performance by any of
the three teacher groups was either non-existent or not
sufficiently influential enough to make a significant
difference.
In light of the foregoing discussion it seems quite
reasonable to contend that in no instance were the hypotheses
statistically supported.
The more plausible reasons for the lack of statistical
support for the hypotheses are essentially the same ones
given for the lack of statistical support for hypothesis one
above. They were namely, (1) that the teachers in each
instance were relatively unbiased and evaluated their
students' performance objectively, including that of students
belonging to their own ethnocultural group; (2) that the
teachers' evaluations of their students; including those
belonging to their own ethnic group, were influenced by the
knowledge that the students had been grouped according to
86

their tested abilities and prior academic achievement and the
implicit expectation that they would perform at about the
same level; (3) that teachers may have chosen to ignore
personal and ethnocentric biases and therefore objectively
evaluated the performance of the student groups; (4) that the
New York City Board of Education, through its teacher
selection and preparatory procedures, or through
attributions, may have "weeded out" teachers who held
conspicuously active ethnocentric attitudes or who were not
sufficiently acculturated; and (5) that the evaluative
categories utilized in the report cards may have been only
sensitive to the more gross of student performance
differences.
The failure to achieve statistical significance by
Hypotheses 1 through 4, seems to suggest that neither
students' nor teachers' ethnocultural backgrounds
significantly influenced teachers' judgments of their
students' performance. These findings together would seem to
corroborate reasonably the argument that factors other than
teachers' or students' ethnicity may significantly influence
teachers' ratings of students• performance under actual
pedagogical conditions. Those other factors might include
students' socioeconomic and family backgrounds, motivational
strengths and orientations, cultural values and attitudes,
past academic performance and behavior, and some structural
characteristics of the school system itself. The functional
87

existence of those other factors may not be construed to mean
that teachers may not hold biased attitudes towards their
students of different ethnic backgrounds, but that such
teacher biases may be of relatively little significance when
judgments of students' academic performance are made under
naturalistic educational circumstances. However, relative to
this investigation, the apparently unbiased ratings of their
students* performance by the three teacher groups may have
been reflective of the fact that the three student groups
were relatively homogeneous in composition in that the
students were grouped according to ability as measured by
achievement test scores and prior performance. The
homogeneity of the student groups suggests that if the test
scores were fairly predictive of their performance, then the
average ratings they received under any teacher group would
have been relatively homogeneous across the student groups.
The fact that there was a rather negligible number of
student-ethnic-group main effects seems to support that
suggestion. Furthermore, the ability grouping of the
students might have influenced the teachers in ways which
motivated them to hold fairly uniform expectations regarding
the academic performance of their students„ As a possible
result thereof, the teachers possibly tended to rate the
performance of each of the student groups in ways not
significantly different from the other. In summary,
systematic and significant interactions between teachers* and
88

students• ethnicity were not found in this investigation as
were predicted by Hypotheses 2 through 4. These findings
may be utilized to corroborate the argument that the
teachers• average ratings of their students• performance
were neither related to their own or their students'
ethnicity. These findings may also suggest that the ability
grouping of the students may have attenuated or tended to
neutralize presumably pre-existent ethnically-based teachers'
biases which might have been revealed under different
circumstances. Thus, while teachers' prejudicial attitudes
may exist and influence their behavior under various
circumstances certain situational or other expectational
factors may intervene to accentuate, attenuate, neutralize or
reverse the implied behavioral output of those attitudes. In
either case, teachers' ratings of their students performance
in the instance of this investigation, appear to have been
relatively un-influenced by their presumed pre-existent
ethnically related biases.
Attitudes and Behavior
A major reason for studying attitudes is the expectation
by many social scientists that attitudes may predict
behavior. The assumption that a person's attitudes determine
or guide his or her behavior is historically ingrained in
social psychology. While some attitude constructs frequently
do predict behavior, there is evidence that there frequently
is no one-on-one correspondence between expressed attitudes
89
and subsequent behavior. That is, clearly expressed
attitudes frequently remain unmatched by corresponding or
presumably logically related behavior (Kaufman, 1973).
Behavior may be determined by many factors other than
attitudes, and these other factors affect attitude-behavior
consistency (Atkinson, et al., 1987).
Assumptions Regarding Attitude-Behavior Consistency. The
hypothetical predictions of this investigation rested on the
assumption of a direct, positive relationship between
attitudes and corresponding behavior. Based on a review of
the relevant literature it was assumed or at least presumed,
that the three teacher groups studied herein held
significantly differing amounts of ethnoculturally biased
attitudes toward each of three student ethnic groups under
their tutelage. It was further assumed that each group of
teachers would be measurably and subjectively more positive
toward students who were members of their own ethnic group.
The final general assumption was that these biased attitudes,
as suggested by the review of the literature, if actually
present in the teacher groups, would then be revealed by the
relative average ratings they would give each of the student
groups under their instruction. Students who belonged to
their teachers' own ethnic group were expected to receive
significantly higher average ratings than the other two
student groups than would apparently be warranted in light
of other more objective measures of student performance,
90

e.g., achievement test score averages.
Situational Constraints. Specificity and Attitude-Behavior
Consistency. Warner and DeFluer (1969) have presented
evidence which suggests that in some instances constraints
imposed by social norms inhibit the expression of
inappropriate attitudes. In the instance of this
investigation, the self-perceptions of teachers which may
have included the professional ideal of making objective,
unbiased evaluations of their students' performance, may have
inhibited the expression of inappropriate ethnoculturally
biased behavioral-evaluative tendencies, if present. It is
also possible that the expression of certain attitudes may be
inhibited by situational constraints or countervailing
attitudes or expectations. In this instance, the presumed
ethnoculturally biased attitudes of the teacher groups may
have been inhibited in their expression by the ability
grouping of the students and by the related expectation that
they would perform at essentially the same level.
Ajzen & Fishbein (1979) have suggested that if the
behavior one wants to predict is very specific, it is better
to predict for attitudes specifically related to that
behavior. Consequently, it is possible that because the
ethnoculturally-based attitudes utilized herein though
presumed to exist, were not specifically defined, their
possible relationship to the teachers' rating behavior could
not be discovered by the methods used in this investigation.
91

It is also possible, as suggested above that the evaluative
categories utilized in this investigation were too gross to
differentiate performance differences between the student
groups sensitively. In sum, the relationship between
attitudes and behavior may not be as simple and direct as one
would like to assume. Possible intervening variables and
other confounding factors should be given careful
consideration before research concerning the relationship
between attitudes and behavior is undertaken.
Limitations of This Investigation
In light of the above discussion the limitations of this
investigation included (1) its inability to have selected
heterogeneous student samples, i.e., to have avoided the use
of homogeneous ability-based student samples, which might
have controlled for the teacher samples' expectations based
on ability grouping which might have neutralized the
attitudinal effects under study; (2) its inability to
administer appropriate attitude scales, tests, or interviews
to determine what teachers held significant ethnoculturally
biased attitudes after their evaluation of the students; and
(3) its inability to utilize more sensitive and finely tuned
evaluative categories. In this last instance, while
internal validity may have been sacrificed, it was sacrificed
to the benefit of external validity, as these ratings are
actually made on school children in New York City. In the
case of the second point above, the following research
92

approach could be utilized. First, each group of teachers'
ratings of each student group would be collected. Second,
each teacher group would be administered an appropriate
attitude scale, test, or interview to determine their
attitude toward each of the student groups. The data from
the teachers' academic ratings of the students and from their
attitude measures would then be statistically analyzed to
reveal their attitudinal-behavioral relationships, if any.
These factors, in addition to providing a greater operational
specificity of conceptual definition regarding the attitudes
and related behaviors under study, would allow for a more
direct testing of the hypothesis that specific attitudes
guide specifically related behavior in future research. In
general, the main limitation of this investigation was that
it was ex post facto research, that is, there was no direct
control of independent variables because their effects had
already occurred or because they were inherently not subject
to systematic manipulation. Therefore, inferences about
relations among the variables studied herein, were made, not
from direct intervention, but from concomitant variation of
independent and dependent variables (Kelinger, 1973). As
such it was not possible to draw random samples of subjects,
to assign students to ethnic groups randomly and to
administer systematic treatments of those groups. The
criteria (reading, math achievement levels, prior academic
performance) used to place students into homogeneous classes
93

and the assignment of teachers to instruct those classes were
non-random. The teachers were assigned based on a rotation
schedule. Both the methods for assigning students to groups
and teachers to teach particular classes may have in effect,
led to significant "self-selection" of both student and
teacher samples. Self-selection implies that the groups
studied herein were in groups, in part, because they may have
possessed traits or characteristics extraneous to the problem
selected for investigation. Those characteristics may have
influenced the dependent variables in ways which could not be
experimentally or statistically controlled.
Because the assignment to the groups utilized by this
investigation was not random it was possible for variables
other than the ones of interest to this investigation to have
skewed the statistical outcomes of the study. Consequently,
the conclusions based on such outcomes would exhibit
reflective, undetected biases. They may also possibly be
unwarranted.
In sum, this investigation, as ex post facto research,
suffered three major weaknesses: (1) the inability to
manipulate independent variables, (2) the infeasibility of
randomly selecting the samples, and (3) the related problem
of uncertain, imprecise or the risk of improper
interpretation research findings. The absence of
experimental controls and the inability to select and test (
alternative hypotheses imply that the predicted (or
94

unpredicted) relations in this study be accepted with
caution. Causal inferences based on such relations would
therefore be somewhat tenuous or tentative. General
conclusions based on such relations can expressed with only
limited confidence and the generalizability of such
conclusions subject to careful qualifications.
Generally speaking, the explanations of ex post facto
research findings, being post factum. do not lend themselves
to falsification or nullifiability. That is, the
explanations of the observations of such research can be so
flexible that new or alternative interpretations can be found
to "explain the facts."
Despite the weaknesses of ex post facto research of the
kind utilized herein, its findings may often prove to be of
significant importance in psychological, sociological and
educational research. In a number of ways, ex post facto
research may be as important as experimental research,
especially in educational research, because some of the
important variables in such research—intelligence, aptitude,
home background, teacher or student personality—are
generally not manipulable (Kerlinger, 1973). While many of
the most important social scientific and educational problems
do not lend themselves to experimental manipulation, many of
them do lend themselves to carefully controlled, qualified
inquiry and observation of the kind ex post facto research is
capable of producing.
95

The findings from ex post facto investigations such as
those from the present research may be utilized to provide
information relevant to the consideration of many of the
social and educational problems which confront society today.
The findings of ex post facto research may also be utilized
to indicate areas whose investigation may possibly lead to
more productive and important findings or which variables
important to various social, psychological and educational
outcomes, lend themselves to experimental manipulation.
For example, the findings of the present research
suggest that the ethnocultural background of teachers may not
be an important variable related to student achievement. By
suggesting that teacher ethnocultural background may be of
relatively little importance in student academic performance,
this investigation implicitly suggests that variables such as
educational and school goals, school size, school leadership,
personnel characteristics, course work and classroom
characteristics—may be more productively investigated than
teacher cultural background and personality. These school
organizational and related variables are also apparently more
subject to experimental and administrative manipulation than
would be teacher ethnocultural background or personality.
The verifiable results of the manipulation of school
organizational variables could possibly be more immediately
and practically applied with measurable effects on student
academic achievement.
96

CHAPTER V
SUMMARY
INTRODUCTION
There is a substantial body of evidence which indicates
that teacher preferences and attitudes can affect teacher-
student interaction patterns resulting in the inhibition or
facilitation of student academic, intellectual, self-concept,
and social skill development (Brookover & Erikson, 1967;
1969; Crano & Mellon, 1978; Davidson & Lang, 1969; Dusek &
O'Connell, 1973; Glidewell, Kantor, Smith & Stringer, 1966;
Good & Brody, 1973; Parlardy, 1968; 1969; Phillips, 1965;
Rist, 1970; Seaver, 1973; Shore, 1973; Staines, 1958).
Teachers1 expectations for students1 classroom academic
performance and behavior are influenced by their perceptions
of different ethnic and social-class groups (Rosenfeld, 1973;
Rubovitz & Maehr, 1973; Washington, 1980; 1982; Whitehead &
Miller, 1972; Williams, Whitehead, & Miller, 1971;
Woodworth & Salzer, 1971). The communication of these
expectations through both verbal and nonverbal means is
likely to act as a subtle yet effective shaping mechanism for
student behavior (Brophy & Good, 1970; Good, Brophy, &
Mendosa, 1970; Jensen & Rosenfeld, 1974: Rosenshine, 1971;
Rothbart, 1970; Rowe, 1974; Scott, 1980). This shaping or
97

important variables in such research—intelligence, aptitude,
home background, teacher or student personality—are
generally not manipulable (Kerlinger, 1973). While many of
the most important social scientific and educational problems
do not lend themselves to experimental manipulation, many of
them do lend themselves to carefully controlled, qualified
inquiry and observation of the kind ex post facto research is
capable of producing.
The findings from ex post facto investigations such as
those from the present research may be utilized to provide
information relevant to the consideration of many of the
social and educational problems which confront society today.
The findings of ex post facto research may also be utilized
to indicate areas whose investigation may possibly lead to
more productive and important findings or which variables
important to various social, psychological and educational
outcomes, lend themselves to experimental manipulation.
For example, the findings of the present research
suggest that the ethnocultural background of teachers may not
be an important variable related to student achievement. By
suggesting that teacher ethnocultural background may be of
relatively little importance in student academic performance,
this investigation implicitly suggests that variables such as
educational and school goals, school size, school leadership,
personnel characteristics, course work and classroom
characteristics—may be more productively investigated than
98

perception of student behavior in terms of teacher
expectations may, in part, account for a large proportion of
the differences in educational attainment for different
ethnic groups.
Educational theorists and researchers have generally
noted that the academic performance, achievement motivation,
and self-perceptions of Black and Hispanic students generally
rank below that of their White counterparts (Coleman, 1975;
Gerard & Miller, 1975; Weikert, 1984). Moreover, a number of
theorists and researchers have contended that the relatively
lower achievement and self-concept of Black and Hispanic
children may be, in part, due to lower expectations for high
performance and less positive attitudes toward these students
by their teachers (Banks & Grambs, 1972; Clark, 1964;
Lanier & Wittmer, 1977; Rist, 1970; Tucker, 1980).
Relative to their apparent influence on the academic
achievement and social adjustment of students, a
determination of the relationship between teacher attitudes
and teacher evaluations of their students is of critical
importance. In addition, the determination of the origins of
teachers' attitudinal orientations toward their students is
of major importance if such orientations are biased and
should be remediated.
Some of the primary sources of differing teacher
attitudes toward students include their students1
ethnocultural, linguistic, social background, and gender.
99

One additional source of differing teacher attitudes toward
students of varying ethnocultural backgrounds may be the
ethnocultural background of the teachers themselves.
A review of the literature corroborated the following
propositions: (1) teachers' different attitudes toward each
of their students affect the performance of those students;
(2) students' perceptions of themselves are related to their
teachers' perception of them; and (3) teachers' expectations
in regard to students' academic performance are related to
and reflective of their students' ethnocultural, linguistic,
and social status backgrounds.
A number of studies were reviewed which suggest that
differential teacher attitudes regarding students' academic
behavior may well be actualized in the students' academic
achievement and intellectual growth (Crano & Mellon, 1978;
Dusek & O'Connell, 1973; Palardy, 1968; Seaver, 1973;
Sutherland & Goldschmid, 1974). The findings of Crano and
Mellon (1978) further suggested that teachers' expectations
influence students' performance more than students'
performances influence teachers' expectations.
A representative study by Davidson and Lang (1965)
suggested that differential teacher attitudes may influence
students' self-concepts as well as their classroom
performance. That is, pupils self-perceptions to a
significant degree are formed through interaction with their
teachers.
100

Finally, studies were reviewed which substantiated the
following contentions: (1) Disadvantaged, racial minority,
and lower class children are perceived differently by their
teachers, in contrast to their advantaged, racial majority,
and middle class counterparts (Jackson & Cosca, 1974;
(2) Student speech patterns may be associated by their
teachers with stereotypical attitudes regarding the personal
traits and abilities of the speakers. Nonstandard speakers
are consistently rated low in education, intelligence,
socioeconomic status, and speaking ability (Cohen &
Kimmerling, 1971; Gilberts, Guckin, & Leeds, 1972; Rosenfeld,
1973; Williams et al., 1971); (3) Teachers; ethnicity or
ethnocultural attributes may predispose them to behave
differentially toward their students. That is, teachers1
evaluative behavior toward the academic performance of their
students may be prejudiciously influenced by the teachers'
ethnocultural background (Gottlieb, 1964; Scott & Ntegeye,
1978; Washington, 1980; 1982).
Findings by Washington (1980; 1982) suggest that when
specific characterizations or evaluations of Black and White
students are noted, particularly those which are relevant to
academic performance, ethnocultural and perhaps ethnocentric
differences between Black and White teachers may exist.
Washington's (1980; 1982) findings along with those of
Gottlieb (1964), and Scott and Ntegeye (1978) generally
suggested that Black teachers more favorably regarded Black
101

students than White students and White teachers more
favorably regarded Black students than White students and
White teachers more favorably regarded White students than
Black students. Overall, the review studies just cited seem
to suggest that some of the non-objective attitudes held by
teachers may be ethnoculturally and ethnocentrically based.
In summary, the review of the literature indicated that
two major problems exist in the study of the relationship
between teachers' ethnocultural background and their
perception and evaluation of students. These problems
include: (1) the fact that few, if any, studies have
determined the relationship between ethnoculturally related
teacher attitudes toward their students and their actual
academic and social evaluation of their students, and (2) the
fact that few, if any, studies have determined the
relationship between teachers' ethnocultural background and
their students' academic and social performance.
The purpose of the present study was to above problems
(the first one indirectly) through an examination of
teachers' actual evaluation of their students' academic and
social performance as related to the ethnocultural
backgrounds of both the teachers and the students. More
specifically, this study was designed to determine if Black,
Hispanic, and White elementary school teachers, evaluate
their students' academic and social performance in ways
related to their ethnocultural backgrounds as well as those
102

their students.
Assuming, as was suggested by the last section of the
review of the literature, that teachers' attitudes toward
their students tend to be ethnoculturally and possibly
ethnocentrically related it was hypothesized that:
1. In their ratings of their students' academic and
social performance, Black, Hispanic, and White
teachers as a whole, would rate the academic and
social performance of White students more favorably
than Black and Hispanic students, respectively.
Social performance includes personal and social
conduct, work habits, homework, and health habits.
2. a. Black teachers would rate the academic and
academically related social performance of Black
students significantly higher than would White and
Hispanic teachers.
b. Black teachers would rate the academic and
social performance of Black students significantly
higher than that of White and Hispanic students,
producing a relative ranking of Black, White, and
Hispanic students.
3. a. Hispanic teachers would rate the academic and
social performance of Hispanic students
significantly higher than would Black and White
teachers.
b, Hispanic teachers would rate the academic and
103

social performance of Hispanic students
significantly higher than tnat of White and Black
students, producing a relative ranking of Hispanic,
White, and Black students.
4. a. White teachers would rate the academic and
social performance of White students significantly
higher than would Black and Hispanic teachers,
b. White teachers would rate the academic and
social performance of White students significantly
higher than that of Black and Hispanic students,
producing a relative ranking of White, Black, and
Hispanic students.
METHOD
The subjects of this investigation were 45 Black,
Hispanic, and White elementary school teachers and 405 of
their Black, Hispanic, and White students who teach in and
attend schools located in New York City. The 45 teachers
included 15 subjects from each ethnocultural group. The 405
students (nine subjects per teacher) included three from each
ethnocultural group of students per teacher.
Data relevant to this investigation, which included the
students' average grade in all courses, reading and math
achievement test scores, were collected from the "Report To
Parents" or the "Student Progress Report", commonly referred
to as a "report card."
104

The teachers were instructed to select randomly the
report cards of three students from each students ethnic
group. The teachers supplied the requisite number of report
cards to the investigator who recorded the relevant data.
The cards were then returned to the teachers.
RESULTS
Hypothesis 1 proposed that in their ratings of their
students' academic and social performance, teachers as a
whole, would rate the performance of White students more
favorably than Black and Hispanic students, respectively.
Hypotheses 2a, 3a, and 4a (herein referred to as the first
predictions of Hypotheses 2, 3, and 4) collectively
maintained that each teacher group would rate the performance
of the student group which belongs to its own ethnic group,
more favorably than the other teacher groups.
Statistically analysis demonstrated no statistically
significant differences between the means achieved by the
three student groups across all four factor variables. Thus,
the first hypothesis was not supported by the results of the
present investigation. Hypotheses 2a, 3a, and 4a also were
not supported by the statistically analyses of this
investigation.
Hypotheses 2b, 3b, and 4b (herein referred to as the
second predictions of Hypotheses 2, 3, and 4) collectively
maintained that each teacher group would rate the performance
105

of the student group which belonged to its own ethnic group
more favorably than the other two student groups. None of
these hypotheses were supported by statistical analyses.
A supplementary analysis utilizing the Schefee procedure
was executed to test all the differences between the mean
ratings of overall student performance demonstrated by each
the three teachers groups. Results of the procedure
indicated that relative to the evaluation of the academic
performance of the students as a whole only the Hispanic
teachers as a group rated its students statistically
significantly different from the other teacher groups. No
statistically significant differences between the mean social
ratings given by the three teacher groups were reveled.
DISCUSSION
This study was designed to determine if the average
academic and social performance ratings attained by Black
Hispanic, and White students were related to their teachers'
ethnocultural backgrounds. Four hypothesized relationships
between the teachers' ethnicity and that of their students
were proposed as enumerated above.
Statistical analysis of the relevant data failed to
support the predictions of the four hypotheses. The lack of
statistical support for the predictions of the four
hypotheses suggests that, in general, there may exist little
or no significant relationship between teachers1 ethnicity
106

and a tendency to rate their students* performance
ethnocentrically.
The most parsimonious explanation of these results
appears to be that the teachers as a whole were not
significantly racially or ethnically prejudiced toward either
of the three student groups and, therefore, did not evaluate
their performance in ethnically biased ways. That is, the
overall results suggest that the three student groups
performed essentially equally well or poorly and that their
performance was unbiasedly evaluated by the teachers as a
whole. It was noted that the student groups did not differ
significantly from one another on the basis of objective test
scores. Furthermore, the overall grade-point averages of the
student groups were not significantly different. Finally,
the schools utilized in this investigation fully engaged in
the practice of "ability grouping" or "tracking", wherein,
students are subdivided into high, average, and low achieving
classes according to academic achievement test score averages
and previous achievement. In light of these facts,
relatively unbiased evaluators, e.g. the teachers, would be
expected to grade the students' performance on the whole with
a degree of equality.
No measurement of the teachers' racial attitudes was
taken in this investigation. Therefore, the teachers'
assessed attitudes were unknown. Consequently, other
possible explanations for the results were proposed.
107

Other plausible reasons for the lack of statistical
support for the hypotheses included the possibility, (1) that
the teachers' evaluations of their students; including those
belonging to their own ethnic group, were influenced by the
knowledge that the students had been grouped according to
their tested abilities and prior academic achievement and the
implicit expectation that they would perform at about the
same level; (2) that teachers may have chosen to ignore
personal and ethnocentric biases and therefore objectively
evaluated the performance of the student groups; (3) that the
New York City Board of Education, through its teacher
selection and preparatory procedures, or through its teacher
selection and preparatory procedures, or through
attributions, may have "weeded out" teachers who held
conspicuously active ethnocentric attitudes or who were not
sufficiently acculturated; and (4) that the evaluative
categories utilized in the report cards may have been only
sensitive to the more gross of student performance
differences.
The findings of this investigation would seem to
corroborate reasonably the argument that factors other than
teachers' or students* ethnicity may significantly influence
teachers' ratings of students' performance under actual
pedagogical conditions, e.g., the students' socioeconomic and
family backgrounds. Thus, while teachers* prejudicial
attitudes may exist and influence their behavior under
108

various circumstances certain situational or other
expectational factors may intervene to accentuate, attenuate,
neutralize or reverse the implied behavioral output of those
attitudes. In sum, the relationship between attitudes and
behavior may not be as simple and direct as might be assumed.
Possible intervening variables and other confounding factors
should be given careful consideration before research
concerning the relationship between attitudes and behavior is
undertaken.
The limitations of this investigation included (1) its
inability to have selected heterogeneous student samples
which might have controlled for the teachers' expectations
based on ability grouping; (2) its inability to administer
appropriate attitude scales, tests, or interviews to
determine relevant teacher attitudes toward their students;
and (3) its inability to utilize more sensitive and finely
tuned evaluative categories.
In general, the main limitation of this study was that
it was ex post facto research, that is, there was no direct
control of independent variables because their effects had
already occurred or because they were inherently not subject
to systematic manipulation.
Despite the weaknesses of ex post facto research of the
kind utilized in this study, its findings may often prove to
be of significant importance in psychological research. For
example, the findings of the present research suggest that
109

the ethnocultural background of teachers may not be an
important variable related to student achievement; that
variables such as pedagogical approaches, school
organization, curricula, leadership, funding, and the like,
may be more productively investigated and subject to remedial
change than teacher cultural background and attitudes.
110

^
REFERENCES
Allport, G. W. (1935). Attitudes. In C. Murchison (Ed.), Handbook of Social Psychology, Worcester, Mass.: Clark University Press.
Ajzen, I., & Fishbein, M. (1979). Attitude-behavior relations: A theoretical analysis and review of empirical research. Psychological Bulletin. 84. 888-918.
Ajzen, I., & Fishbein, M. (1982). Understanding Attitudes and Predicting Behavior. Englewood Cliffs, N. J. : Prentice-Hall.
Anisfeld, M. , Bogo, N., & Lambert, W. (1962). Evaluational reactions to accented English. Journal of Abnormal and Social Psychology. 65, 223-231.
Atkinson, R. , Atkinson, R., Smith, E. , and Hilgard, E. (1987). Introduction to Psychology. Ninth Edition. New York: Harcourt Brace & Vanovich.
Ausubel, D., (1958). Perceived parent attitudes as determinants of children's ego structure. Child Development. 25. 173-83.
Banks, J. & Grambs, J. (Editors) (1972). Black Self-concept: Implications for Education and Social Science. New York: McGraw-Hill.
Brookover, W., & Erikson, E. (1967). Self-concept of ability and school achievement. Ill: Relationship of self-concept to achievement in high school. U. S. Office of Education, Cooperative Research Project No. 2831. East Lansing; Michigan State University.
Brookover, W. , & Erikson, E. (1969). Society. Schools, and Learning. Boston: Allyn & Bacon.
Brophy, J., & Good, T. (1970). Teachers' Communication of Differential Expectations for Children's Classroom Performance: Some Behavioral Data. Journal of Educational Psychology, 6.1,, 3 65•-37'I.
Brophy, J. & Good, T. (1974). Teacher Student Relationships: Causes and Consequences. N. Y. Holt, Rinehart & Winston.
Buck, J. (1968). The effects of Negro and White dialectal variations upon attitudes of college students. Speech Monographs, 25, 181-186.
Campbell, D. (1963). From Description to Experimentation:
111
Interpreting Trends as Quasi-experiments. In C. W. Harris (Ed.), Problems in Measuring Change. Madison: University of Wisconsin Press.
Clark, K. (1964) . Clash of cultures in the classroom. In M. Weinberg (Ed.), Learning Together. Chicago: Integrated Education Associates.
Cohen, K., & Kimmerling, F. (1971). Attitudes based on English dialect differences: An analysis of current research. Cambridge, Mass.: Language, Research Foundation, (ED 056579).
Coleman, J. (1966). Equality of educational opportunity. Washington, D. C.: Government Printing Office.
Crano, W. & Mellon, P. (1978). Causal influence of teachers' expectations on children's academic performance: A cross-lagged panel analysis. Journal of Educational Psychology. 70, 39-49.
Davidson, H. , & Lang, G. (1965). Children's perceptions of their teachers' feelings toward related to self-perception, school achievement, and behavior. In D. E. Hamacheck (Ed.), The self in growth, teaching, and learning. Englewood Cliffs: Prentice-Hall, Inc., 424-439.
Dusek, J., & O'Connell, E. (1973). Teacher expectancy effects on the achievement test performance of elementary school children. Journal of Educational Psychology, 65, 371-377.
Gerard, H., & Miller, N. (1975). School Desegregation: A Long Term Study. New York: Plenum Press.
Gifford, B. (1986) . Excellence and equity in teacher competency testing: A policy perspective. The Journal of Negro Education, 55(5): 251-271.
Gilberts, R. , Guckin, J., & Leeds, D. (1972). Teacher perception of race, socioeconomic status, and language characteristics. Whitewater, Wise: School of Education, Wisconsin State University (ED 052131).
Glidev/ell, J., Kantor, H. , Smith, L. , £ Stringer, L. (1973). Socialization and social structure in the classroom. In L. Hoffman & M. Hoffman, (Eds.), Review of Child Development Research (Vol. 2). N. Y.: Harper & Row.
Good, T. (1970). Which pupils do teachers call on? Elementary School Journal, 70, 190-198.
Good, T., & Brophy, J. (1973). Teacher's expectations as self-
112

fulfilling prophecies. In T. Good & J. E. Brophy (Eds.)/ Looking In Classrooms, New York: Harper & Row.
Good, T. , Brophy, J., & Mendosa, S. (1970). Who talks in the classroom. Austin, University of Texas, Research and Development Center for Teacher Education.
Gottlieb, D. (1964). Teaching and students: The views of Negro and White Teachers. Sociology and Education. 27, 345-353.
Haber, A., & Runyon, R. (1983). Fundamentals of Psychology. Reading, Mass: Addison-Wesley.
Harms, L. (1961). Listener's judgments of status cues in speech. Quarterly Journal of Speech, 47. 161-168.
Jackson, G., & Cosca, C. (1974). The inequality of educational opportunity in the southwest: An observational study of ethnically mixed classrooms. American Education Research Journal. 11. No. 3., 219-229.
Jensen, M., & Rosenfeld, L. (1974). Influence of Mode of Presentation, Ethnicity and Social Class on Teachers' Evaluations of Students. Journal of Educational Psychology, 66. 540-547.
Jourard, S., & Remy, R. (1955). Perceived parental attitudes, the self, and security. Journal of Consulting Psychology. 19. 364-66.
Kaufman, H. (1973). Social Psychologv: The Study of Human Interaction. New York: Holt, Rinehart and Winston.
Karlins M. Coffman, T., & Walters, G. (1969). On the fading of social stereotype: Studies in three generations of college students. Journal of Personality and Social Psychologv. 31. 1-16.
Kerlinger, F. (1973). Foundations of Behavioral Research. 2nd ed. New York: Holt, Rhinehart and Winston.
Lanier, J., & Wittmer, J. (1977). Teacher prejudice in referral of students to EMR programs. School Counselor, 24, 165-170
Marwit, K., & Marwit, S., & Walker, E. (1978). Effects of student race and physical attractiveness of teachers* judgments of transgressions. Journal of Educational Psychology. 70, 911-915.
Moe, J. (1972). Listener judgments of status cues in speech: A replication and extension. Speech Monographs. 39. 144-147.
113

Morse, W. (1964). Self concept data. National Association of Secondary Principals Bulletinf 48, 23-27.
Naremore, R. (1971). Teacher's judgments of children's speech: A factor analytic study of attitudes. Speech Monographs. 38, 17-27.
National Coalition of Advocates for Students. (1985). Barriers to Excellence: Our Children at Risk. Boston, Mass.: National Coalition of Advocates for Students.
National Urban League. (1984). The State of Black America. New York: National Urban League, Inc.
New York City Board of Education. Office of Educational Statistics. (1988). Reading and Mathematics Test Scores, District by District. New York: New York City Board of Education.
New York City Board of Education. Office of Educational Statistics. (1989). Race in New York City's Schools, District by District. N. Y. : New York City Board of Education.
Palardy, J. (1968). What teachers believe—what children achieve. Elementary School Journal, 69. 370-374.
Palardy, J. (1969). For Johnny's reading sake. The Reading Teacher, 8, 720-724.
Pelz, D., & Andrews, F. (1964). Detecting causal priorities in panel study data. American Sociological Review. 29, 836-848.
Perkins, H. (1958). Factors influencing change in children's self-concepts. Child Development. 19. 203-220.
Phillips, B. (1965). Sex, social class and anxiety as sources of variation in school achievement. Journal of Educational Psychology. 56. 316-322.
Rist, R. (1970). Student social class and teacher expectations: The self-fulfilling prophecy in ghetto education. Harvard Education Review, 40, 411-451.
Rosenfeld, L. (1973). An investigation of teachers" stereotyping behavior: The influence of presentation, ethnicity, and social class on teachers evaluations of students. Albuquerque, (ED 090172).
Rosenshine, B. (1971). Teaching behavior related pupil achievement: Review of research. In I. Westbury, & A. Bellack (Eds), Research into classroom processes: Recent
114

developments and next steps. N. Y. : Teachers1 College Press, 51-98.
Rothbart, M. , Dalfen, S., & Barrett, R. (1971). Effects of teacher's expectancy on student-teacher interaction. Journal of Educational Psychology. 1971, 62, 49-54.
Rowe, M. (1974). Wait-time and rewards as instructional variables, their influence on language logic and fate control: Part one-wait time. Journal of Research in Science Teaching. 11, 81-94.
Royer, J. & Feldman, S. (1984). Educational Psychology: Applications and Theory. New York: A. Knopf.
Rubovitz, R., & Maehr, M. (1973). Pygmalion black and white. Journal of Personality and Social Psychology. 25. 210-218.
Scott, M. (1976). The effects of teacher perception of personality factors on the cognitive and affective learning of black students. Journal of Negro Education. 45.
Scott, M., & Ntegeye, M. (1980). Acceptance of minority student personality characteristics by black and white teachers. Integrated Education. 18, 110-112.
Seaver, B. (1973). Effect of naturally induced teacher expectancies. Journal of Personality and Social Psychology. 28. 333-342.
Shore, A. (1973). The pygmalion effect lives. Psychology Today, September, 7, 56-60.
Slobetz, F., & Lund, A. (1956). Some effects of a personal development program at the fifth grade level. Journal of Educational Research. 49. 373-378.
Staines, J. (1958) . The self-picture as a factor in the classroom. British Journal of Education. 28, 97-111.
Stern, C , & Keislar, E. (1977). Teacher attitudes of attitude change: A Research Review. Journal of Research and Development in Education. 10. 63-76.
Sutherland, A., &. Goldschmid, M. (1974). Negative teacher expectation and I. Q. change in children with superior intellectual potential. Child Development, 45, 852-856.
Tucker, J. (1980). Ethnic proportions in classes for the learning disabled: Issues in nonbiased assessment. The Journal of Special Education. 14. 93-105.
Warner, L. & DeFleur, M. (1969). Attitude as an interactional concept: Social constraint and social distance as
115

intervening variables between attitudes and action. American Sociological Review. 34, 153-169.
Washburne, C. , & Weil, L. (1960). What characteristics of teachers affect children's growth? The School Review. 68. 420-428.
Washington, V. (1979). The role of teacher behavior in school desegregation. Educational Horizons. Spring, 145-151.
Washington, V. (1980). Teachers in integrated classrooms: Profiles of attitudes, perceptions, and behavior. The Elementary School Journal. 80. 192-201.
Washington, V. (1982). Racial differences in teacher perceptions of first and fourth grade pupils on selected characteristics. The Journal of Negro Education, 51. 60-72.
Watson, G., & Johnson, D. (1972). Social Psychology: Issues and Insights. New York: J. B. Lippincott.
Wattenberg, W., & Clifford, C. (1962). Relationship of the self-concept to beginning achievement in reading, (Cooperative Research Project No. 377), Washington, D. C.: U. S. Office of Education.
Weikart, D. (1984). Changed Lives. Ypsilanti, Mich.: High/Scope Press.
Weitz, S. (1972). Attitude, voice, and behavior: A repressed affect model of interracial interaction. Journal of Personality and Social Psychology. 24., 14-21.
Whitehead, J., & Miller, L. (1972). Correspondence between evaluations of children's speech and speech anticipated upon the basis of stereotype. Southern Speech Communication Journal, 27, 375, 386.
Wicker, A. (1969). Attitudes versus actions: The relationship of verbal and overt behavioral responses to attitude objects. Journal of Social Issuer 25(4), 41-78.
Williams, F. , Whitehead, J., & Miller, L. (1971). Attitudinal correlates of children's speech characteristics, Austin; Center for Communication Research, University of Tessas (ED 052213).
116

APPENDIX A
REPORT TO PARENTS FORM
(
111

Name Pupil Pupil ID *
Ratings Used | Working Periods
I - Ucellenr N Needs improvement 1 ]
S Soi>sfOitOry 11 UniCJl'SfoClOfv
COMMUNICATION ARTS 1
'Bentl.'ig ipvrj
f | s | N | U
2 1 "Sfodrg lewri
. | S | N | . , |
3 " •Reading le*fl
( | -, 1 N I U
Reoding _ . , _ . I 1 1 1
fTrp'iyi s'omJn'd IngLsh
Written language
uses I C ' P C sen»e' ce s'ruf *u'e
isfs cwiec sped -.g
yVi.tes legDi/
Mil
MM
SCOW) tANGUAGf <-
Speaks with octirocy ar.1 c'ar »>
ReaJs wih understanding {Grades 3 6i
Wnips correctly (.Grades 3 M
MATHEMATICS
-x-uws nLmber tocts
Uses rampuroi'cn
Shows knowledge of other mathematical concepts
Applies skills m pfohobili'y nnd sto'is'-cs
De-nnrMrates problem solving skills
I
•Mclh Ifvpl
! « S S N | „
MM
*Maih lew - | •M.iit- h VP'
f J s | N l u l l s • • -
SOOAI STUDIES
i' «1r'\t-y.(J\ ,)"'' »V'p»e»s n)vir ••at'O"
IS Q*.l'p . I ( U f ' f " t f . f l ' S
L'-<1»f \lQnfl\ mop o"d globe Skills
learns t-se ol reference mo'i'ftQl
SCIENCE
Knows science facts and concepts
Understands or.d uses scientific method
T T ma
rm •p^nrt.na nml Mnth^mnt
Report to Parens Grades 2-6
Po't-opaies m classroom & school music oc'-wities
PortifipOies m classroom J school art activities
HEAITH EDUCATION
iinders'onds basic r-ec 'h eonrepn
PHYSICAL EDUCATION
Paf't raies -n ac'.v i.cs
P f f 'rms requ"ed skills
OTHER SUBJECTS
WORK HABITS l i 'lows O.rei ' cr*,
C.Ol~r|eV> work on lirre
$ho*<. f i ot.we
lAinl nca'iy
lukrs cnrp ut books and ma'enais
HOMEWORK
PERSONAL AND SOCIAL DEVELOPMENT
Opts along wril with o'hers
Shows respect
Comes out responsibilities
Obeys rules and regulations
Sfwws sell contial
Marking Periods
1
jJLLl'- A)
2
E | S I N | u
M M l
3 "
s | S | N | U
1 1 1
t n
SPECIAL HEALTH NEEDS i>.«>n hearing demoi n„i.
n
ffi
ZXJ_J_£ L±Lzt
n r_r̂ ^ , t trxn EEETn M M a •
c
in -
M l l h l l
DAYS ABSENT
DAYS LATE
I s

APPENDIX B
CONSENT LETTER
(
118

Now York City 110 Livingston Street Board of Education Brooklyn, New York 11201
Nathan Qulnonea Oflico oi Educational Acsocsmont Chancellor Richard Guttenberg
Director Louise Latty (718) 595-4045 Chief Executive for Instruction
January 28, 1986
Mr. Amos Wilson 1780 Davidson Avenue, #65 Bronx, New York 10453
Dear Mr. Wilson:
I am happy to inform you that your study on children's academic performance and social adjustment as related to teachers' ethnocultural background has been approved by the Office of Educational Assessment with the following conditions.
1. Approval by this office does not guarantee access to any particular school or child. It is your responsibility to make appropriate contacts and get the required permissions and consents before initiating the study. Participation in your research must, of course, be strictly voluntary. The following written consents are required.
a. Principals who agree to participate must sign the enclosed Research Application Form. In some districts, the superintendent must also sign. You should check with each principal to determine if the superintendent's signature is also required in that district. The signed form(s) should be returned to this office.
b. Before involving any child in your study or collecting student data, you must obtain written parental consent.
c. In addition to the above written consents, all participants (e.g., teachers, guidance counselors, children) must be informed that they are not required to participate in the study, and that there are no consequences for non-participation.
2. Your report of the study should not include the identification of any school, student, or staff member. The first procedure for protecting confidentiality that you described in your letter of January 15, 1986 is preferred by the Proposal Review Committee. A coding system should be used if necessary.
3. Please send a copy of your final report to this office; we are most interested in the results of your research„
Sincerely,
V^A^^MUXJ^^ RG:mo RICWRD GUTTENBERG Enclosure Director , O.E.A.
EVALUATION O R&D © TESTING O DATA ANALYSIS

APPENDIX C
RESEARCH APPLICATION FORM
/
119

NEW YORK CITY BOARD OF EDUCATION OFFICE OF EDUCATIONAL ASSESSMENT
RESEARCH APPLICATION FORM
To the Principal :
The researcher ident i f ied below has obtained preliminary clearance to conduct research in the New York City public schools, and is now seeking principals and community superintendents w i l l i ng to cooperate' in a research study. However, before beginning the study, the researcher must present you with a signed l e t t e r of aporovl f^c-i the * Director, Office of Educational Assessment. I i r e t j r n , the researcher must submit th is form to 3.E.A. with the signatures of cooperating pr inc ipa ls . * Please si/jn below i ' yju agree to have your school part ic ipate in this study.
Nana of Researcher
Mailing Address
Telephone
University or Professional Affiliation
Graduate Student Professor Other
If investigator is a candidate for a degree, which degree?
Department
T i t l e of Study
List tes ts , questionnaires, interview schedules and other evaluation instruments to be used. COPIES OF THESE INSTRUMENTS, A BRIEF DESCRIPTION OF THIS PROJECT AND A STEP-BY-STEP OUTLINE OF THE PROJECT MUST 3E ATTACHED TO THIS APPLICATION WHEN IT IS PRESENTED TO oRINCIPALS AND COMMUNITY SUPERINTENDENTS.
Estimated duration of study:
Cooperating School
1.
2.
3.
4.
5.
D is t r i c t Research w i l l involve:
Grade(s) # of
Classes # of
Pupils # of Staff Members
Signature of Principal
- Scne j ' r . " C . i i i ; o i-equi' -• tin." •ii^rmt ,.-•- j t inc d i s t r i c t sjp'.- ' ^ c •:'•">"''. *i > ns form, jnqu i r j in each d i s t r i c t included in your study, and, i f nucoi j i ' -y, ha/a the superintendent(s) sign here:
Superintendent's signature
Superintendent's signature
D is t r i c t
D is t r i c t
Superintendent's signature D is t r i c t

i
APPENDIX D
EIGENVALUES OF CORRELATION MATRIX
120

VARIABLE E I G E N V A L U E
MUSIC V23 Participates in classroom
& school music activities 0.31 ART V24 Participates in classroom
& school art activities HEALTH V25 Understands basic health concepts PHYSICAL EDUCATION V26 Participates in activities V27 Performs required skills WORK HABITS V28 Follows directions V29 Completes work on time V30 Shows initiative V31 Works neatly V32 Takes care of books & materials V33 Homework PERSONAL & SOCIAL DEVELOPMENT V34 Gets along well with others V35 Shows respect V36 Carries out responsibilities V37 Obeys rules & regulations V38 Shows self-control
0.
0.
0. 0.
0. 0. 0. 0. 0. 0.
0. 0. 0. 0. 0.
.29
.28
.27 ,26
.24 ,22 ,20 ,20 ,18 ,17
,16 ,16 ,13 ,13 ,11
Note. N = 135.

APPENDIX E
RESULTS OF MULTIPLE REGRESSION ANALYSIS
121

Results of Multiple Regression Analysis with Combined and
Separate Reading and Math Scores as Predictor Covariates and
The Four Variables as Criterion Variables
Predictor Variables
Linguistics Math/Sciences Adjustment Participation
R Squared
.0109
.0008
.0365
.1120
R
.1048
.0276
.1911
.3347
df
2,120 2,120 2,120 2,120
MS
18.54 .79
84.21 15.95
F
.67
.05 2.27 7.57*
Reading Scores
Linguistics Math/Sciences Adjustment Participation
.0071
.0000
.0325
.1190
.1840
.0035
.1804
.3449
2,125 2,125 2,125 2,125
24.19 .00
152.22 37.14
.35
.10*
.04**
.00***
Math Scores
Linguistics Math/Sciences Adjustment Participation
.0064
.0006
.0002
.0243
.0803
.0248
.0449
.1558
1,121 1,121 1,121 1,121
21.77 1.27 9.30 6.91
.37
.19
.62
.09
Note. *P<.05. **P<.001.

Amos N. Wilson
B.A., Morehouse College, 1963 M.A., Fordham University, 1986
A COMPARISON OF THE RATINGS OF BLACK, HISPANIC, AND WHITE
CHILDRENS' ACADEMIC PERFORMANCE AND SOCIAL ADJUSTMENT AS
RELATED TO TEACHERS' ETHNOCULTURAL BACKGROUND
Dissertation directed by Professor's Kurt Geisinger, Ph.D.
While the research literature consistently and clearly
delineates several student characteristics which may serve as
stimuli that evoke non-objective teacher attitudinal
orientations, it has to a substantial extent not attempted to
delineate the origins of such tendencies relative to the
personality and other characteristics of teachers themselves.
Studies were reviewed which seem to suggest that some of the
non-objective attitudes held by teachers may be ethnoculturally
and ethnocentrically based. That is, teachers' ethnocultural
background experiences tend to influence their perceptions and
evaluations of their students. A search of the relevant
literature failed to locate any literature which have
investigated the relationship between teachers' ethnocultural
background and their actual evaluation of their students'
academic and social performance, particularly when those students
belong to different ethnic groups.
This study was designed to determine if teachers,
specifically, Black, Hispanic, and White elementary teachers,
evaluate their students' academic and social performance in ways
related to their ethnocultural backgrounds as well as those of
their students. The subjects of this investigation were Black,
Hispanic, and White elementary school teachers and 405 of their
Black, Hispanic, and White students who taught and attended
school in New York City. The total teacher sample consisted of
45 persons. The teachers' academic ratings of the students and
the students' achievement test scores were taken from student
report cards. Univariate and multivariate analyses of the
collected data did not support the general hypotheses that the
academic performance of White students would be rated
significantly higher by the teachers as a whole than would Black
and Hispanic students; that each teacher group would rate the
performance of the student group which belonged to its own
ethnic group, more favorably than the other teacher groups.
The most parsimonious explanation of these results appears
to be that the teachers were not significantly racially
prejudiced toward either of the three student groups given the
ethnically unbiased ways they evaluated their students'
performance. Other plausible reasons for the lack of statistical
support for the hypotheses were also considered. The findings of
this investigation seem to suggest that factors other than
teachers' or students' ethnicity may significantly influence
teachers' ratings of students' performance under actual
pedagogical conditions. in general, there may e:cic;b little or no
significant relationship between teachers' ethnicity and a
tendency to rate their students' performance ethnocentrically.
2

Thus, the ethnocultural background of teachers may not be an
important variable related to student achievement.
3

VITA
Amos Nelson Wilson, son of Lugenia and Oscar Wilson, was
born on February 23, 1941, in Hattiesburg, Mississippi. He
attended Rowan High School in Hattiesburg, and was graduated in
May, 1959.
He entered Morehouse College in September, 1959 and
received the Bachelor of Arts degree in June, 1963.
He entered The New School for Social Research in September,
1968 and received the Master of Arts degree in June, 1971.
From September, 1971 to August, 1976 and September, 1981 to
August, 1986, he was Assistant Professor of Psychology at the
City University of New York. He served as Adjunct Professor of
Psychology at the New York Institute of Technology and The School
of New Resources, The College of New Rochelle (where he is
presently employed). He is author of the book, THE DEVELOPMENTAL
PSYCHOLOGY OF THE BLACK CHILD.
In September, 1976 he was accepted as a graduate student in
the Graduate School of Arts of Sciences of Fordham University,
where he majored in General Theoretical Psychology under the
mentorship of Professor Kurt Geisinger.